Wikipedia edits (ay)
This is the bipartite edit network of the Aymara Wikipedia. It contains users
and pages from the Aymara Wikipedia, connected by edit events. Each edge
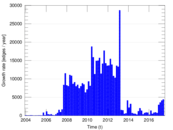
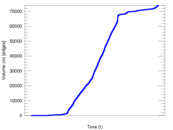
represents an edit. The dataset includes the timestamp of each edit.
Metadata
Statistics
| Size | n = | 8,649
|
| Left size | n1 = | 1,231
|
| Right size | n2 = | 7,418
|
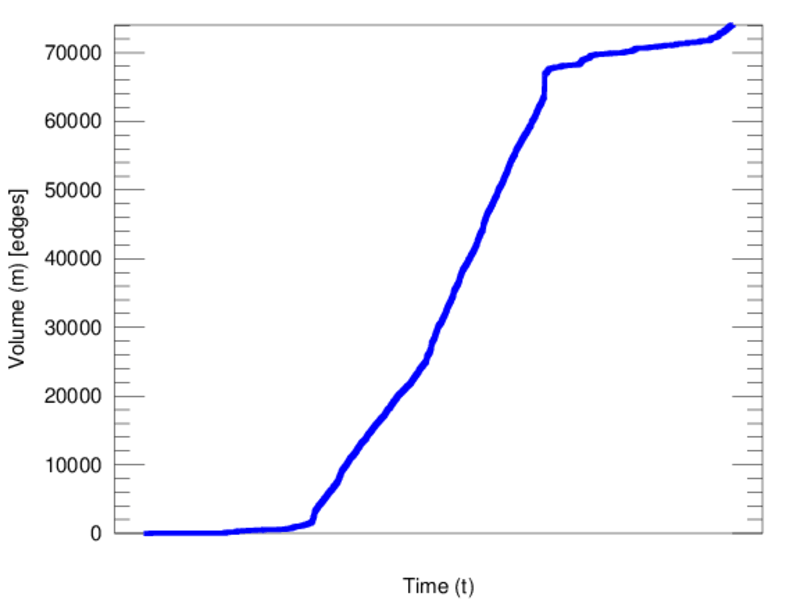
| Volume | m = | 74,029
|
| Unique edge count | m̿ = | 37,546
|
| Wedge count | s = | 18,243,853
|
| Claw count | z = | 12,415,042,713
|
| Cross count | x = | 8,979,327,668,200
|
| Square count | q = | 35,683,887
|
| 4-Tour count | T4 = | 358,532,868
|
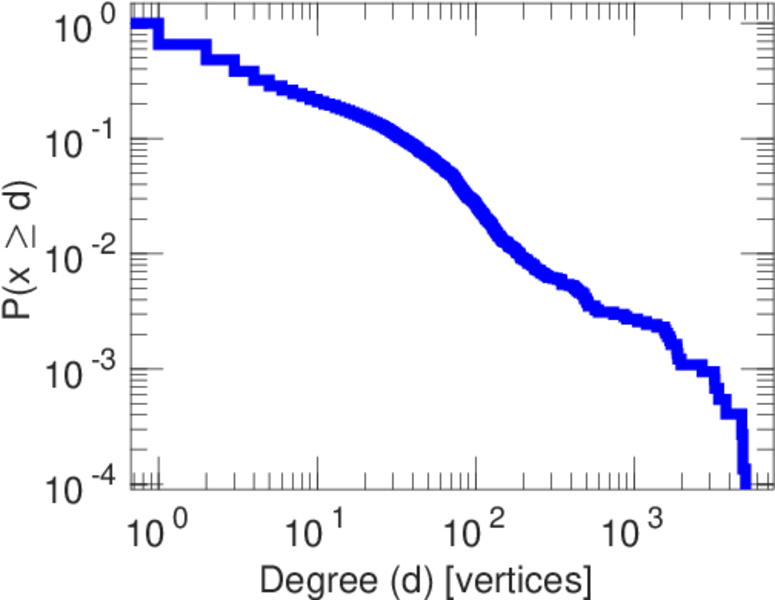
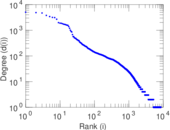
| Maximum degree | dmax = | 5,036
|
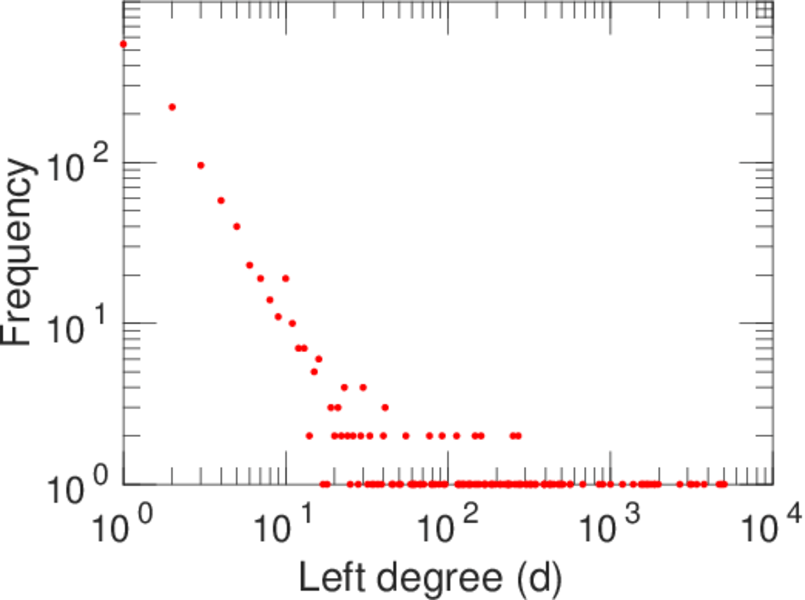
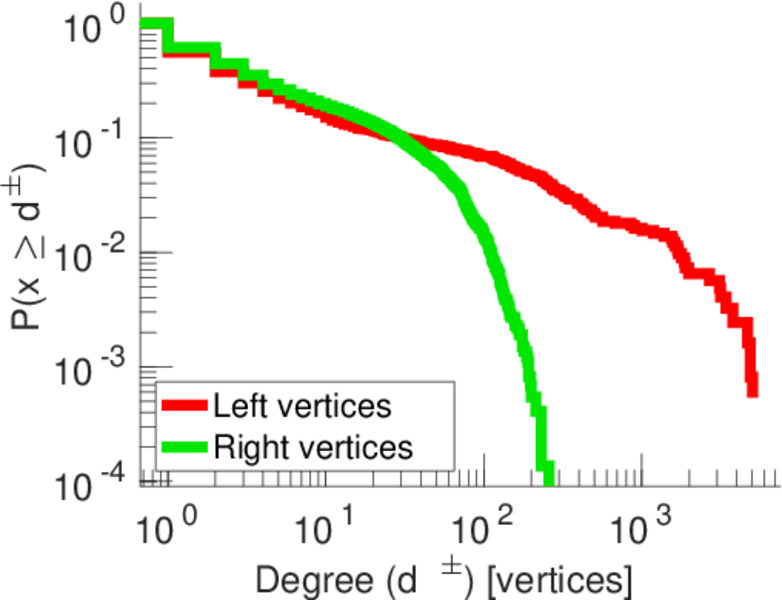
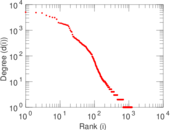
| Maximum left degree | d1max = | 5,036
|
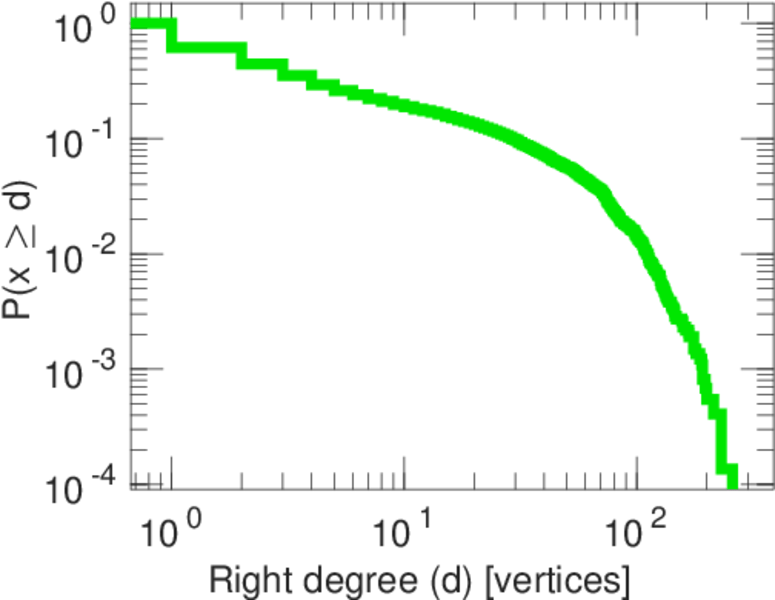
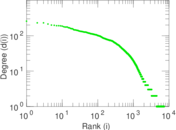
| Maximum right degree | d2max = | 258
|
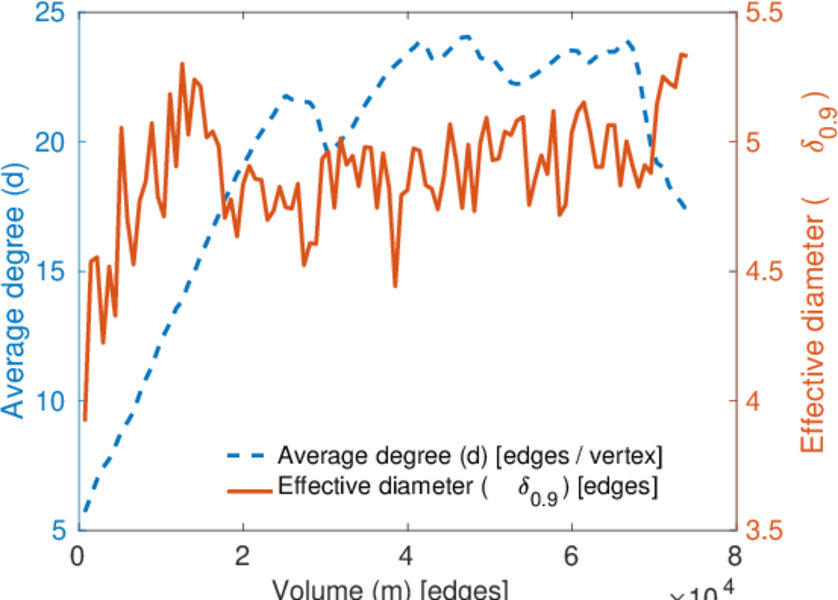
| Average degree | d = | 17.118 5
|
| Average left degree | d1 = | 60.137 3
|
| Average right degree | d2 = | 9.979 64
|
| Fill | p = | 0.004 111 68
|
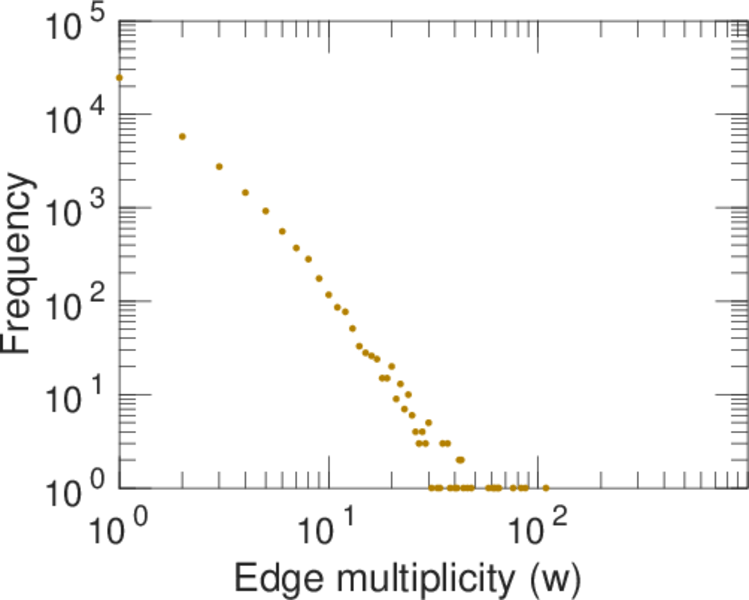
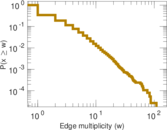
| Average edge multiplicity | m̃ = | 1.971 69
|
| Size of LCC | N = | 7,757
|
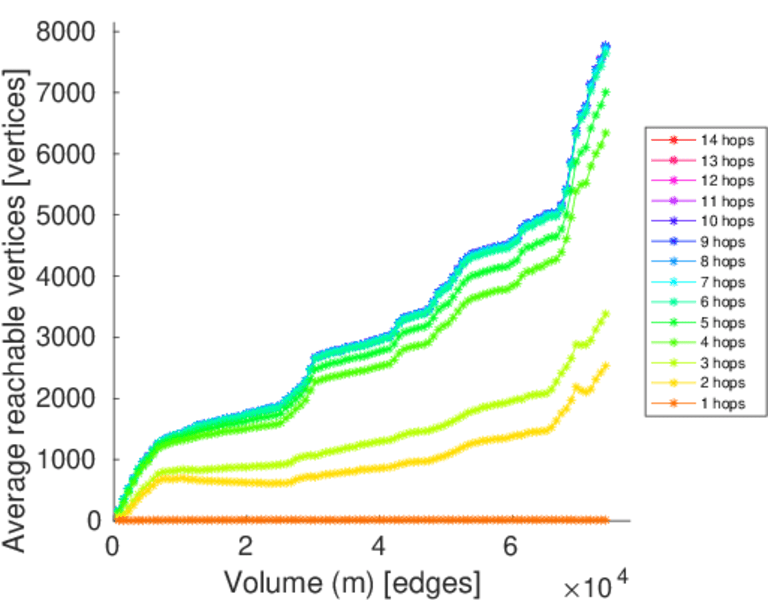
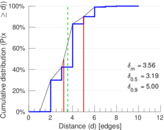
| Diameter | δ = | 13
|
| 50-Percentile effective diameter | δ0.5 = | 3.189 15
|
| 90-Percentile effective diameter | δ0.9 = | 5.002 18
|
| Median distance | δM = | 4
|
| Mean distance | δm = | 3.558 69
|
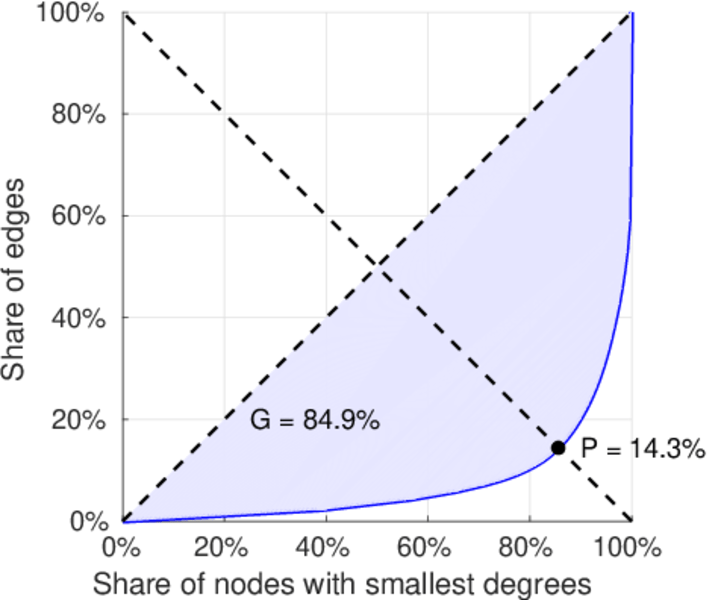
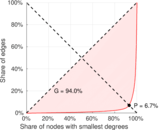
| Gini coefficient | G = | 0.848 837
|
| Balanced inequality ratio | P = | 0.143 140
|
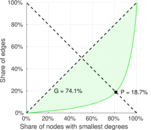
| Left balanced inequality ratio | P1 = | 0.066 690 1
|
| Right balanced inequality ratio | P2 = | 0.186 913
|
| Relative edge distribution entropy | Her = | 0.771 832
|
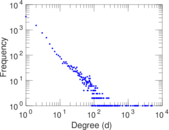
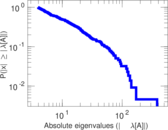
| Power law exponent | γ = | 2.136 83
|
| Tail power law exponent | γt = | 1.741 00
|
| Tail power law exponent with p | γ3 = | 1.741 00
|
| p-value | p = | 0.000 00
|
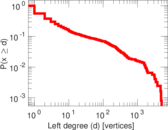
| Left tail power law exponent with p | γ3,1 = | 1.731 00
|
| Left p-value | p1 = | 0.000 00
|
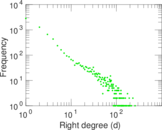
| Right tail power law exponent with p | γ3,2 = | 1.751 00
|
| Right p-value | p2 = | 0.000 00
|
| Degree assortativity | ρ = | −0.387 683
|
| Degree assortativity p-value | pρ = | 0.000 00
|
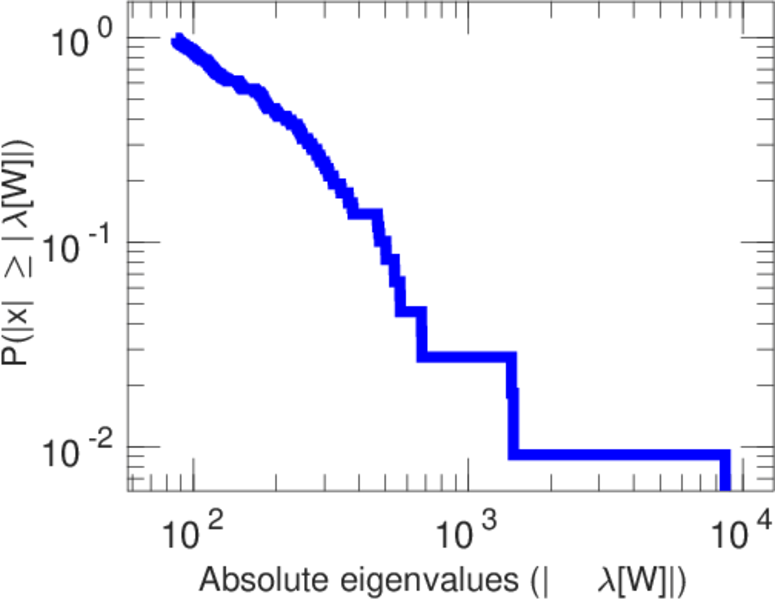
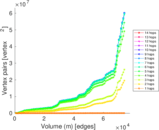
| Spectral norm | α = | 381.546
|
| Algebraic connectivity | a = | 0.024 150 9
|
| Spectral separation | |λ1[A] / λ2[A]| = | 2.237 79
|
| Controllability | C = | 6,299
|
| Relative controllability | Cr = | 0.735 607
|
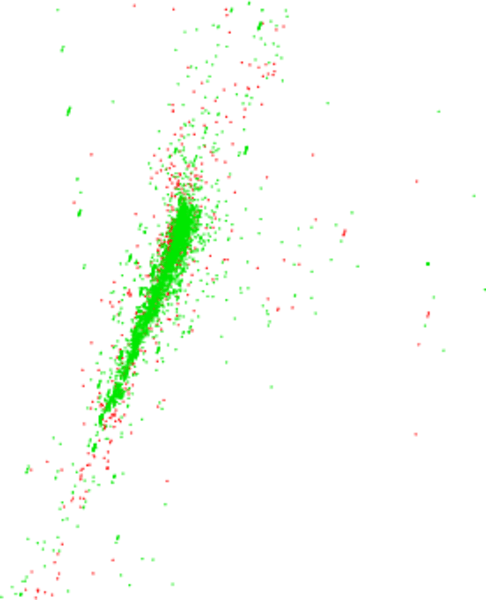
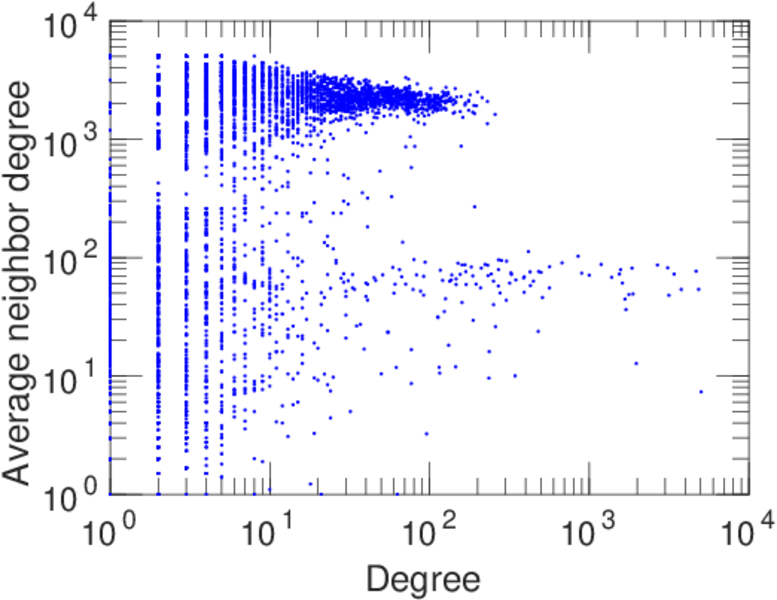
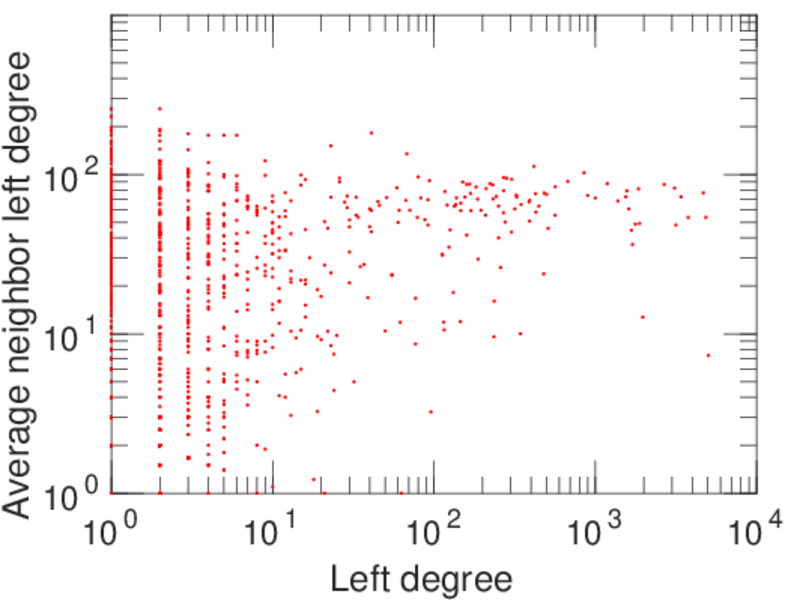
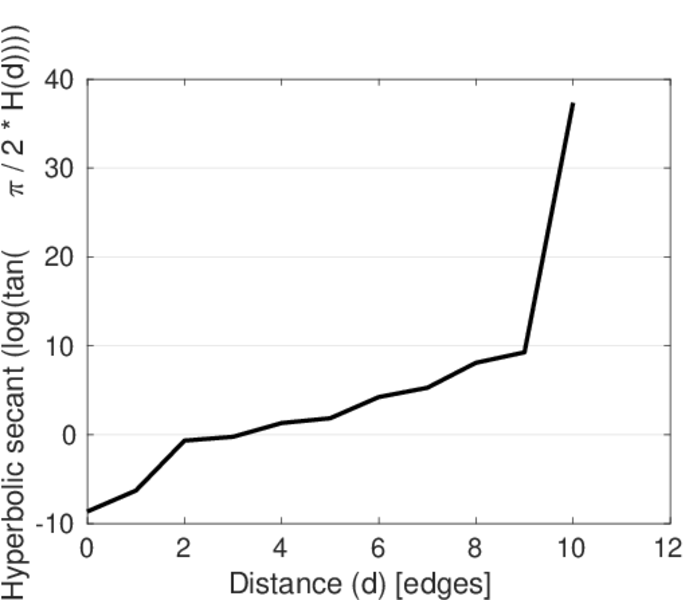
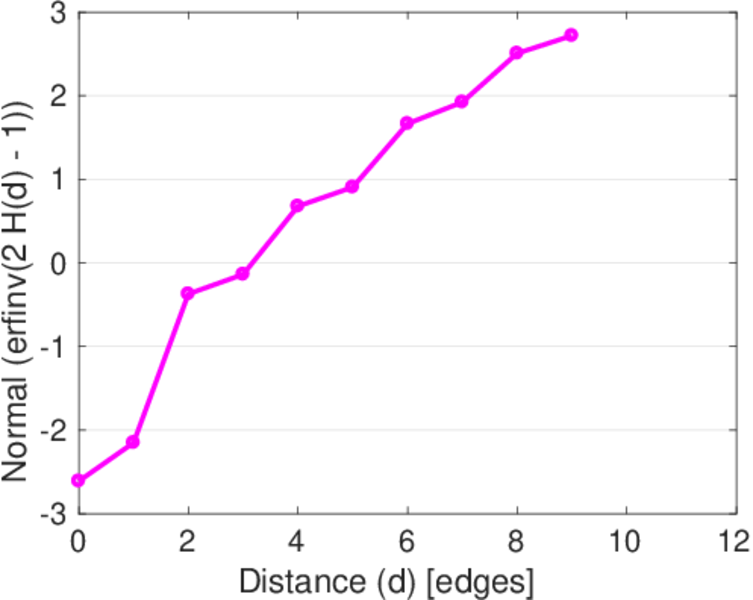
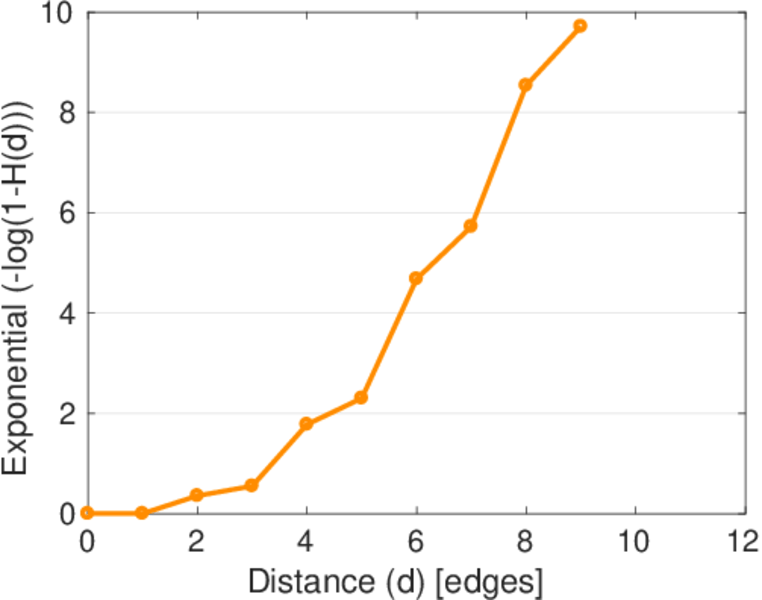
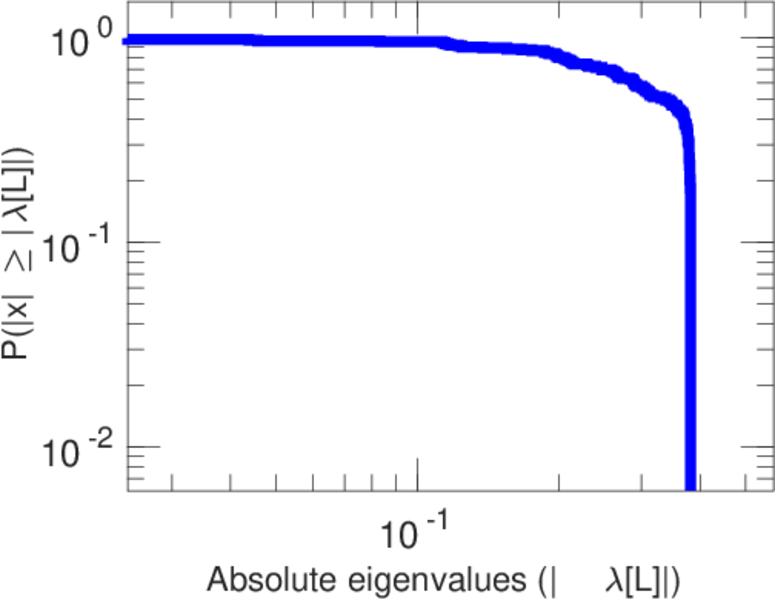
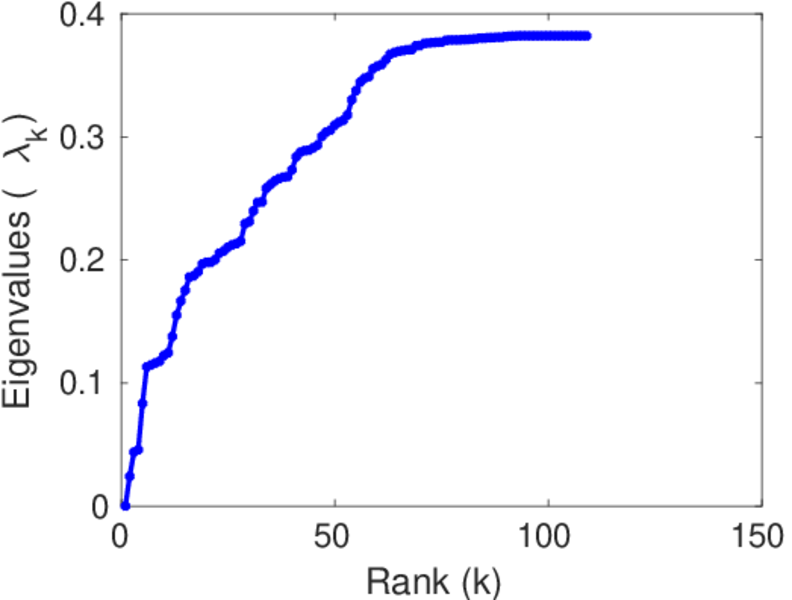
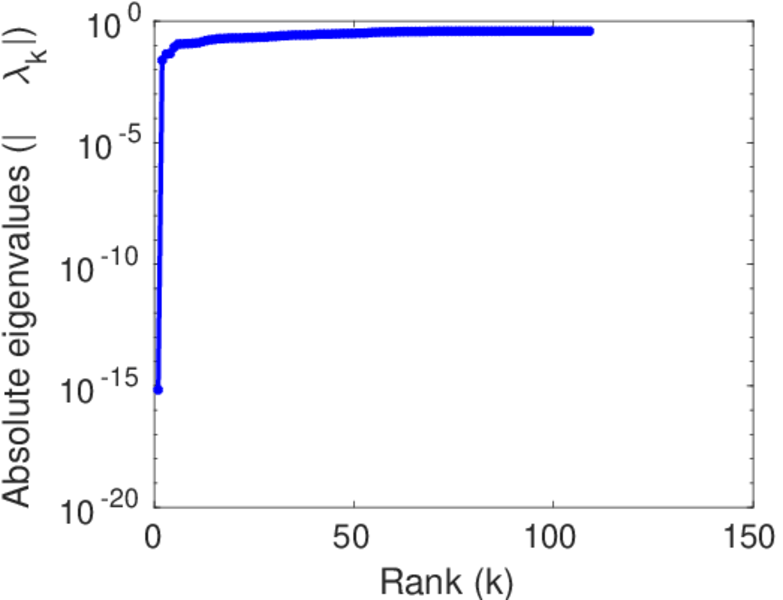
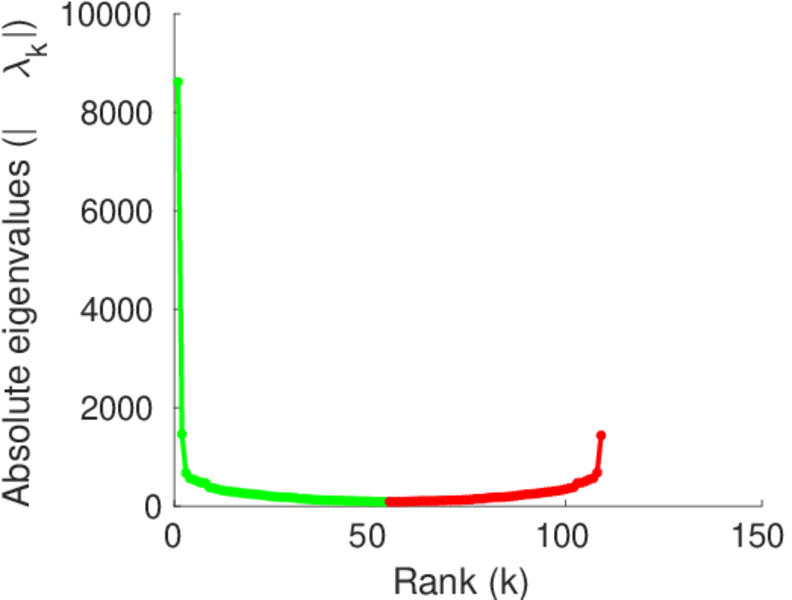
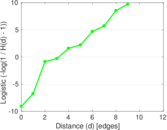
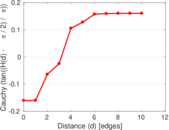
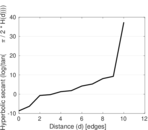
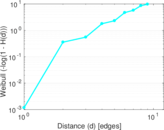
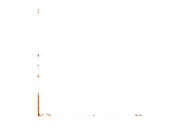
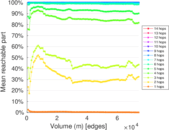
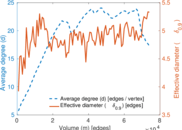
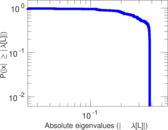
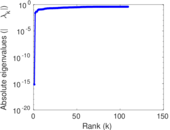
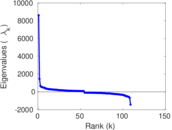
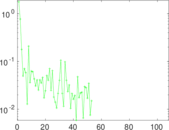
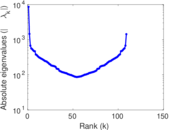
Plots


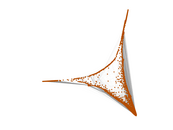
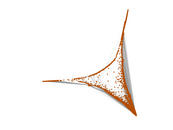


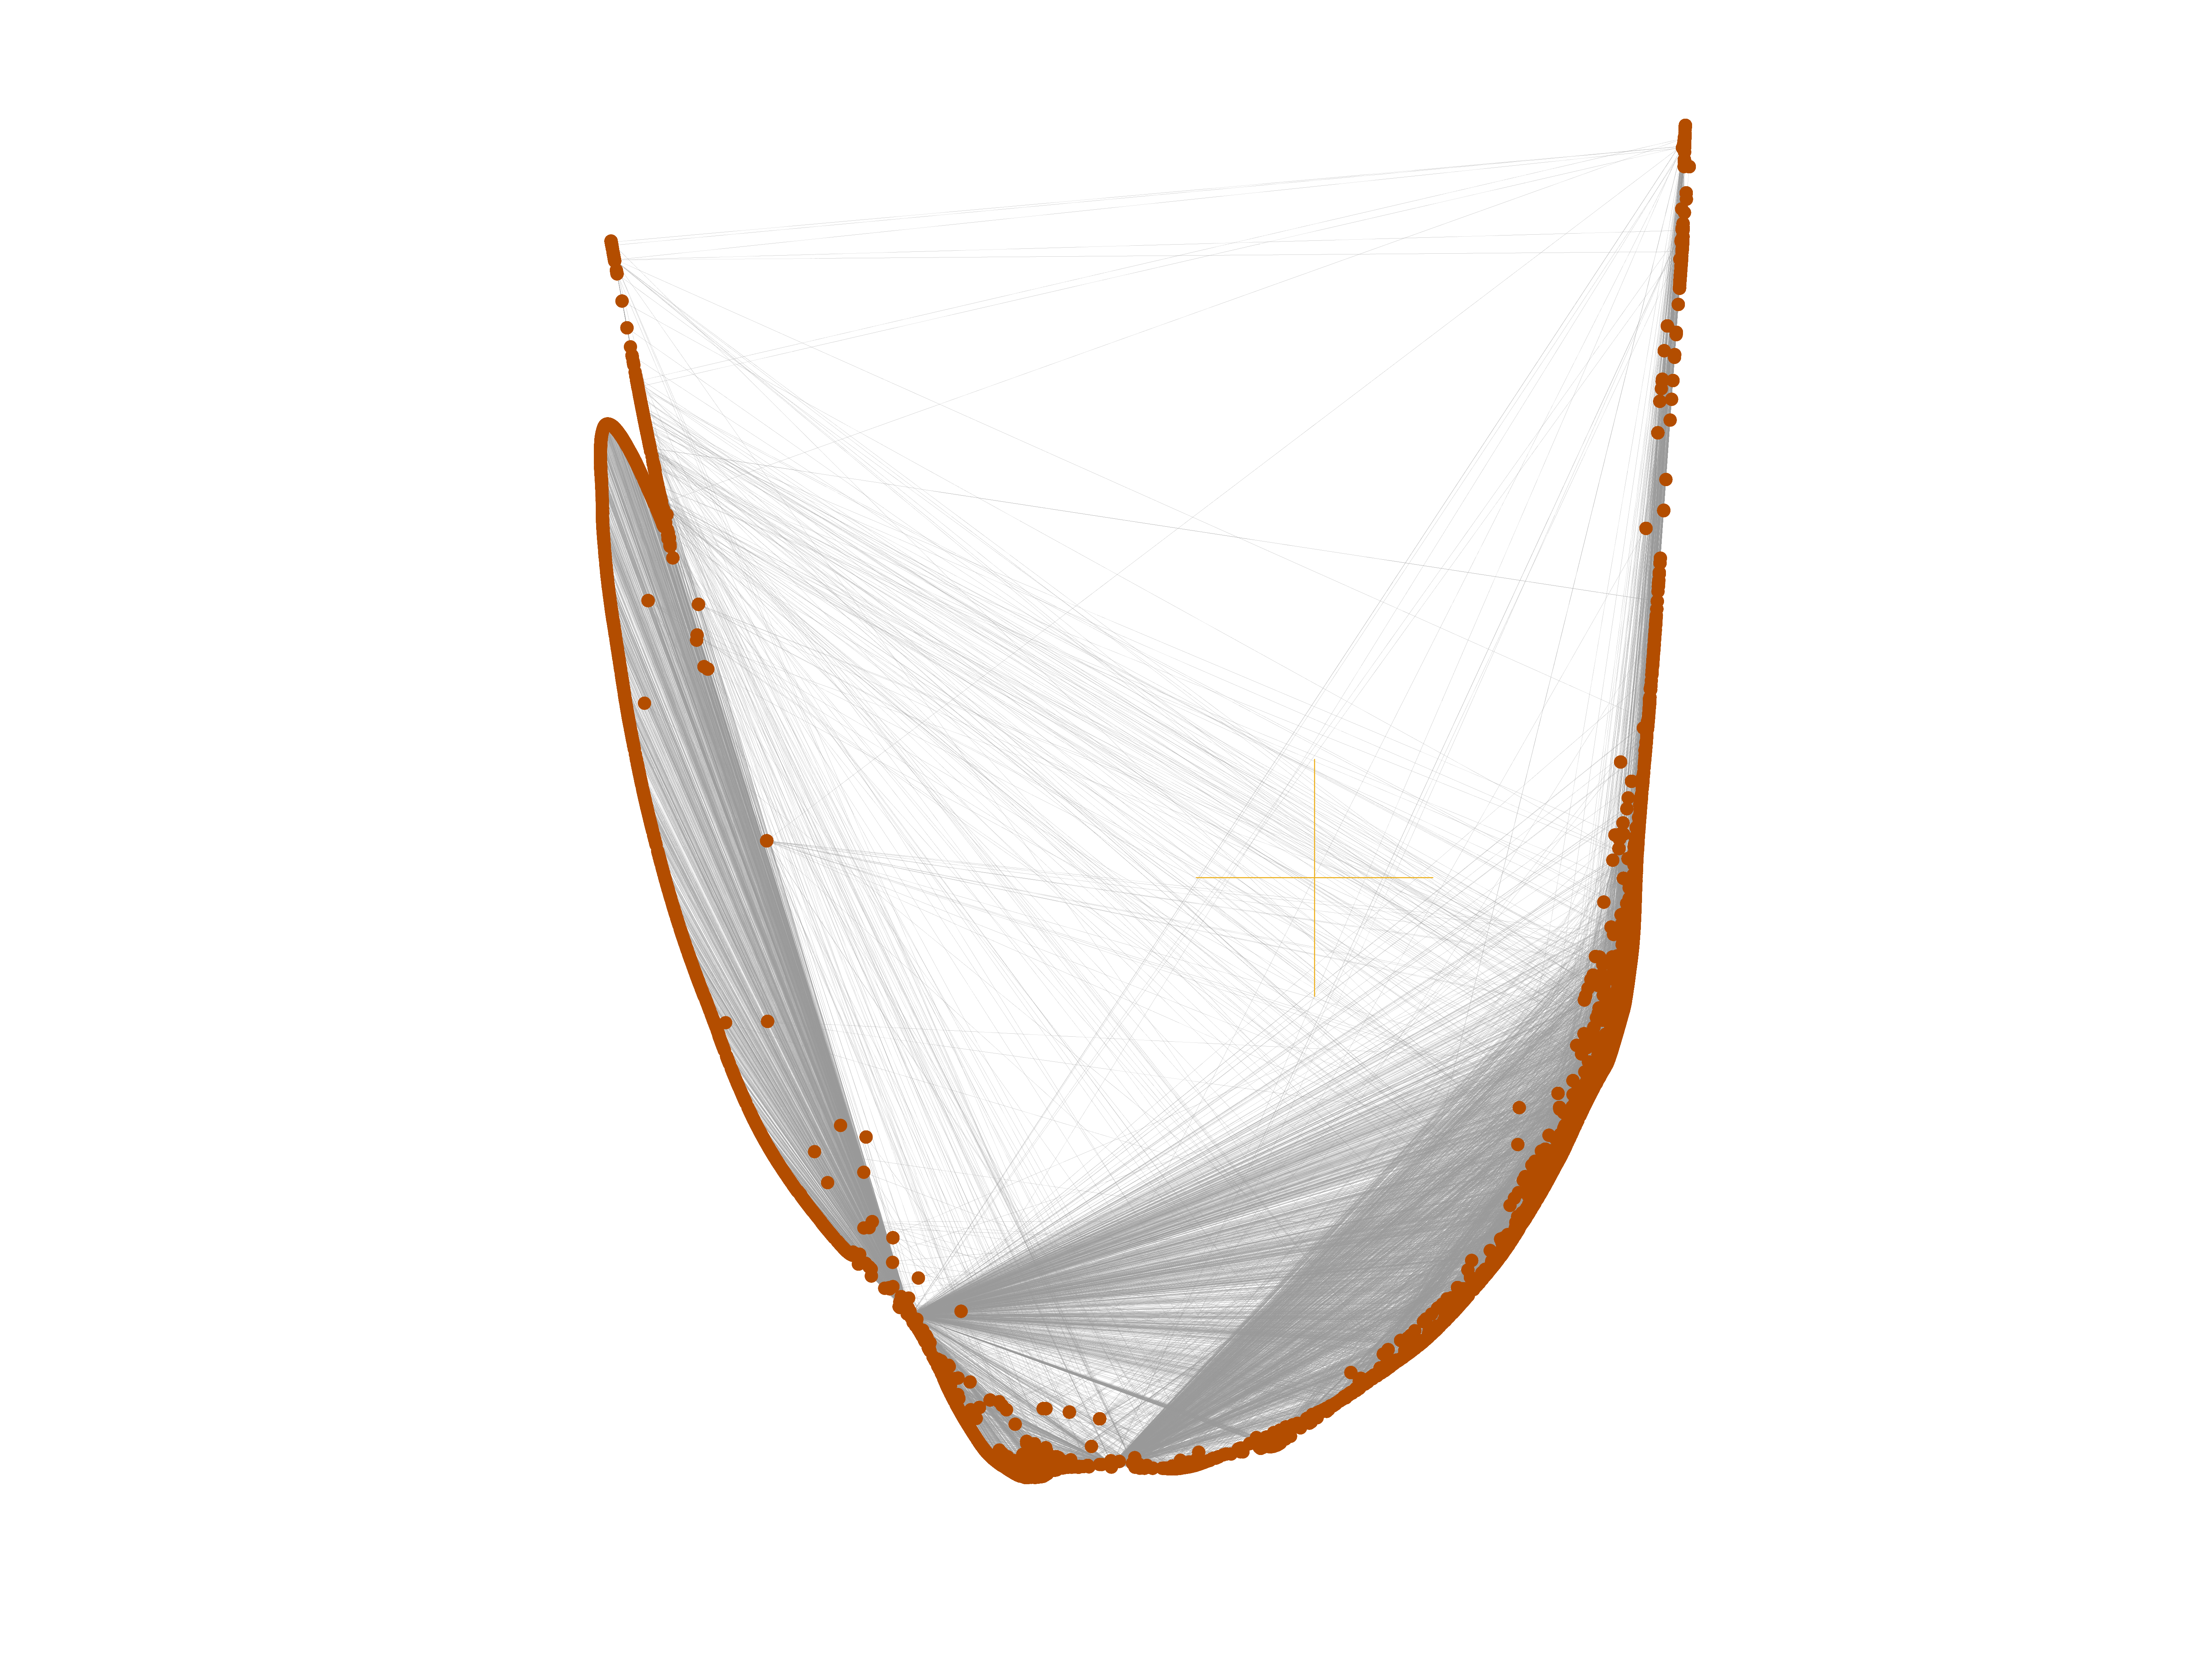
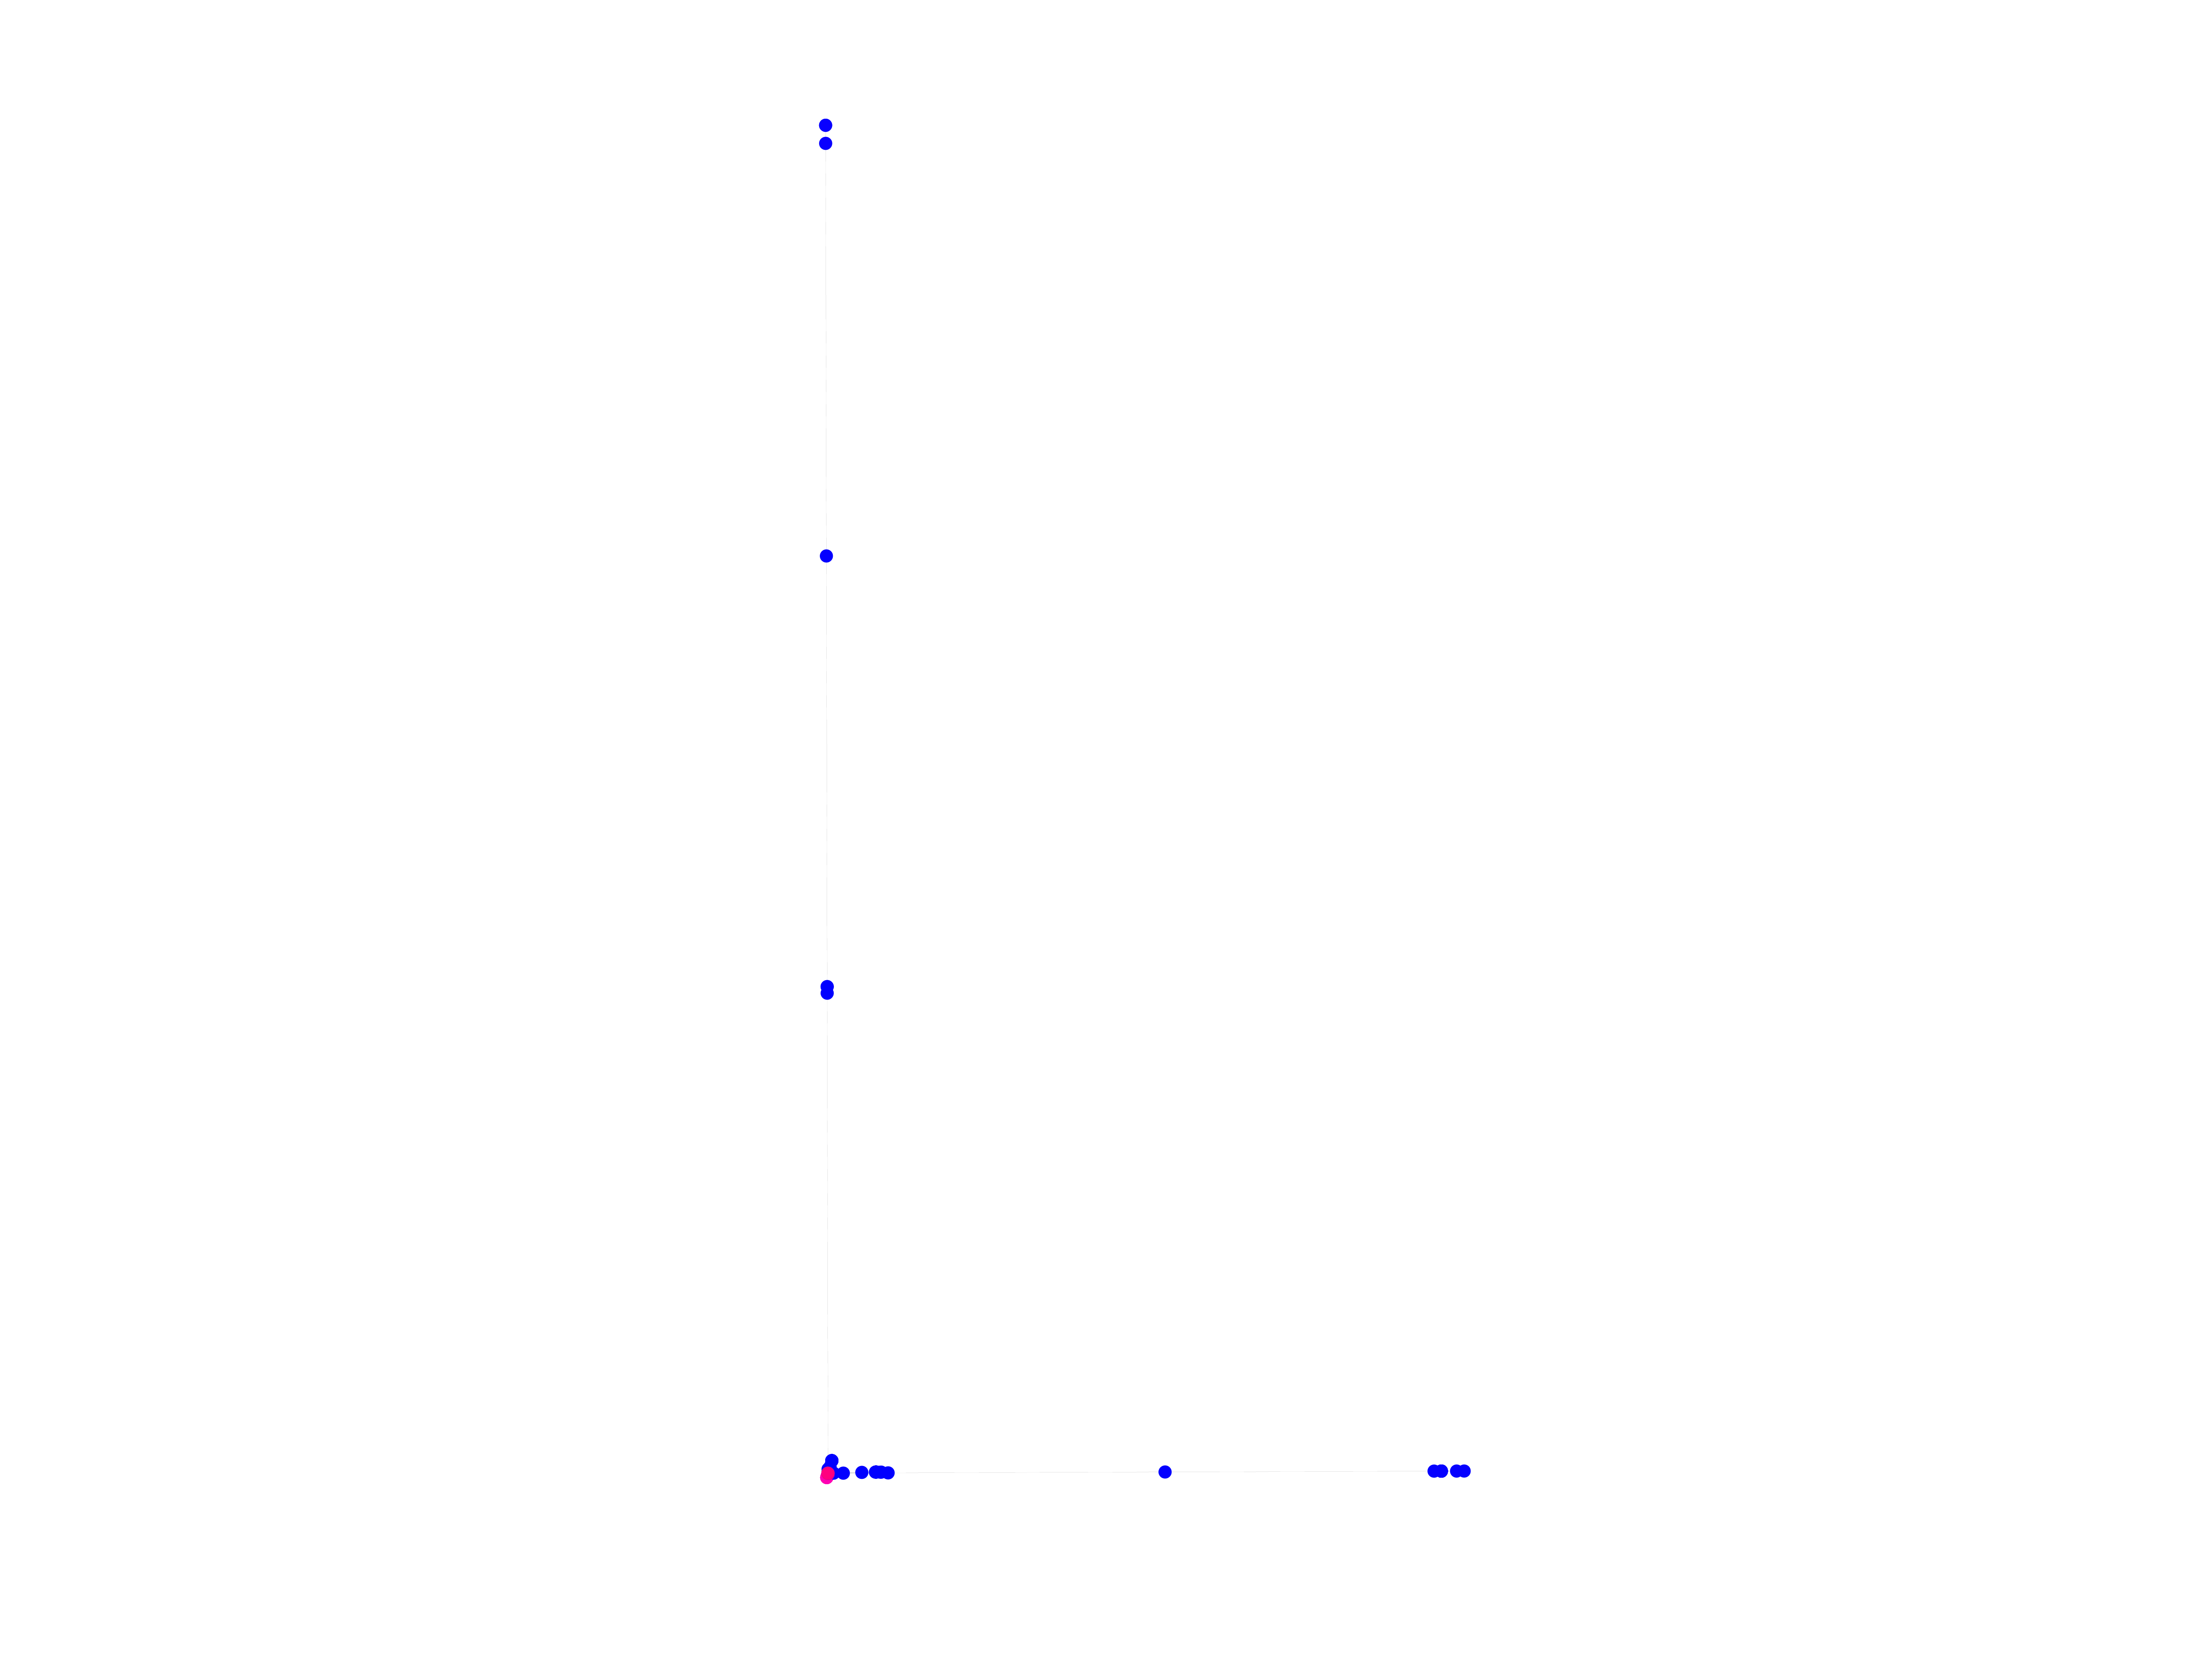
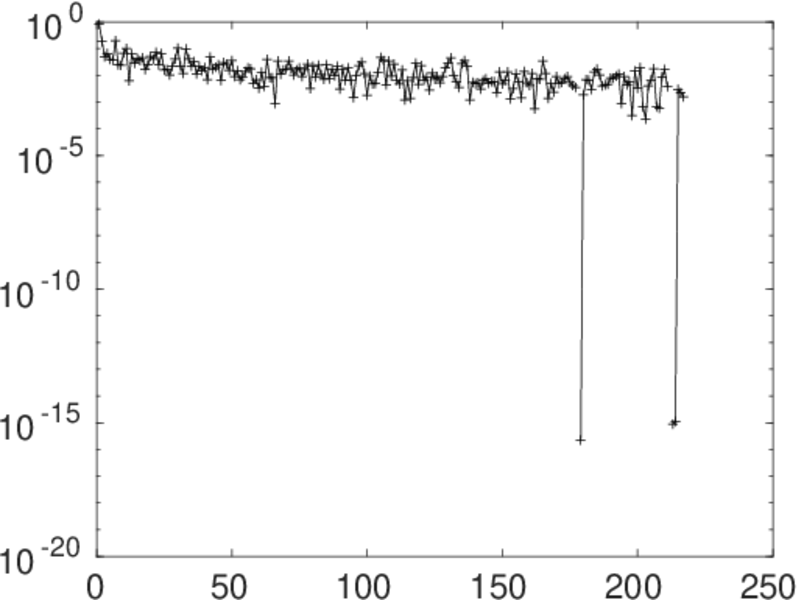
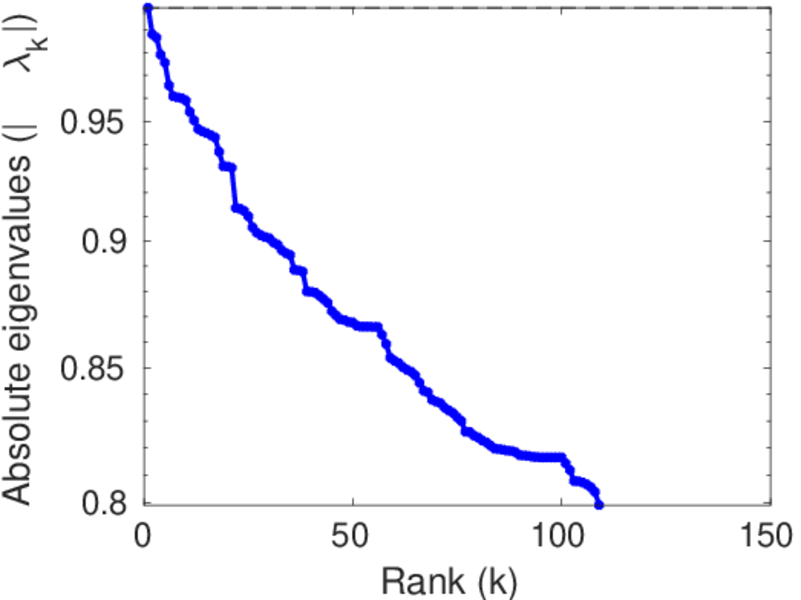
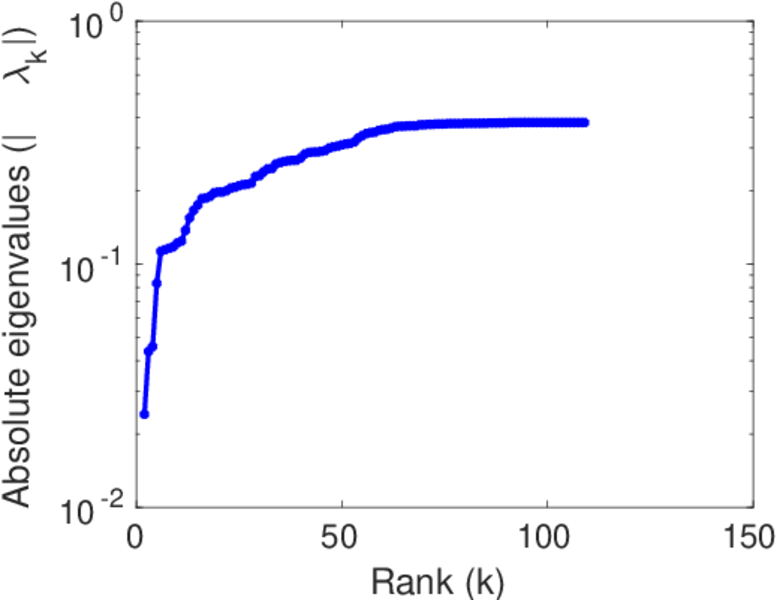
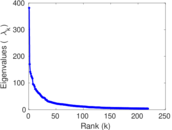
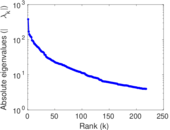
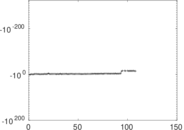
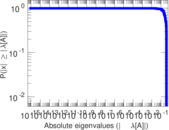
Matrix decompositions plots


Downloads
References
|
[1]
|
Jérôme Kunegis.
KONECT – The Koblenz Network Collection.
In Proc. Int. Conf. on World Wide Web Companion, pages
1343–1350, 2013.
[ http ]
|
|
[2]
|
Wikimedia Foundation.
Wikimedia downloads.
http://dumps.wikimedia.org/, January 2010.
|
 KONECT ‣ Networks ‣
Buy Me a Coffee
KONECT ‣ Networks ‣
Buy Me a Coffee