Wiktionary edits (ay)
This is the bipartite edit network of the Aymara Wiktionary. It contains users
and pages from the Aymara Wiktionary, connected by edit events. Each edge
represents an edit. The dataset includes the timestamp of each edit.
Metadata
Statistics
| Size | n = | 1,958
|
| Left size | n1 = | 220
|
| Right size | n2 = | 1,738
|
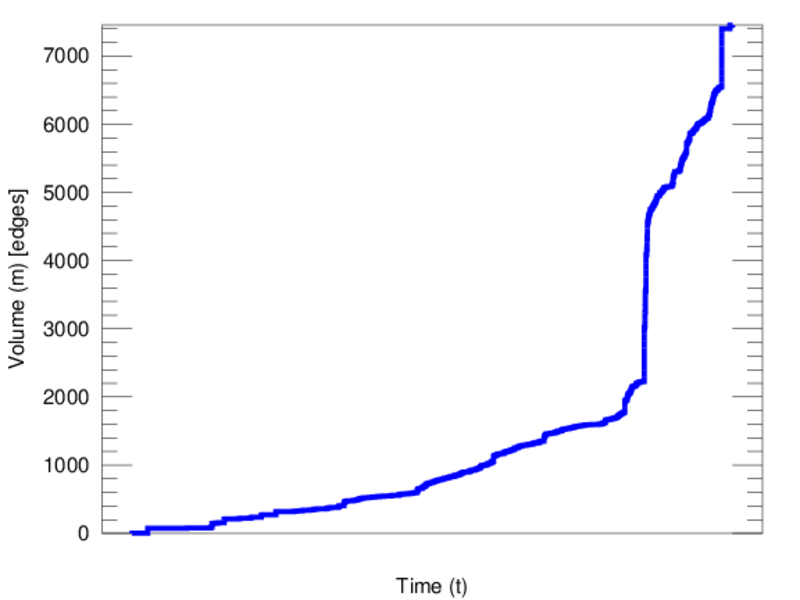
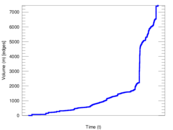
| Volume | m = | 7,456
|
| Unique edge count | m̿ = | 4,745
|
| Wedge count | s = | 1,373,450
|
| Claw count | z = | 376,953,166
|
| Cross count | x = | 83,399,554,771
|
| Square count | q = | 1,274,170
|
| 4-Tour count | T4 = | 15,696,950
|
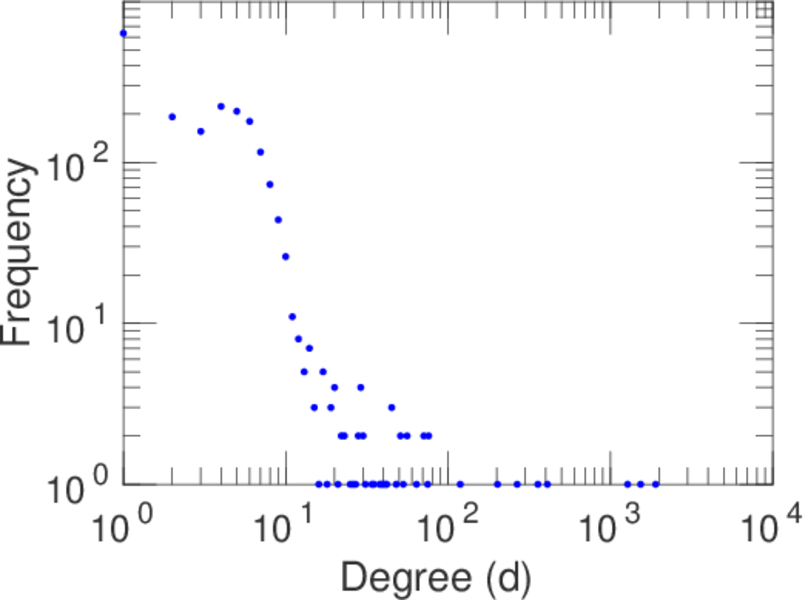
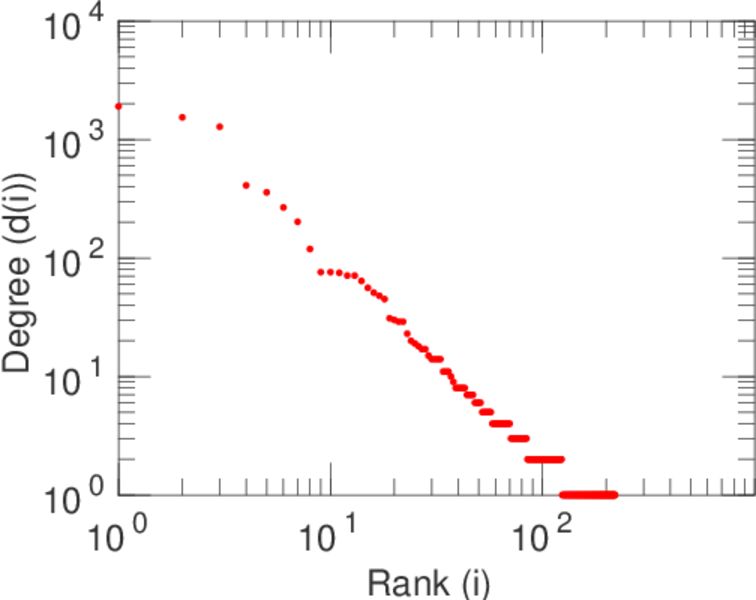
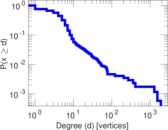
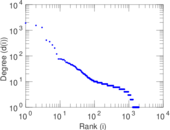
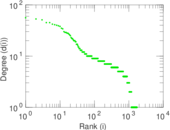
| Maximum degree | dmax = | 1,903
|
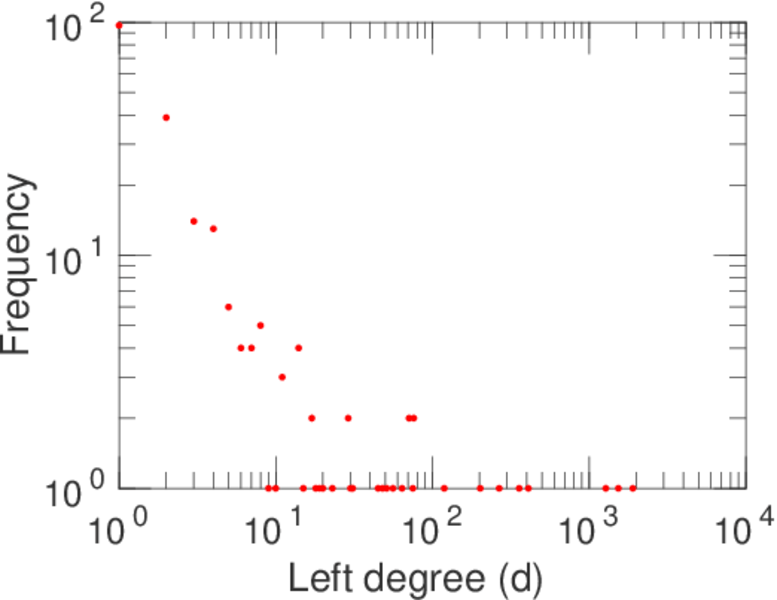
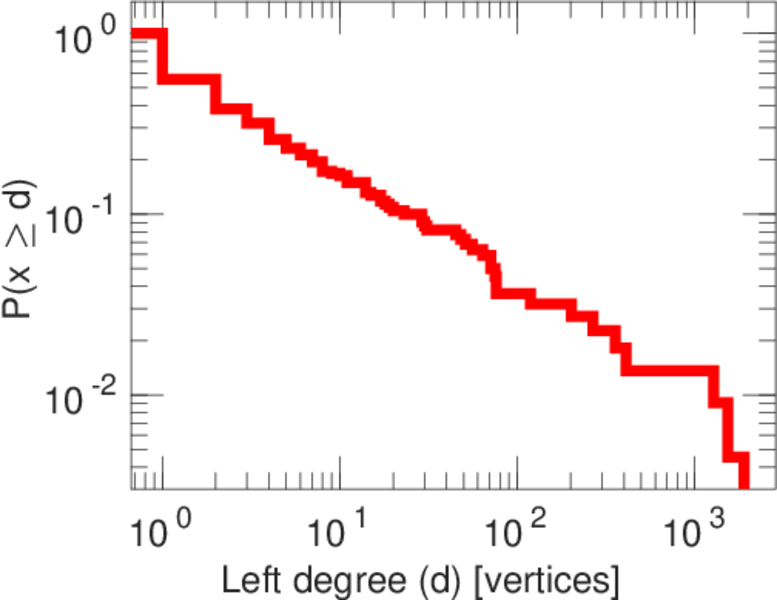
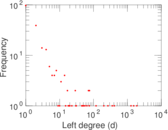
| Maximum left degree | d1max = | 1,903
|
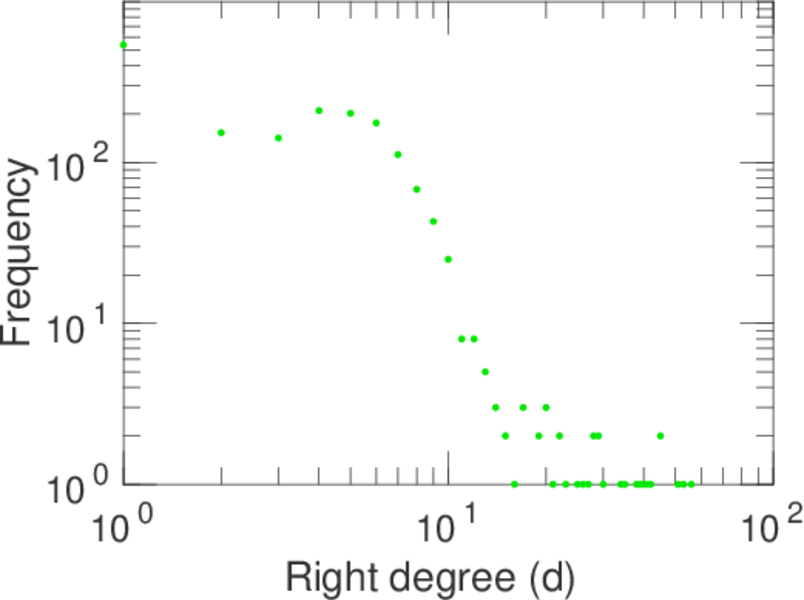
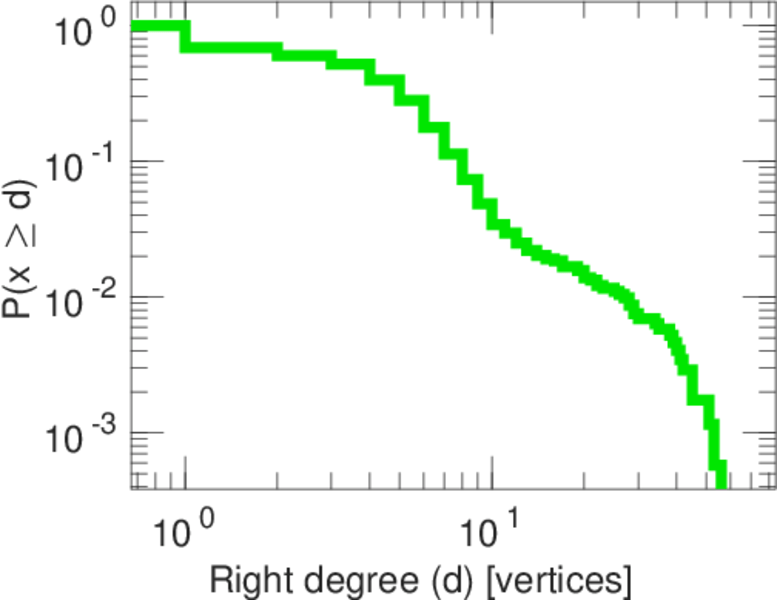
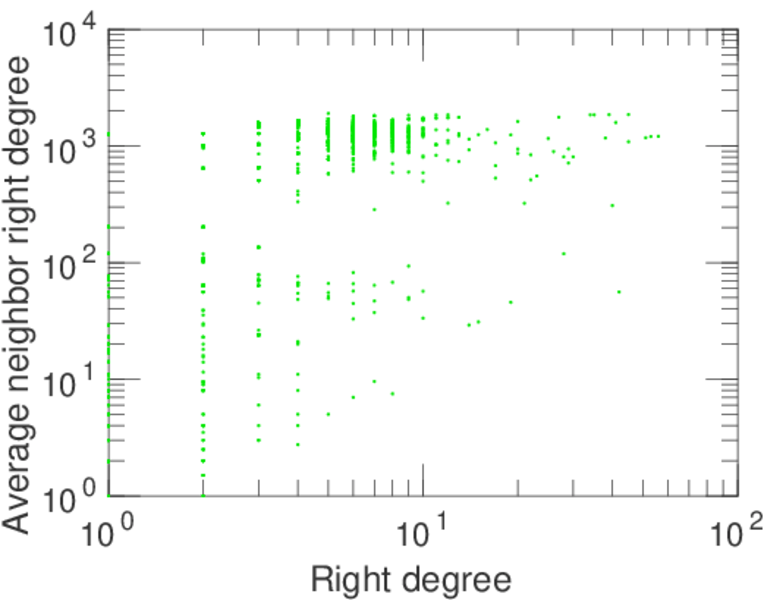
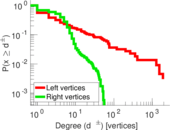
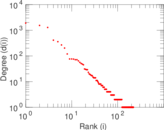
| Maximum right degree | d2max = | 56
|
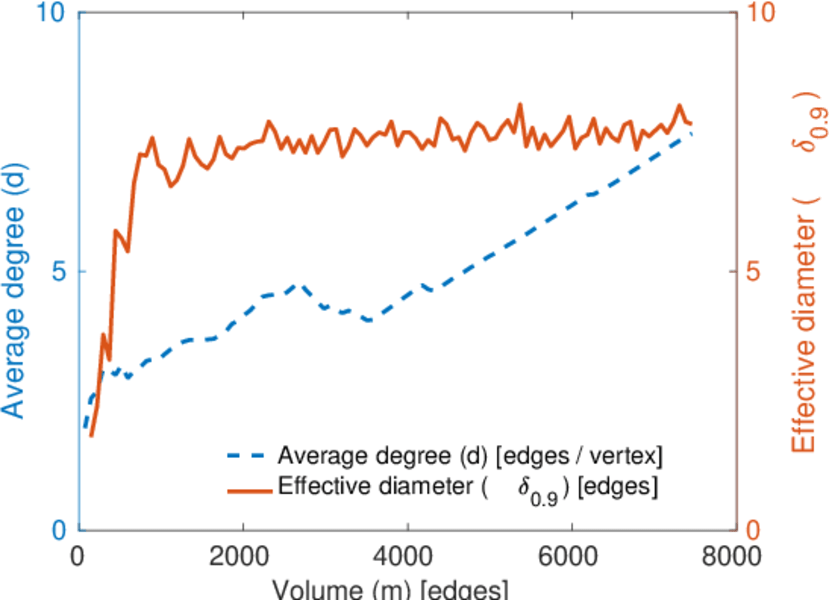
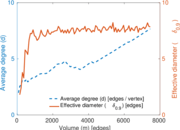
| Average degree | d = | 7.615 93
|
| Average left degree | d1 = | 33.890 9
|
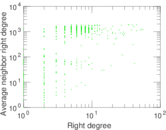
| Average right degree | d2 = | 4.289 99
|
| Fill | p = | 0.012 409 8
|
| Average edge multiplicity | m̃ = | 1.571 34
|
| Size of LCC | N = | 1,597
|
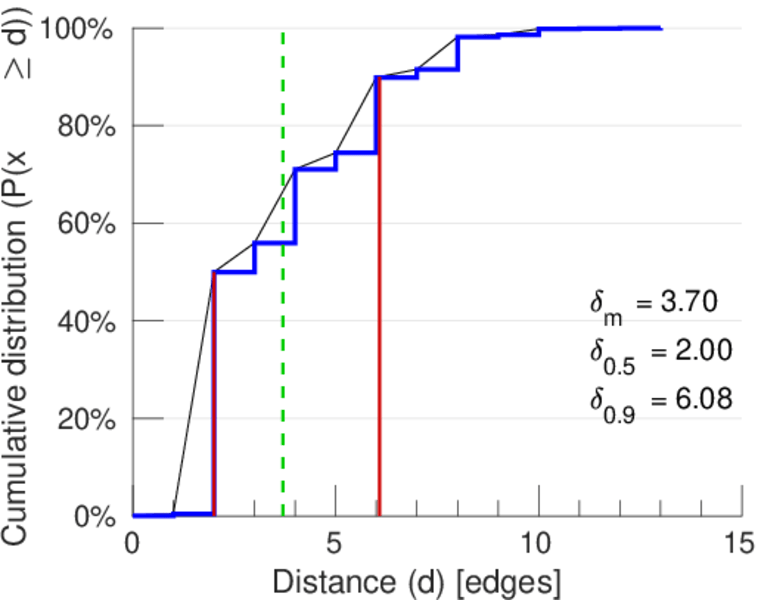
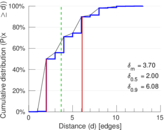
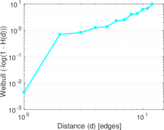
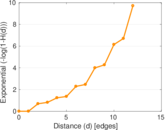
| Diameter | δ = | 15
|
| 50-Percentile effective diameter | δ0.5 = | 2.004 49
|
| 90-Percentile effective diameter | δ0.9 = | 6.075 89
|
| Median distance | δM = | 3
|
| Mean distance | δm = | 3.702 84
|
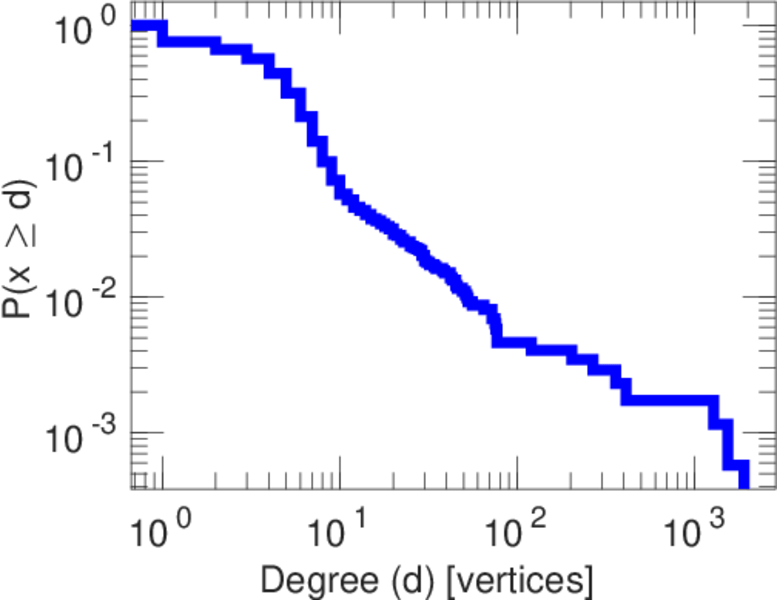
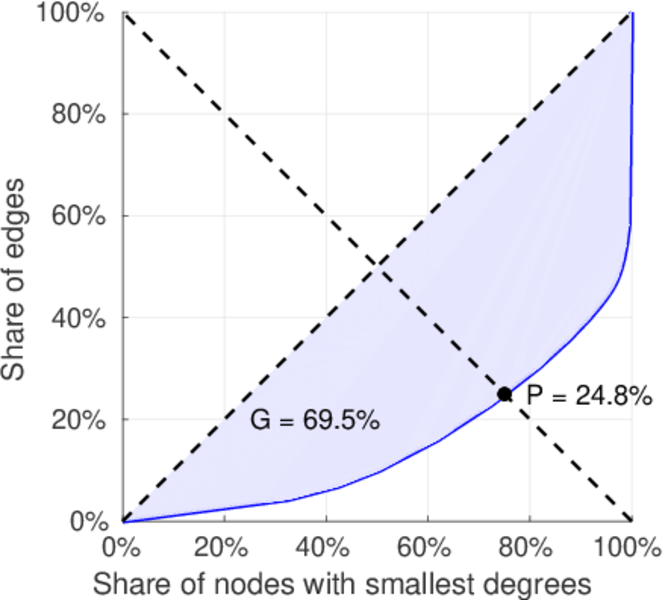
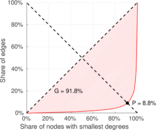
| Gini coefficient | G = | 0.680 253
|
| Balanced inequality ratio | P = | 0.254 024
|
| Left balanced inequality ratio | P1 = | 0.088 117 0
|
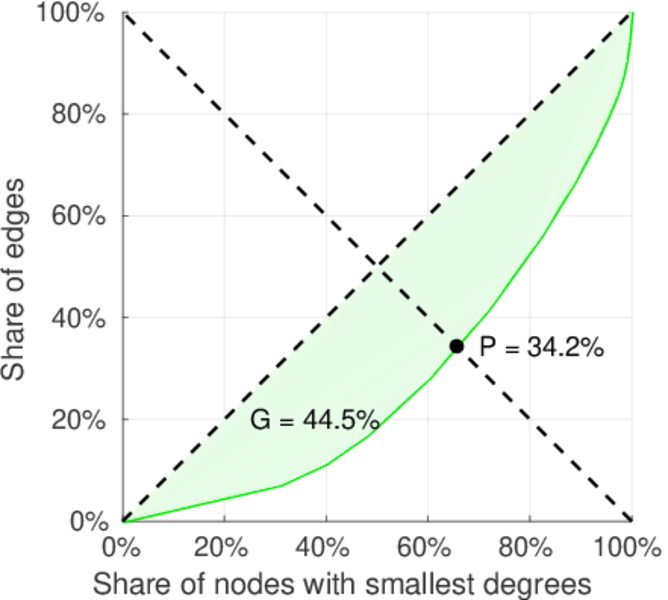
| Right balanced inequality ratio | P2 = | 0.342 006
|
| Relative edge distribution entropy | Her = | 0.757 520
|
| Power law exponent | γ = | 2.230 12
|
| Tail power law exponent | γt = | 3.911 00
|
| Tail power law exponent with p | γ3 = | 3.911 00
|
| p-value | p = | 0.000 00
|
| Left tail power law exponent with p | γ3,1 = | 1.731 00
|
| Left p-value | p1 = | 0.090 000 0
|
| Right tail power law exponent with p | γ3,2 = | 6.661 00
|
| Right p-value | p2 = | 0.203 000
|
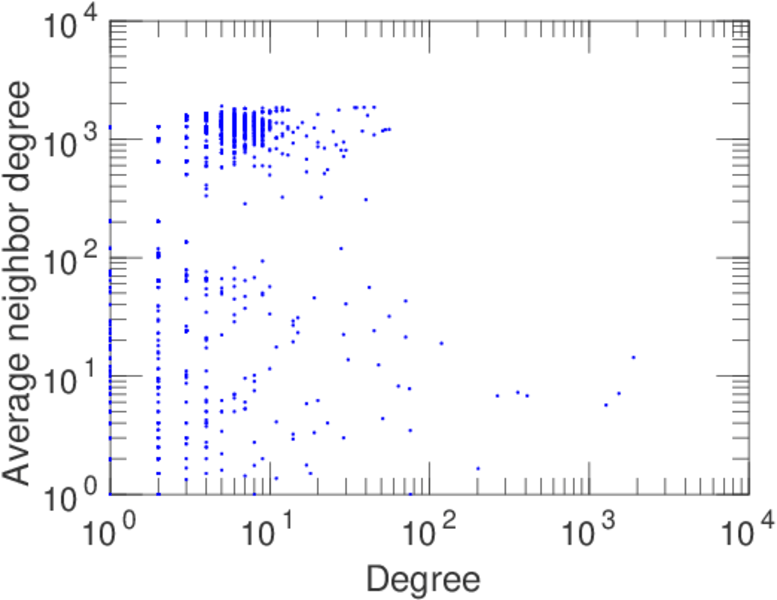
| Degree assortativity | ρ = | +0.115 918
|
| Degree assortativity p-value | pρ = | 1.149 23 × 10−15
|
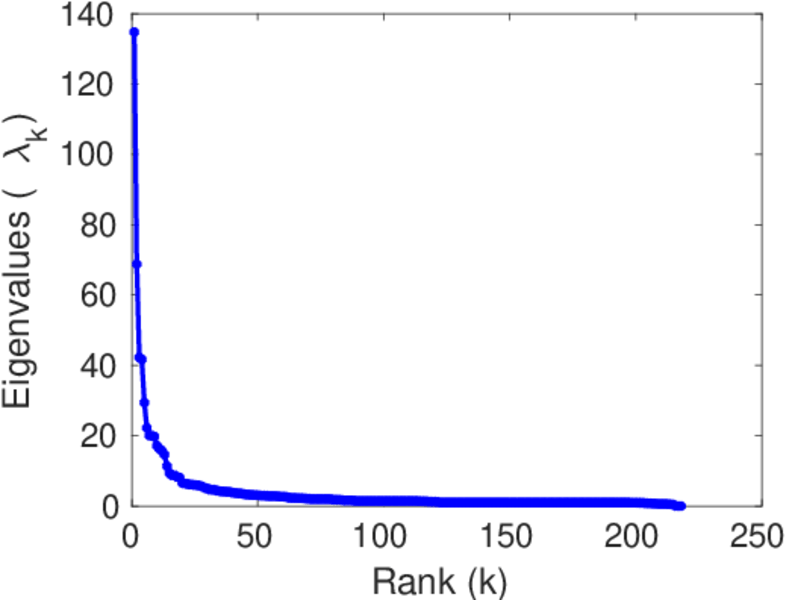
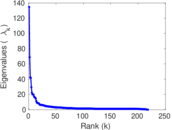
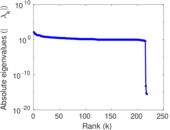
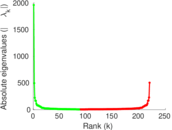
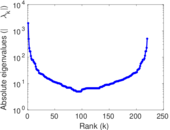
| Spectral norm | α = | 134.761
|
| Algebraic connectivity | a = | 0.011 847 5
|
| Spectral separation | |λ1[A] / λ2[A]| = | 1.959 16
|
| Controllability | C = | 1,518
|
| Relative controllability | Cr = | 0.779 261
|
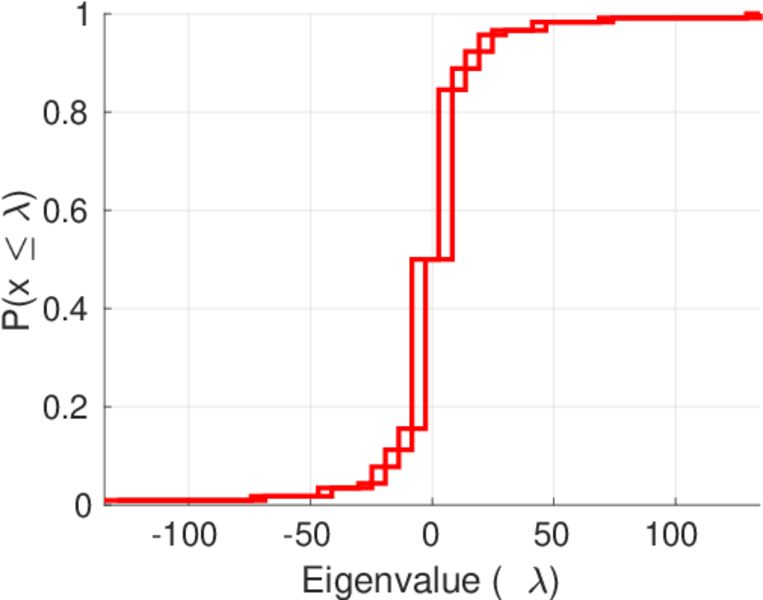
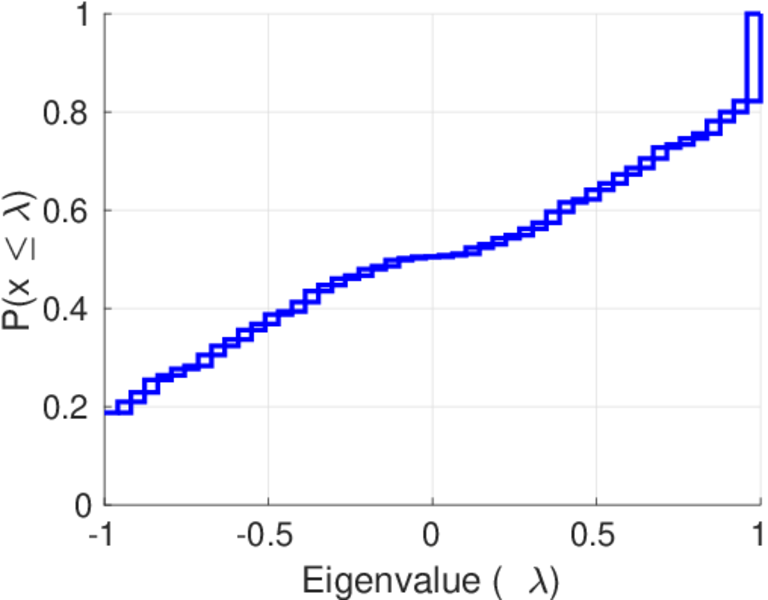
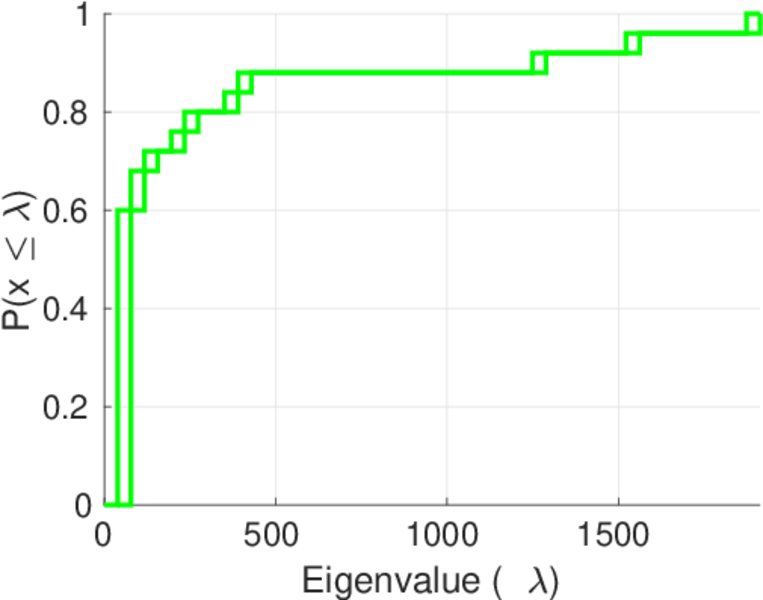
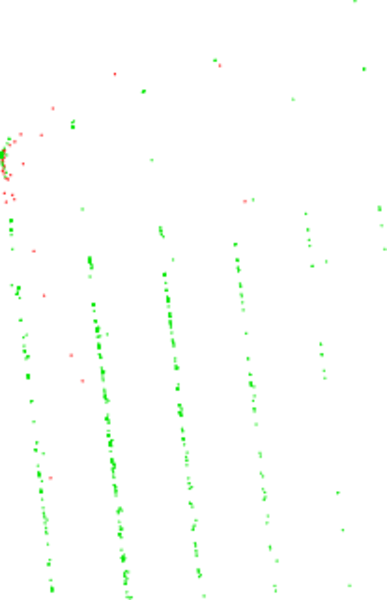
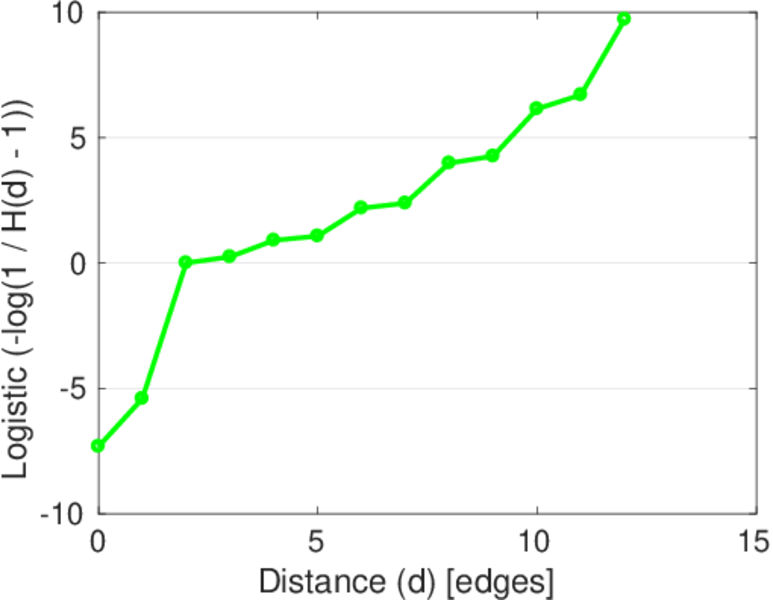
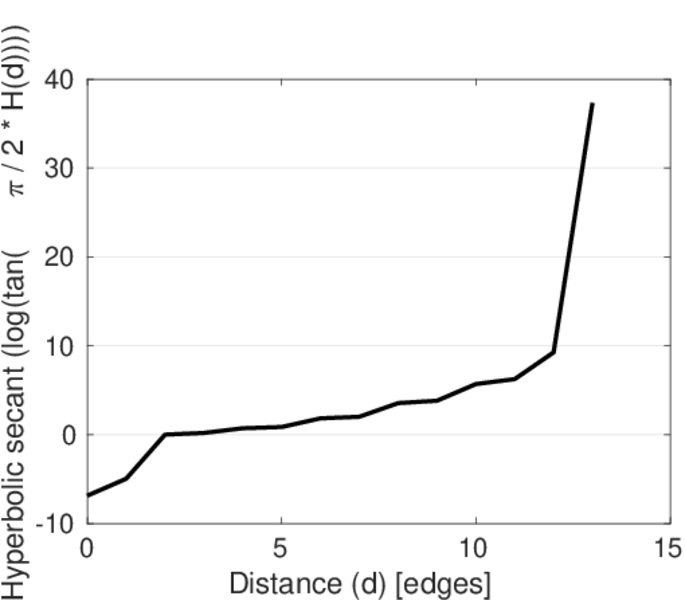
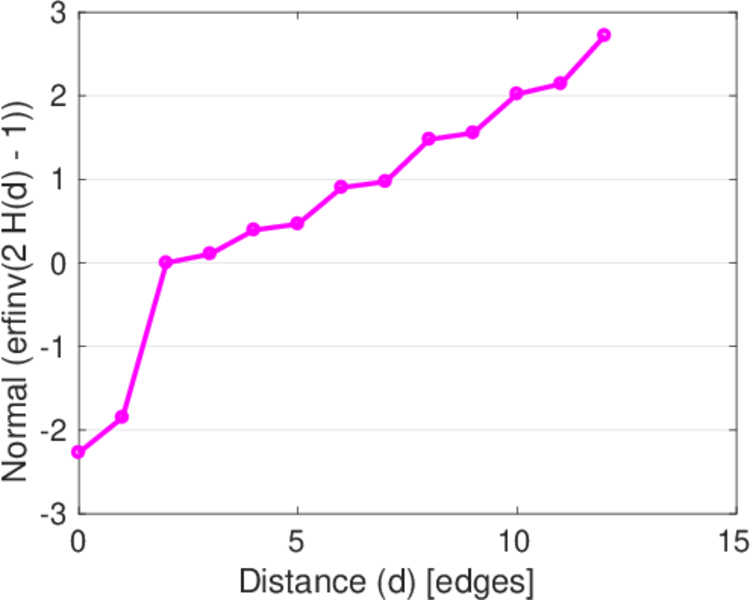
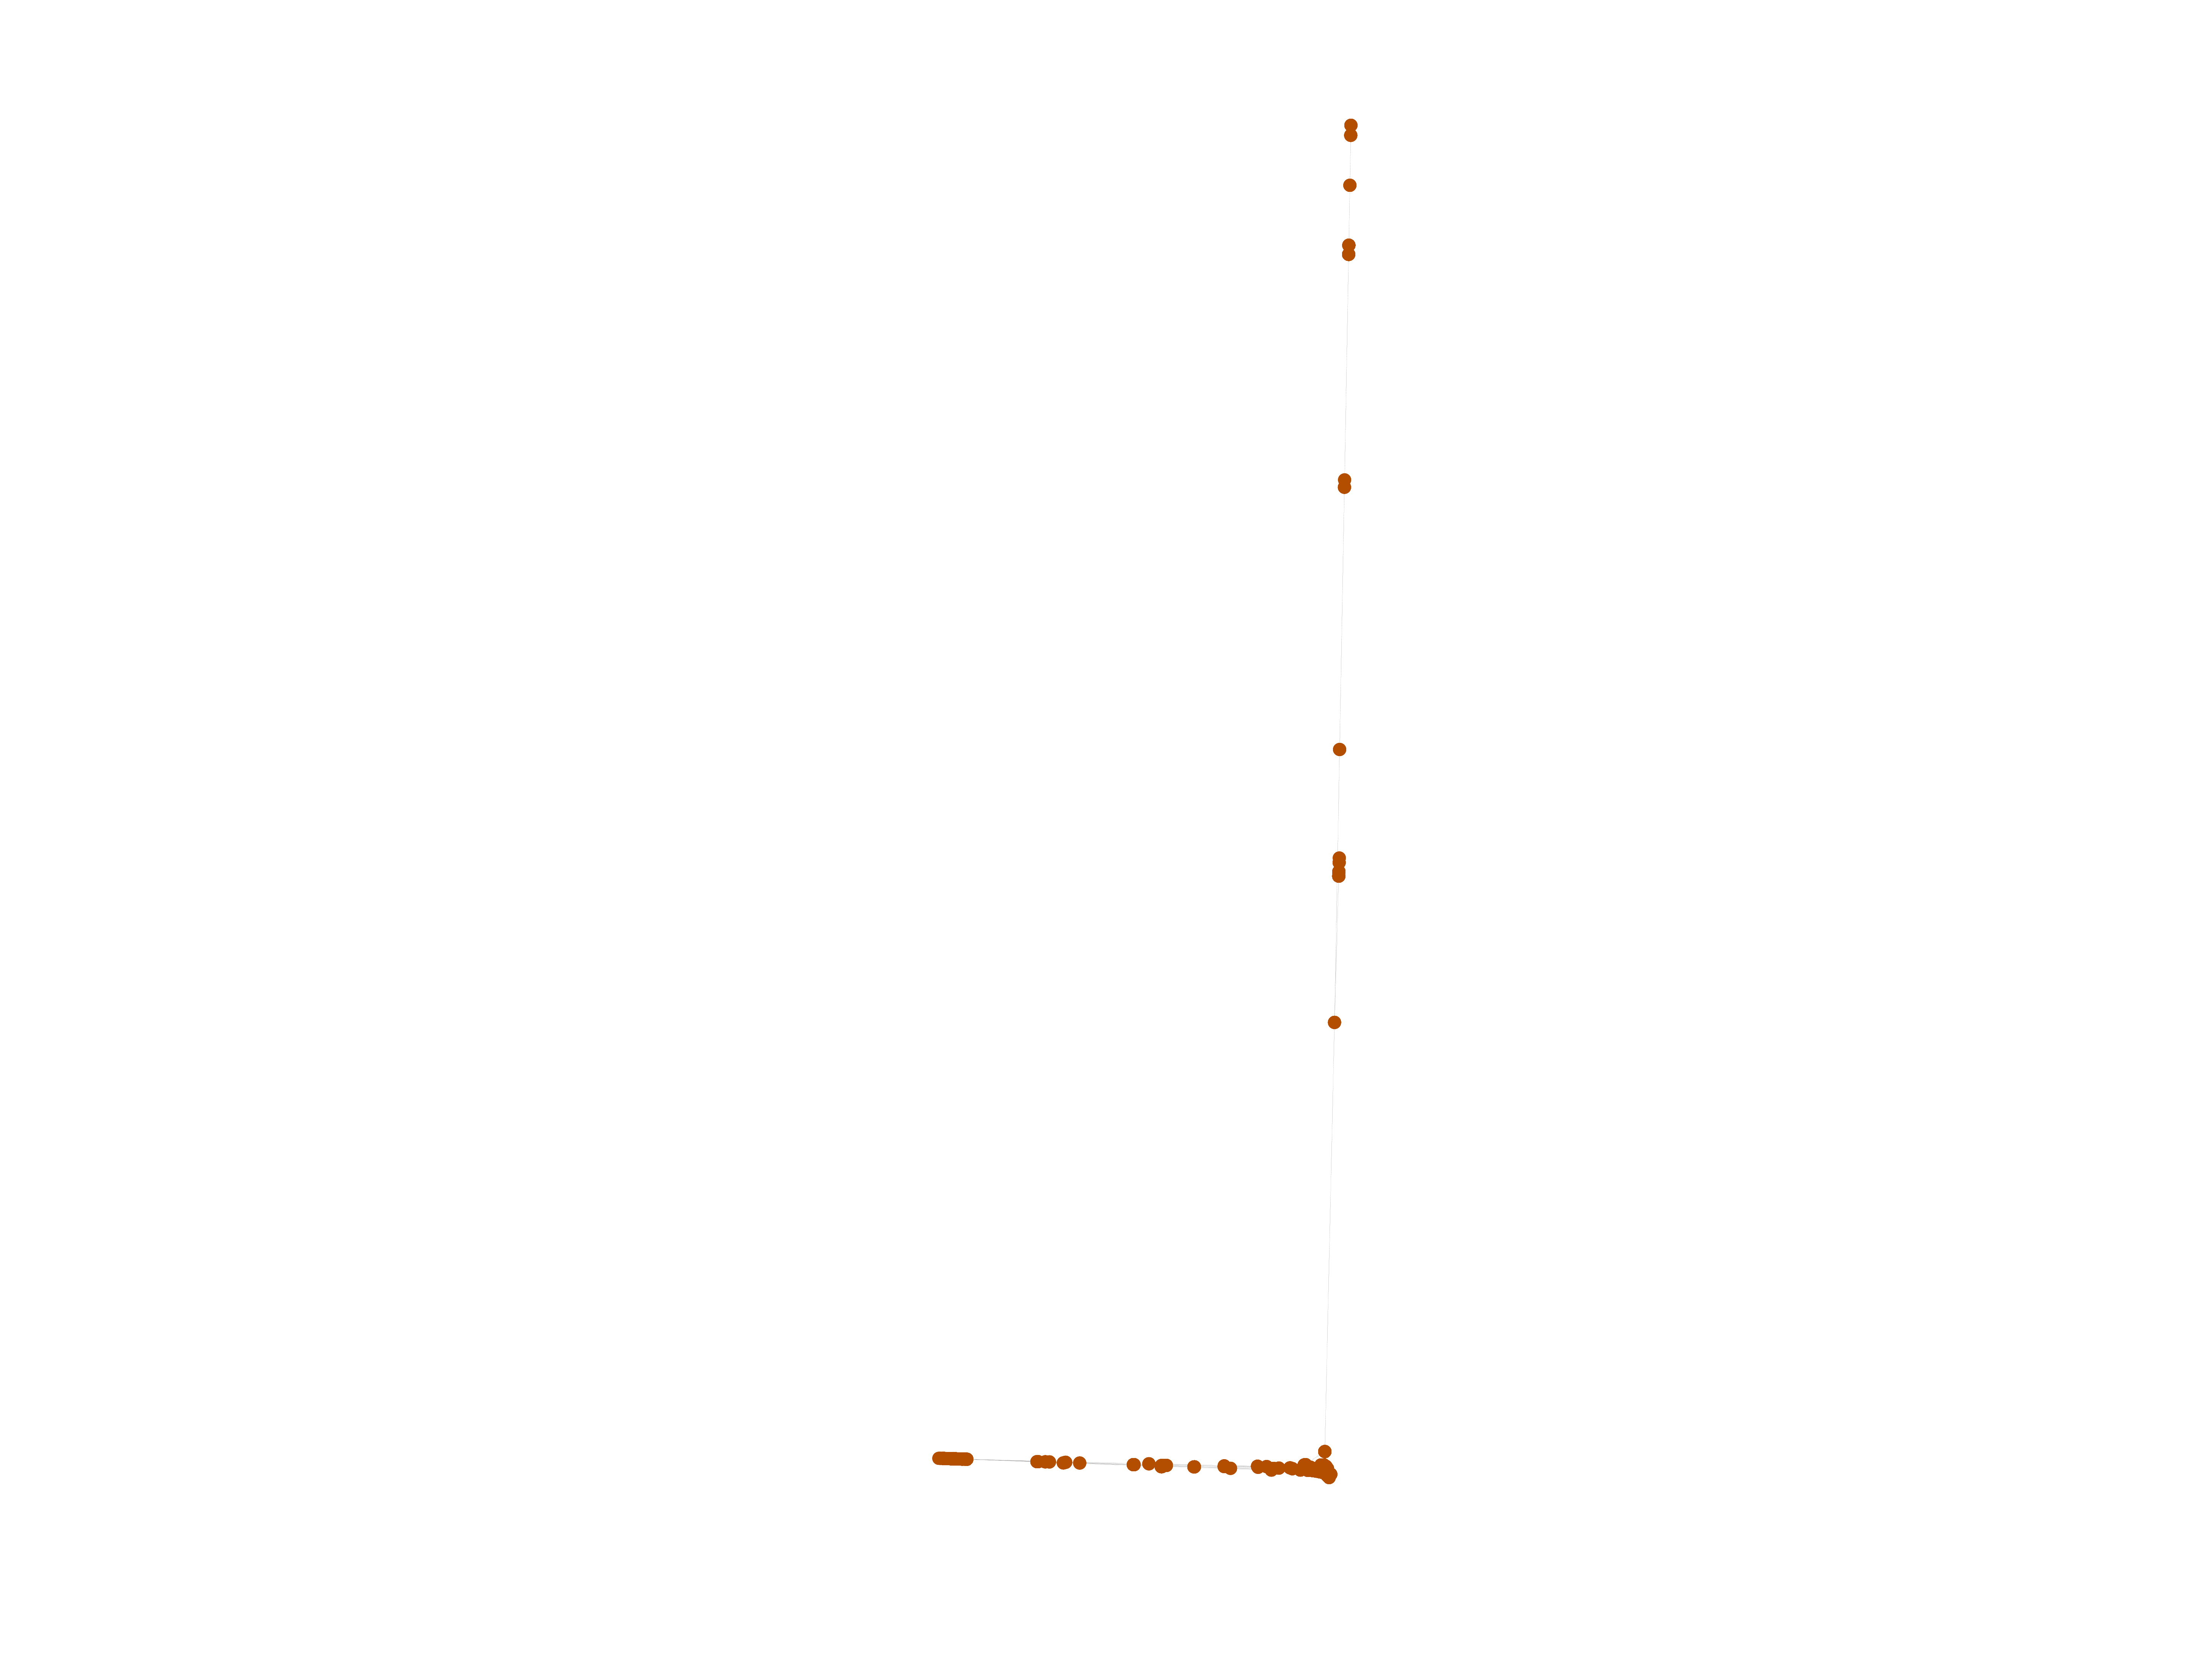
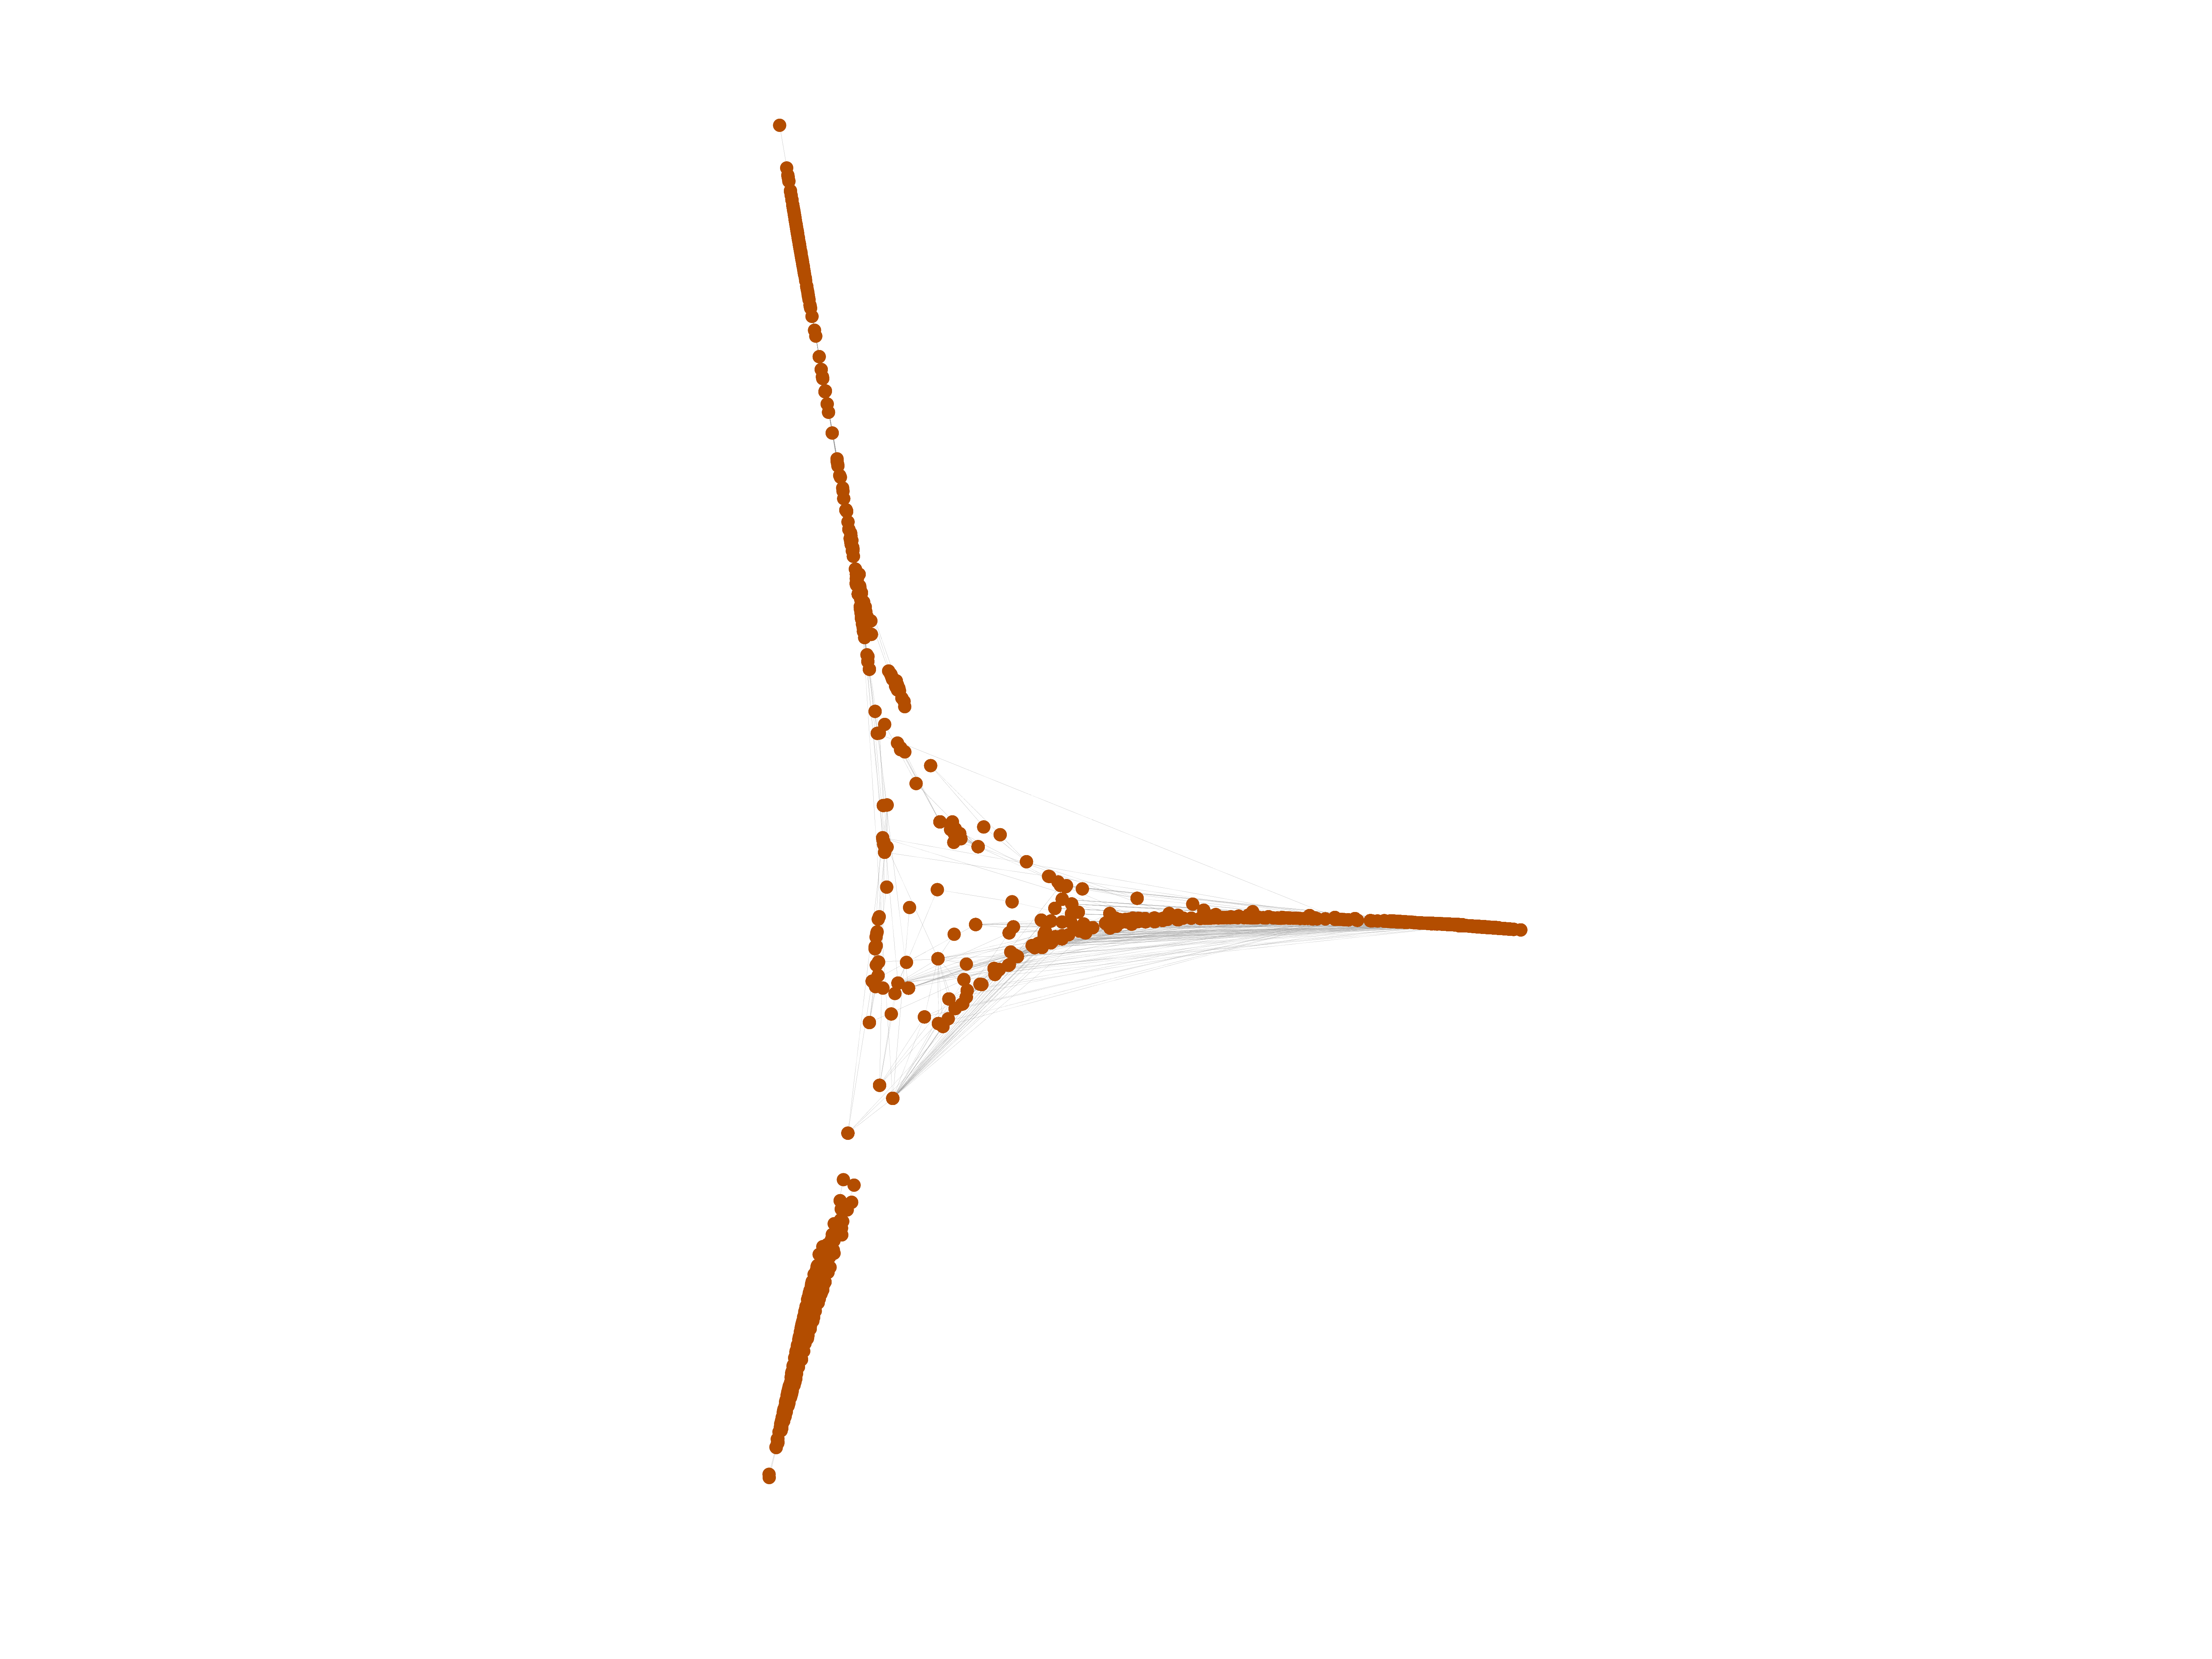
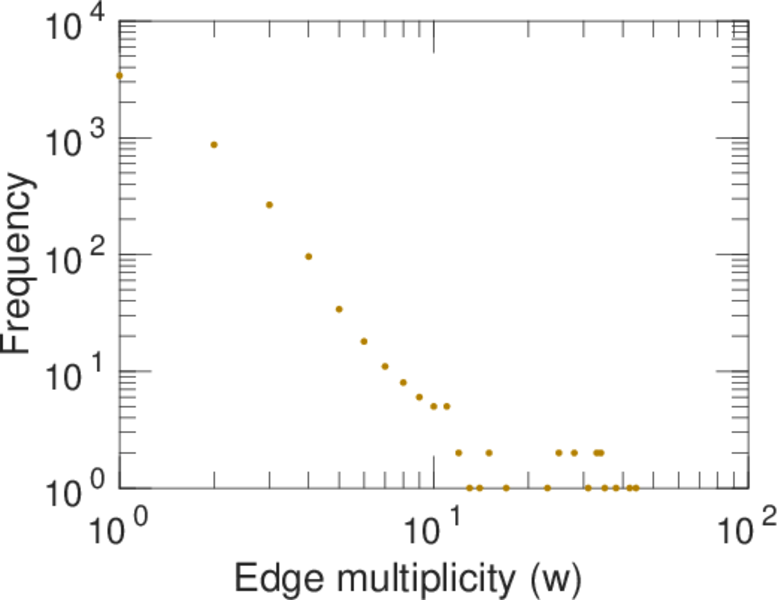
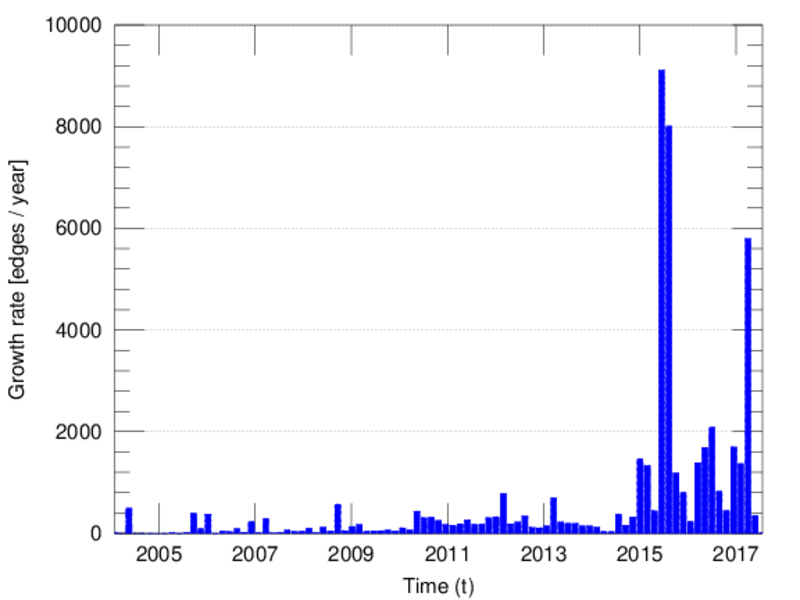
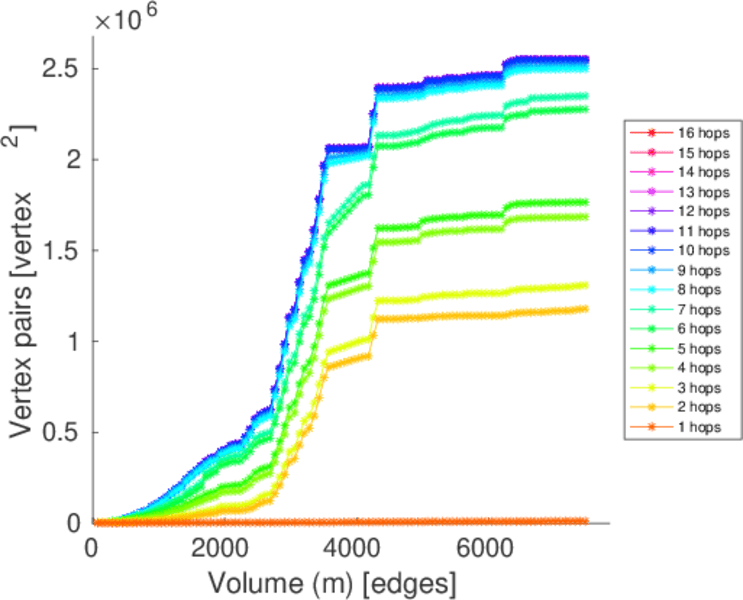
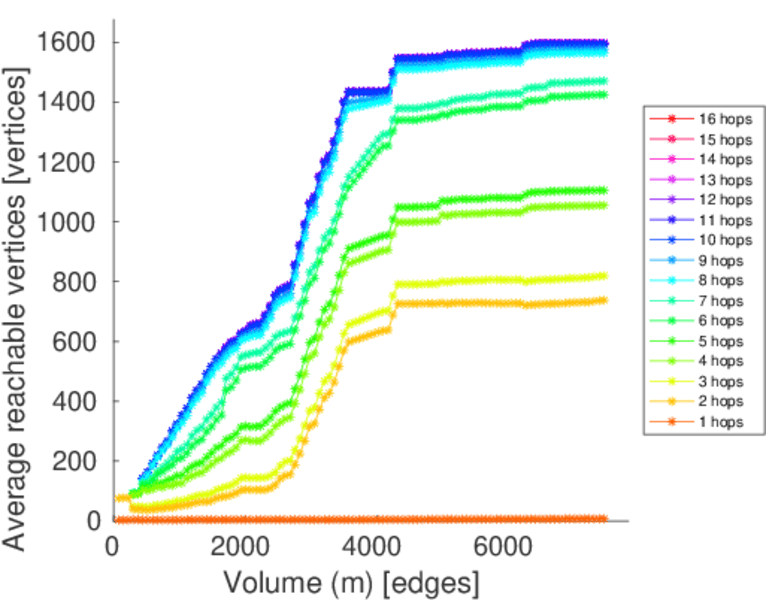
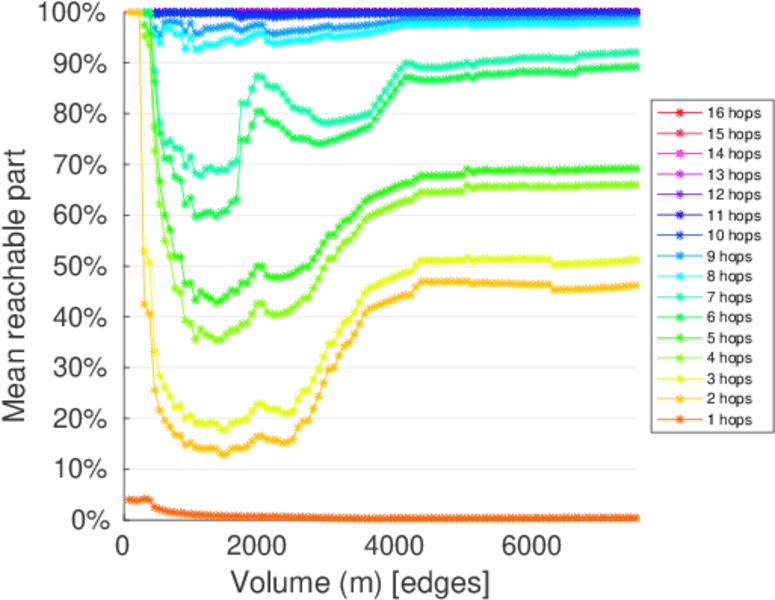
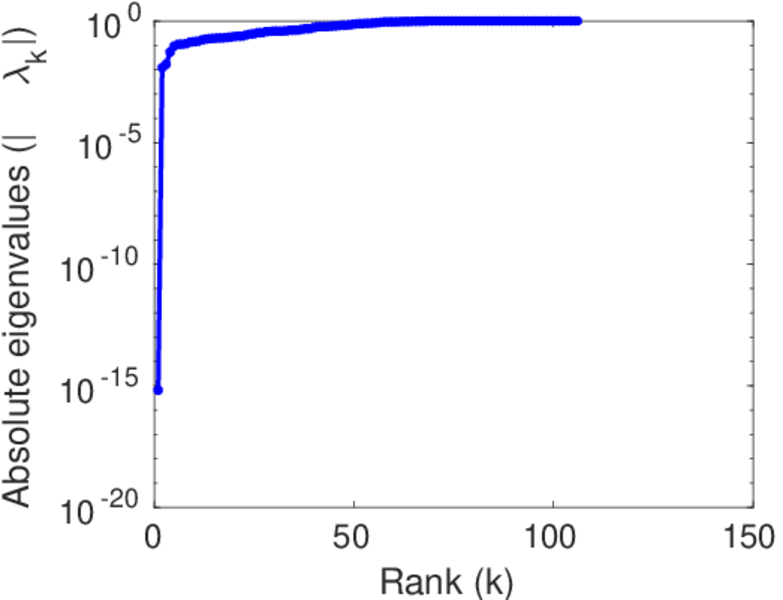
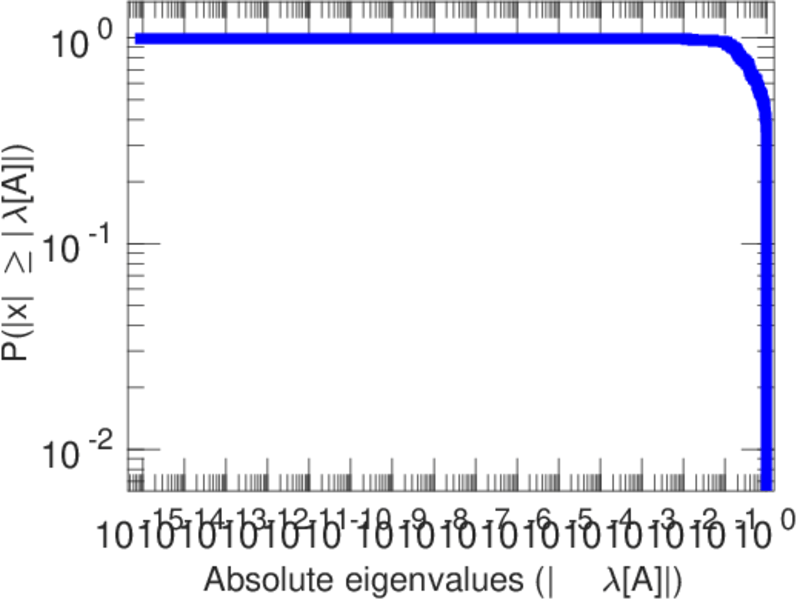
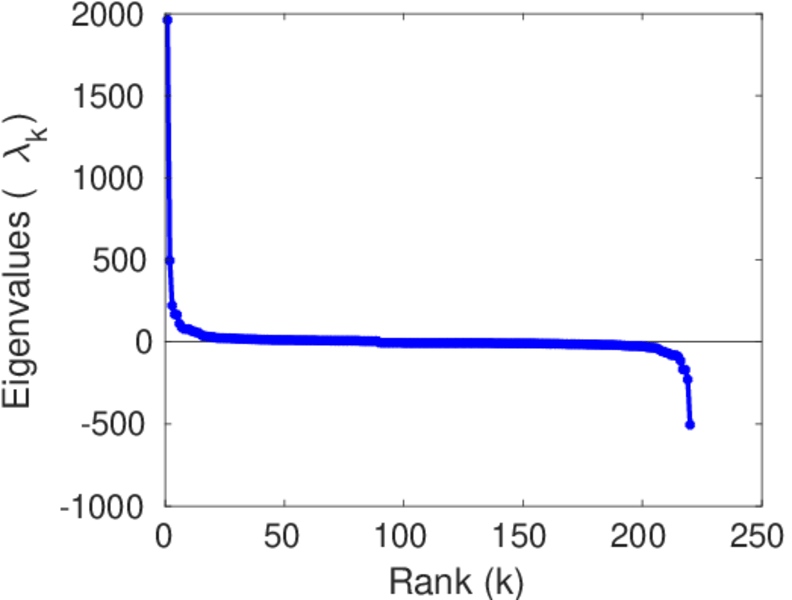
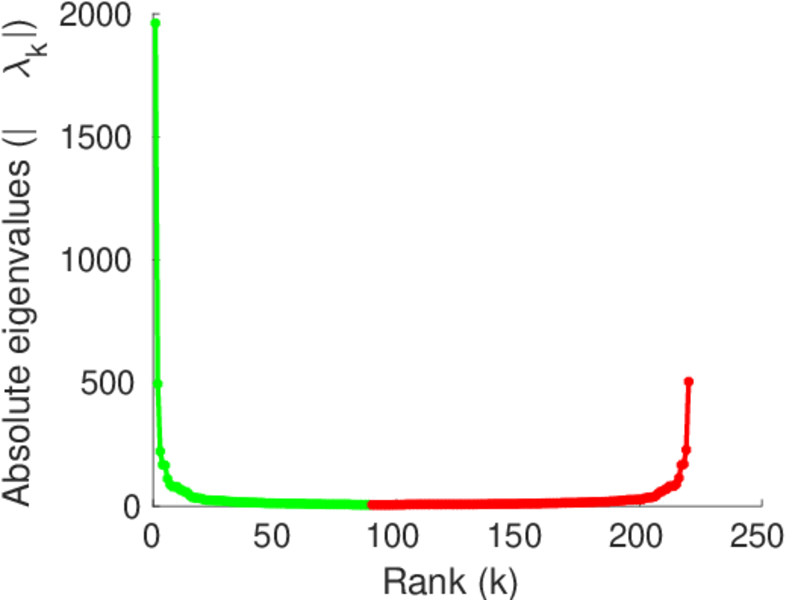
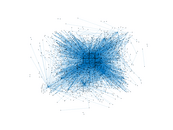
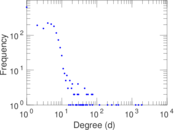
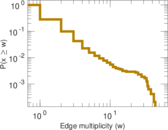
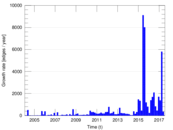
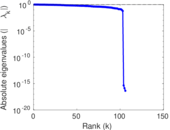
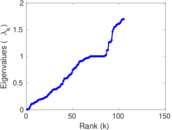
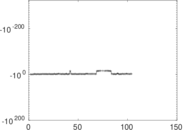
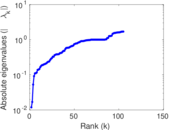
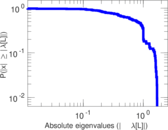
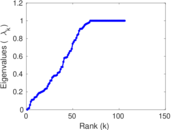
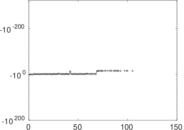
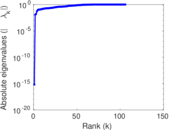
Plots


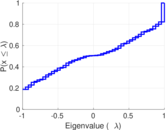
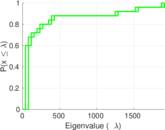
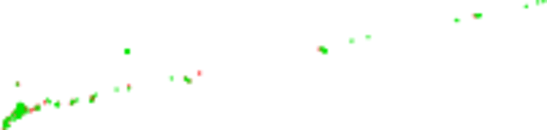


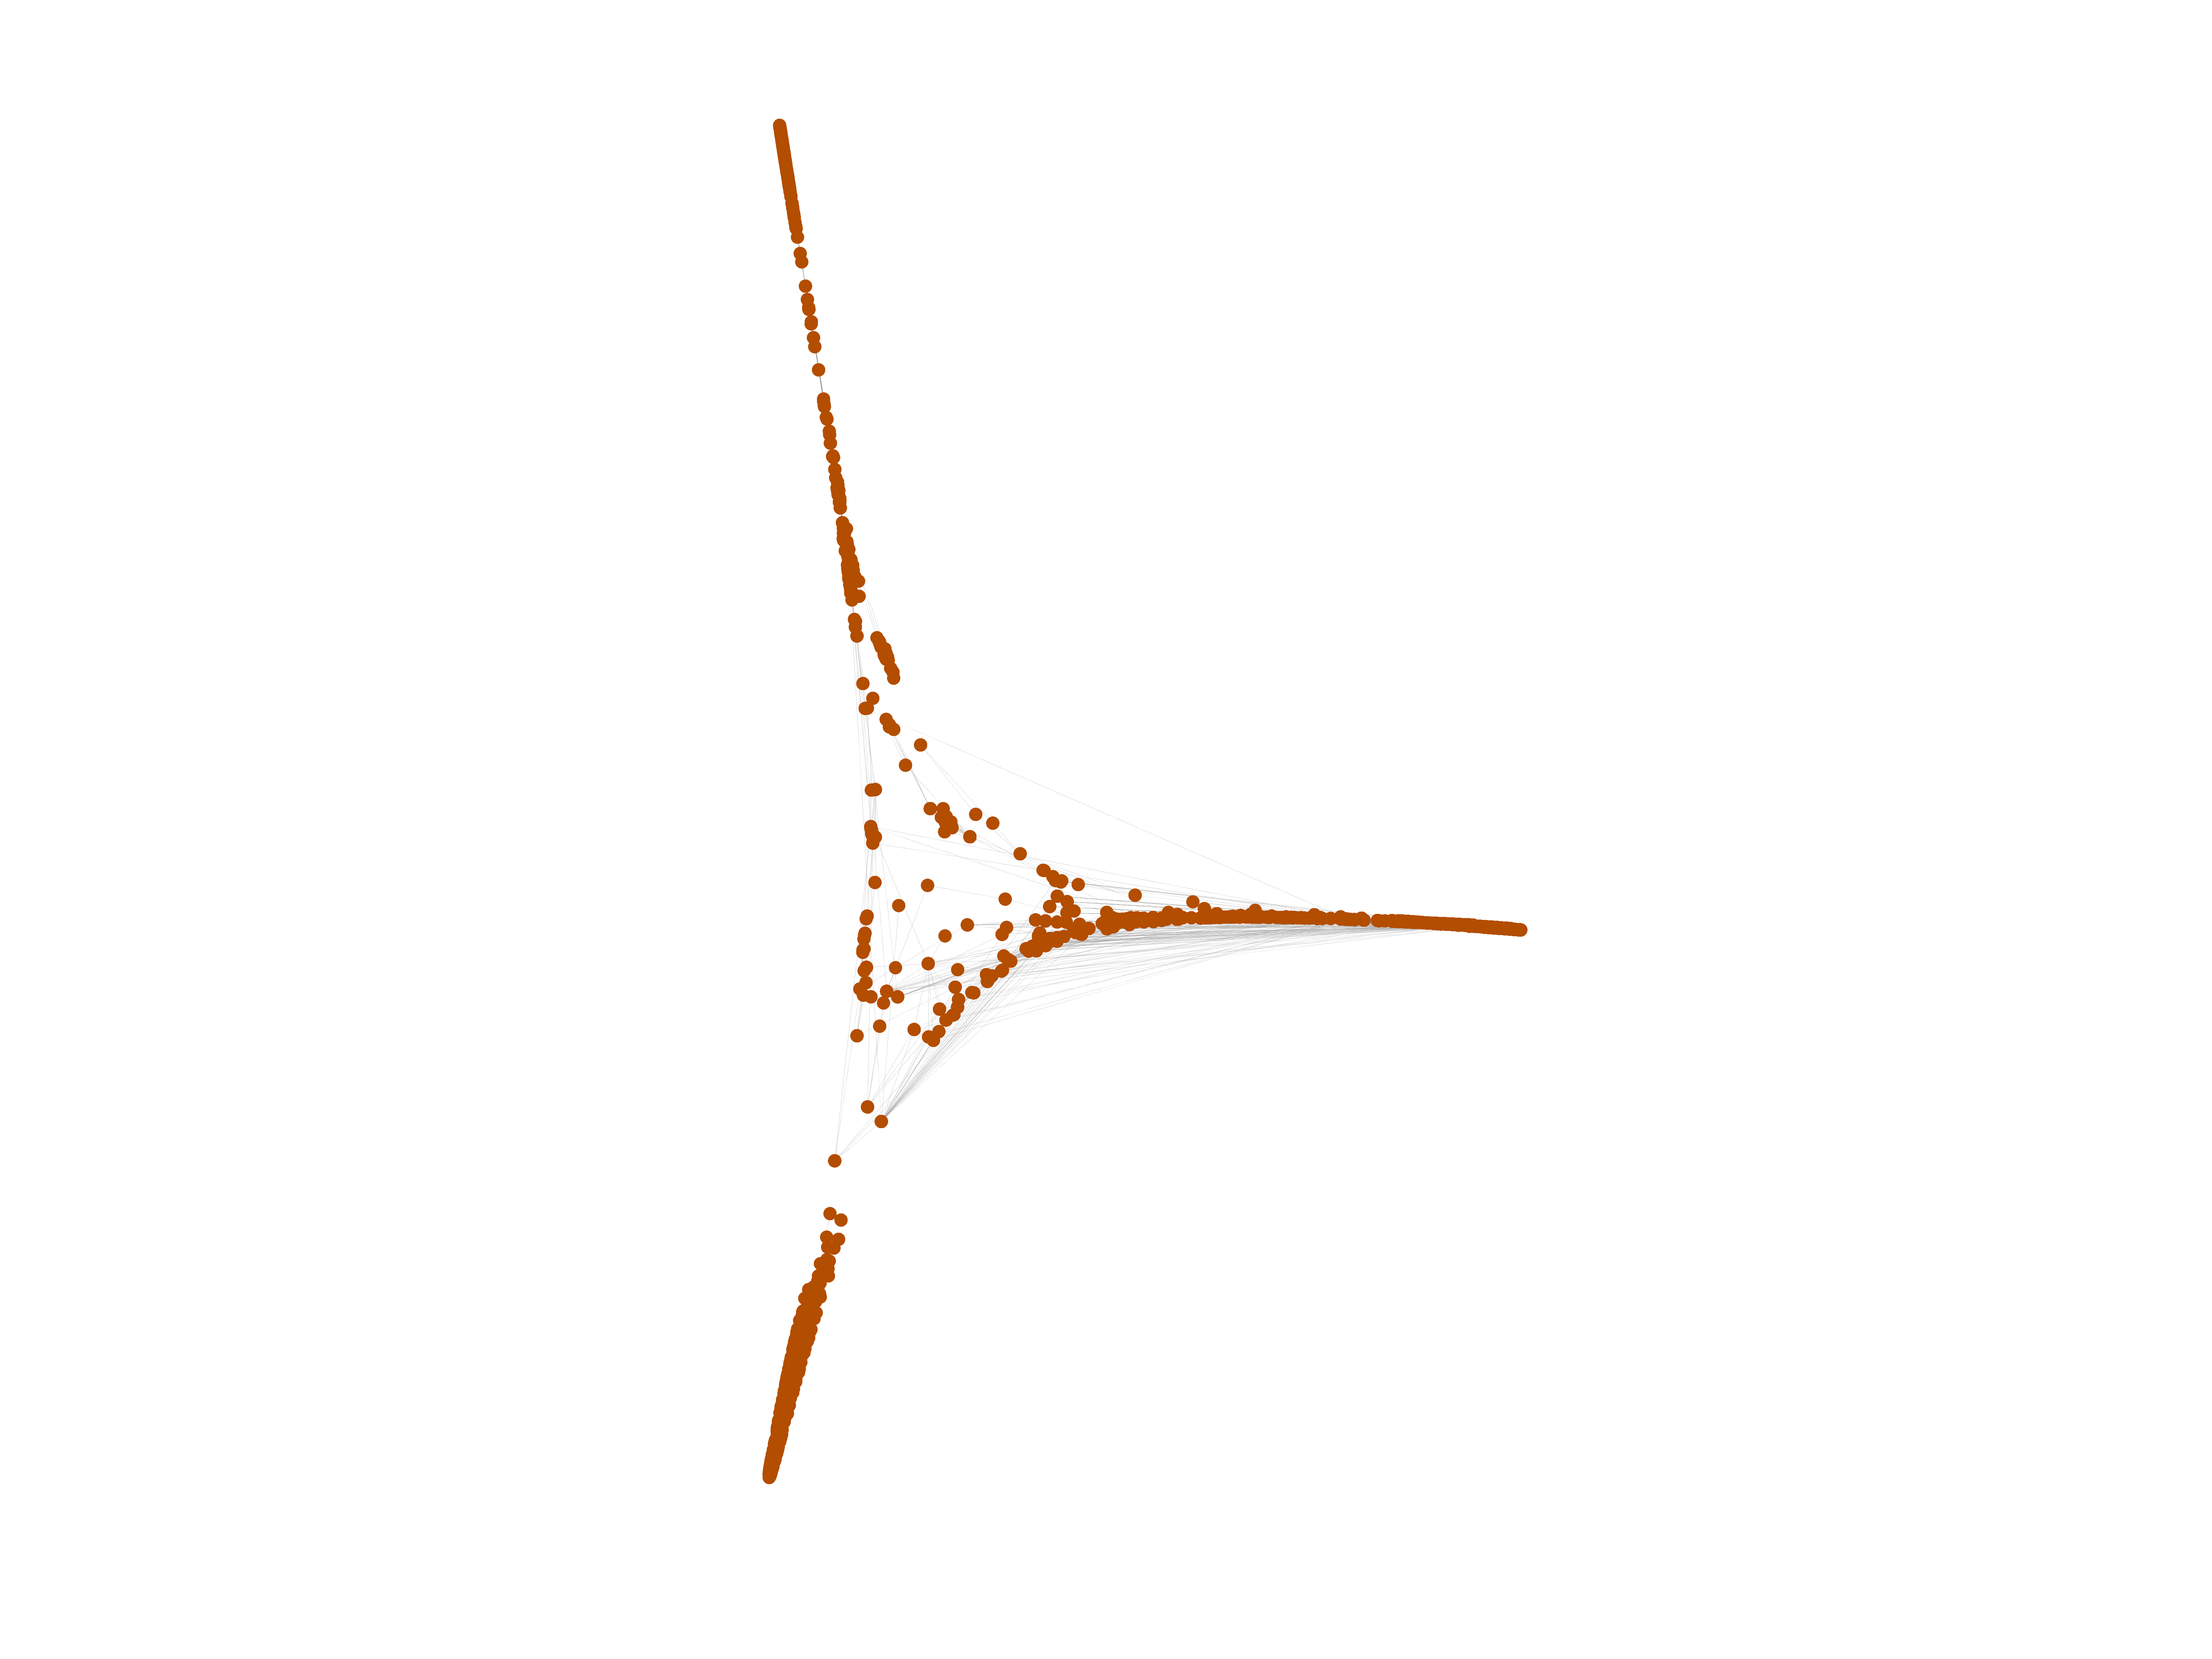
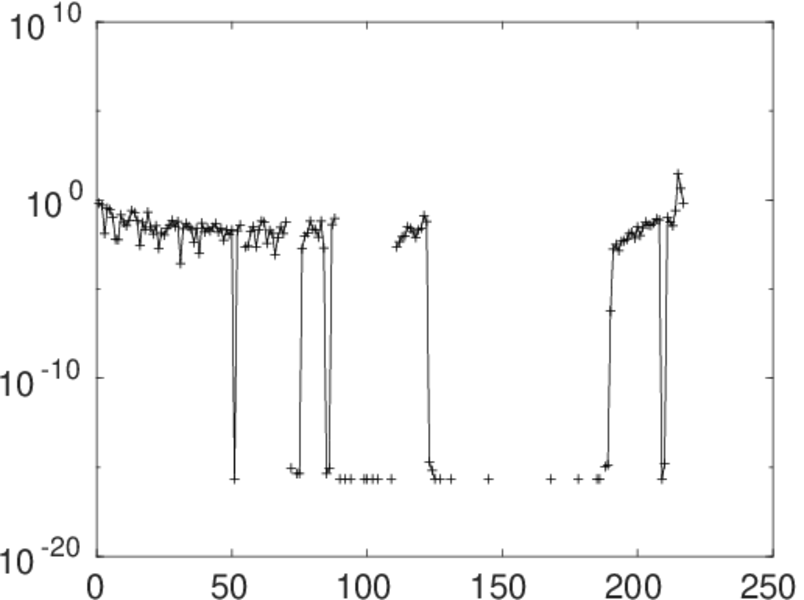
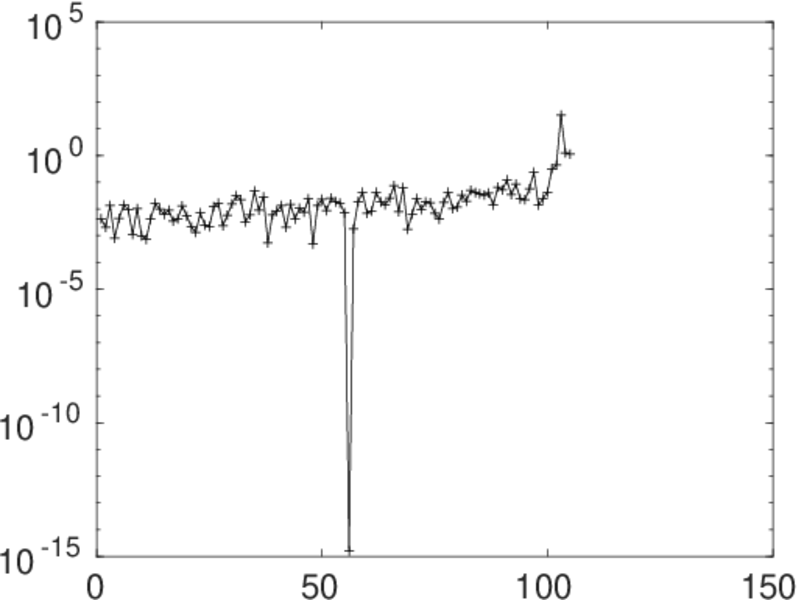
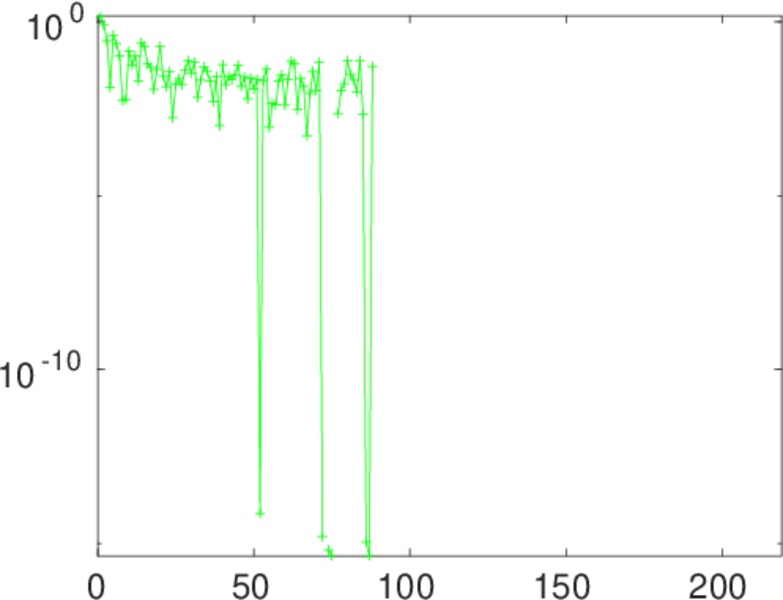
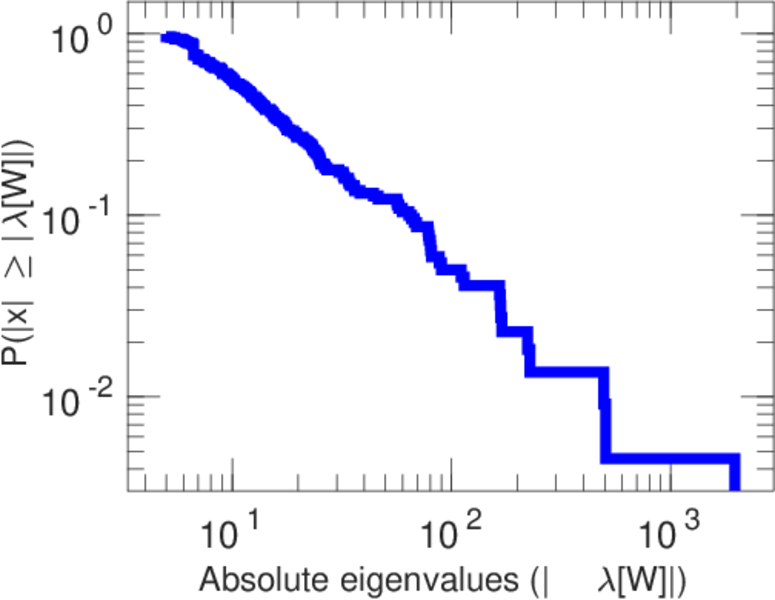
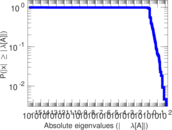
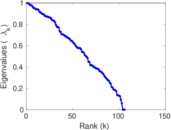
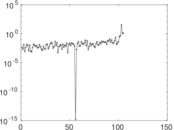
Matrix decompositions plots


Downloads
References
|
[1]
|
Jérôme Kunegis.
KONECT – The Koblenz Network Collection.
In Proc. Int. Conf. on World Wide Web Companion, pages
1343–1350, 2013.
[ http ]
|
|
[2]
|
Wikimedia Foundation.
Wikimedia downloads.
http://dumps.wikimedia.org/, January 2010.
|
 KONECT ‣ Networks ‣
Buy Me a Coffee
KONECT ‣ Networks ‣
Buy Me a Coffee