Wikipedia edits (azb)
This is the bipartite edit network of the تۆرکجه Wikipedia. It contains
users and pages from the تۆرکجه Wikipedia, connected by edit events. Each
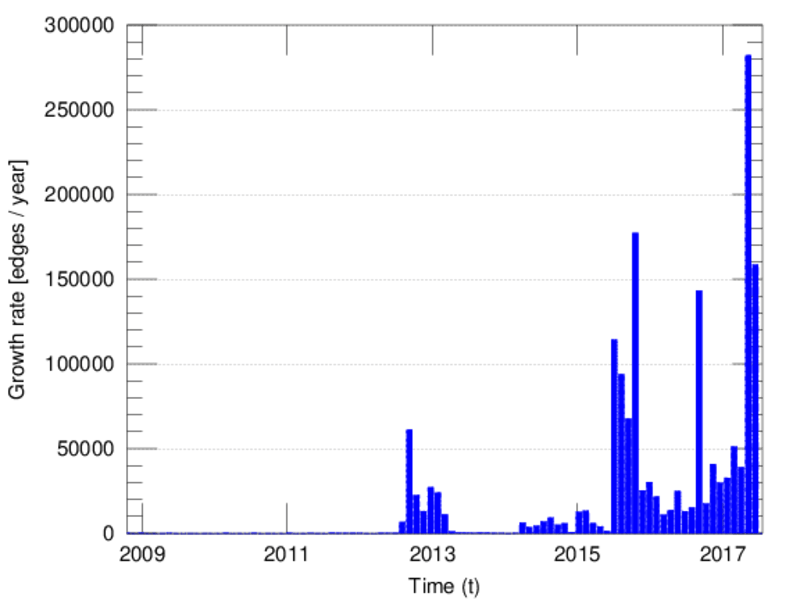
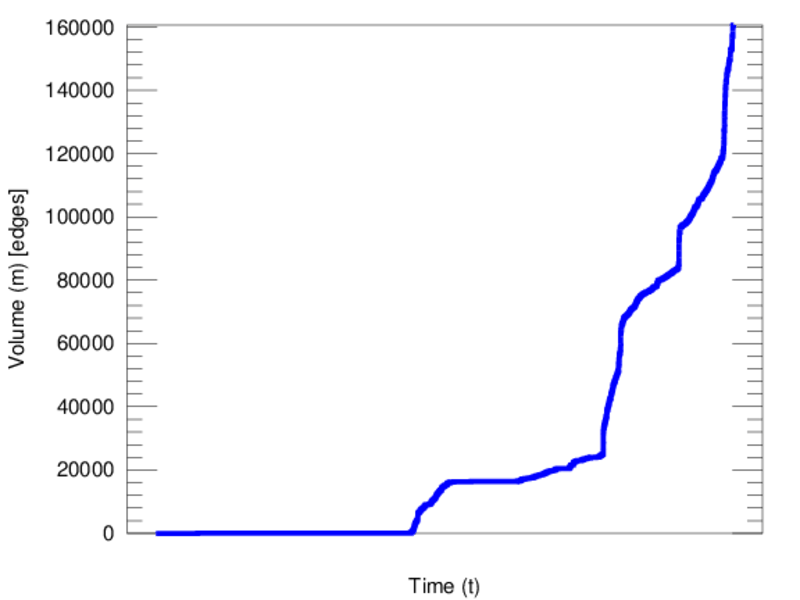
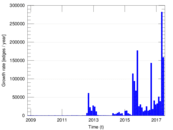
edge represents an edit. The dataset includes the timestamp of each edit.
Metadata
Statistics
| Size | n = | 44,365
|
| Left size | n1 = | 532
|
| Right size | n2 = | 43,833
|
| Volume | m = | 160,629
|
| Unique edge count | m̿ = | 78,268
|
| Wedge count | s = | 363,622,966
|
| Claw count | z = | 2,048,303,918,082
|
| Cross count | x = | 10,185,714,734,230,260
|
| Square count | q = | 43,799,679
|
| 4-Tour count | T4 = | 1,805,096,496
|
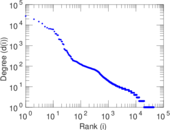
| Maximum degree | dmax = | 27,451
|
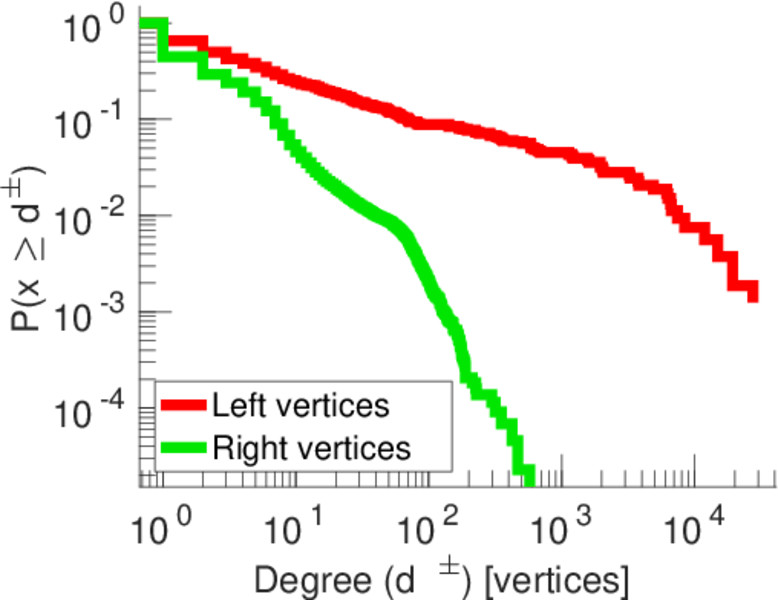
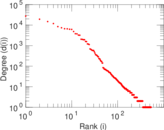
| Maximum left degree | d1max = | 27,451
|
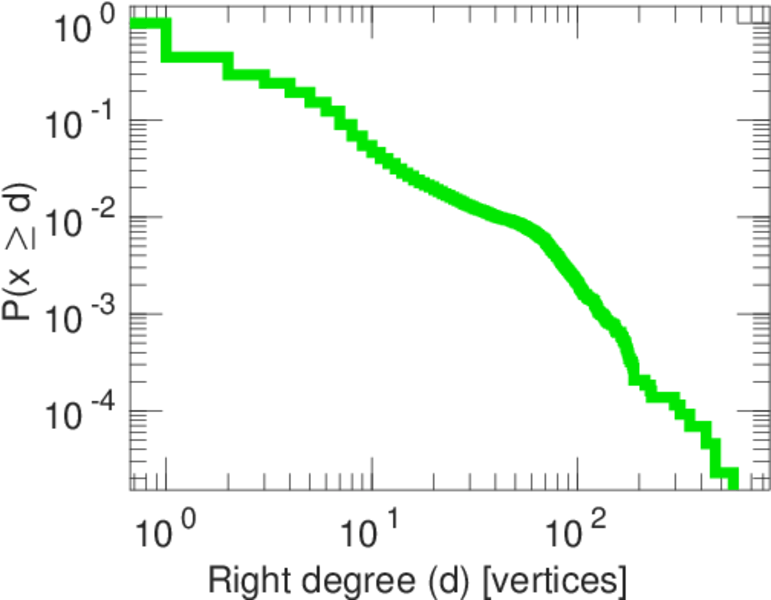
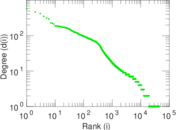
| Maximum right degree | d2max = | 573
|
| Average degree | d = | 7.241 25
|
| Average left degree | d1 = | 301.934
|
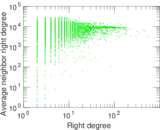
| Average right degree | d2 = | 3.664 57
|
| Fill | p = | 0.003 356 38
|
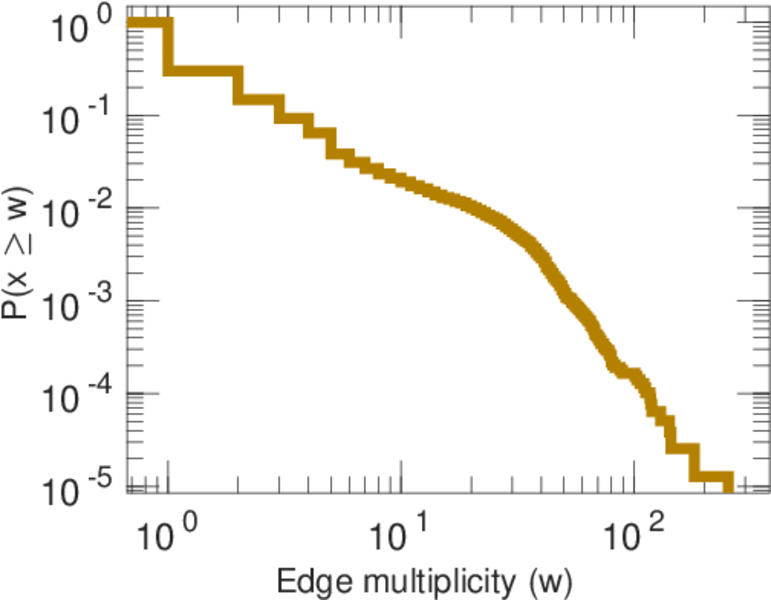
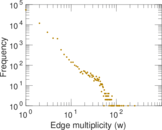
| Average edge multiplicity | m̃ = | 2.052 29
|
| Size of LCC | N = | 44,019
|
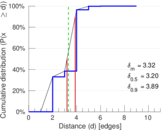
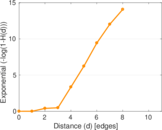
| Diameter | δ = | 11
|
| 50-Percentile effective diameter | δ0.5 = | 3.198 38
|
| 90-Percentile effective diameter | δ0.9 = | 3.888 08
|
| Median distance | δM = | 4
|
| Mean distance | δm = | 3.321 72
|
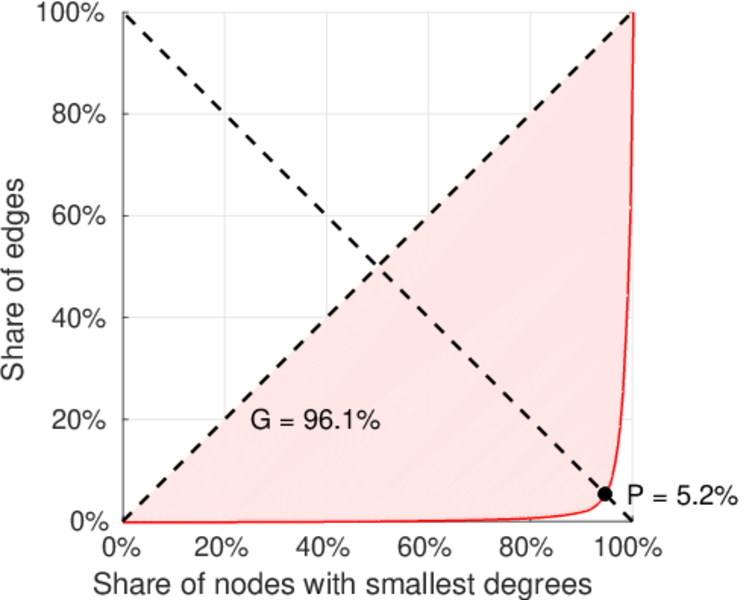
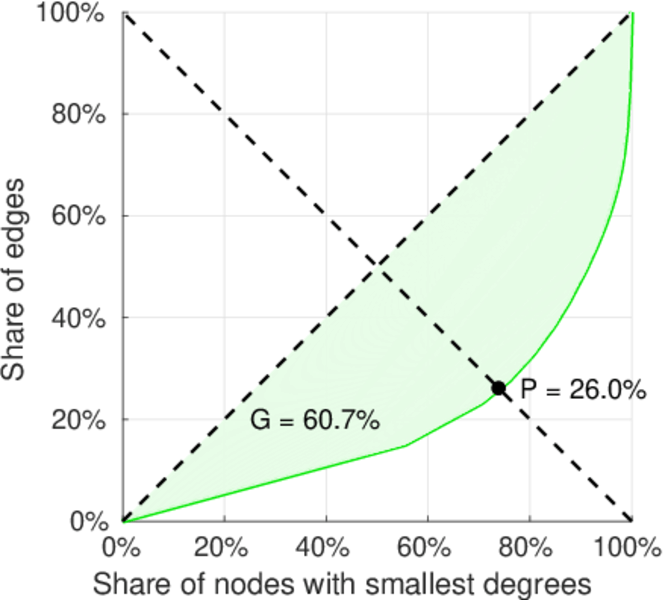
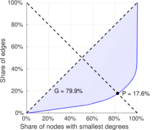
| Gini coefficient | G = | 0.802 109
|
| Balanced inequality ratio | P = | 0.172 889
|
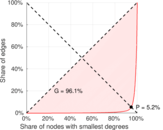
| Left balanced inequality ratio | P1 = | 0.051 914 7
|
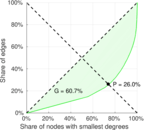
| Right balanced inequality ratio | P2 = | 0.259 959
|
| Relative edge distribution entropy | Her = | 0.686 831
|
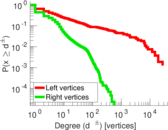
| Power law exponent | γ = | 3.682 52
|
| Tail power law exponent | γt = | 2.301 00
|
| Tail power law exponent with p | γ3 = | 2.301 00
|
| p-value | p = | 0.000 00
|
| Left tail power law exponent with p | γ3,1 = | 1.601 00
|
| Left p-value | p1 = | 0.001 000 00
|
| Right tail power law exponent with p | γ3,2 = | 4.551 00
|
| Right p-value | p2 = | 0.000 00
|
| Degree assortativity | ρ = | −0.418 852
|
| Degree assortativity p-value | pρ = | 0.000 00
|
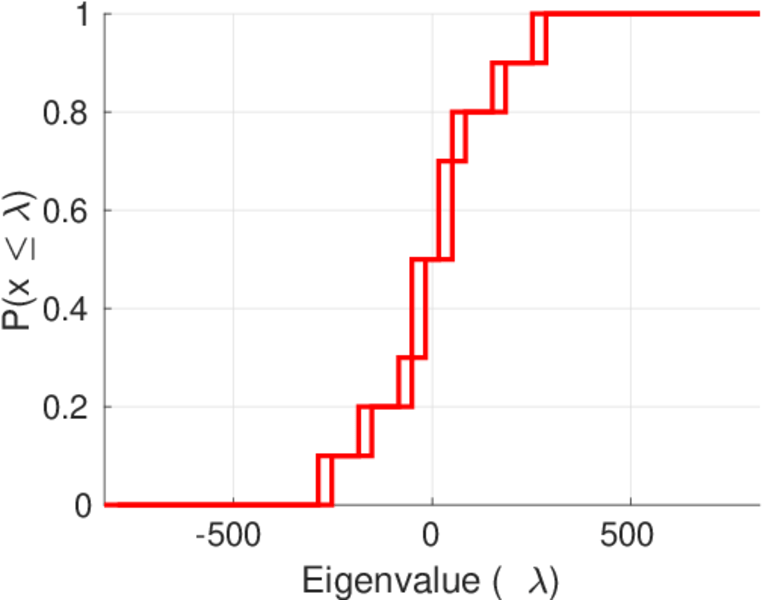
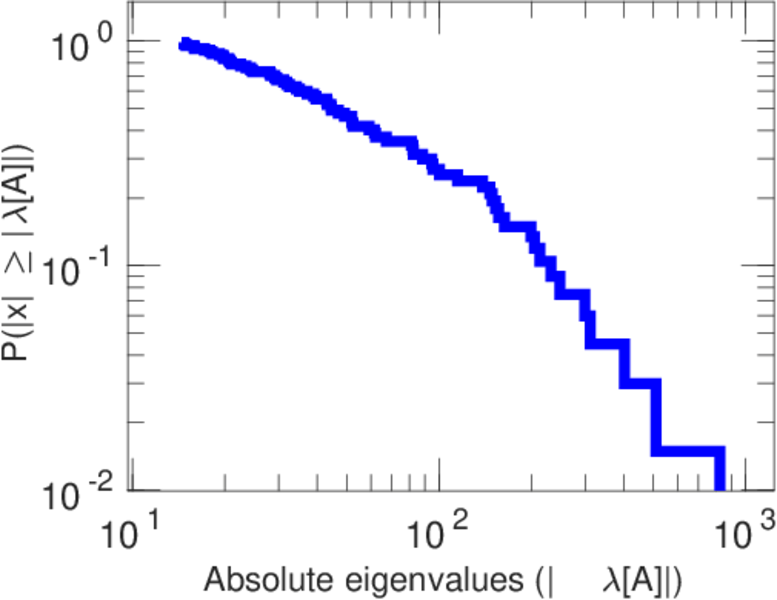
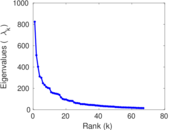
| Spectral norm | α = | 823.914
|
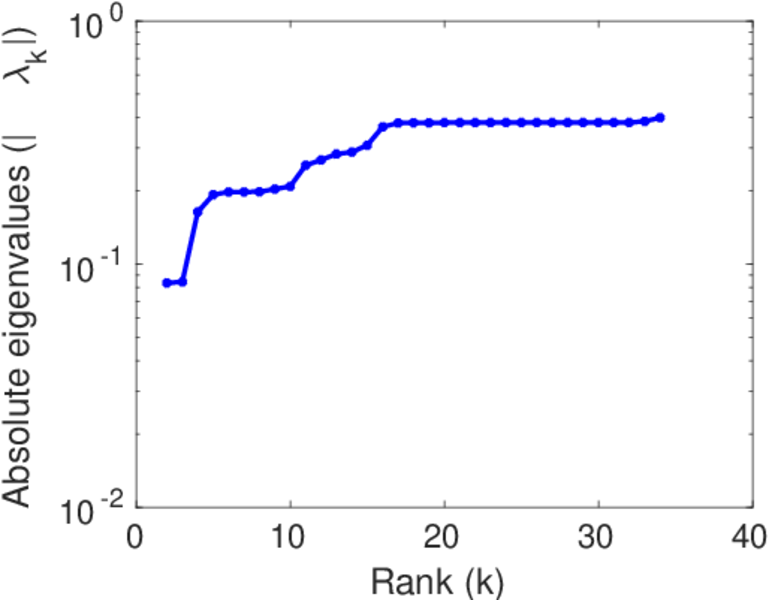
| Algebraic connectivity | a = | 0.083 634 7
|
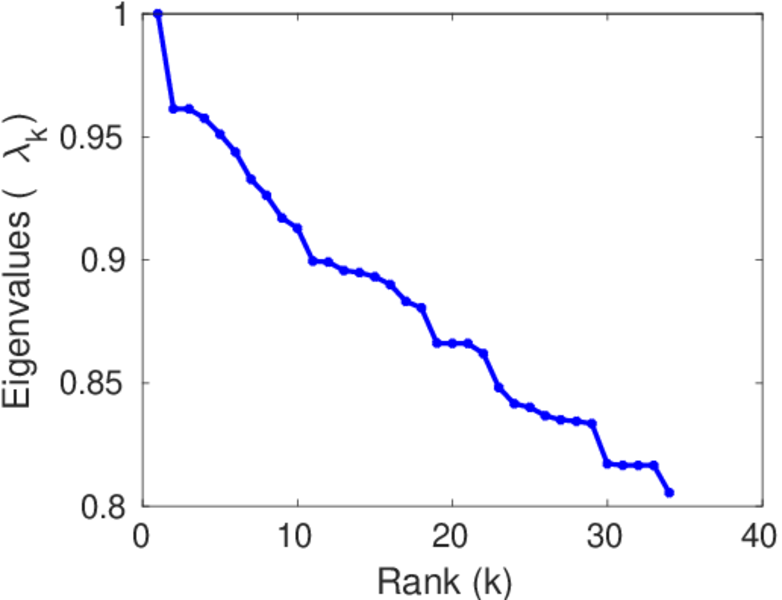
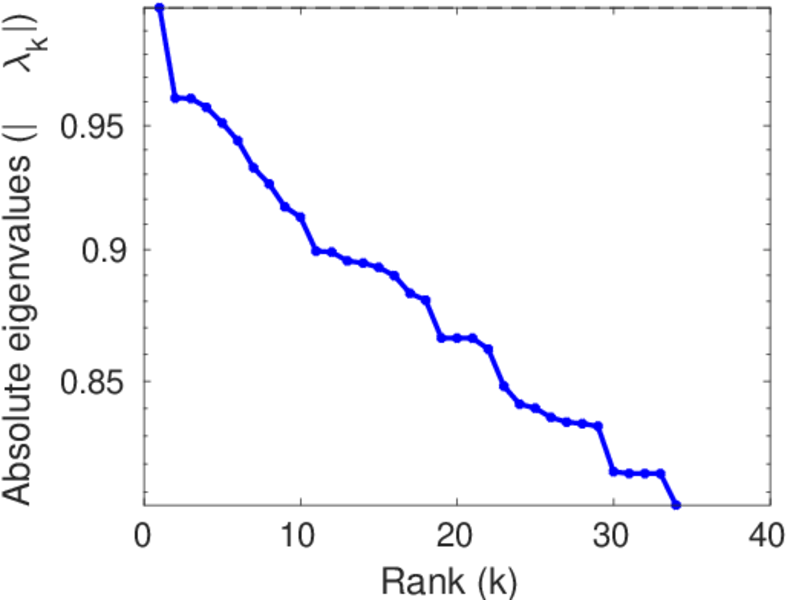
| Spectral separation | |λ1[A] / λ2[A]| = | 1.614 00
|
| Controllability | C = | 43,142
|
| Relative controllability | Cr = | 0.977 700
|
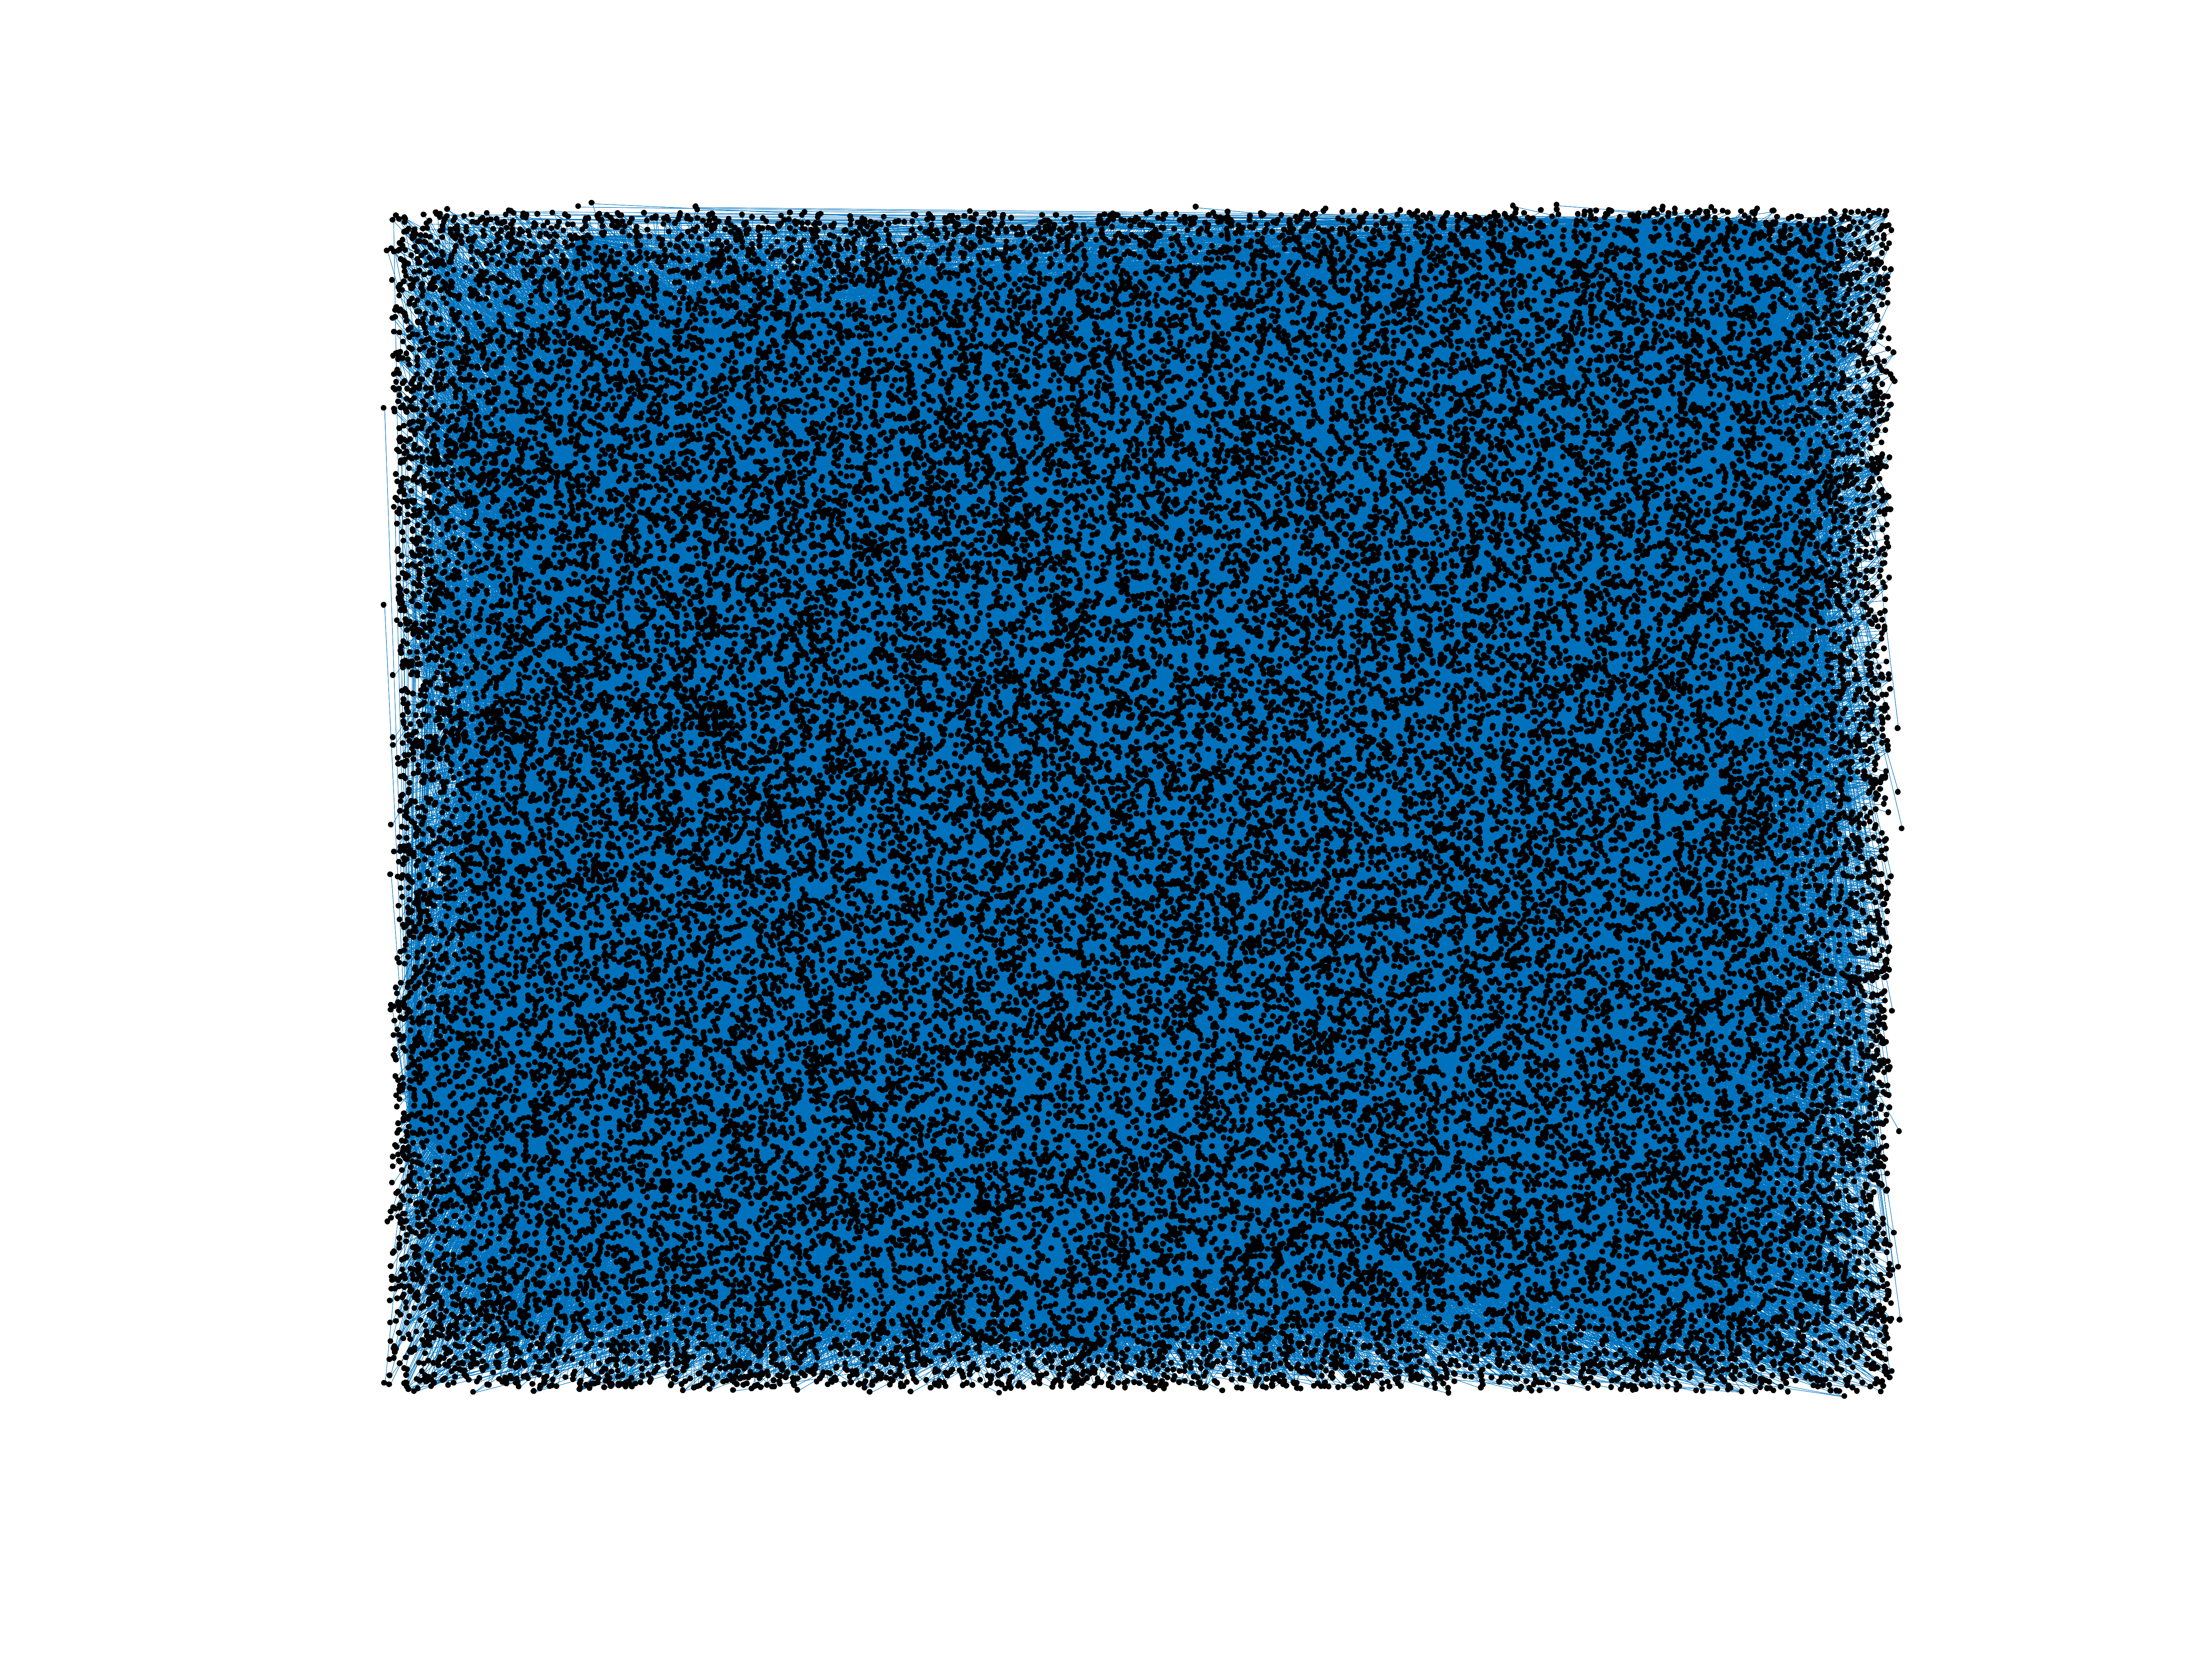
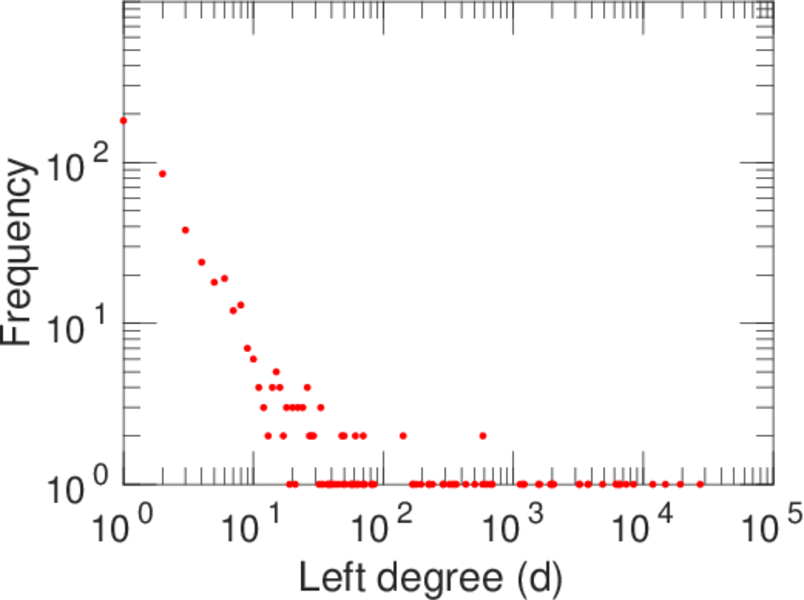
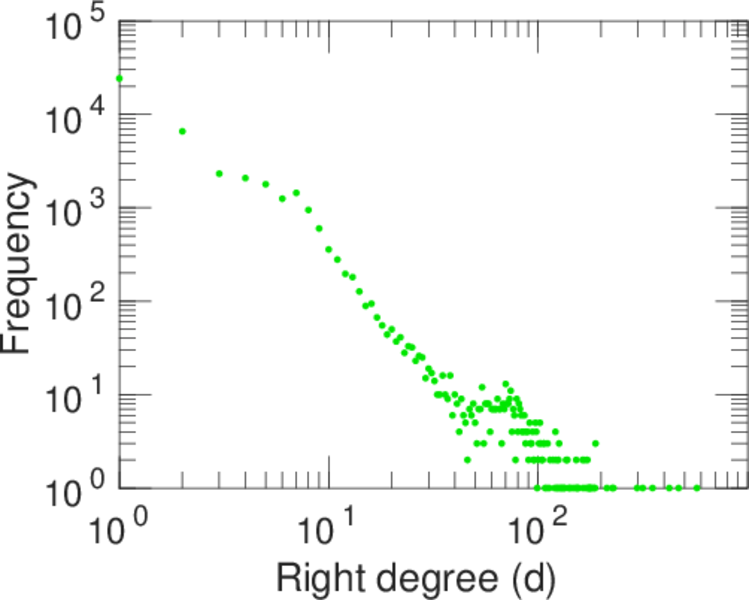
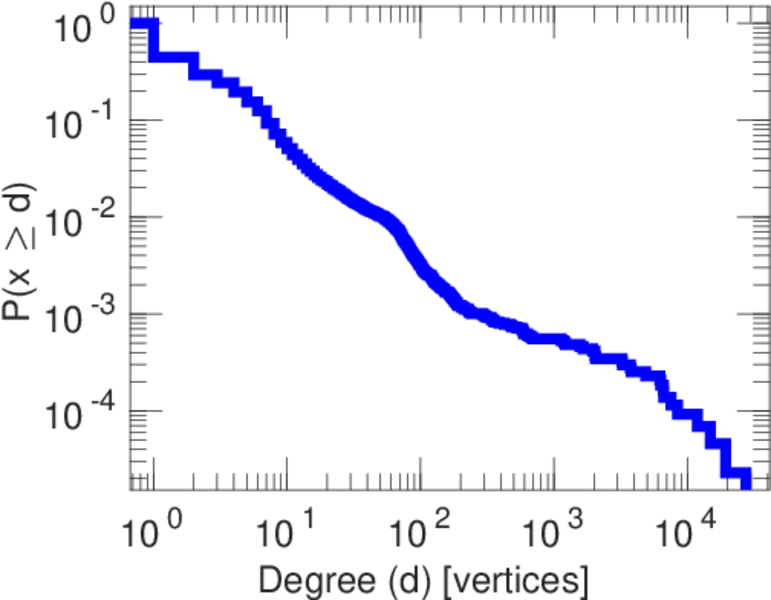
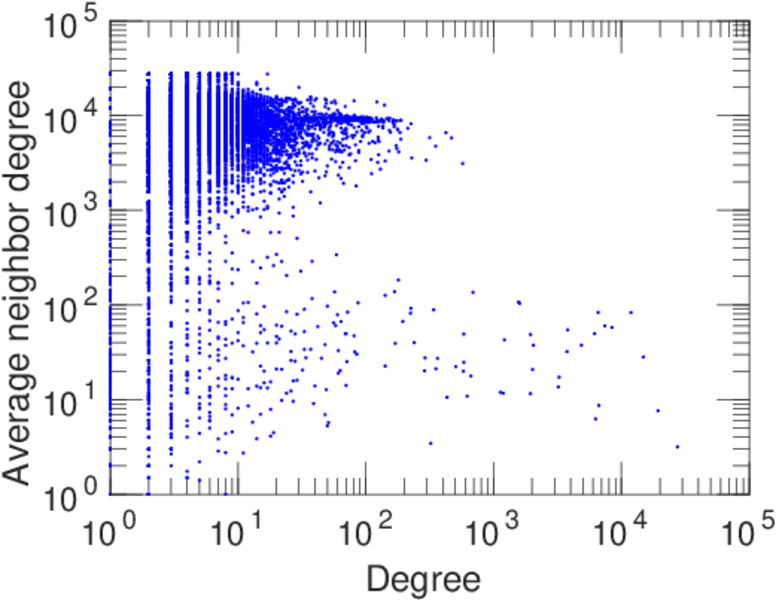
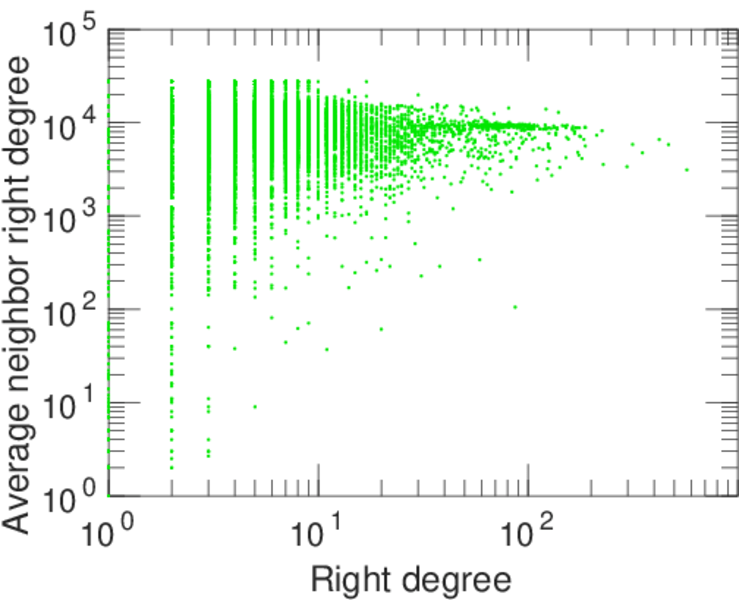
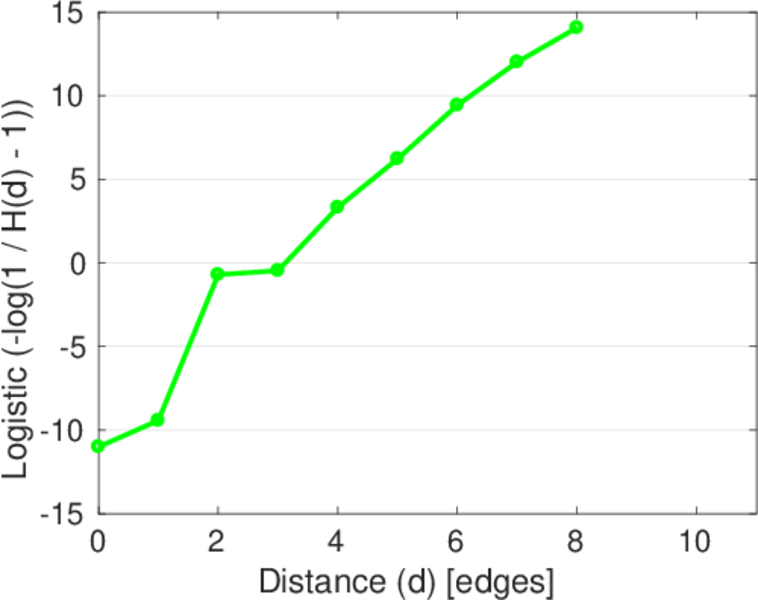
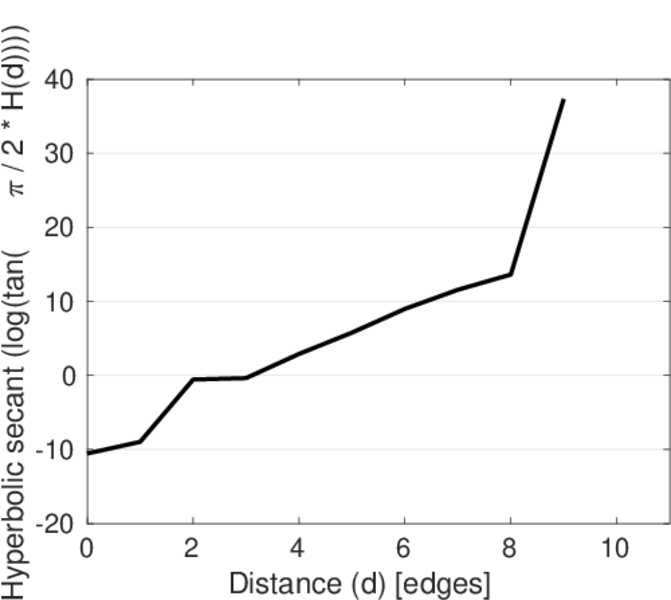
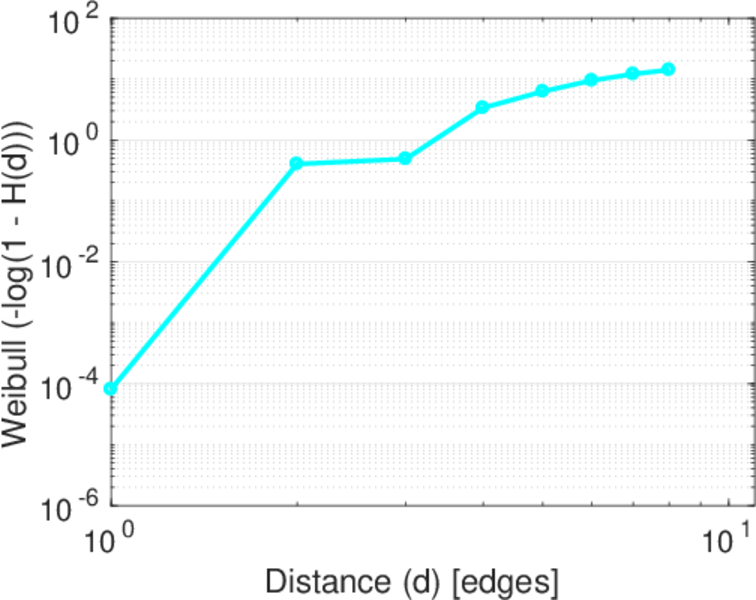
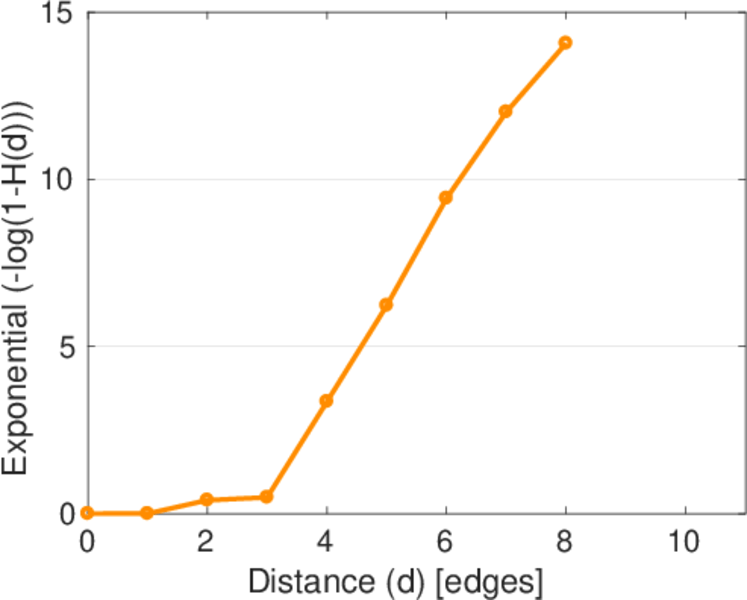
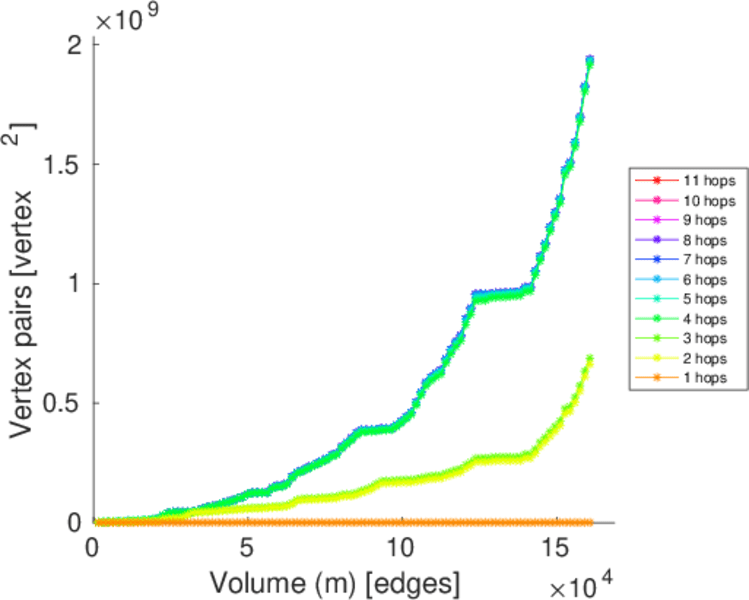
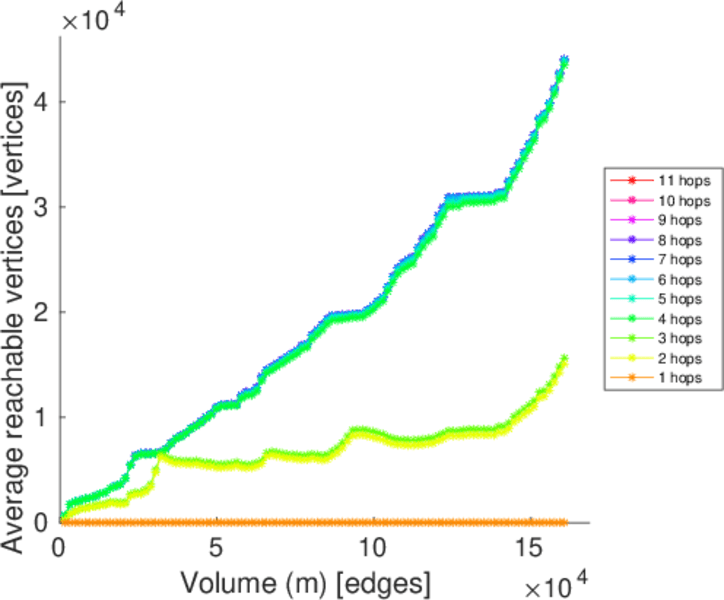
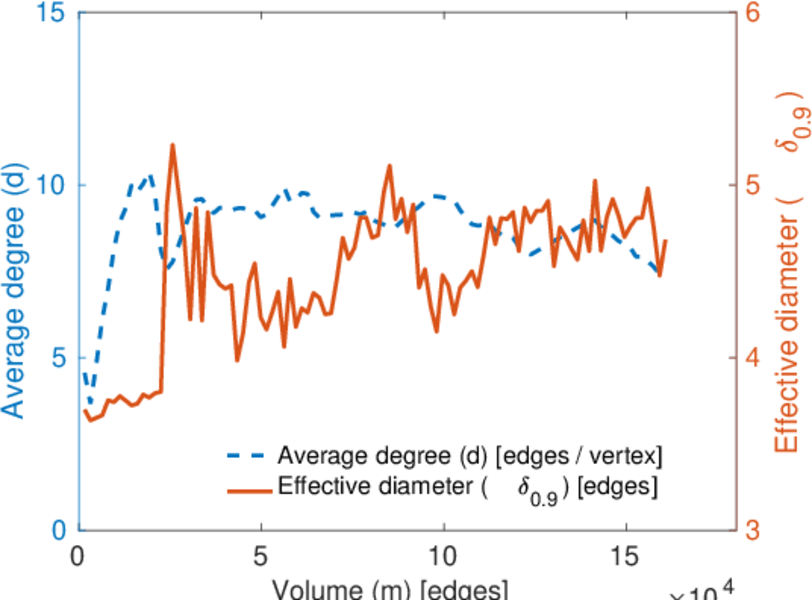
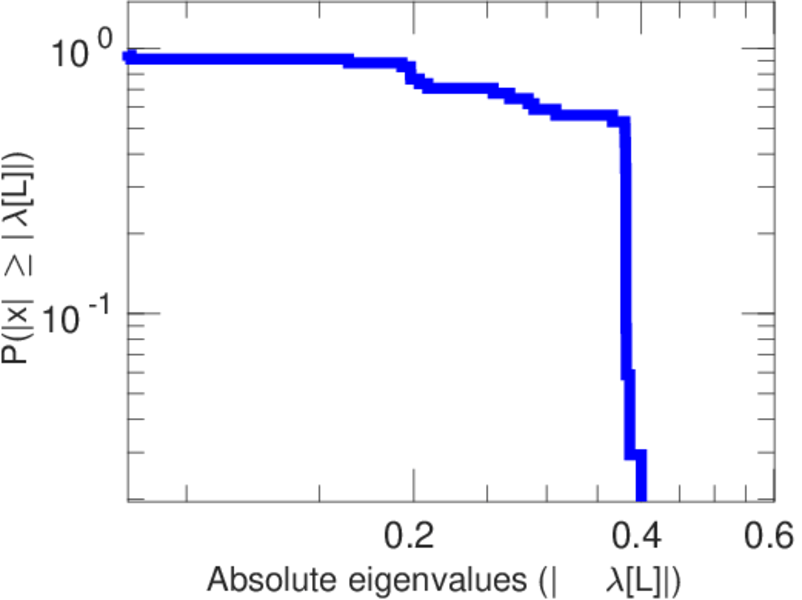
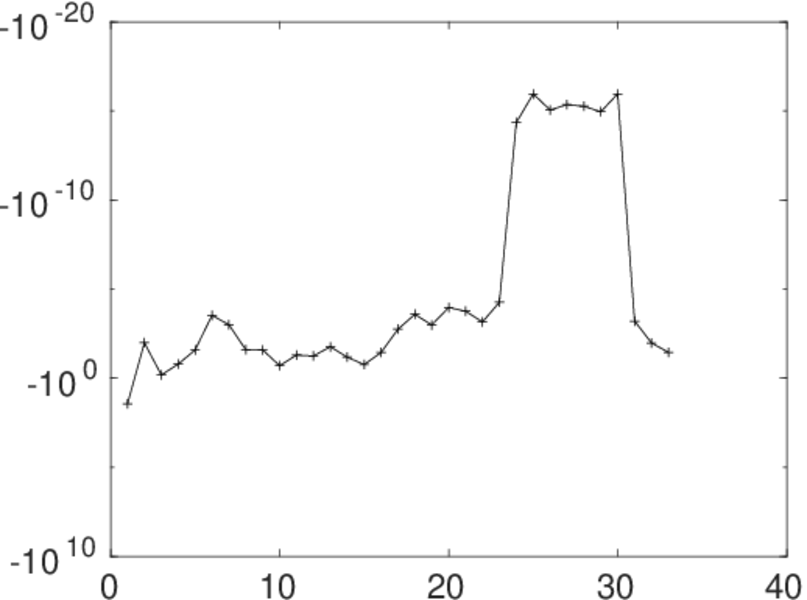
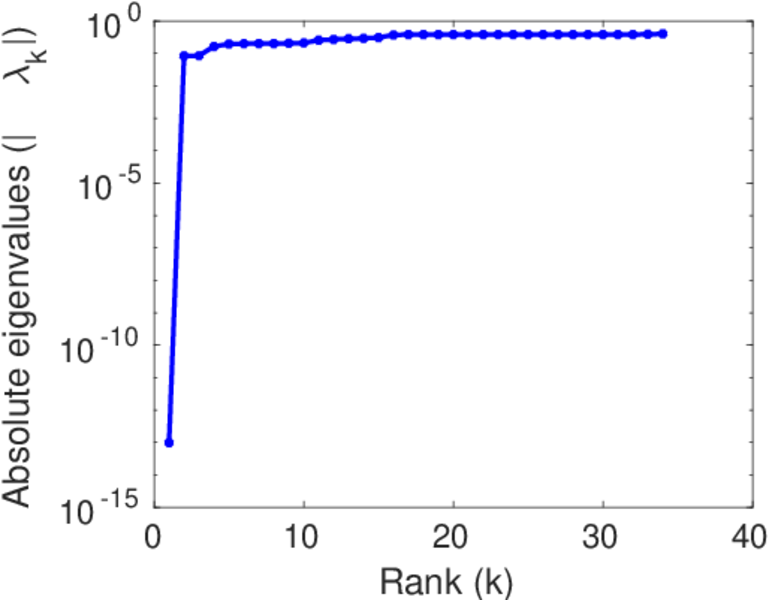
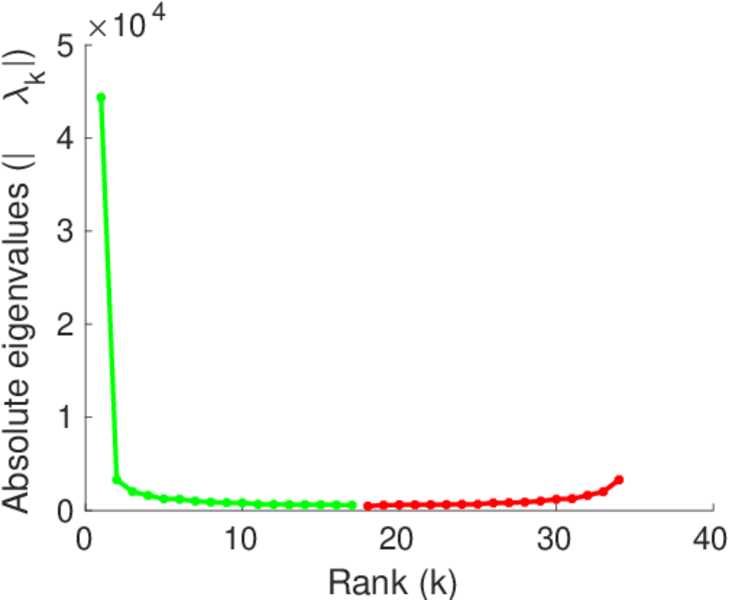
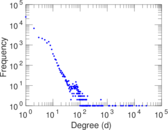
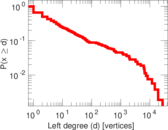
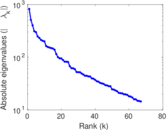
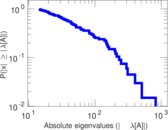
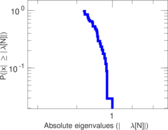
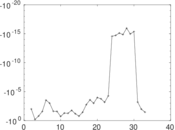
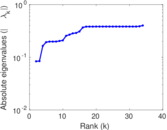
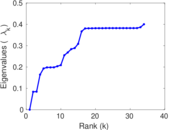
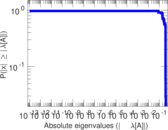
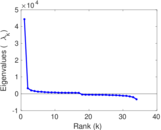
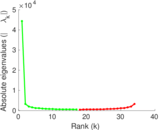
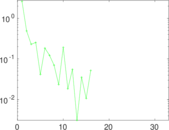
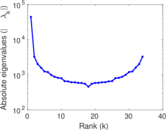
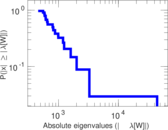
Plots


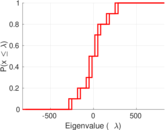

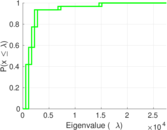
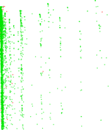

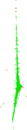


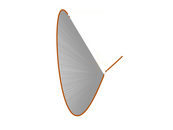


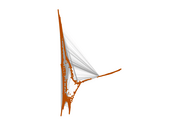


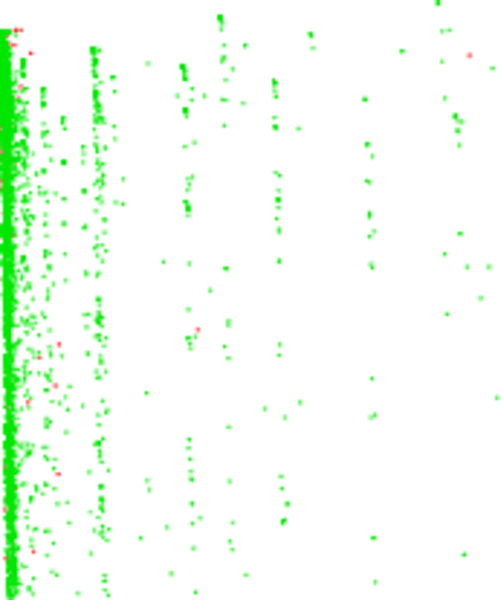
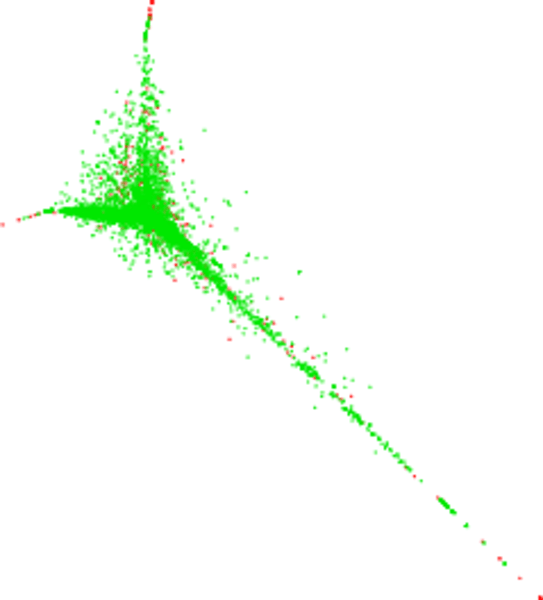
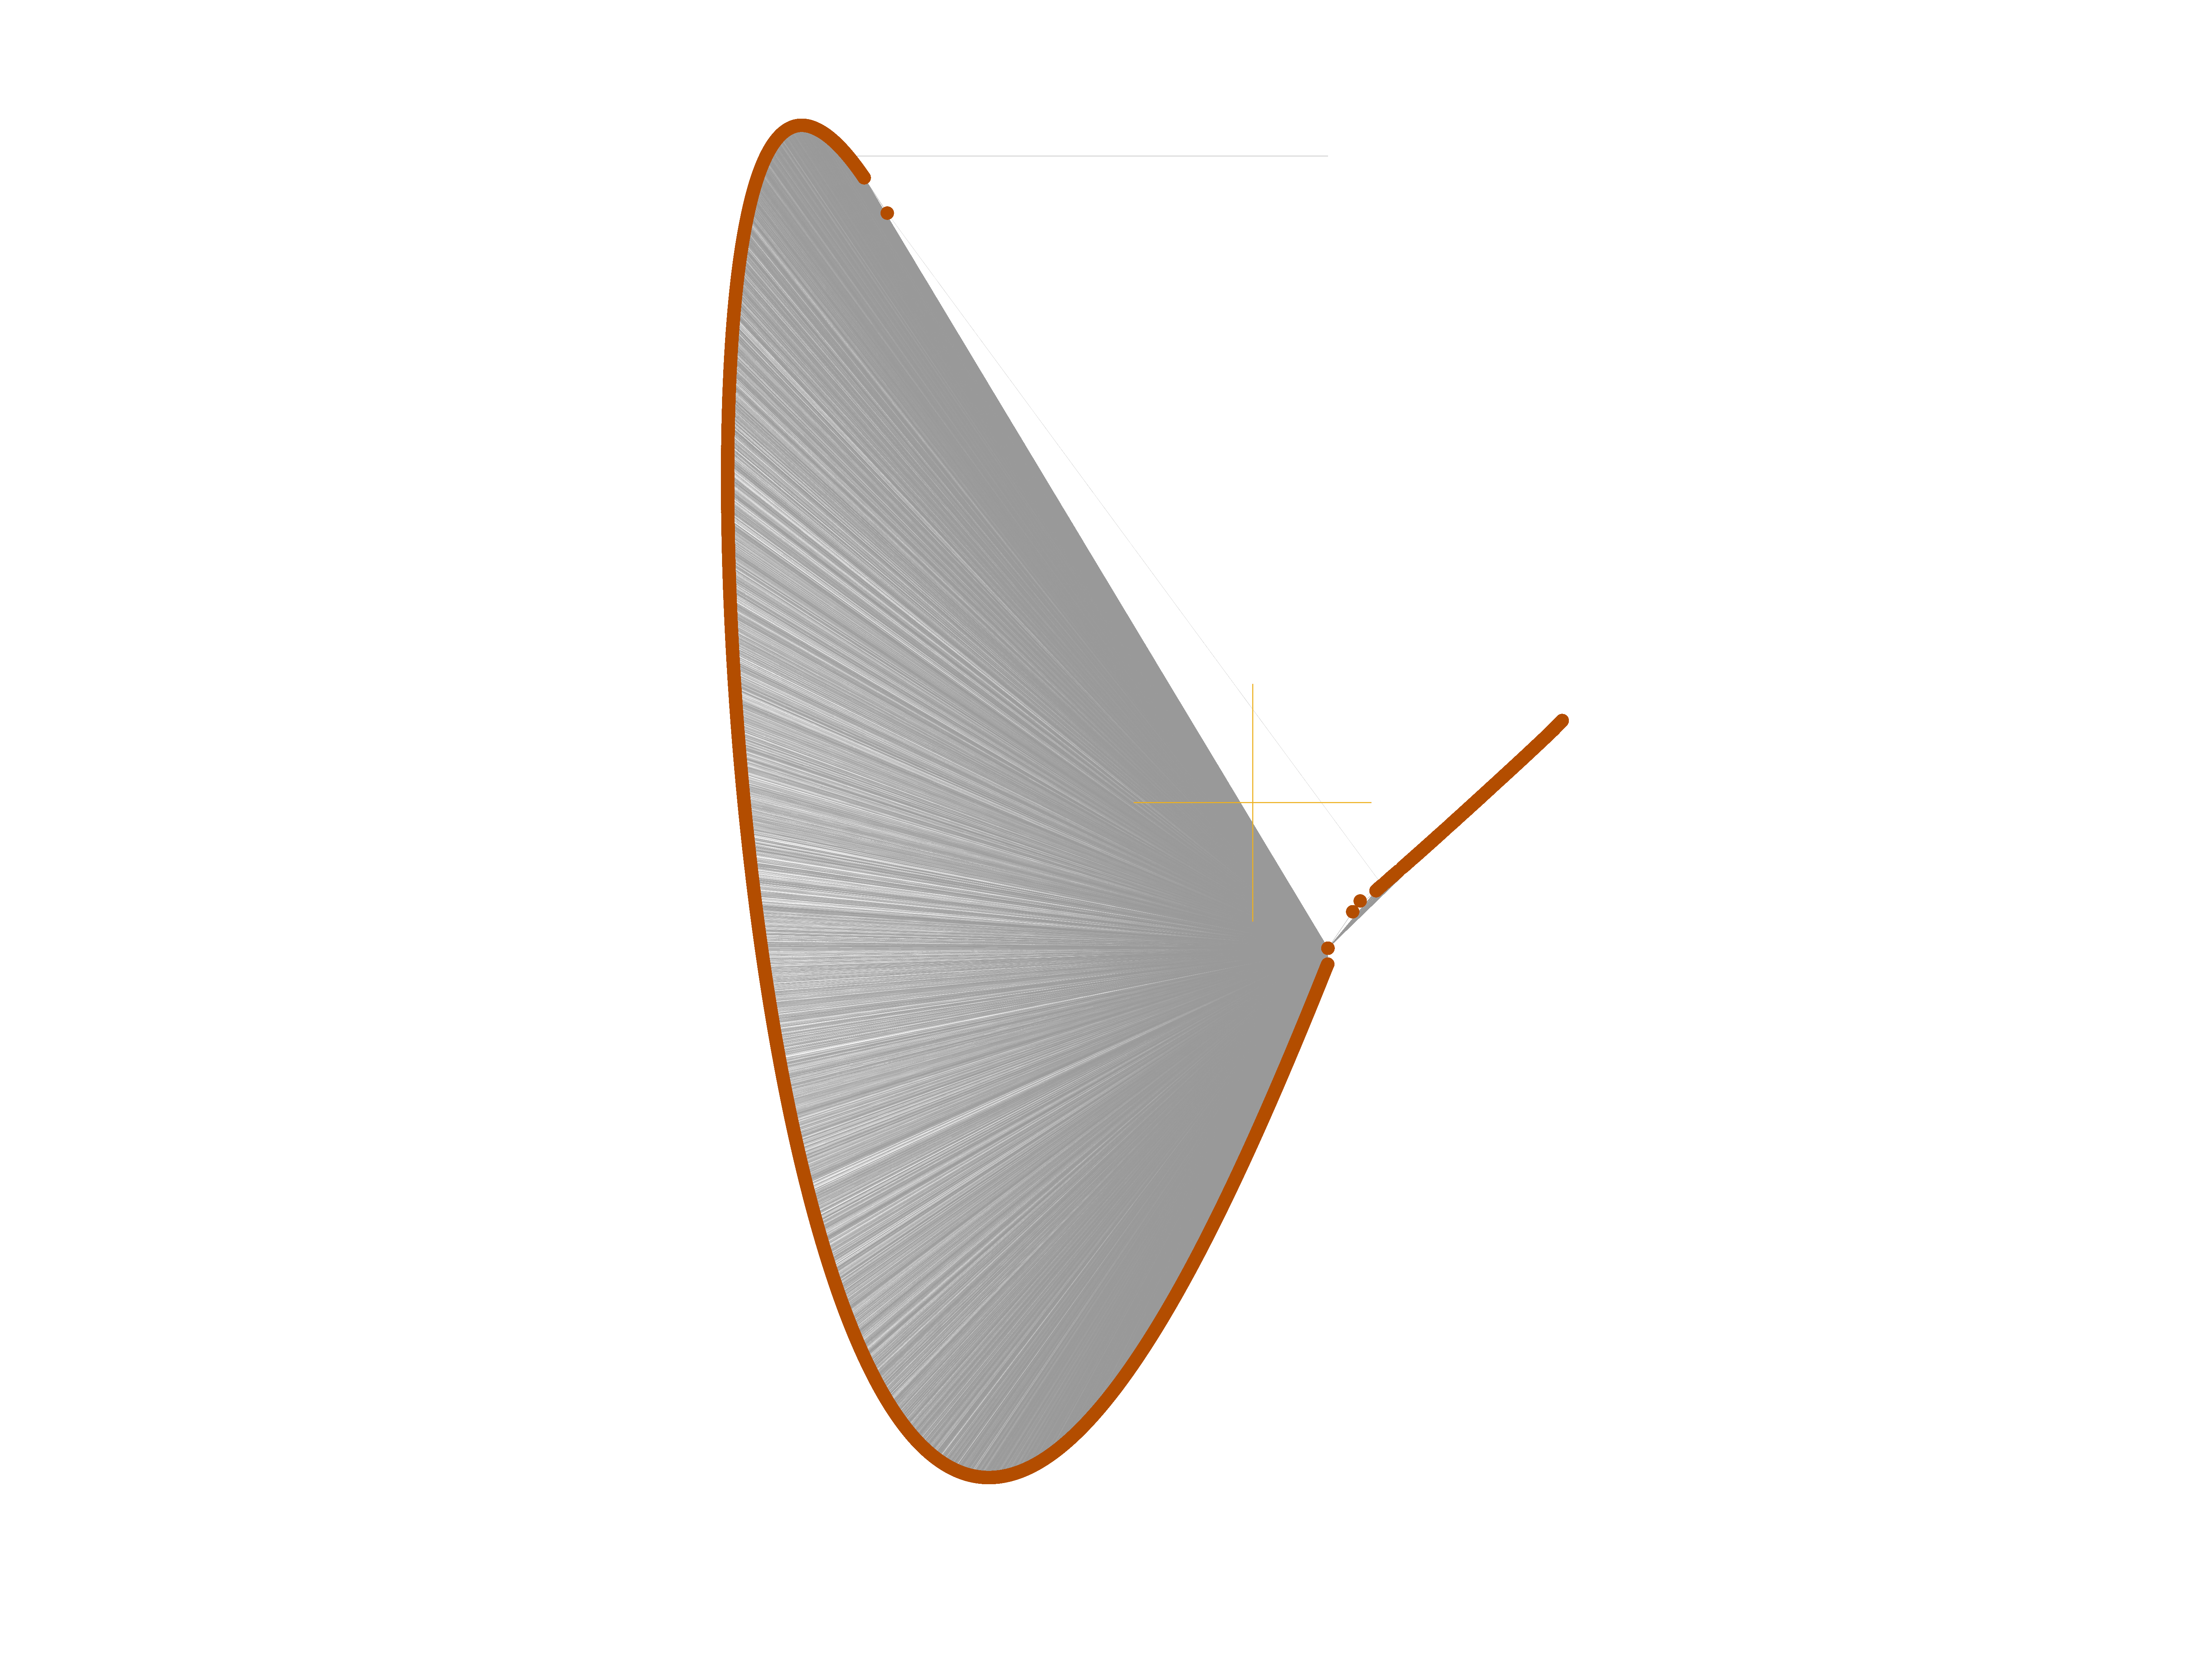
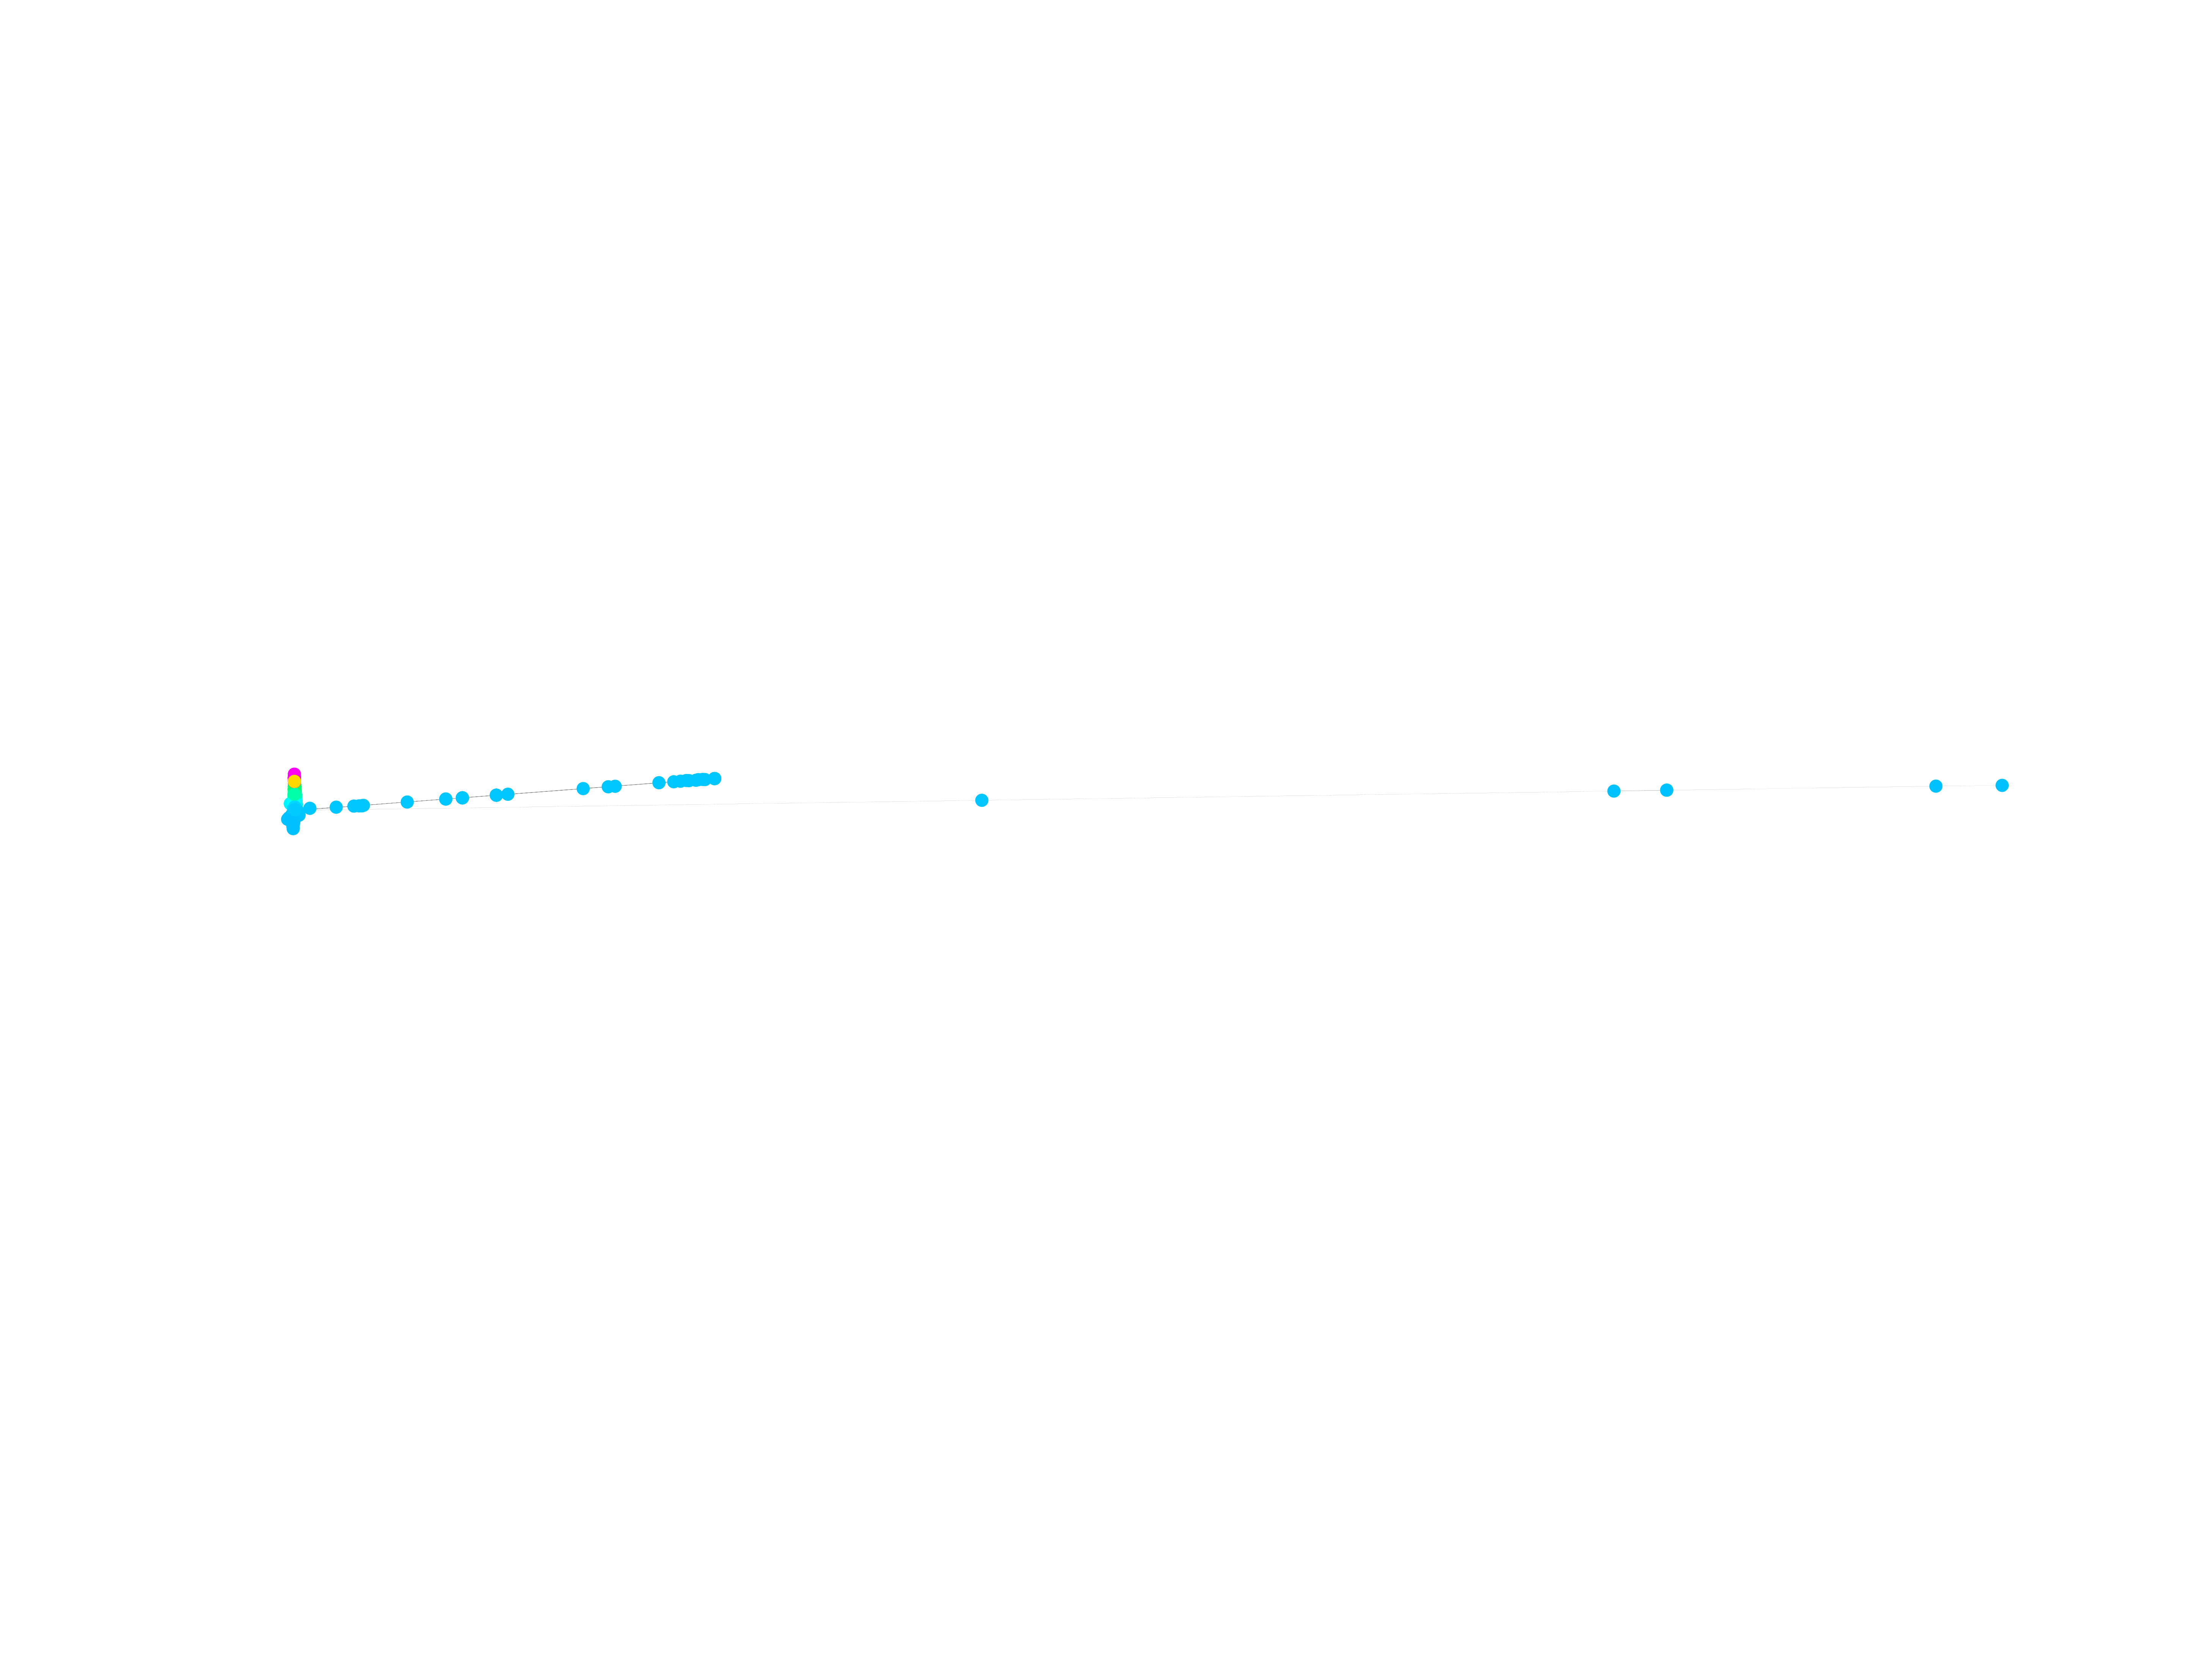
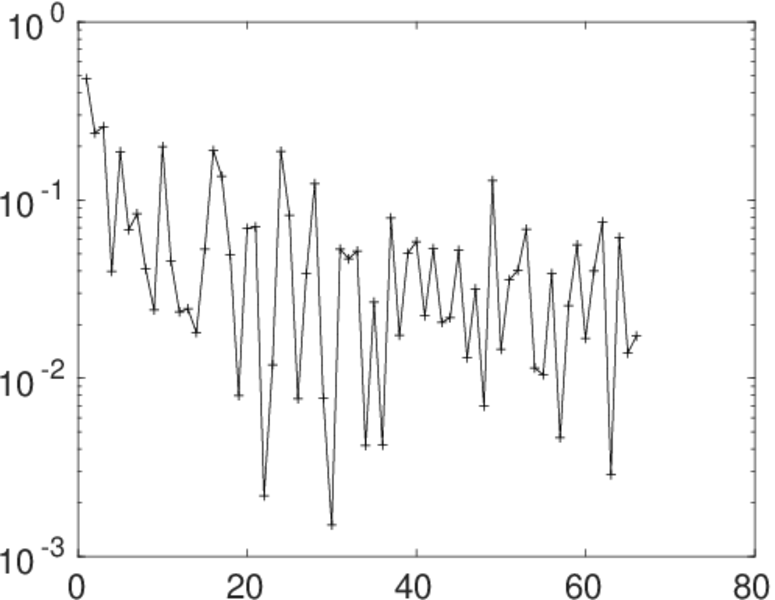
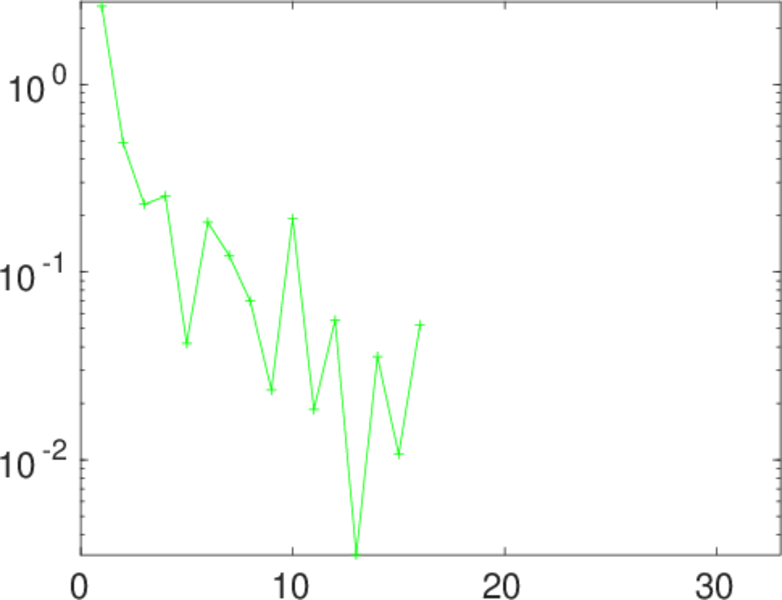
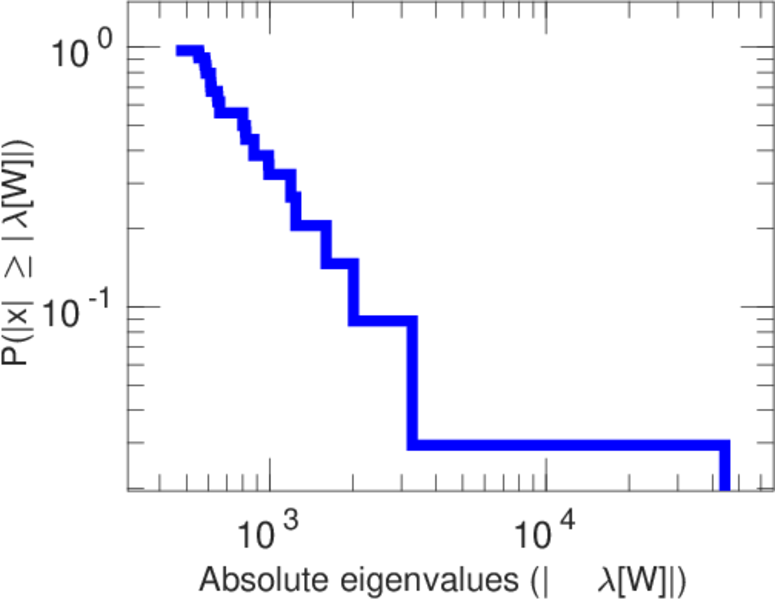
Matrix decompositions plots


Downloads
References
|
[1]
|
Jérôme Kunegis.
KONECT – The Koblenz Network Collection.
In Proc. Int. Conf. on World Wide Web Companion, pages
1343–1350, 2013.
[ http ]
|
|
[2]
|
Wikimedia Foundation.
Wikimedia downloads.
http://dumps.wikimedia.org/, January 2010.
|
 KONECT ‣ Networks ‣
Buy Me a Coffee
KONECT ‣ Networks ‣
Buy Me a Coffee