Wikipedia edits (az)
This is the bipartite edit network of the Azerbaijani Wikipedia. It contains
users and pages from the Azerbaijani Wikipedia, connected by edit events. Each
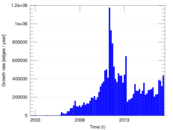
edge represents an edit. The dataset includes the timestamp of each edit.
Metadata
Statistics
| Size | n = | 338,081
|
| Left size | n1 = | 20,643
|
| Right size | n2 = | 317,438
|
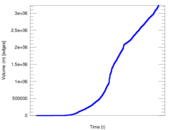
| Volume | m = | 3,230,280
|
| Unique edge count | m̿ = | 1,322,563
|
| Wedge count | s = | 16,925,506,436
|
| Claw count | z = | 279,942,922,731,771
|
| Cross count | x = | 4,143,171,137,821,337,600
|
| Square count | q = | 13,401,321,634
|
| 4-Tour count | T4 = | 174,915,953,730
|
| Maximum degree | dmax = | 244,224
|
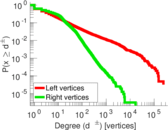
| Maximum left degree | d1max = | 244,224
|
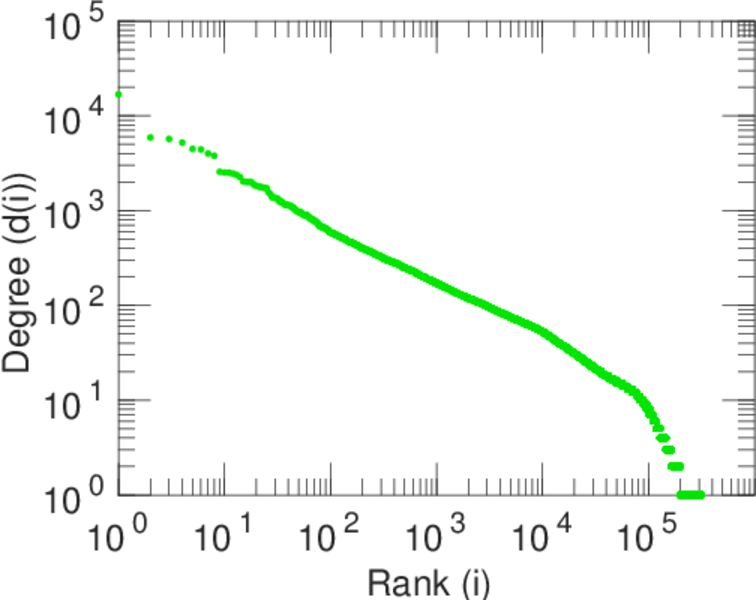
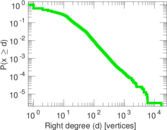
| Maximum right degree | d2max = | 16,802
|
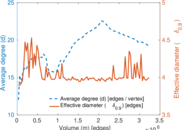
| Average degree | d = | 19.109 5
|
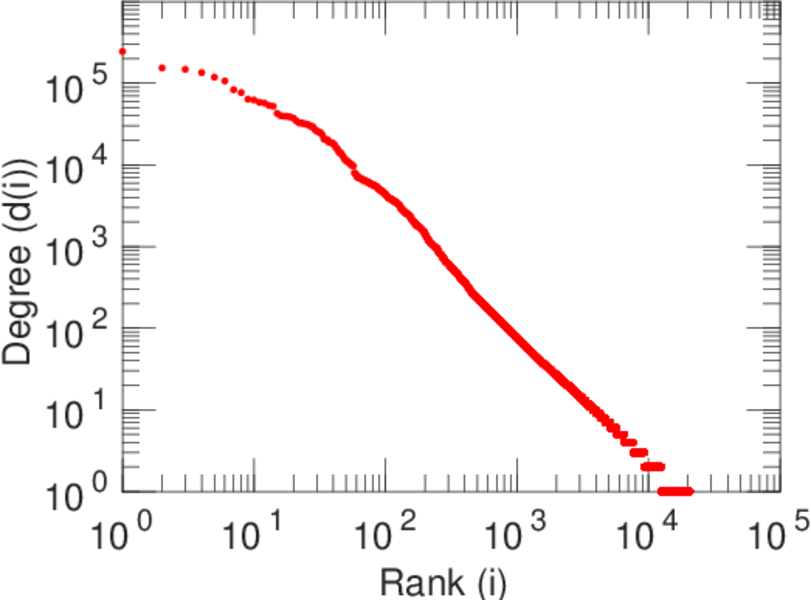
| Average left degree | d1 = | 156.483
|
| Average right degree | d2 = | 10.176 1
|
| Fill | p = | 0.000 201 829
|
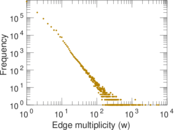
| Average edge multiplicity | m̃ = | 2.442 44
|
| Size of LCC | N = | 333,014
|
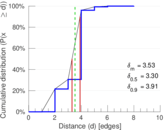
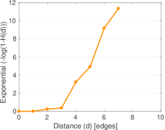
| Diameter | δ = | 11
|
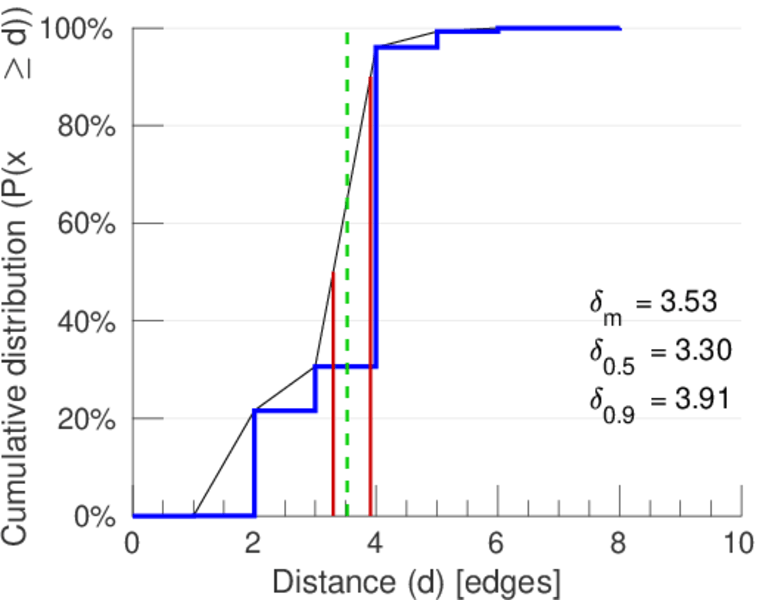
| 50-Percentile effective diameter | δ0.5 = | 3.296 21
|
| 90-Percentile effective diameter | δ0.9 = | 3.908 01
|
| Median distance | δM = | 4
|
| Mean distance | δm = | 3.525 02
|
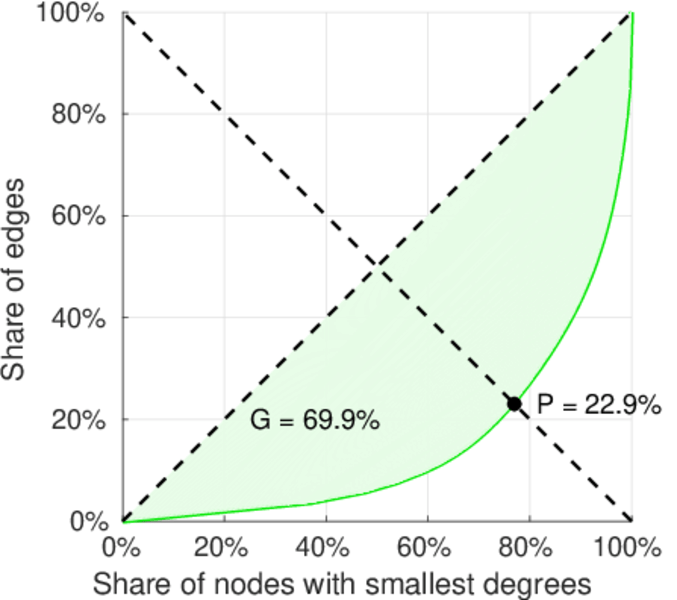
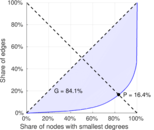
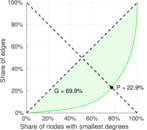
| Gini coefficient | G = | 0.844 496
|
| Balanced inequality ratio | P = | 0.161 622
|
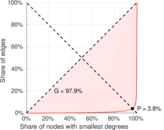
| Left balanced inequality ratio | P1 = | 0.037 536 4
|
| Right balanced inequality ratio | P2 = | 0.228 839
|
| Relative edge distribution entropy | Her = | 0.724 250
|
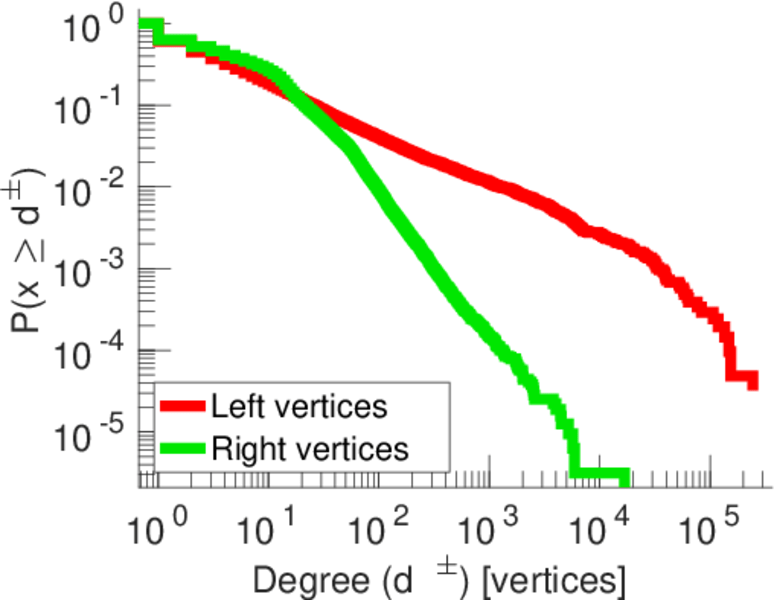
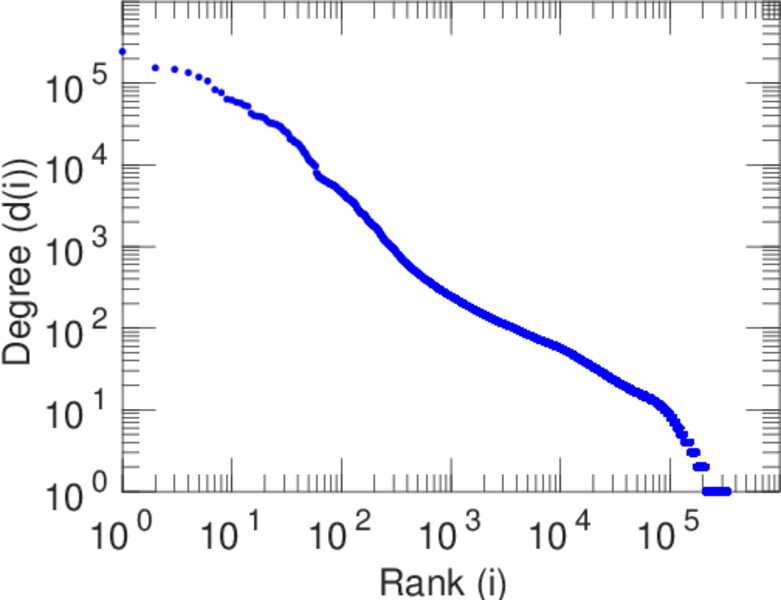
| Power law exponent | γ = | 2.177 21
|
| Tail power law exponent | γt = | 2.681 00
|
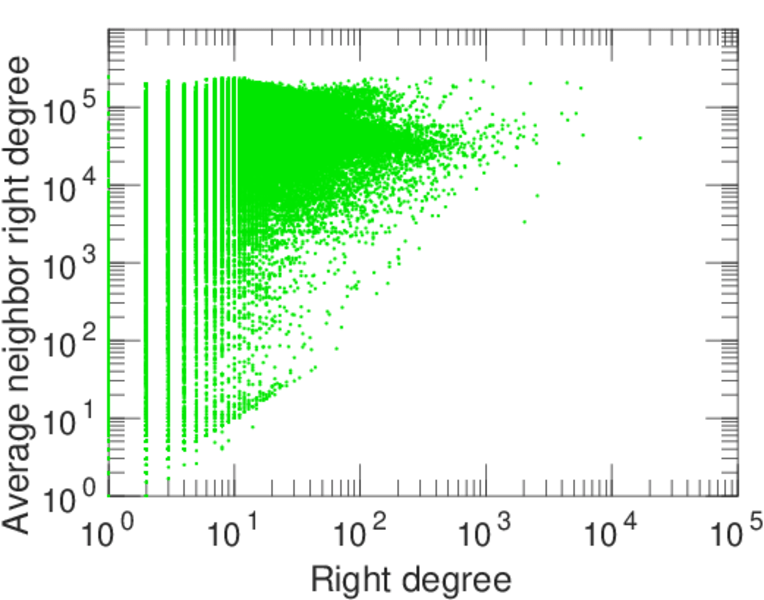
| Degree assortativity | ρ = | −0.165 502
|
| Degree assortativity p-value | pρ = | 0.000 00
|
| Algebraic connectivity | a = | 0.011 592 6
|
| Spectral separation | |λ1[A] / λ2[A]| = | 1.096 35
|
| Controllability | C = | 302,882
|
| Relative controllability | Cr = | 0.897 665
|
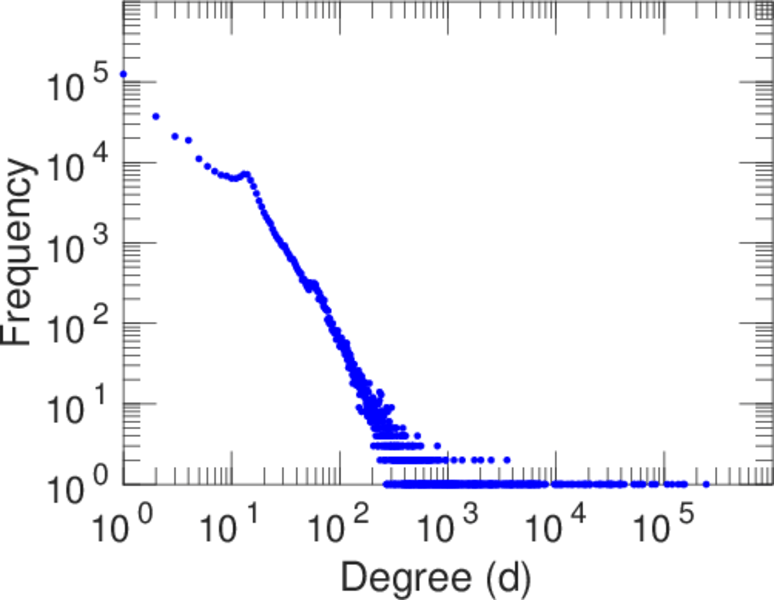
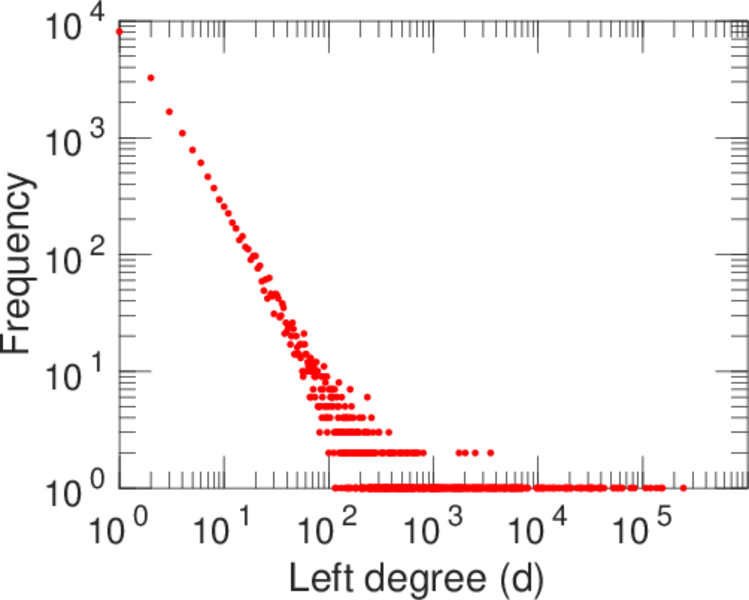
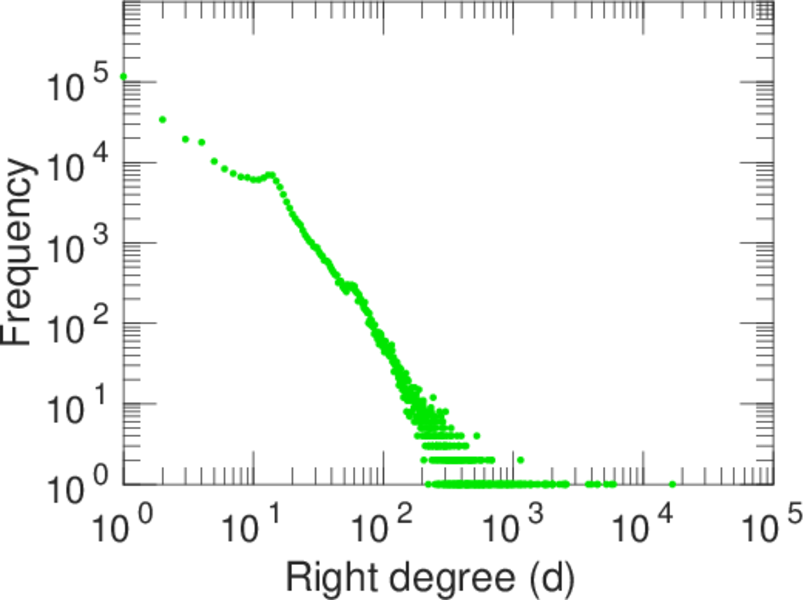
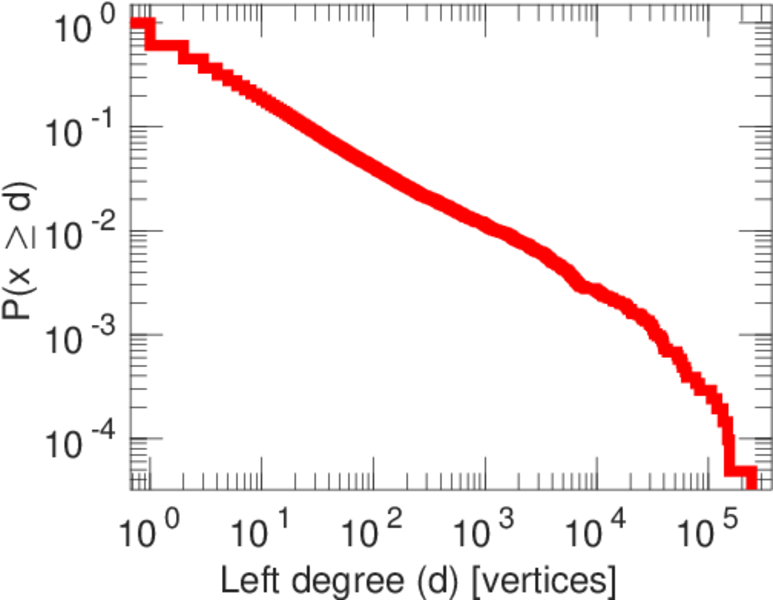
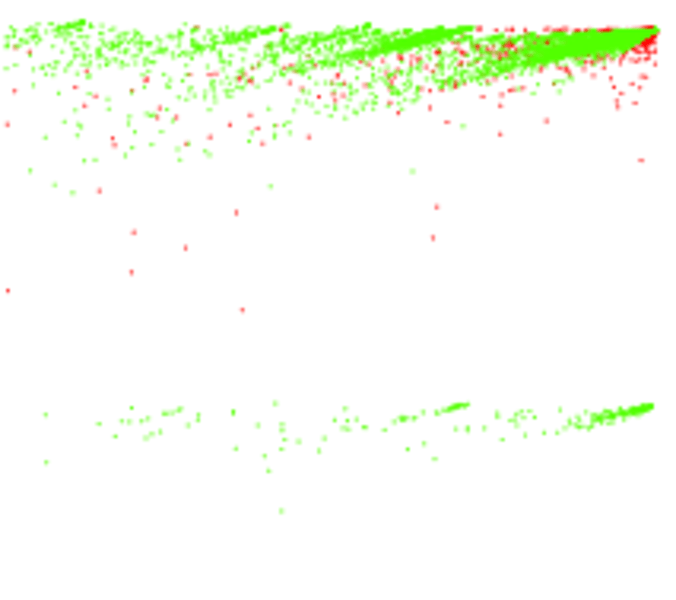
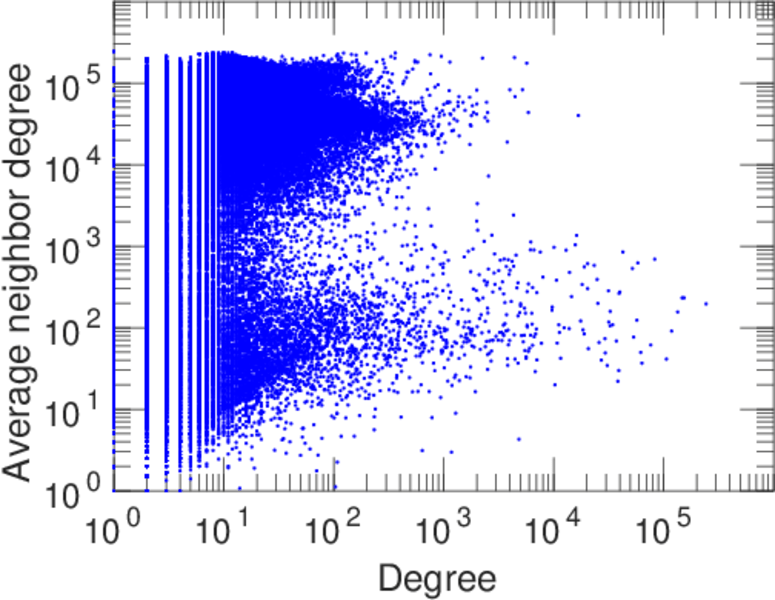
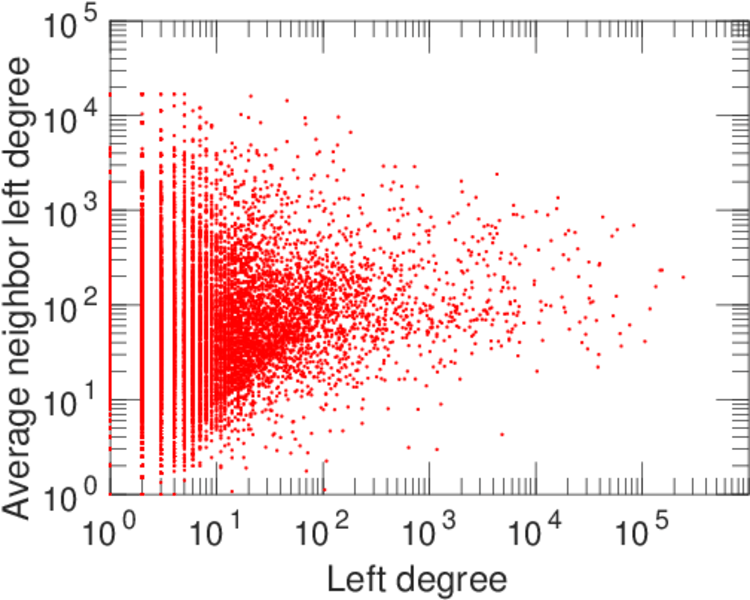
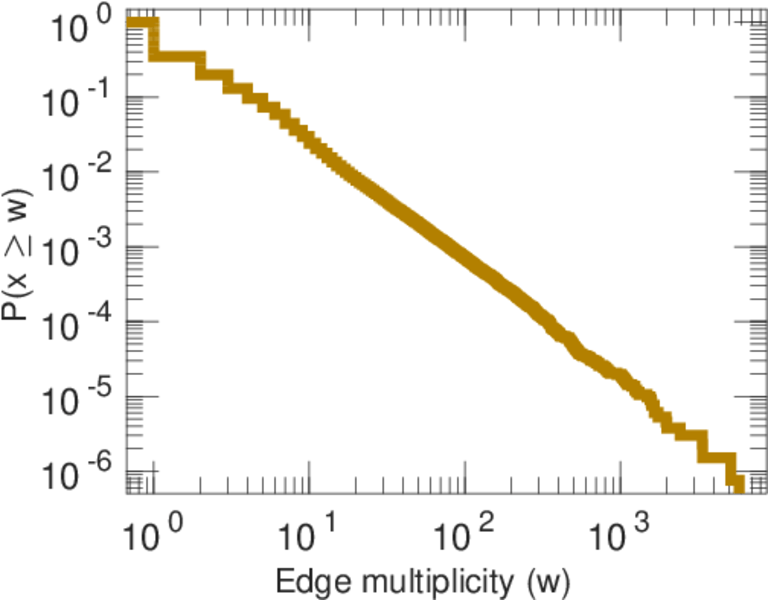
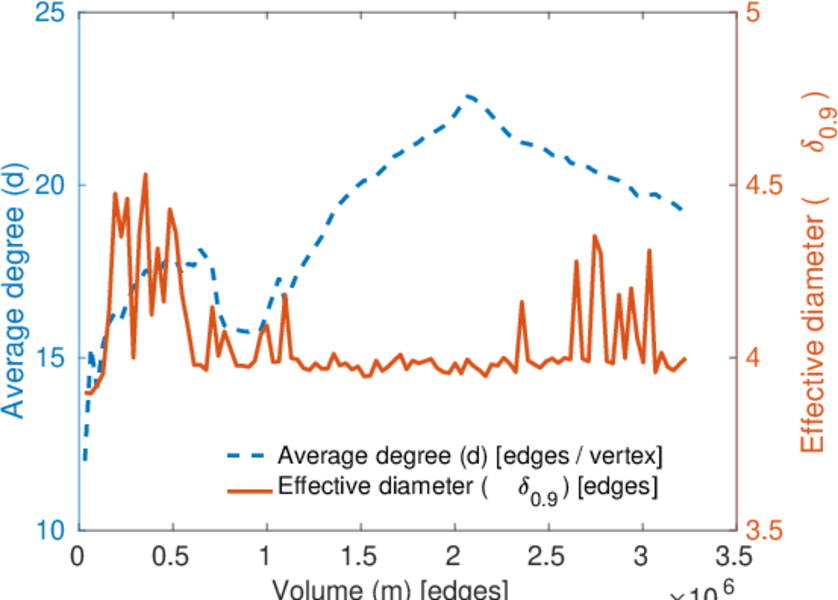
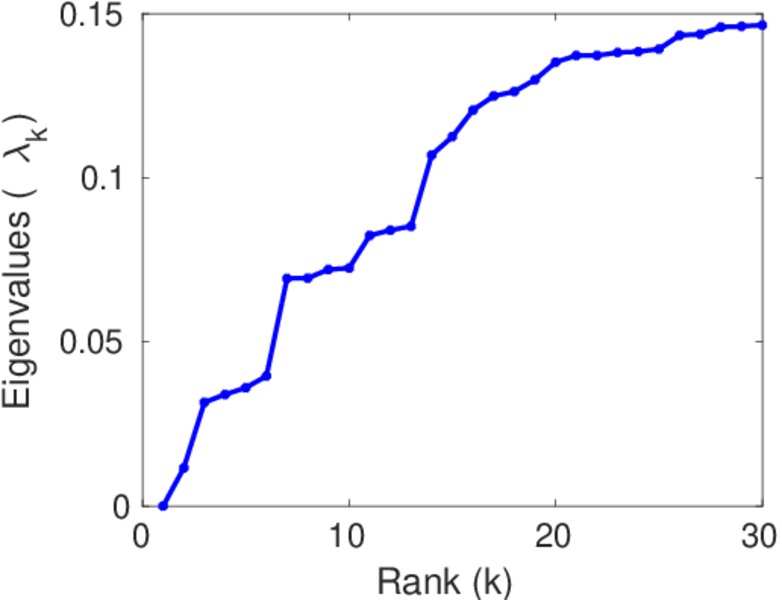
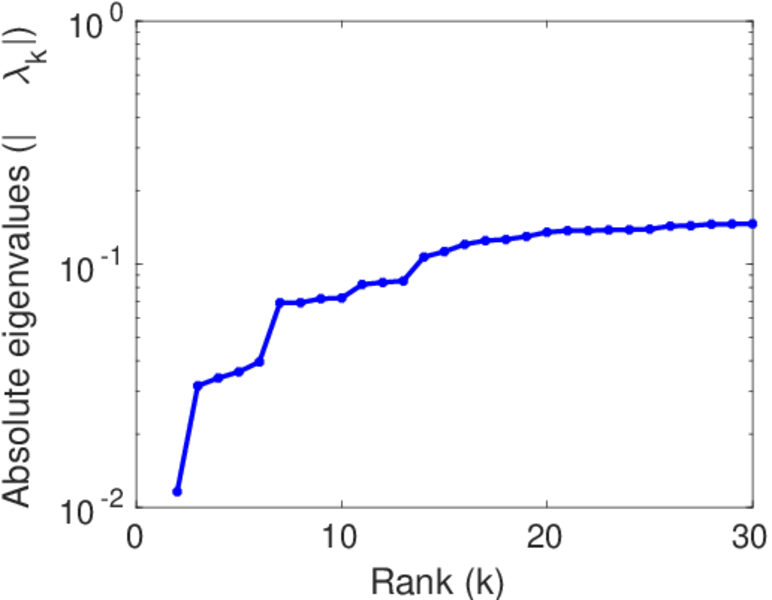
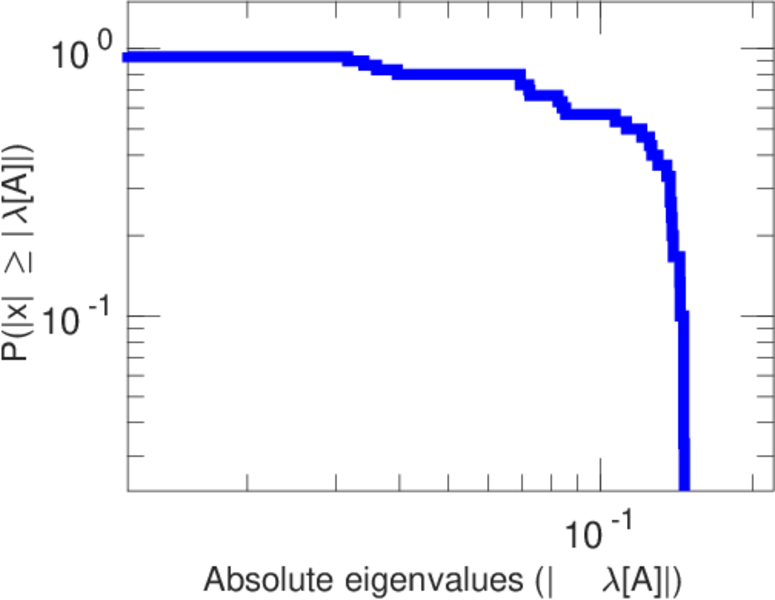
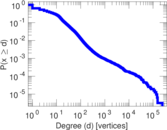
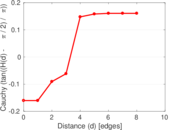
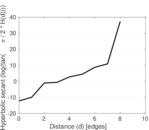
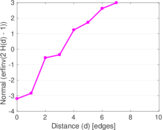
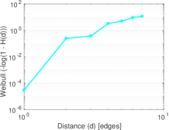
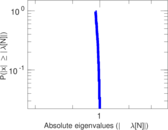
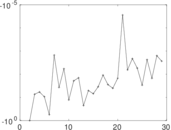
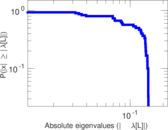
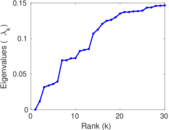
Plots


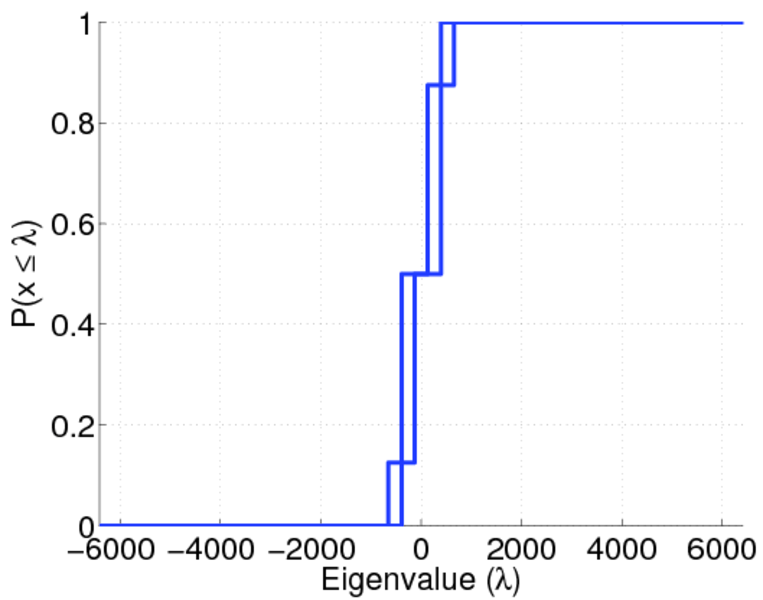
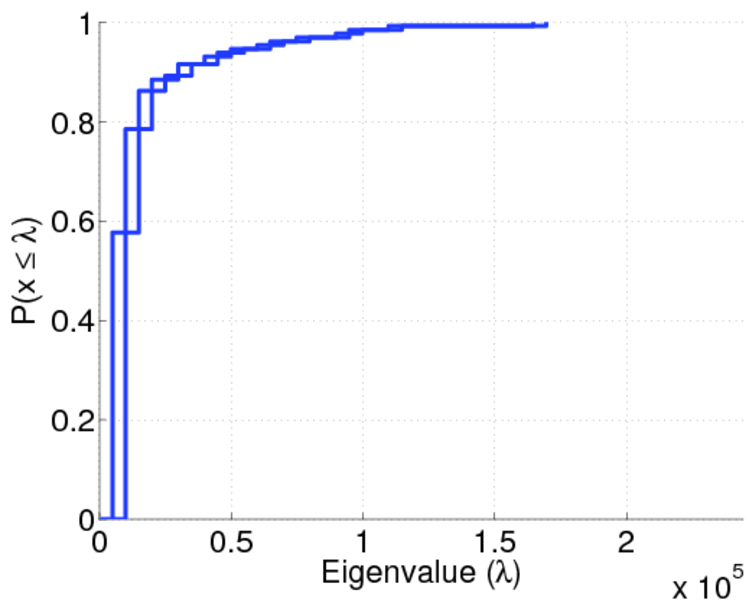
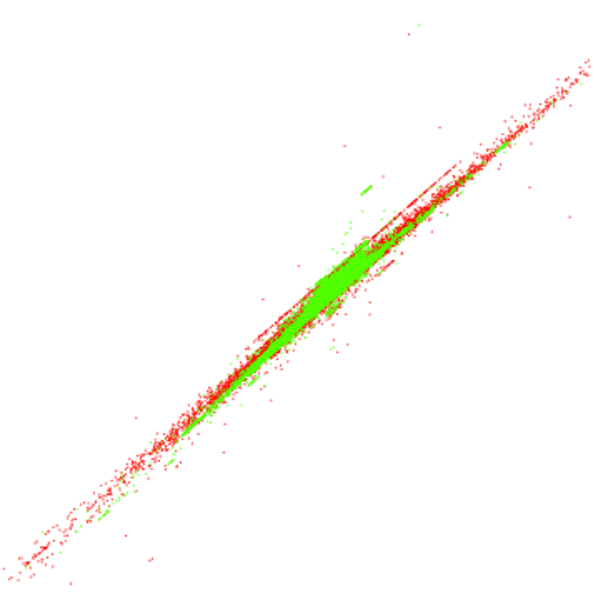
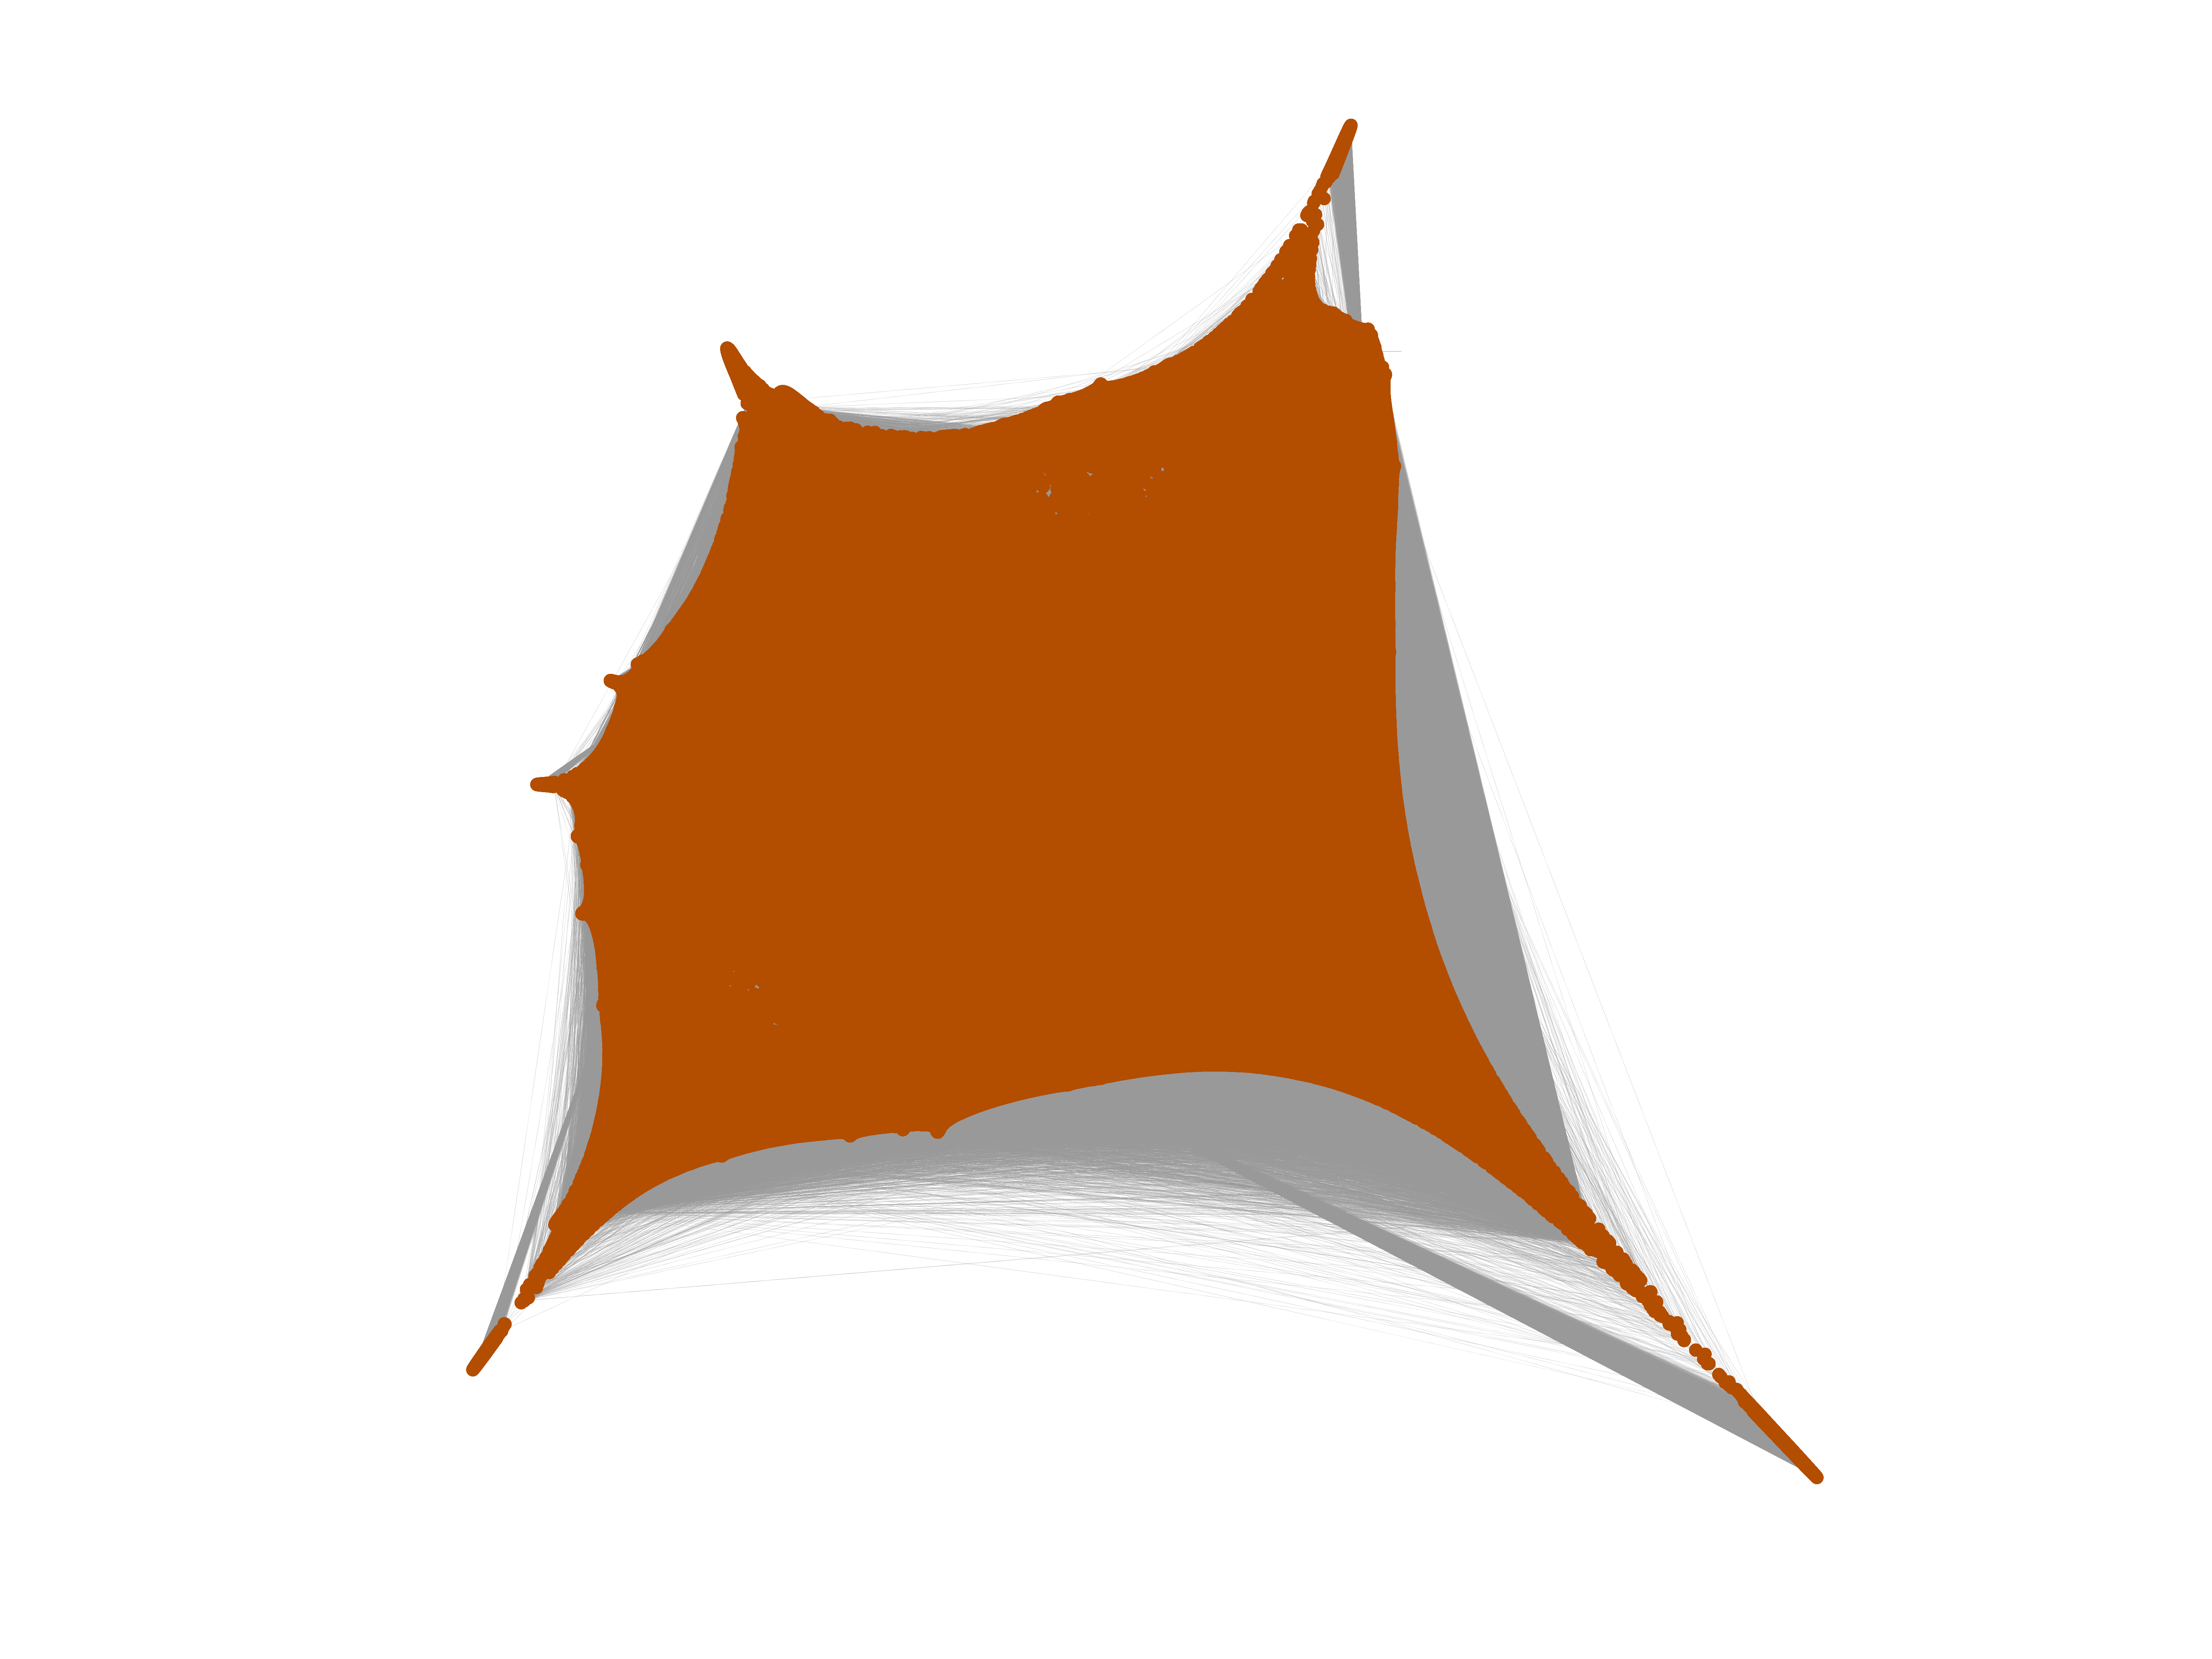
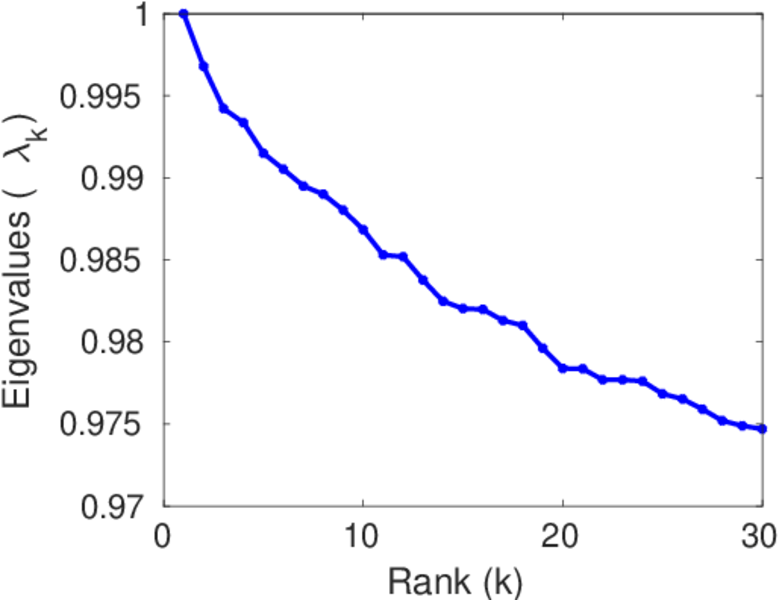
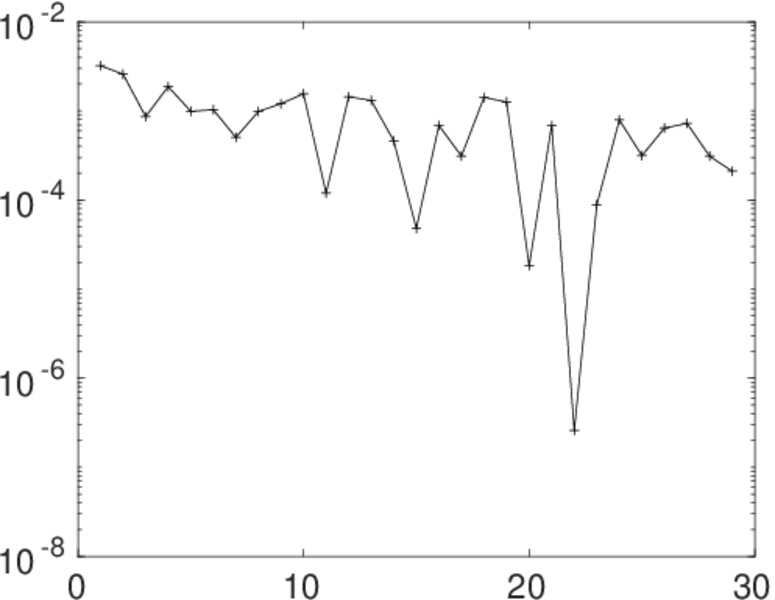
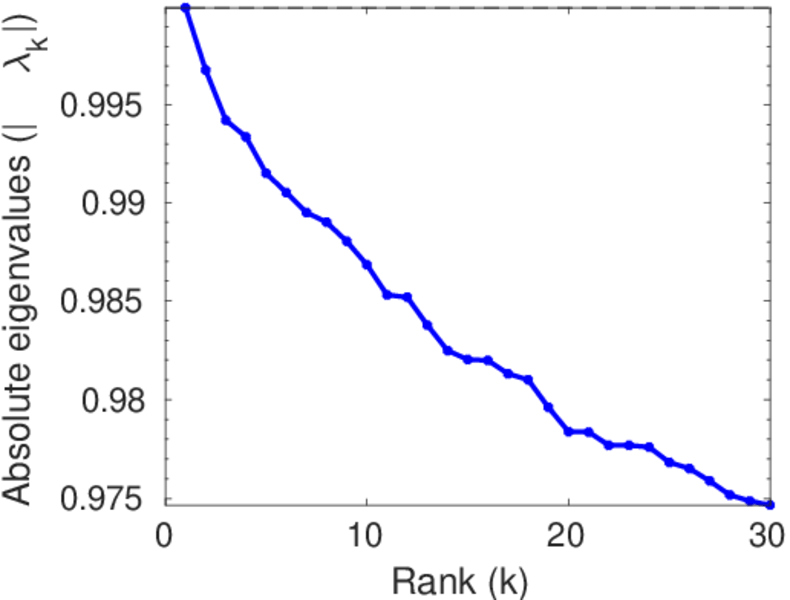
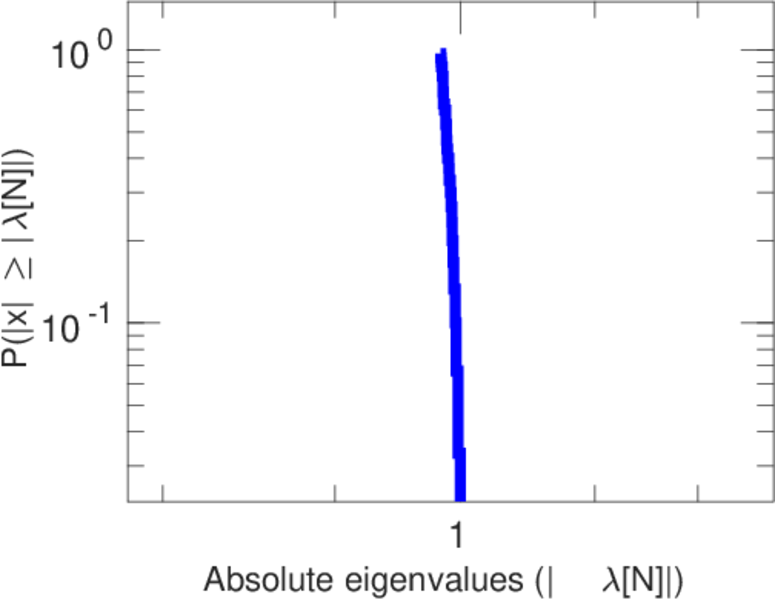
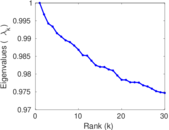
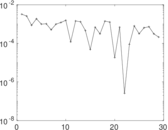
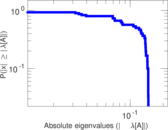
Matrix decompositions plots


Downloads
References
|
[1]
|
Jérôme Kunegis.
KONECT – The Koblenz Network Collection.
In Proc. Int. Conf. on World Wide Web Companion, pages
1343–1350, 2013.
[ http ]
|
|
[2]
|
Wikimedia Foundation.
Wikimedia downloads.
http://dumps.wikimedia.org/, January 2010.
|
 KONECT ‣ Networks ‣
Buy Me a Coffee
KONECT ‣ Networks ‣
Buy Me a Coffee