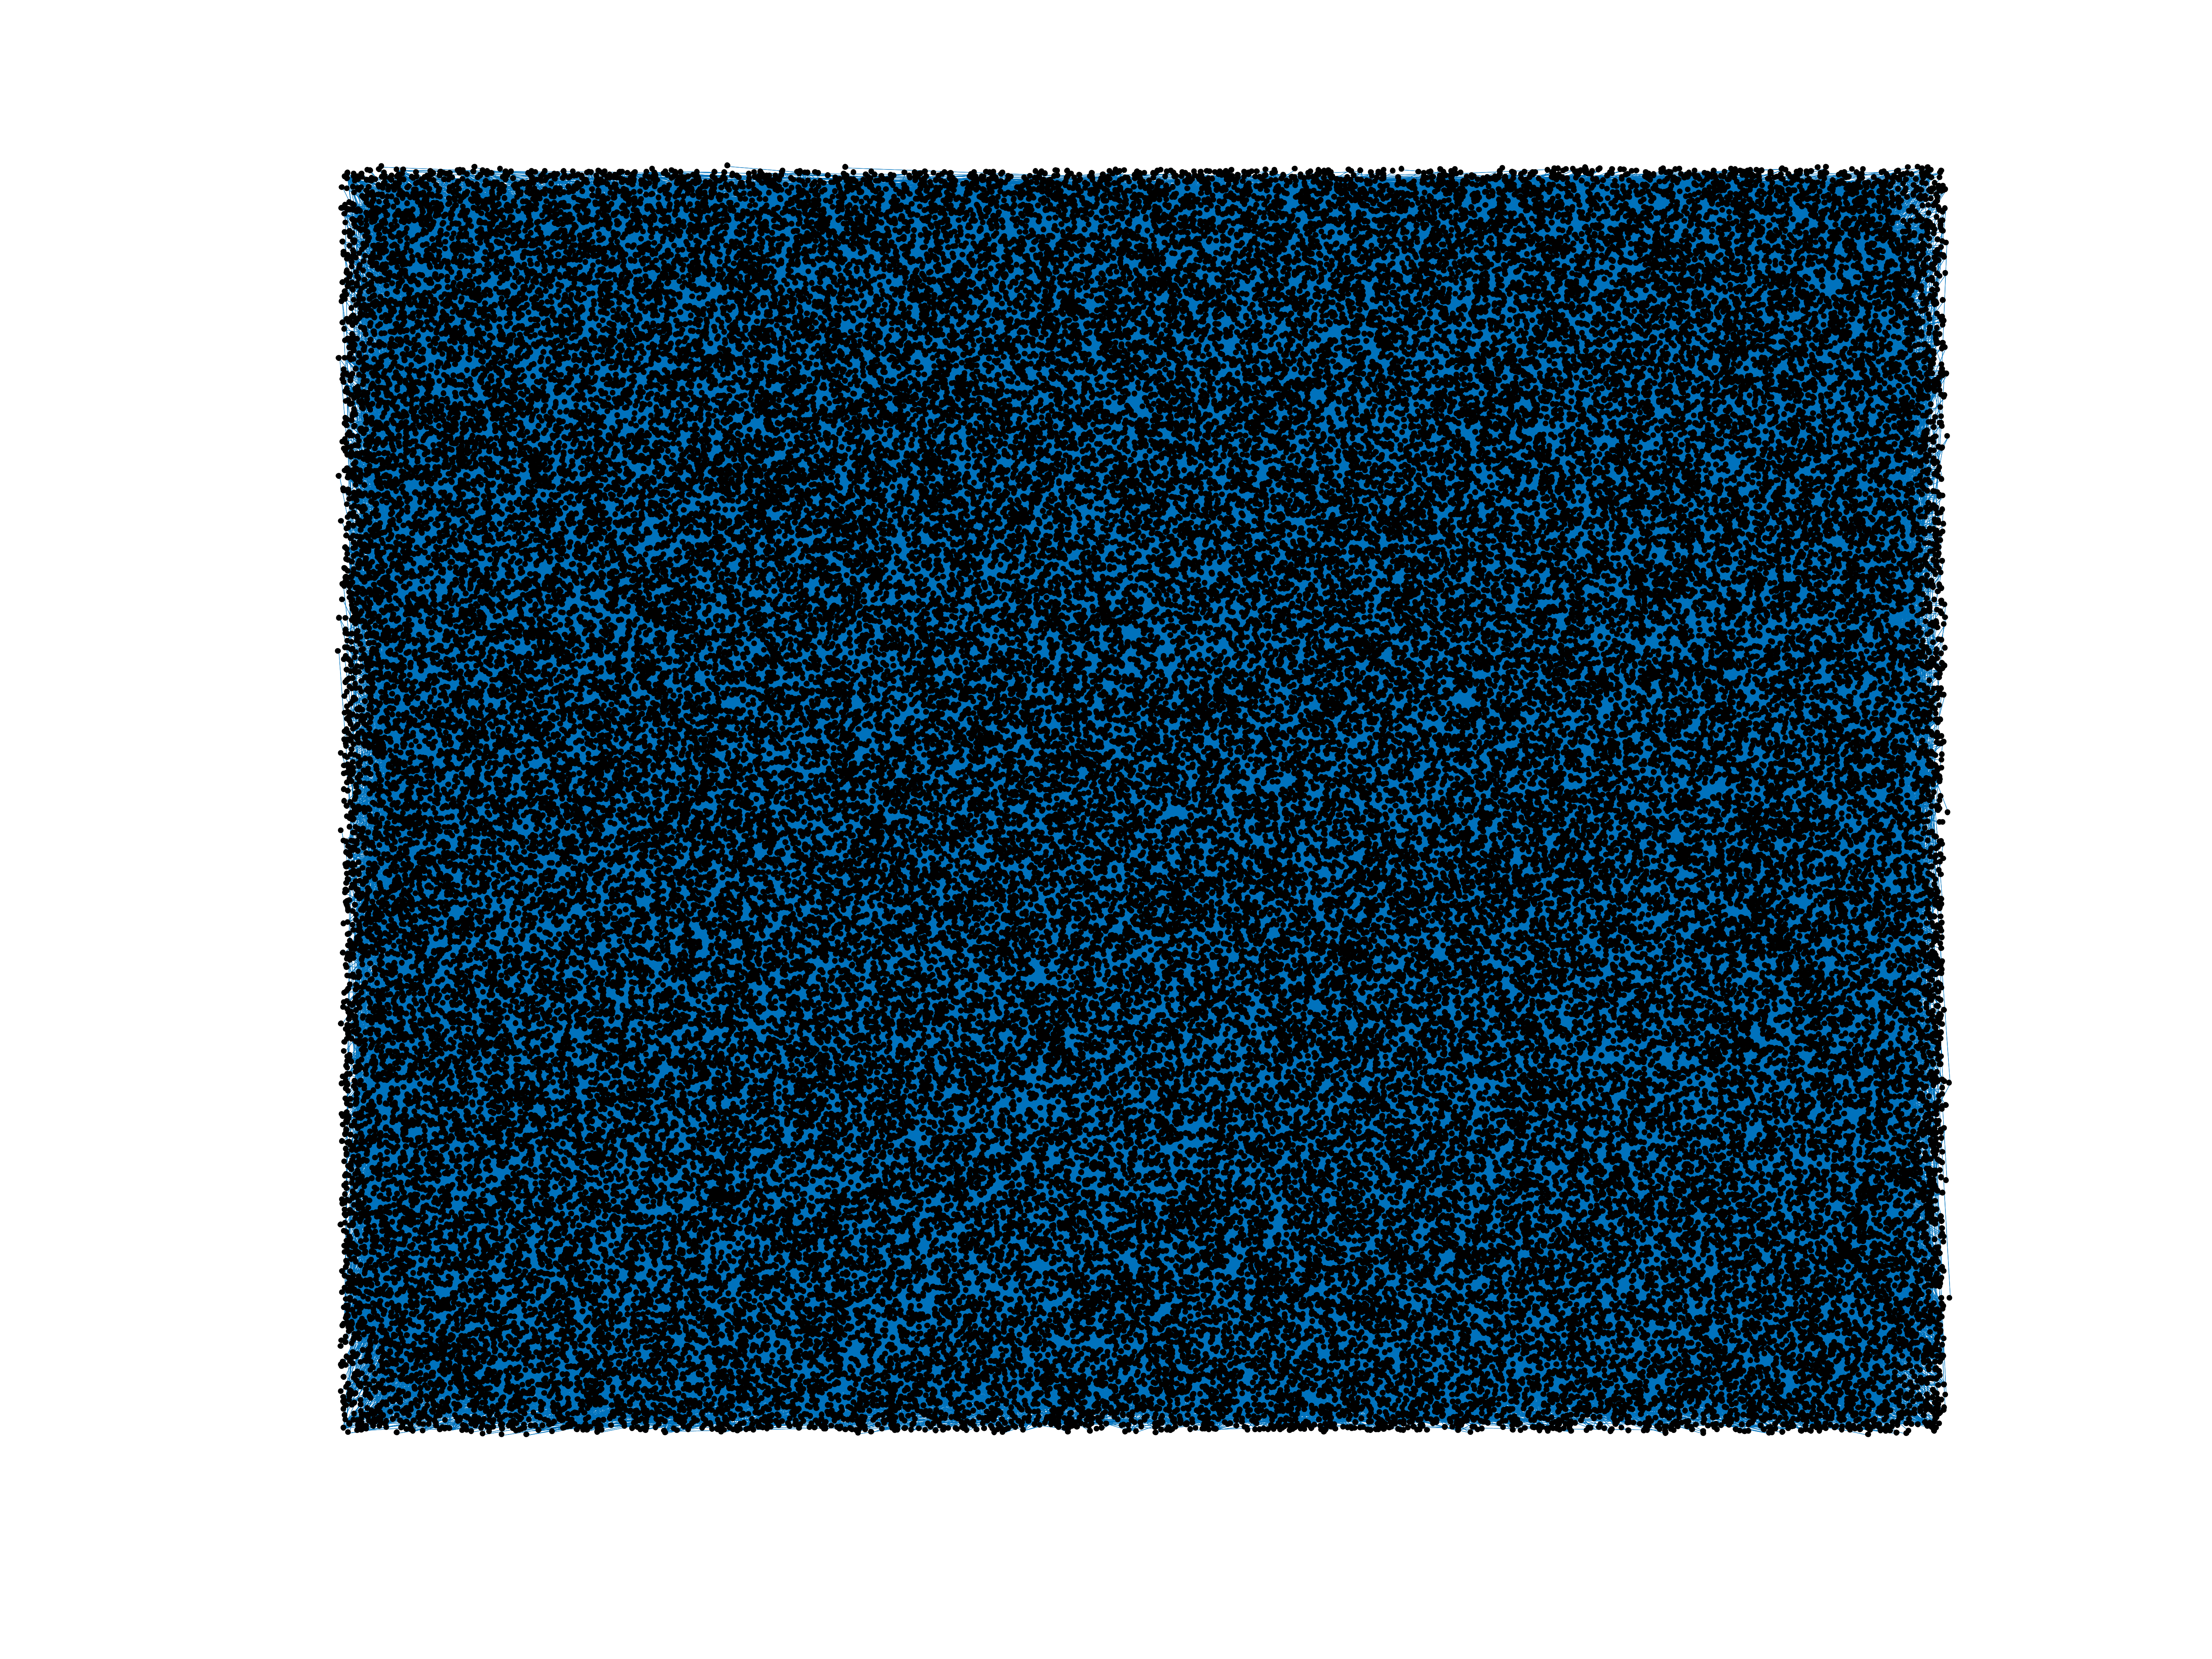
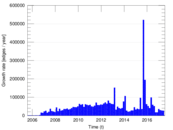
Wikipedia edits (bar)
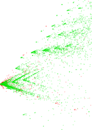
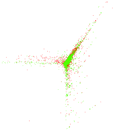
This is the bipartite edit network of the Bavarian Wikipedia. It contains users
and pages from the Bavarian Wikipedia, connected by edit events. Each edge
represents an edit. The dataset includes the timestamp of each edit.
Metadata
Statistics
| Size | n = | 94,087
|
| Left size | n1 = | 3,812
|
| Right size | n2 = | 90,275
|
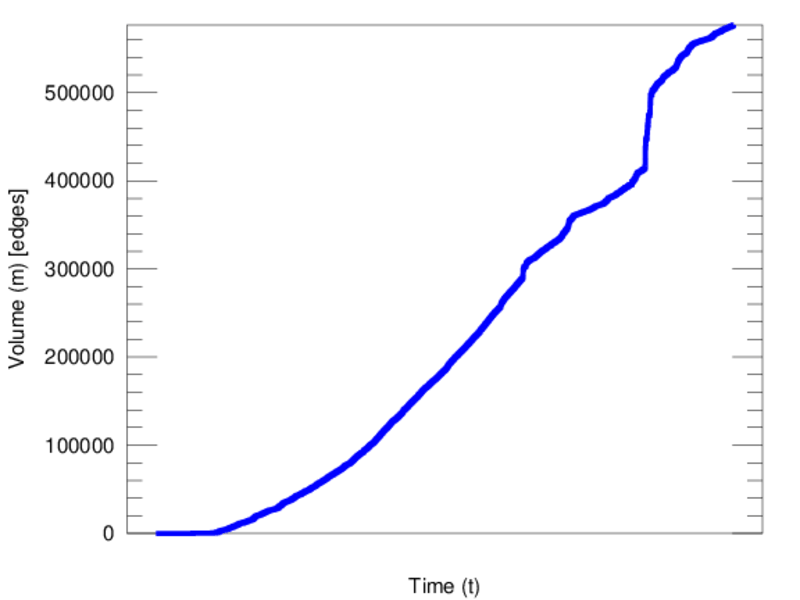
| Volume | m = | 576,801
|
| Unique edge count | m̿ = | 261,983
|
| Wedge count | s = | 1,854,586,839
|
| Claw count | z = | 23,173,715,990,044
|
| Cross count | x = | 261,810,242,830,829,568
|
| Square count | q = | 644,251,796
|
| 4-Tour count | T4 = | 12,573,000,618
|
| Maximum degree | dmax = | 85,201
|
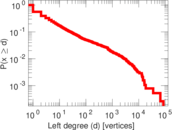
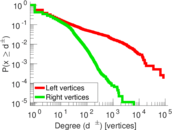
| Maximum left degree | d1max = | 85,201
|
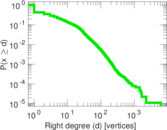
| Maximum right degree | d2max = | 6,207
|
| Average degree | d = | 12.261 0
|
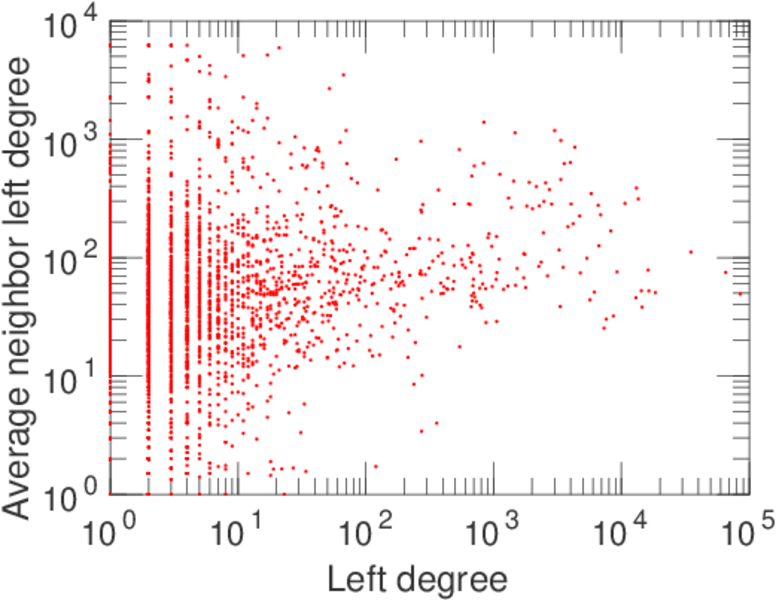
| Average left degree | d1 = | 151.312
|
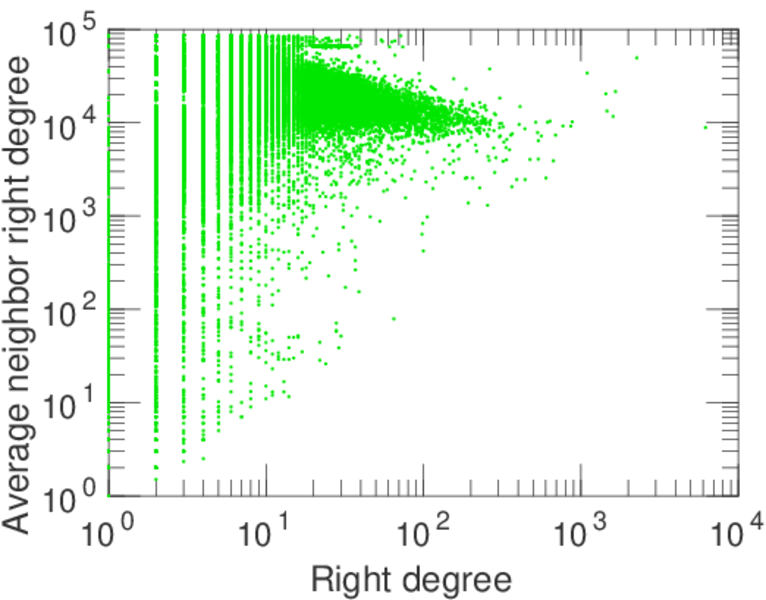
| Average right degree | d2 = | 6.389 38
|
| Fill | p = | 0.000 761 295
|
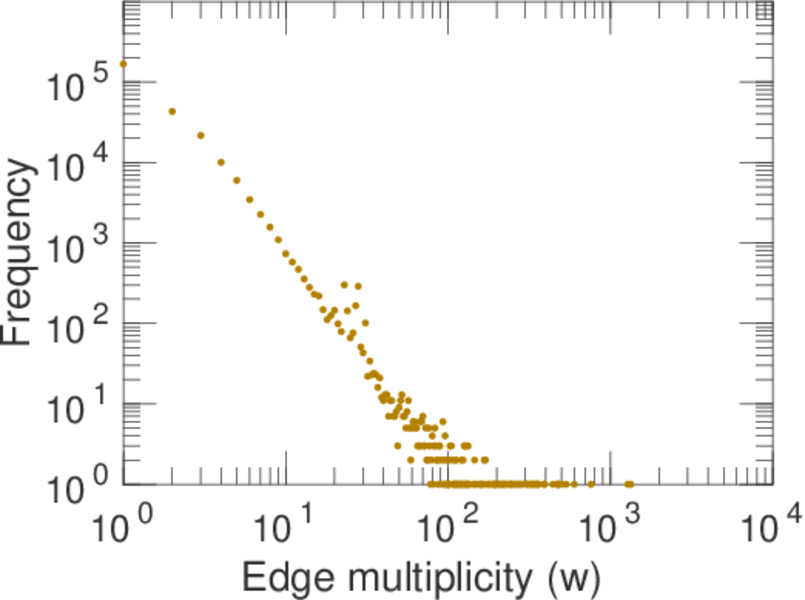
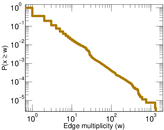
| Average edge multiplicity | m̃ = | 2.201 67
|
| Size of LCC | N = | 92,884
|
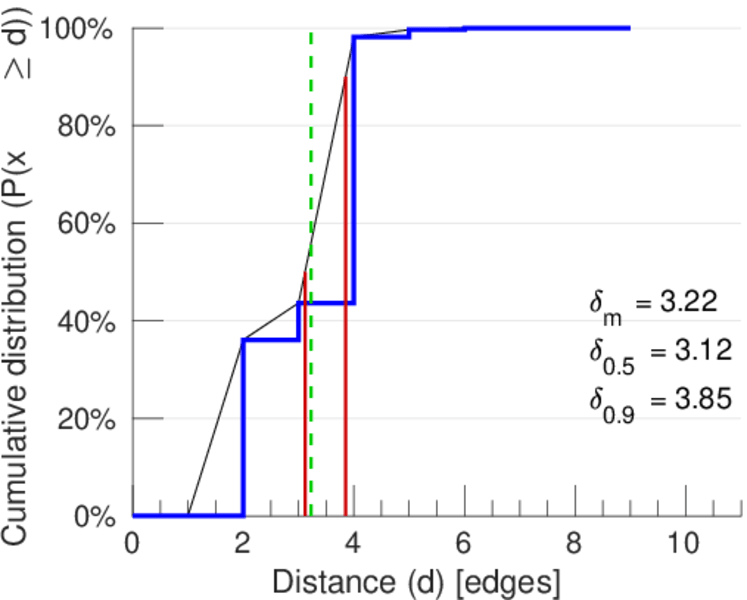
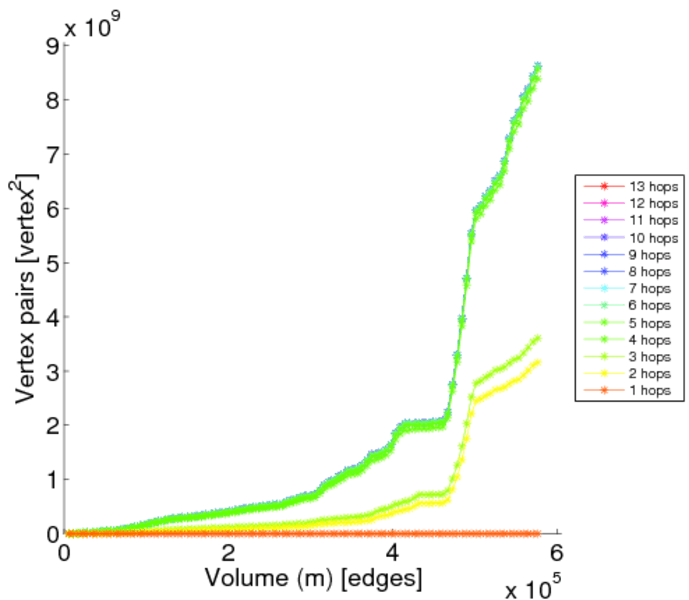
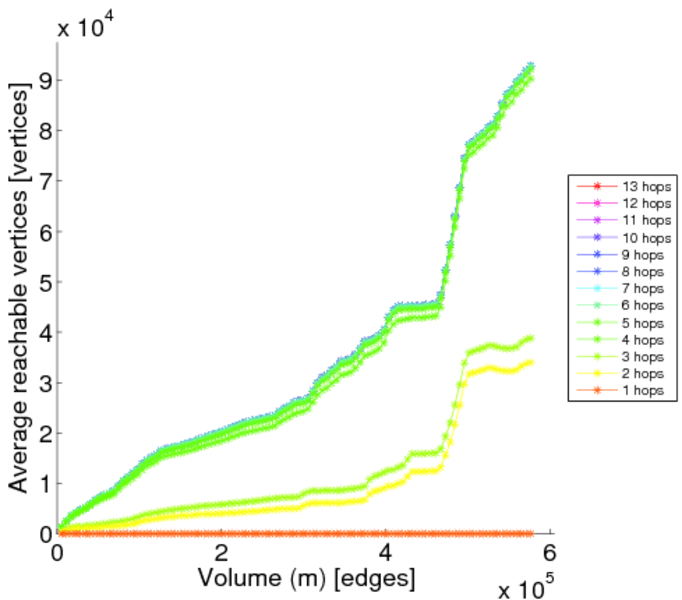
| Diameter | δ = | 11
|
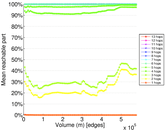
| 50-Percentile effective diameter | δ0.5 = | 3.116 56
|
| 90-Percentile effective diameter | δ0.9 = | 3.850 17
|
| Median distance | δM = | 4
|
| Mean distance | δm = | 3.224 62
|
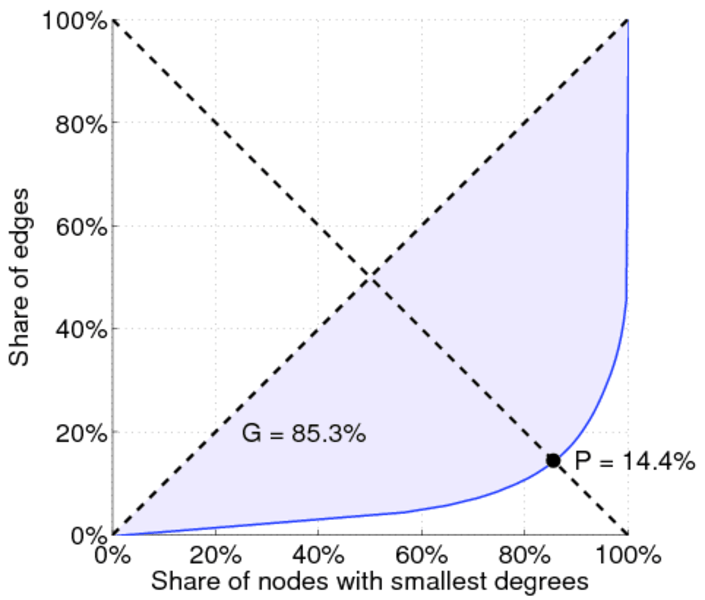
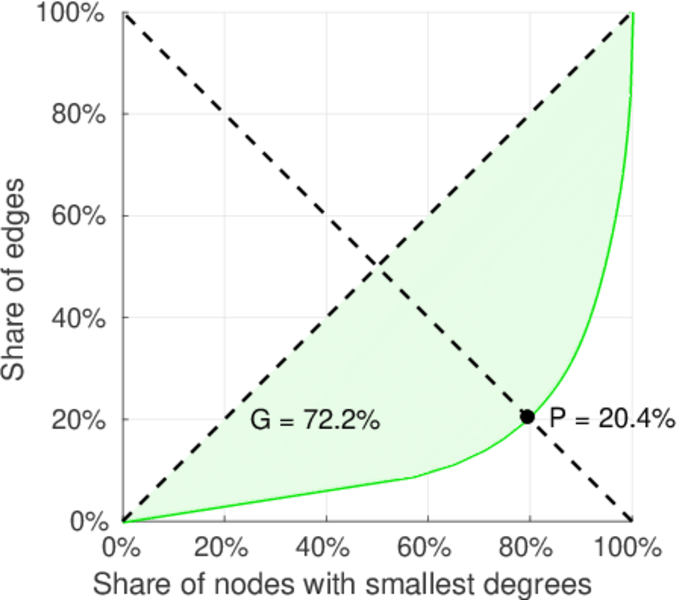
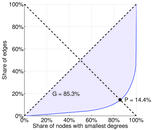
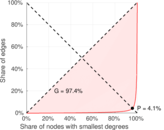
| Gini coefficient | G = | 0.856 066
|
| Balanced inequality ratio | P = | 0.142 742
|
| Left balanced inequality ratio | P1 = | 0.040 802 6
|
| Right balanced inequality ratio | P2 = | 0.203 614
|
| Relative edge distribution entropy | Her = | 0.712 925
|
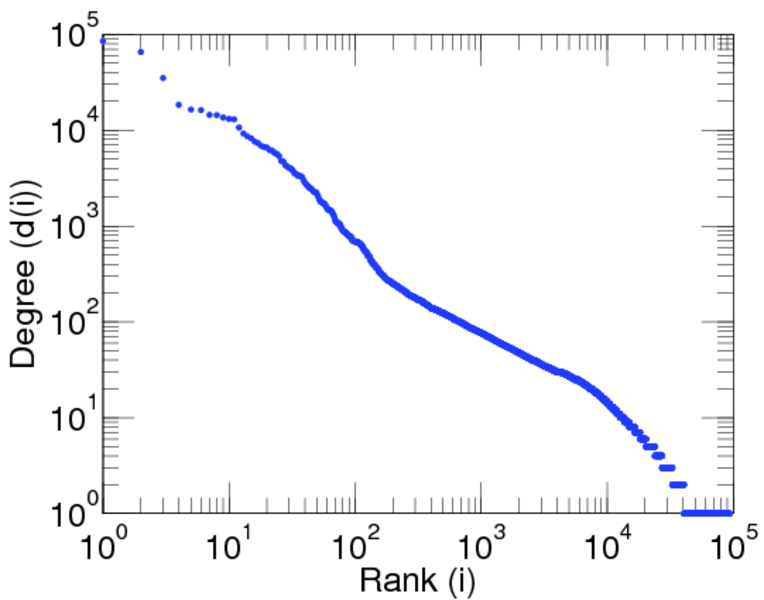
| Power law exponent | γ = | 2.875 57
|
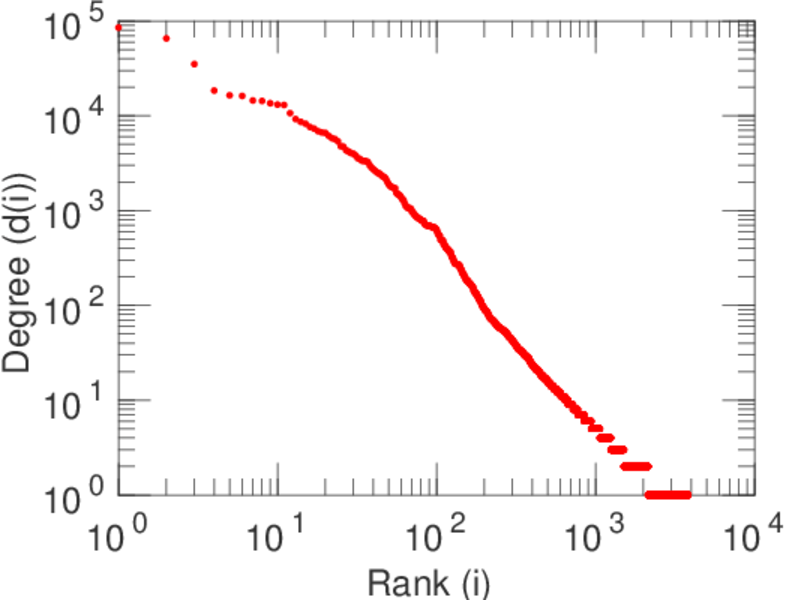
| Tail power law exponent | γt = | 2.041 00
|
| Tail power law exponent with p | γ3 = | 2.041 00
|
| p-value | p = | 0.000 00
|
| Left tail power law exponent with p | γ3,1 = | 1.741 00
|
| Left p-value | p1 = | 0.000 00
|
| Right tail power law exponent with p | γ3,2 = | 2.061 00
|
| Right p-value | p2 = | 0.000 00
|
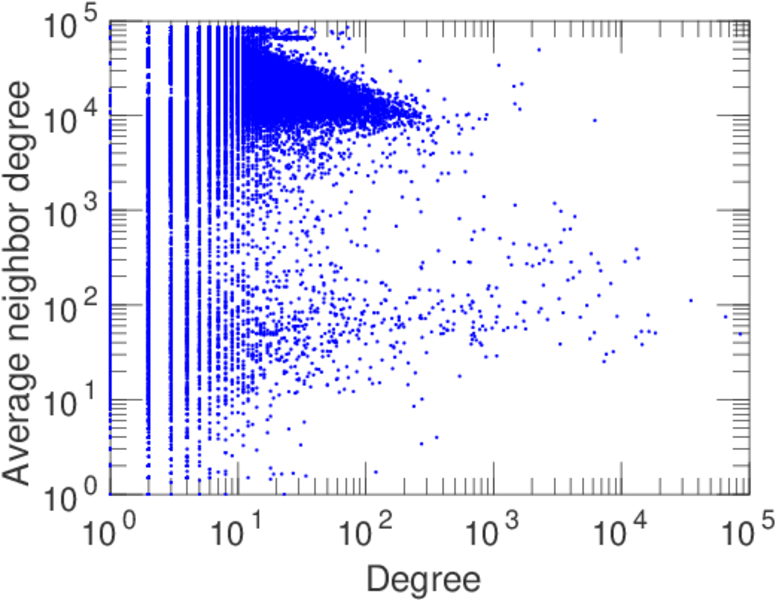
| Degree assortativity | ρ = | −0.364 846
|
| Degree assortativity p-value | pρ = | 0.000 00
|
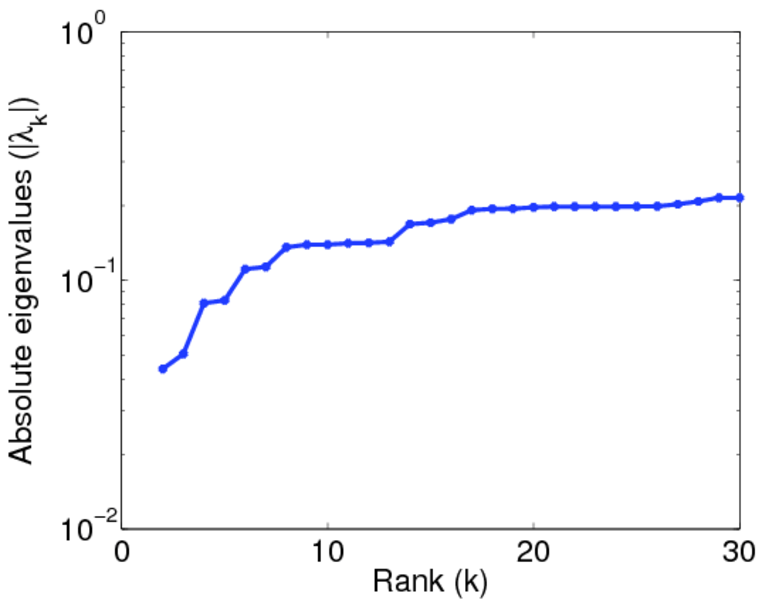
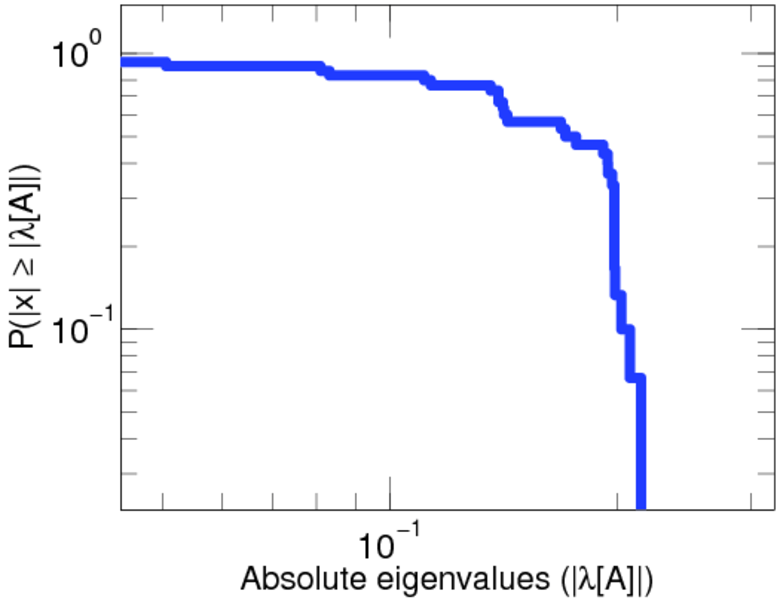
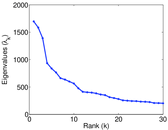
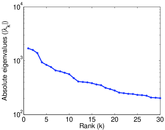
| Spectral norm | α = | 1,696.27
|
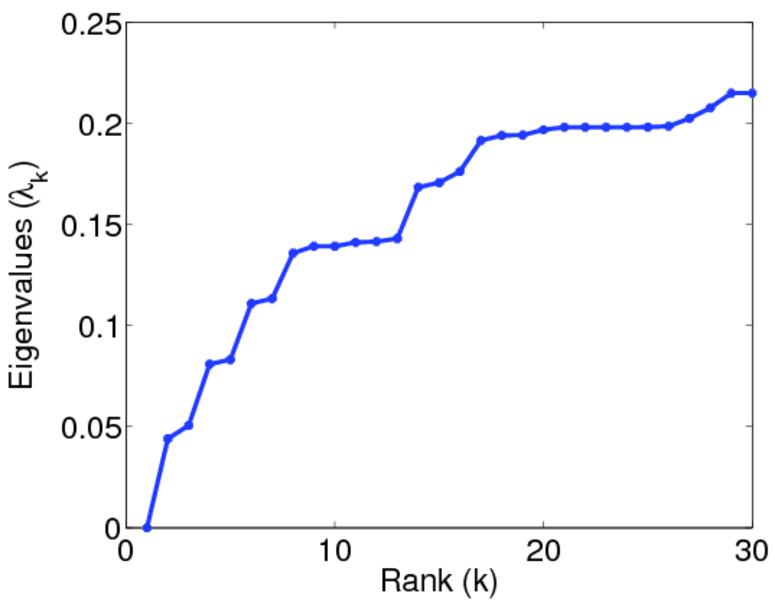
| Algebraic connectivity | a = | 0.044 037 8
|
| Spectral separation | |λ1[A] / λ2[A]| = | 1.069 93
|
| Controllability | C = | 87,029
|
| Relative controllability | Cr = | 0.928 557
|
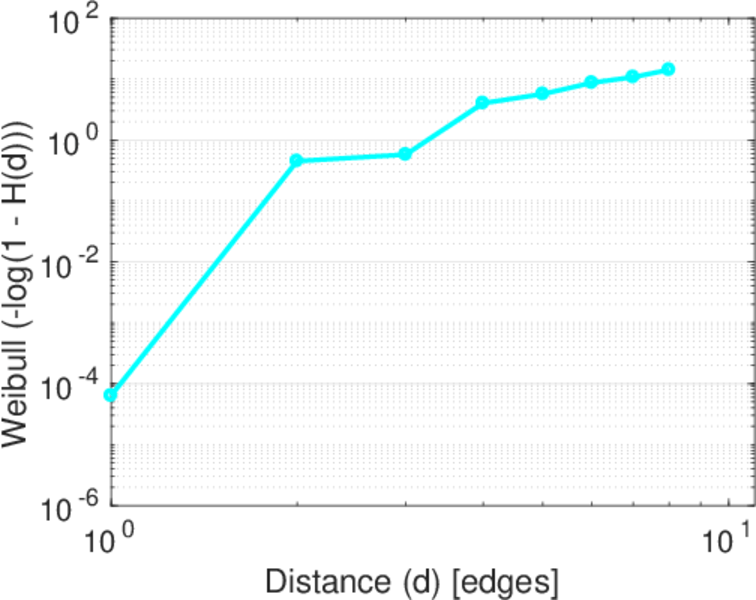
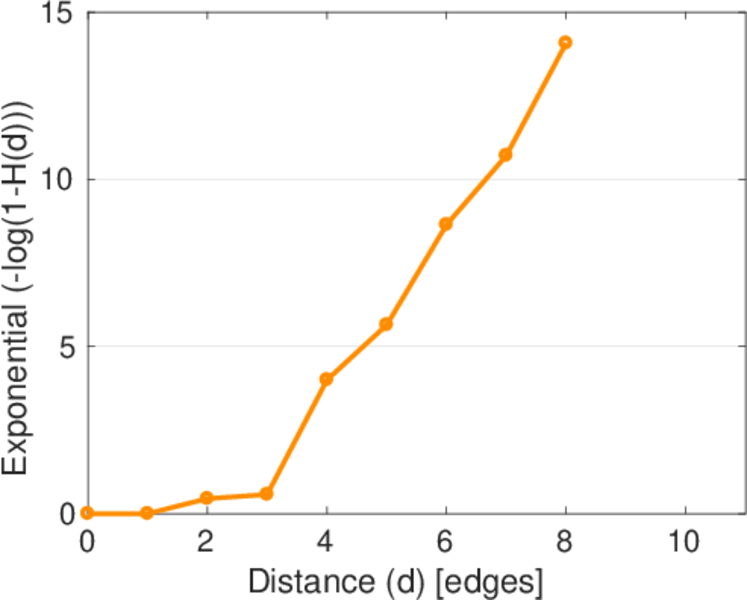
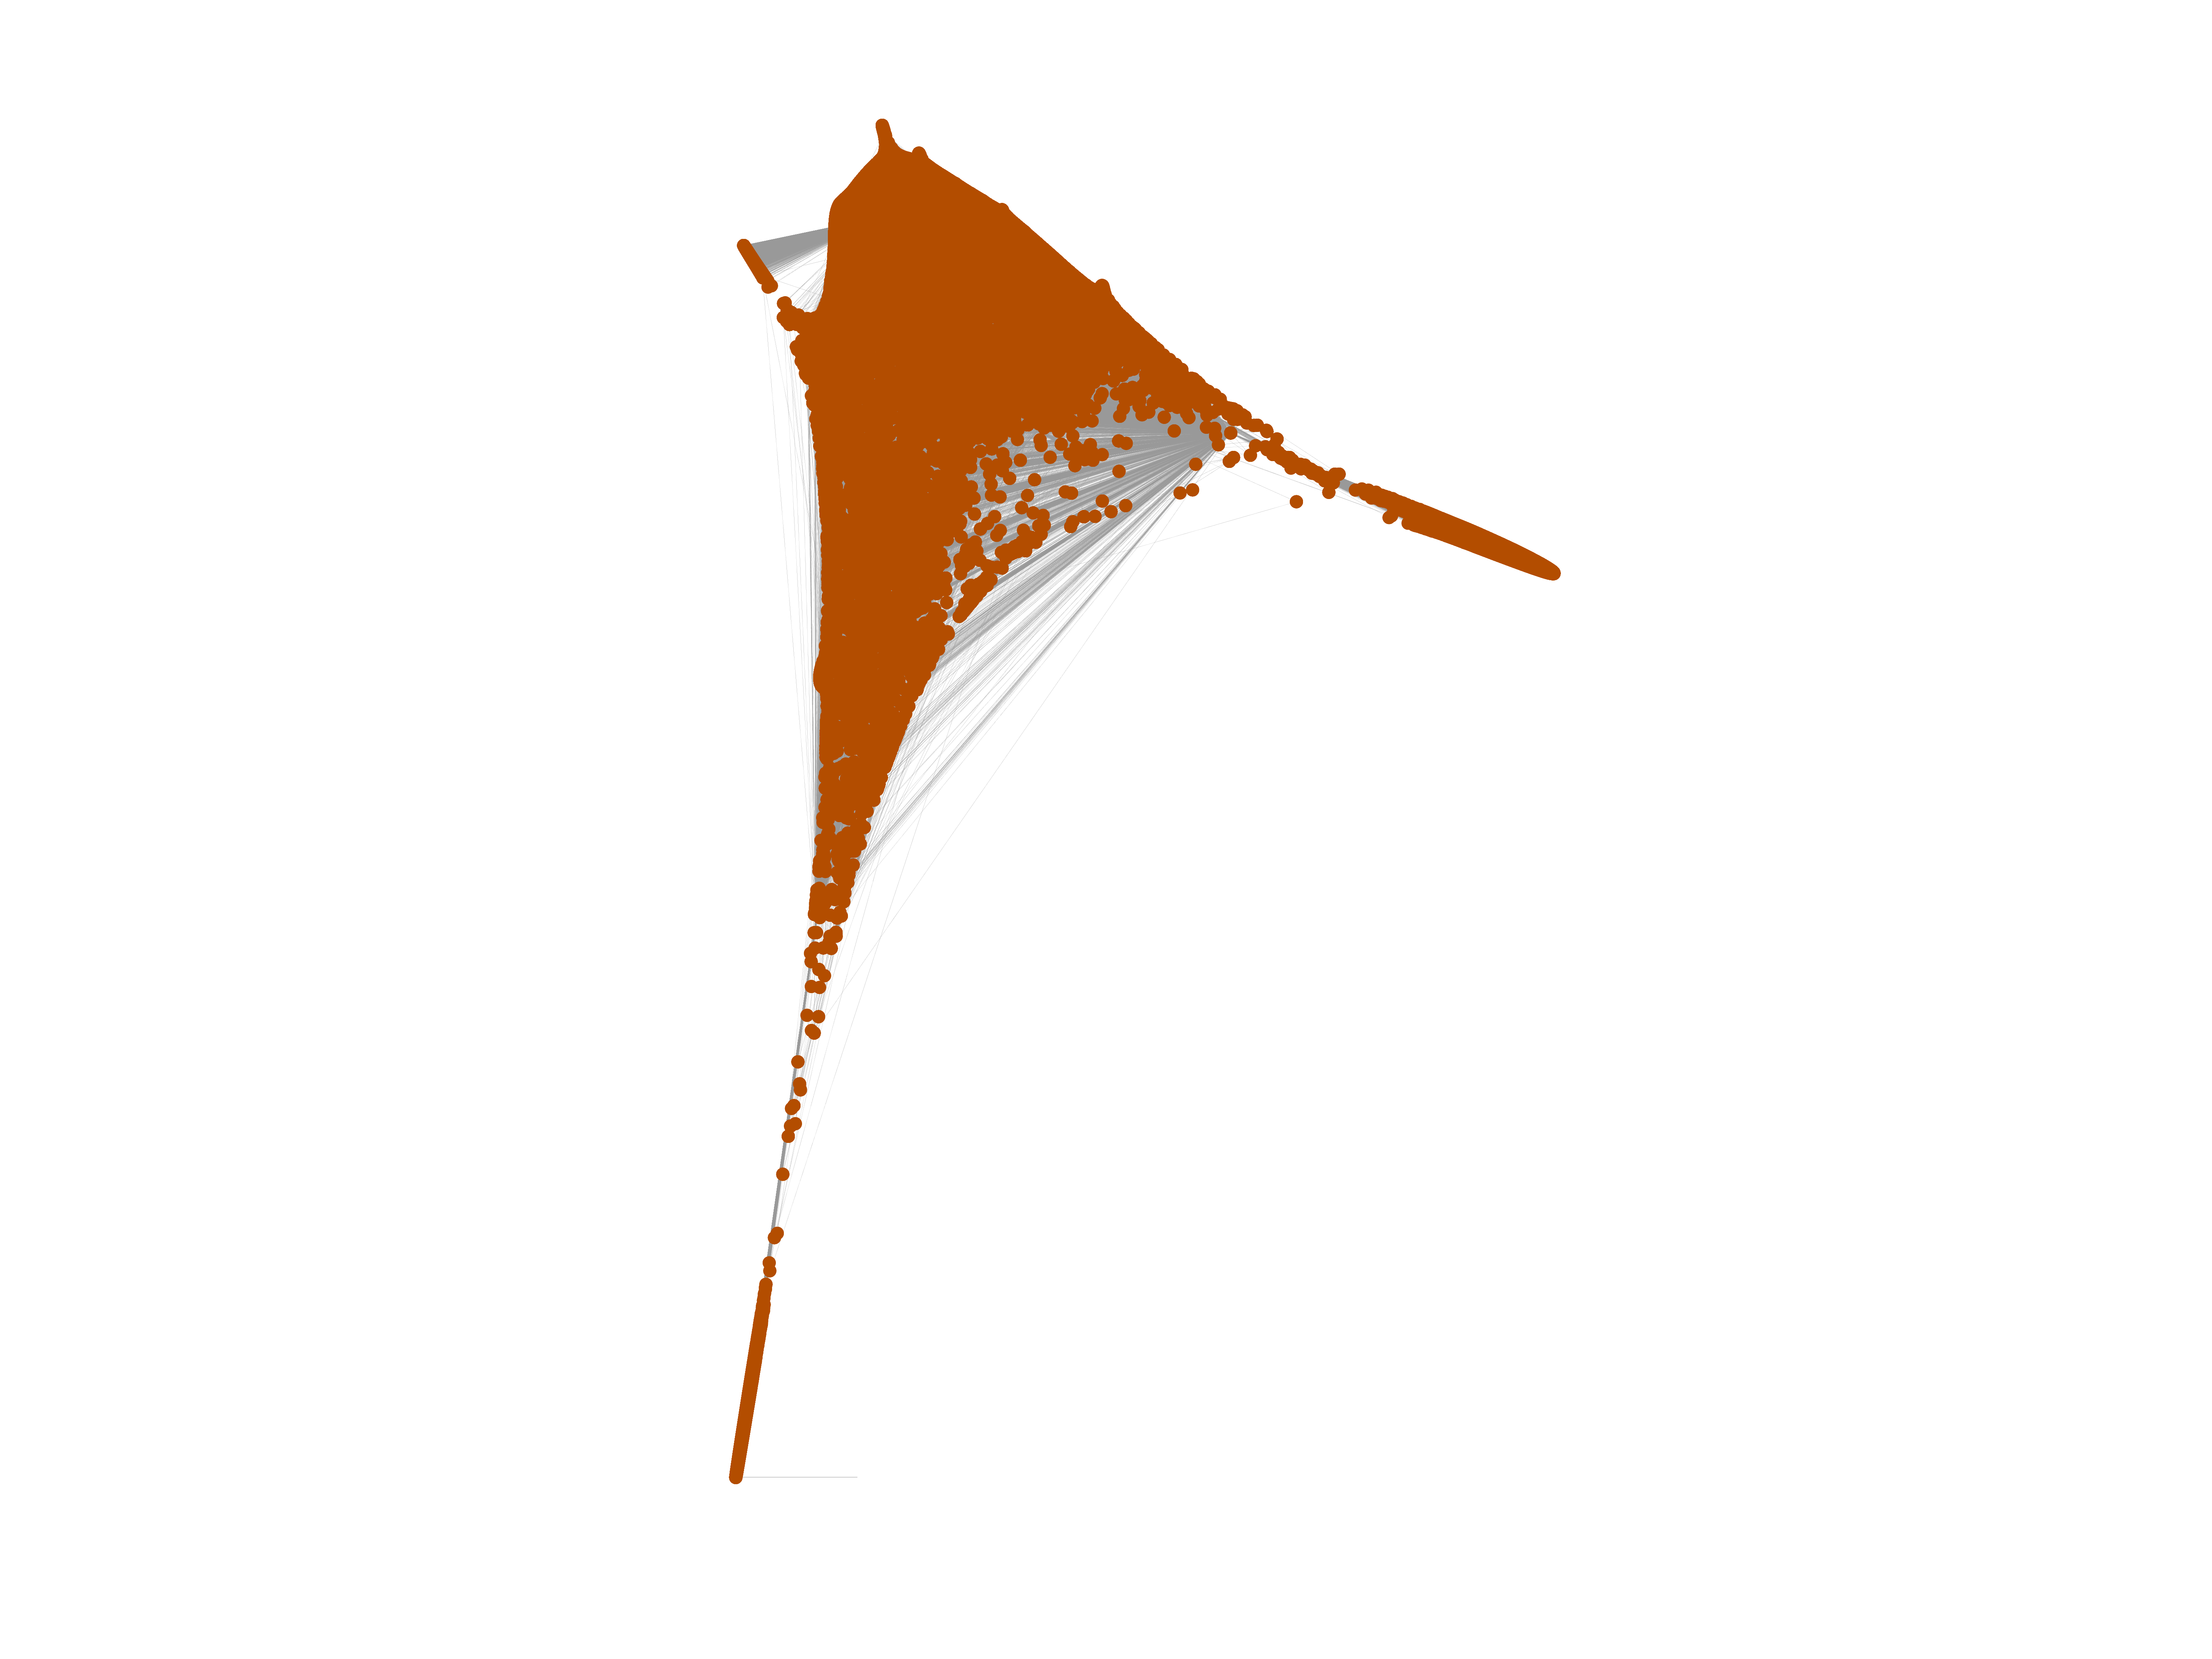
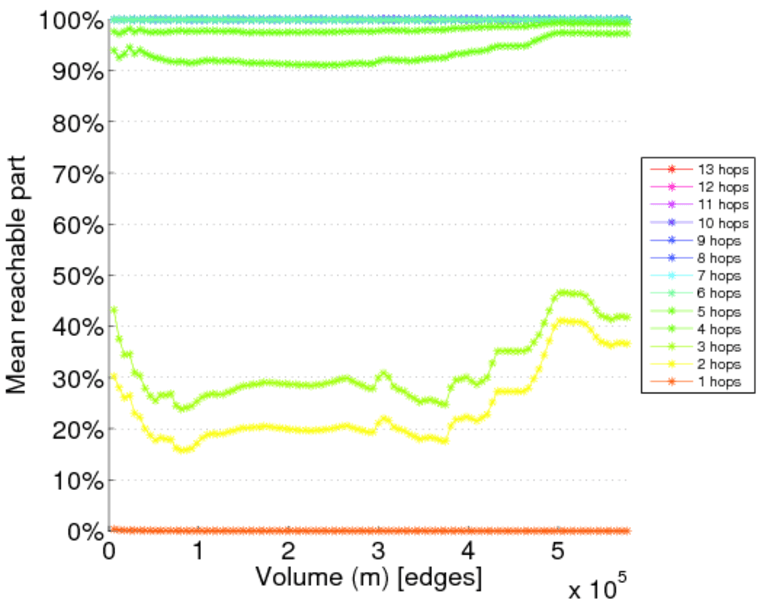
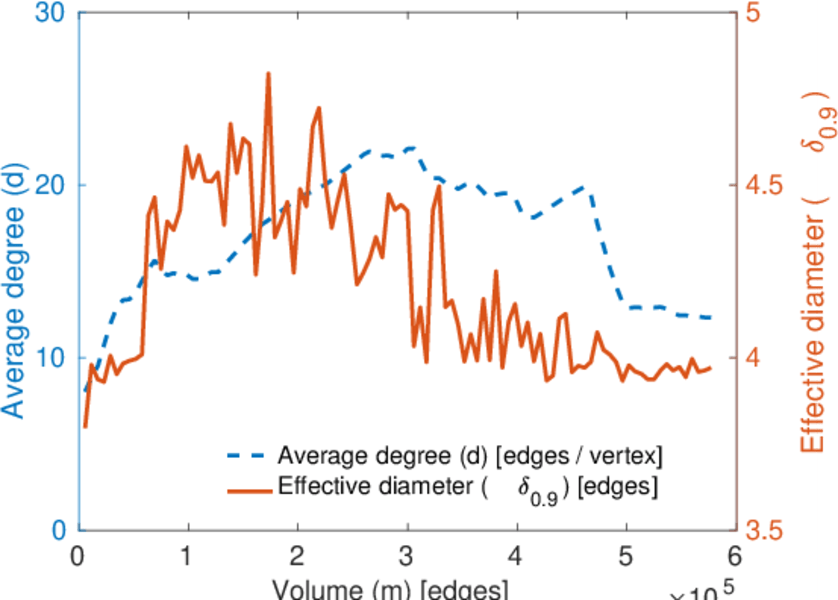
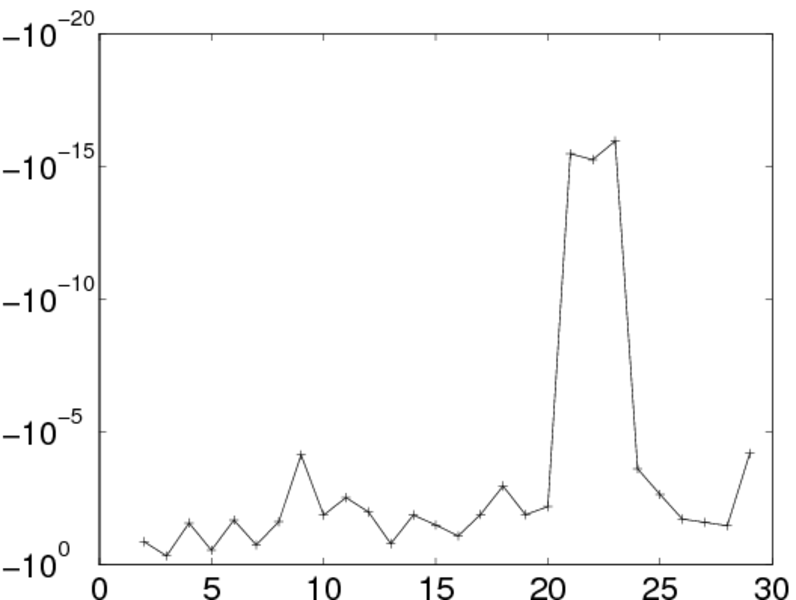
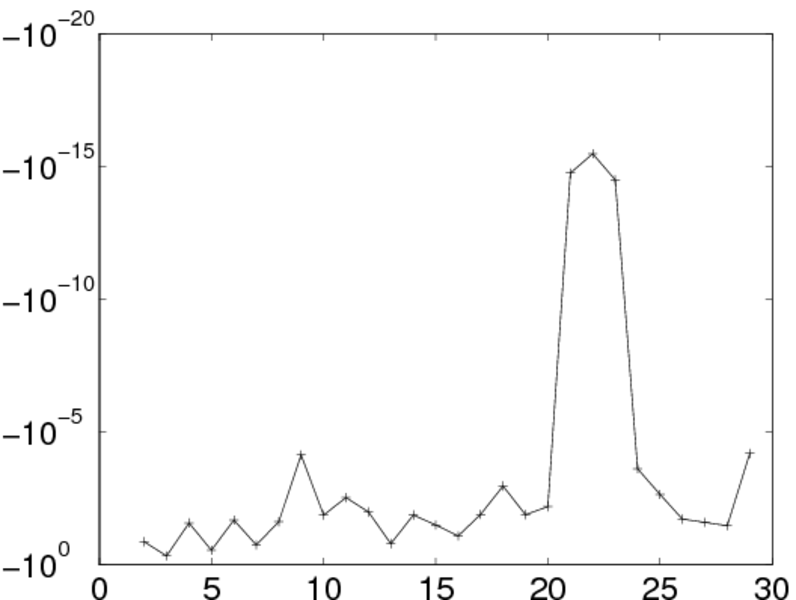
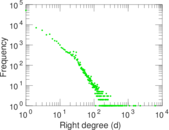
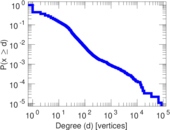
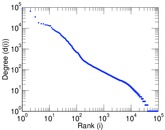
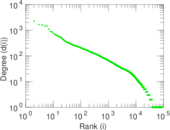
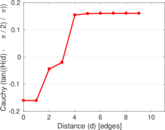
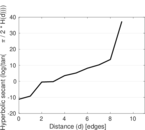
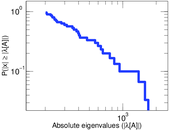
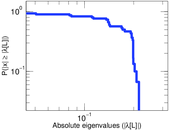
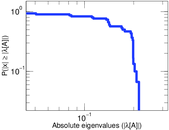
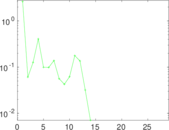
Plots


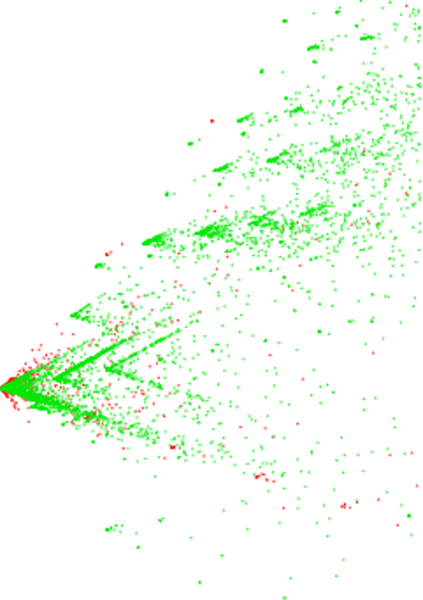
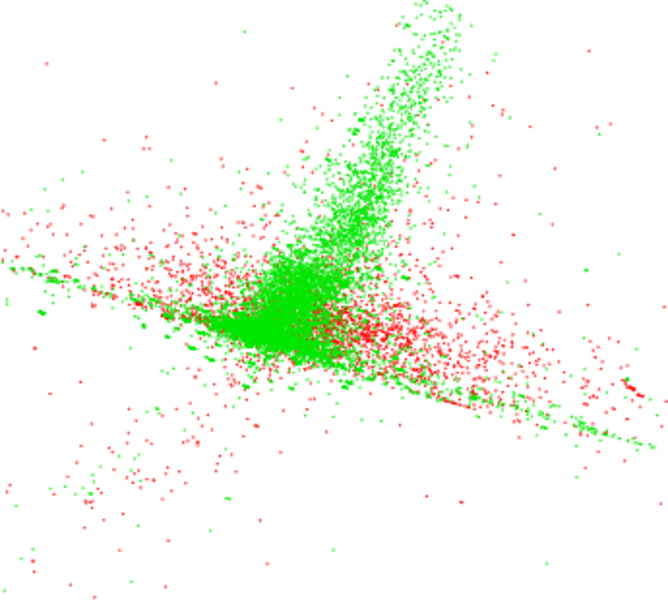
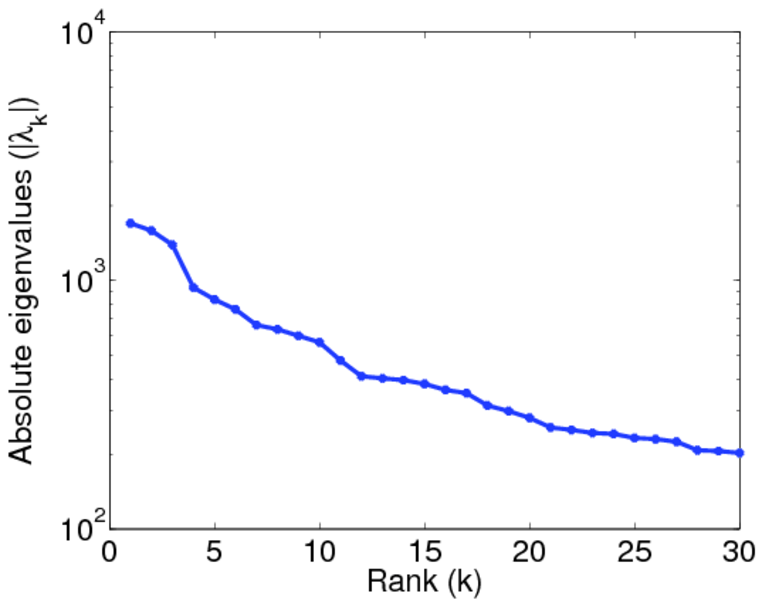
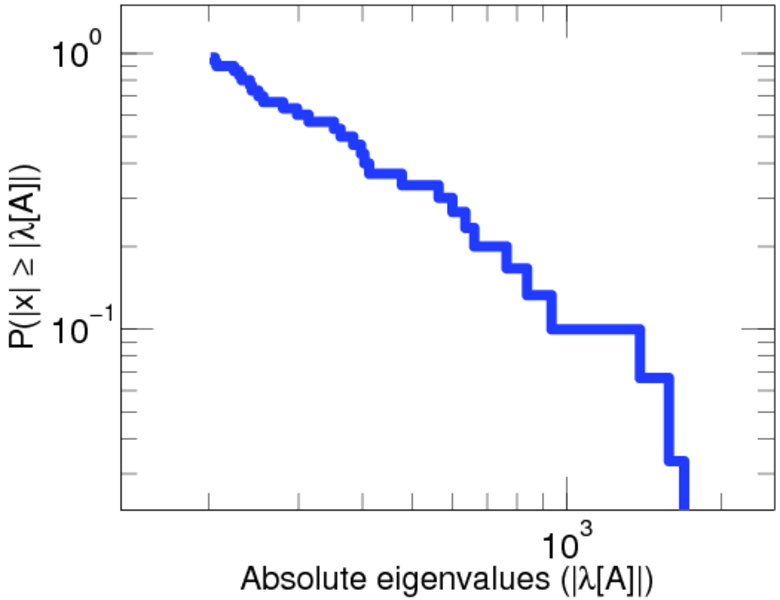
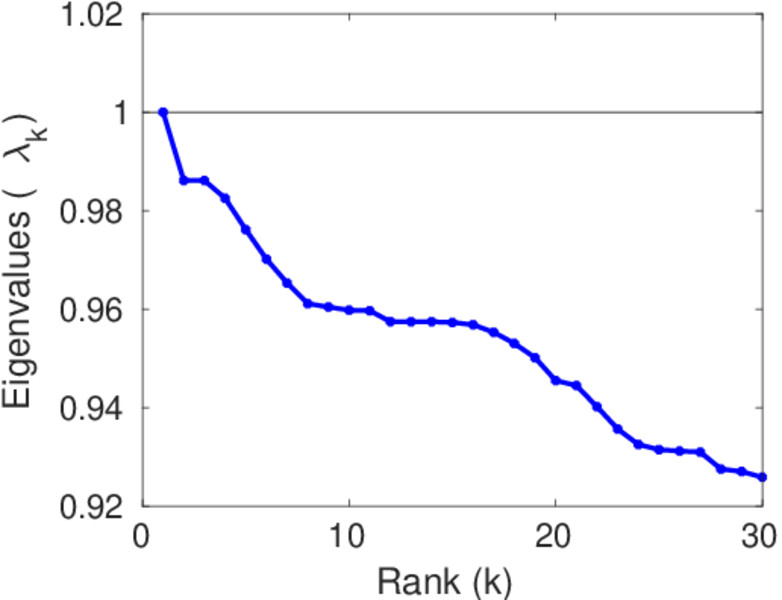
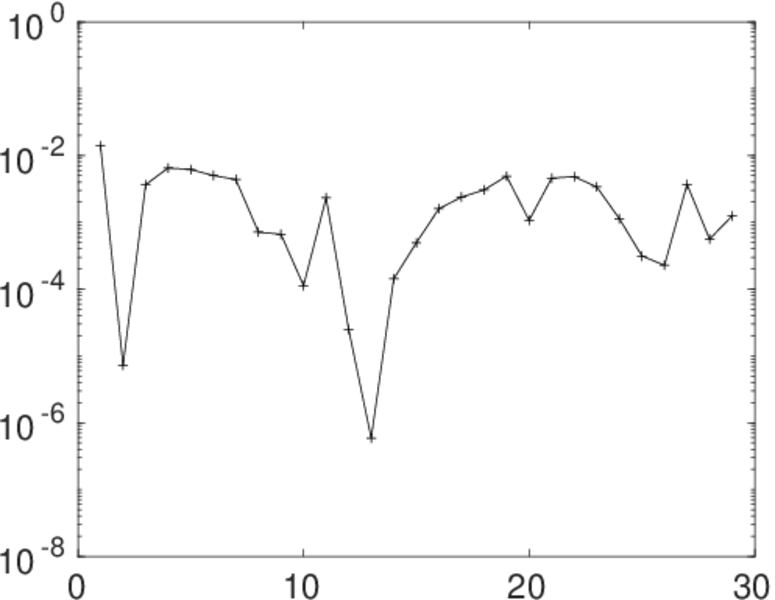
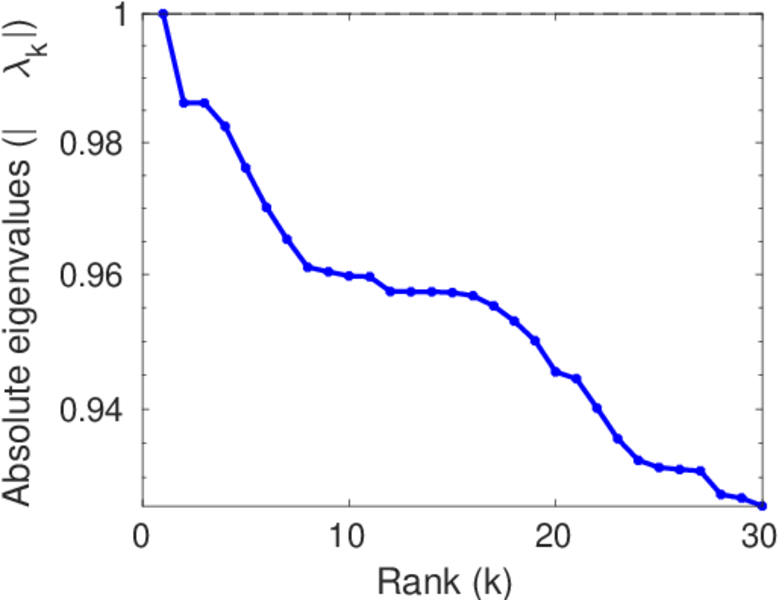
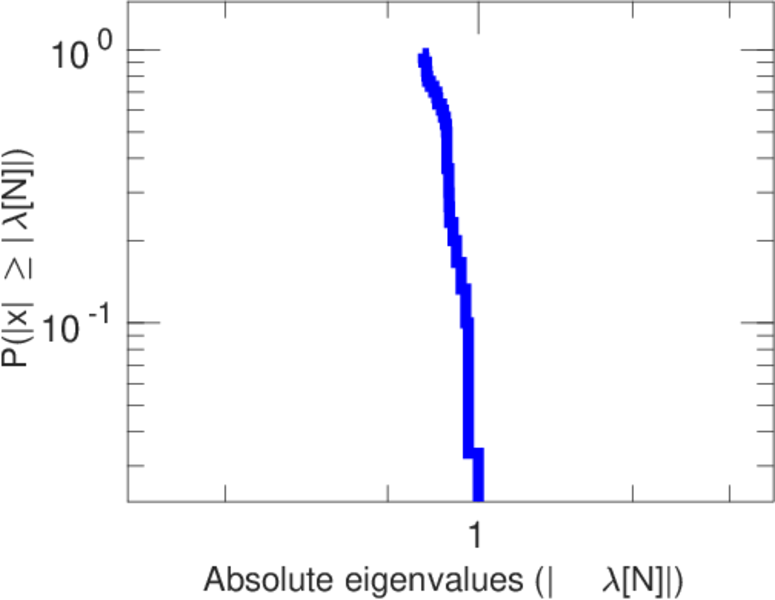
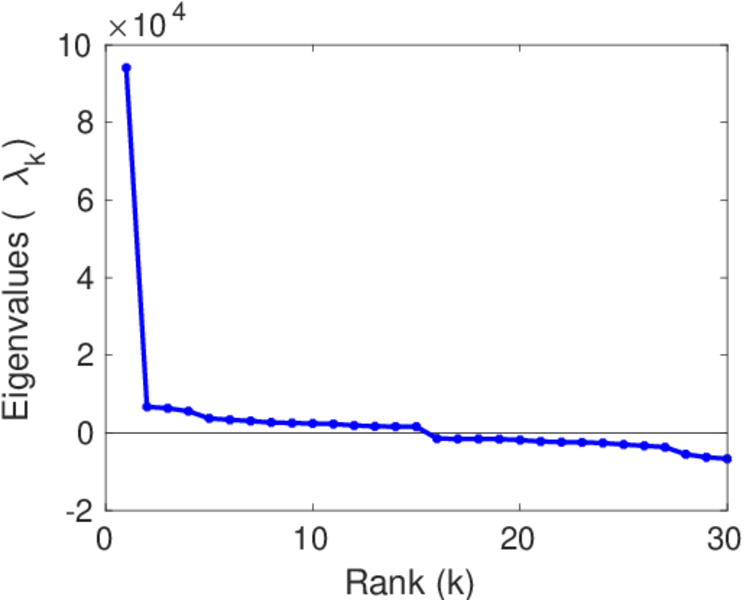
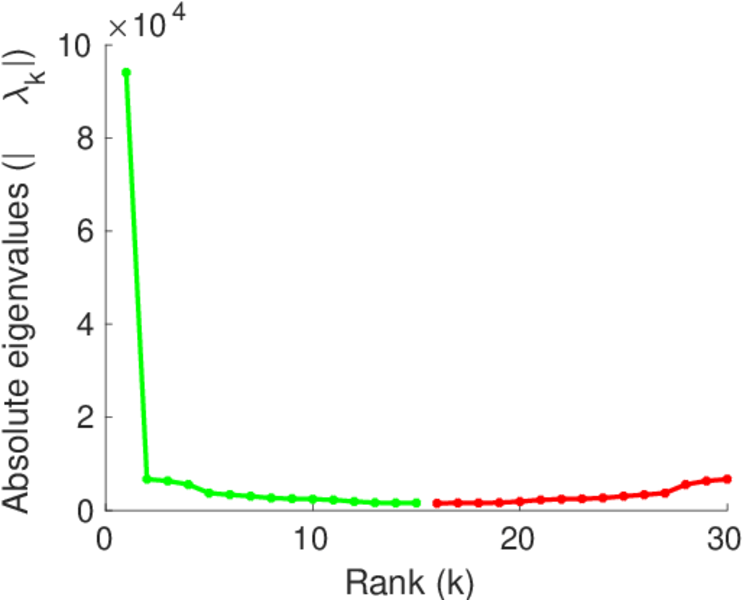
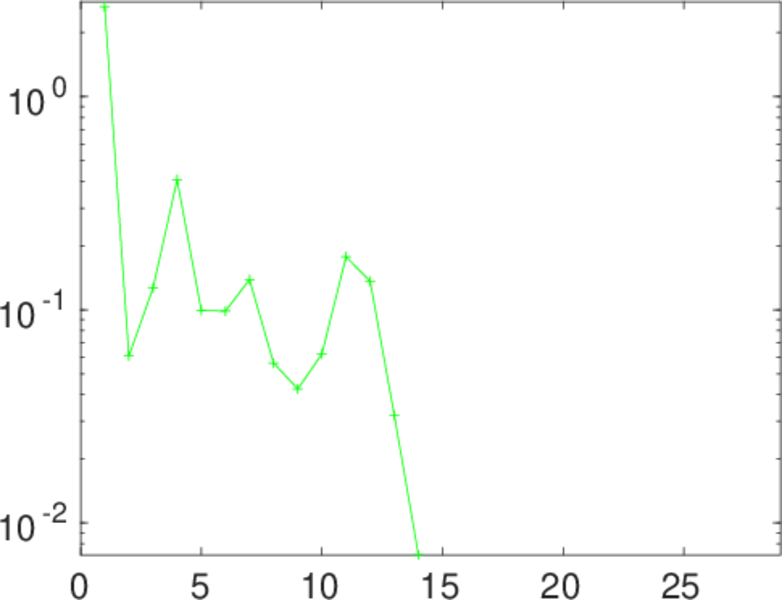
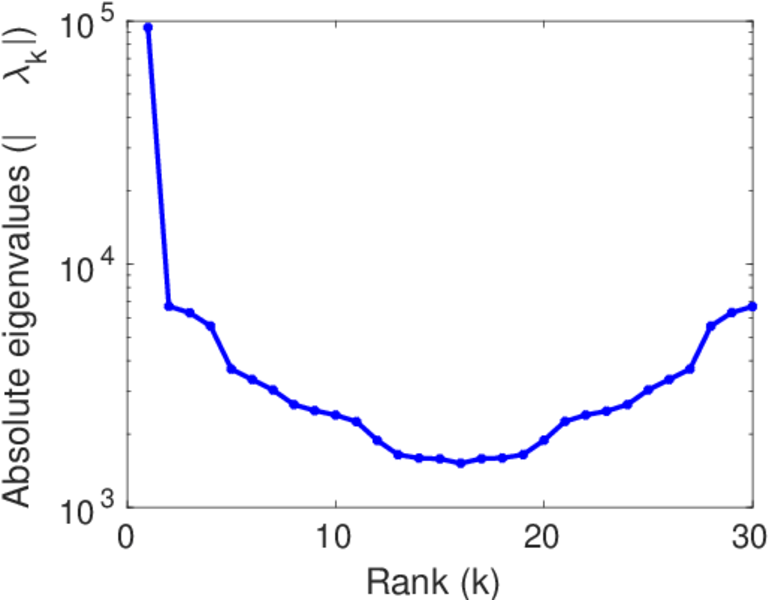
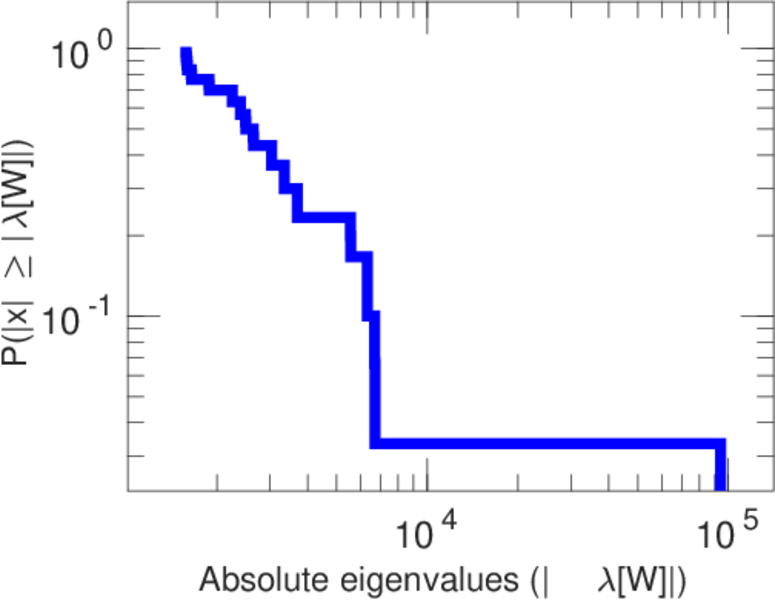
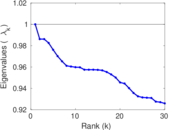
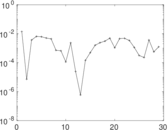
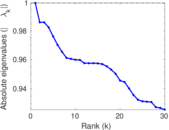
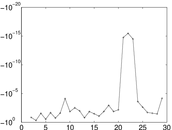
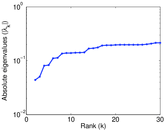
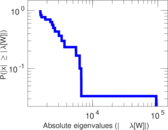
Matrix decompositions plots


Downloads
References
|
[1]
|
Jérôme Kunegis.
KONECT – The Koblenz Network Collection.
In Proc. Int. Conf. on World Wide Web Companion, pages
1343–1350, 2013.
[ http ]
|
|
[2]
|
Wikimedia Foundation.
Wikimedia downloads.
http://dumps.wikimedia.org/, January 2010.
|
 KONECT ‣ Networks ‣
Buy Me a Coffee
KONECT ‣ Networks ‣
Buy Me a Coffee