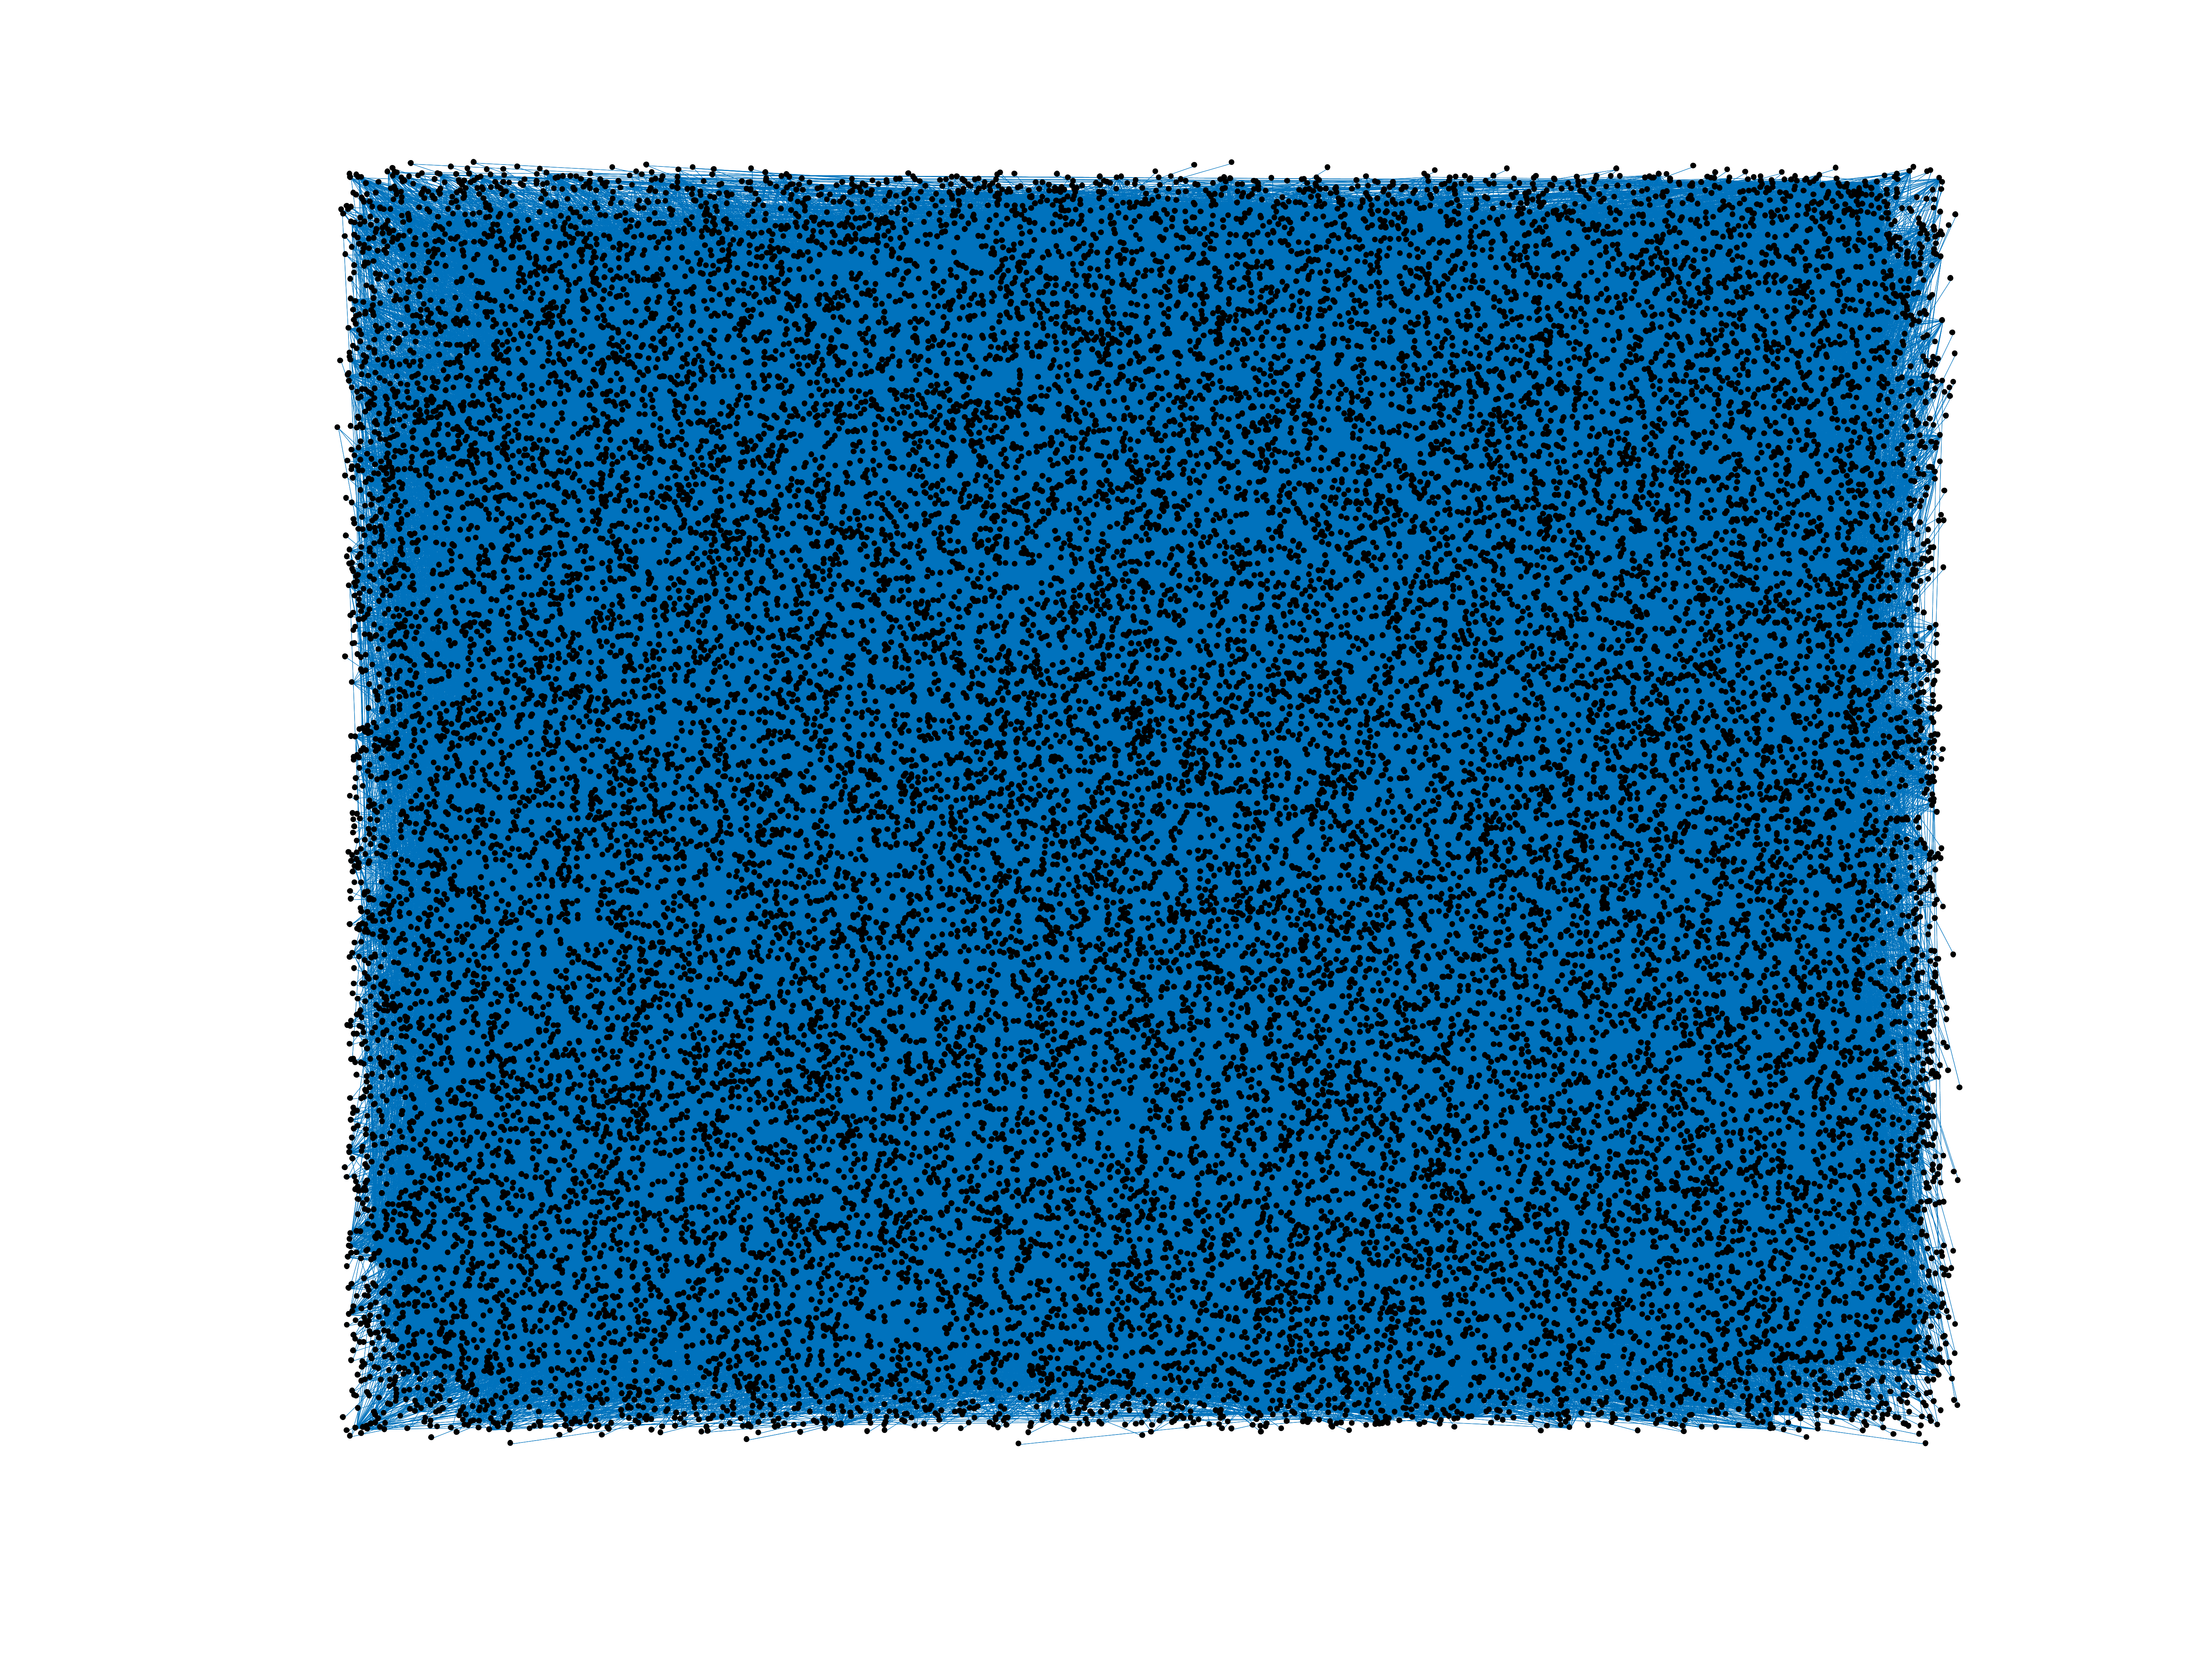
Wikipedia edits (bat-smg)
This is the bipartite edit network of the Samogitian Wikipedia. It contains
users and pages from the Samogitian Wikipedia, connected by edit events. Each
edge represents an edit. The dataset includes the timestamp of each edit.
Metadata
Statistics
| Size | n = | 28,718
|
| Left size | n1 = | 1,679
|
| Right size | n2 = | 27,039
|
| Volume | m = | 319,814
|
| Unique edge count | m̿ = | 145,940
|
| Wedge count | s = | 285,510,331
|
| Claw count | z = | 597,395,376,171
|
| Cross count | x = | 1,132,648,284,325,356
|
| Square count | q = | 676,046,449
|
| 4-Tour count | T4 = | 6,550,753,364
|
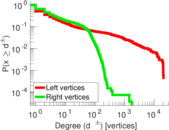
| Maximum degree | dmax = | 20,587
|
| Maximum left degree | d1max = | 20,587
|
| Maximum right degree | d2max = | 1,744
|
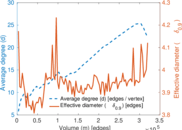
| Average degree | d = | 22.272 7
|
| Average left degree | d1 = | 190.479
|
| Average right degree | d2 = | 11.827 9
|
| Fill | p = | 0.003 214 65
|
| Average edge multiplicity | m̃ = | 2.191 41
|
| Size of LCC | N = | 27,963
|
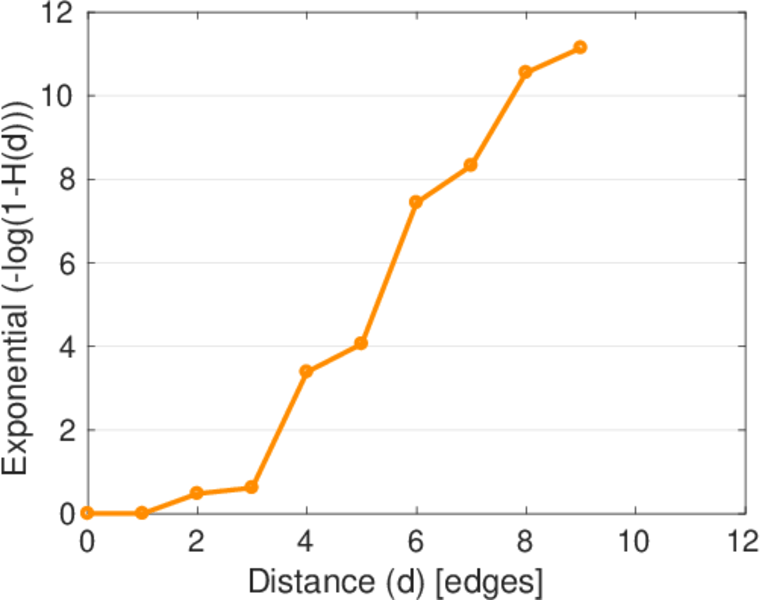
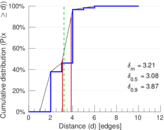
| Diameter | δ = | 13
|
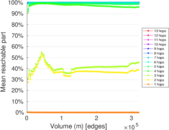
| 50-Percentile effective diameter | δ0.5 = | 3.077 42
|
| 90-Percentile effective diameter | δ0.9 = | 3.868 94
|
| Median distance | δM = | 4
|
| Mean distance | δm = | 3.211 59
|
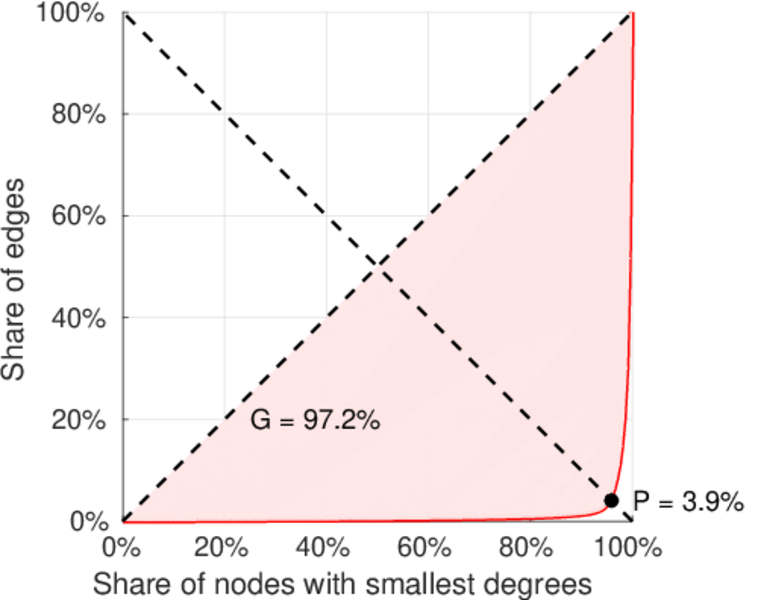
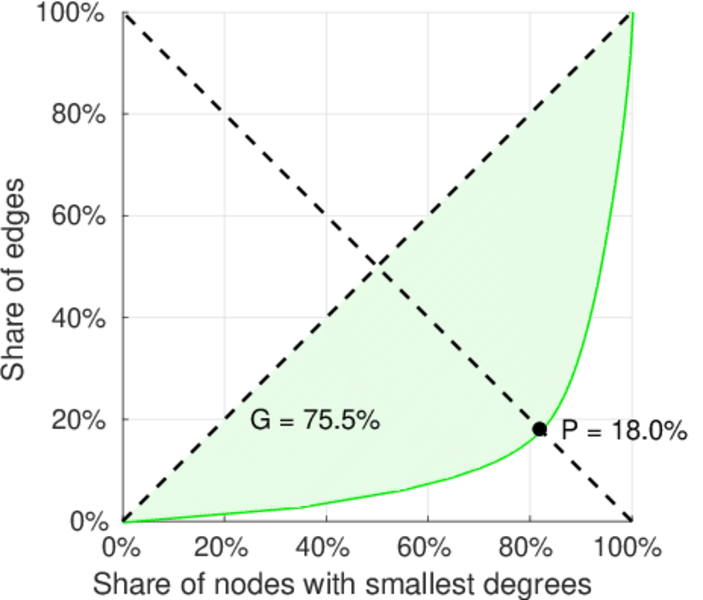
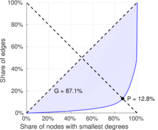
| Gini coefficient | G = | 0.871 154
|
| Balanced inequality ratio | P = | 0.131 059
|
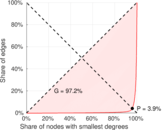
| Left balanced inequality ratio | P1 = | 0.039 032 1
|
| Right balanced inequality ratio | P2 = | 0.179 554
|
| Relative edge distribution entropy | Her = | 0.730 453
|
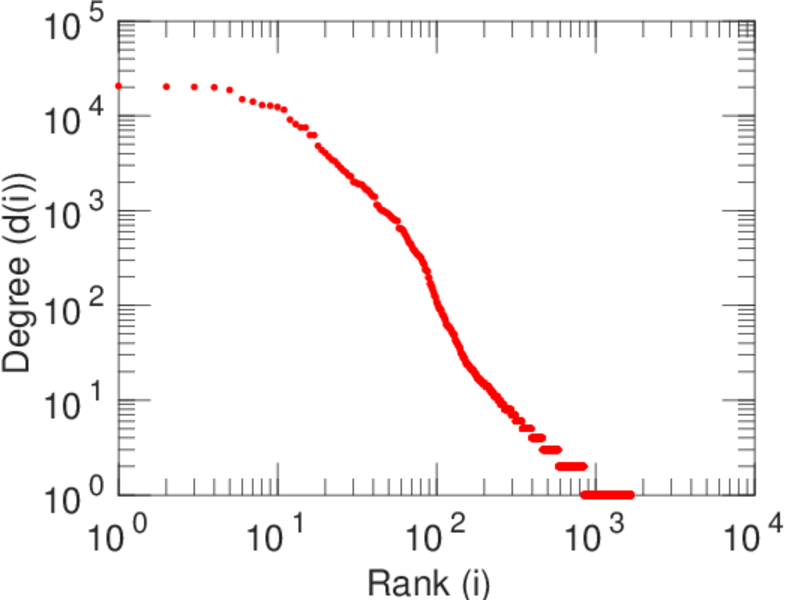
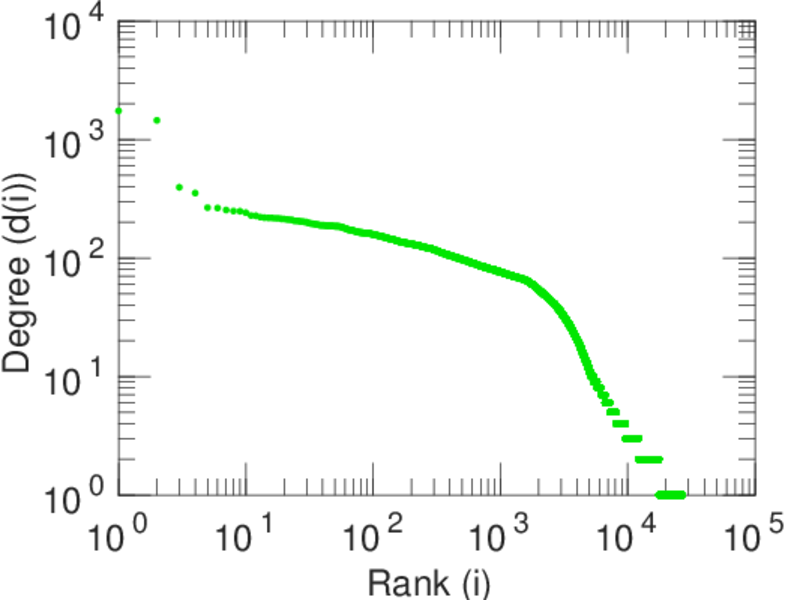
| Power law exponent | γ = | 2.070 26
|
| Tail power law exponent | γt = | 1.881 00
|
| Tail power law exponent with p | γ3 = | 1.881 00
|
| p-value | p = | 0.000 00
|
| Left tail power law exponent with p | γ3,1 = | 1.731 00
|
| Left p-value | p1 = | 0.000 00
|
| Right tail power law exponent with p | γ3,2 = | 7.541 00
|
| Right p-value | p2 = | 0.030 000 0
|
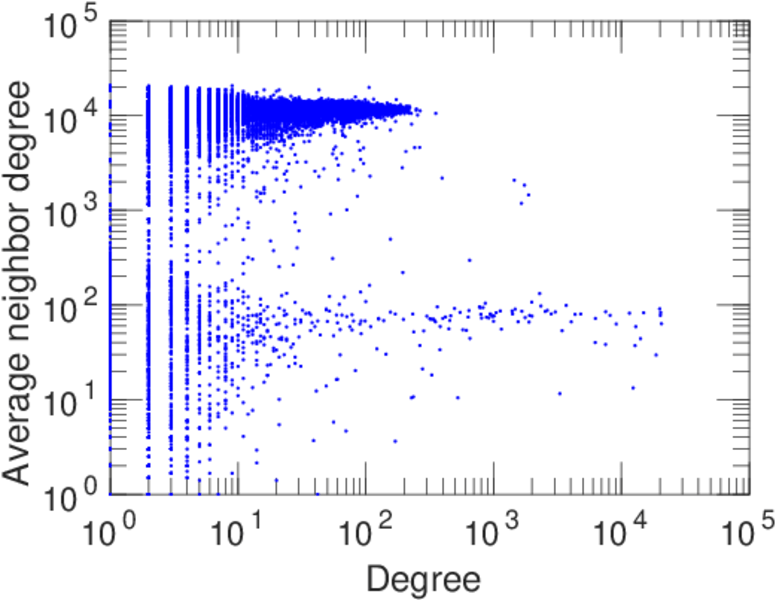
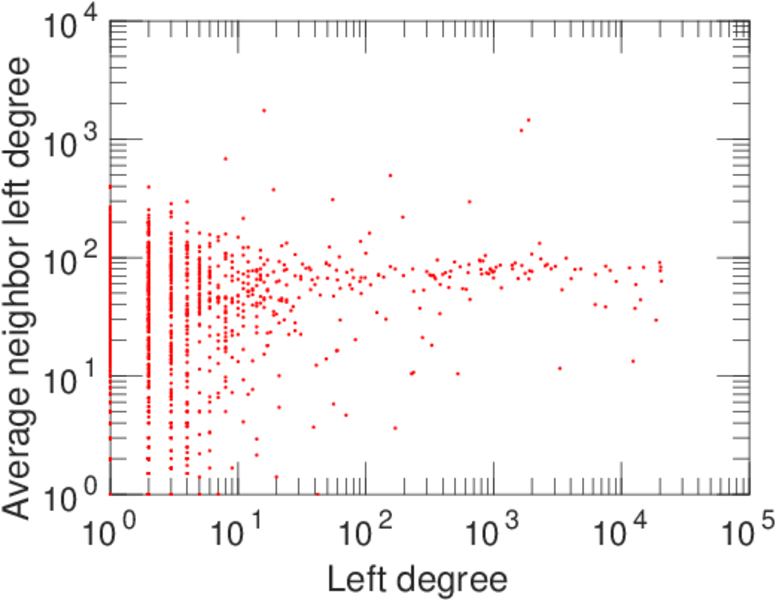
| Degree assortativity | ρ = | −0.475 125
|
| Degree assortativity p-value | pρ = | 0.000 00
|
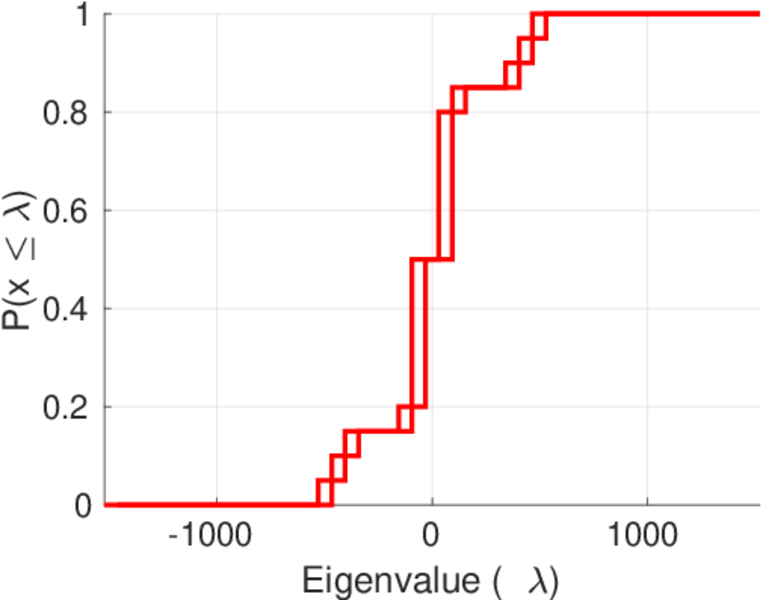
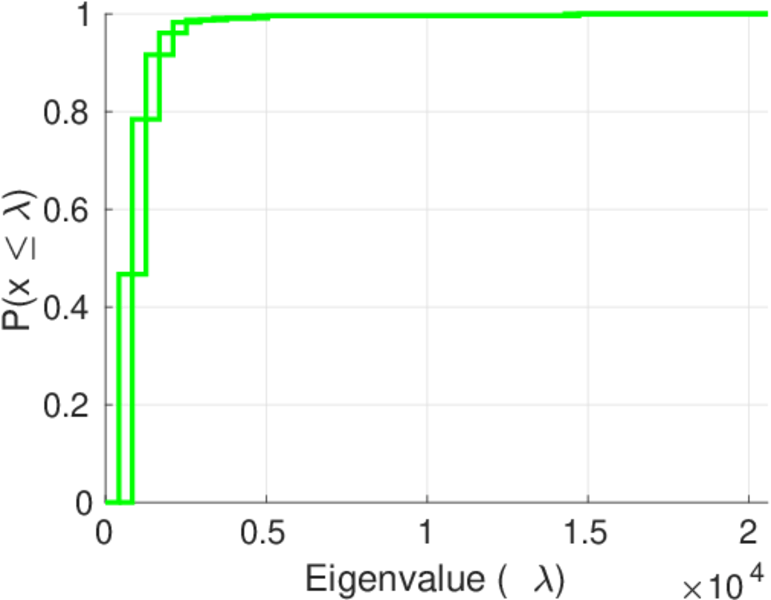
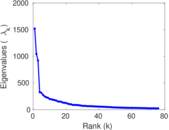
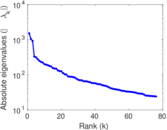
| Spectral norm | α = | 1,520.46
|
| Algebraic connectivity | a = | 0.036 994 3
|
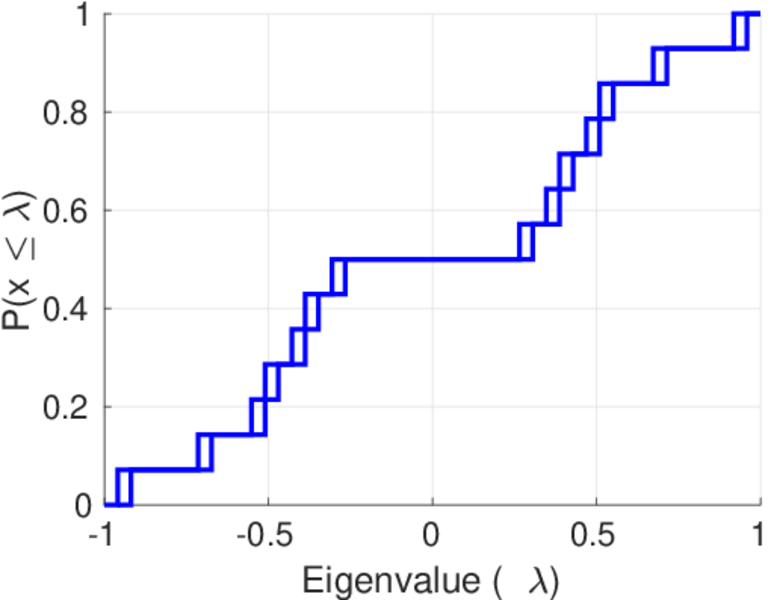
| Spectral separation | |λ1[A] / λ2[A]| = | 1.456 82
|
| Controllability | C = | 25,545
|
| Relative controllability | Cr = | 0.892 152
|
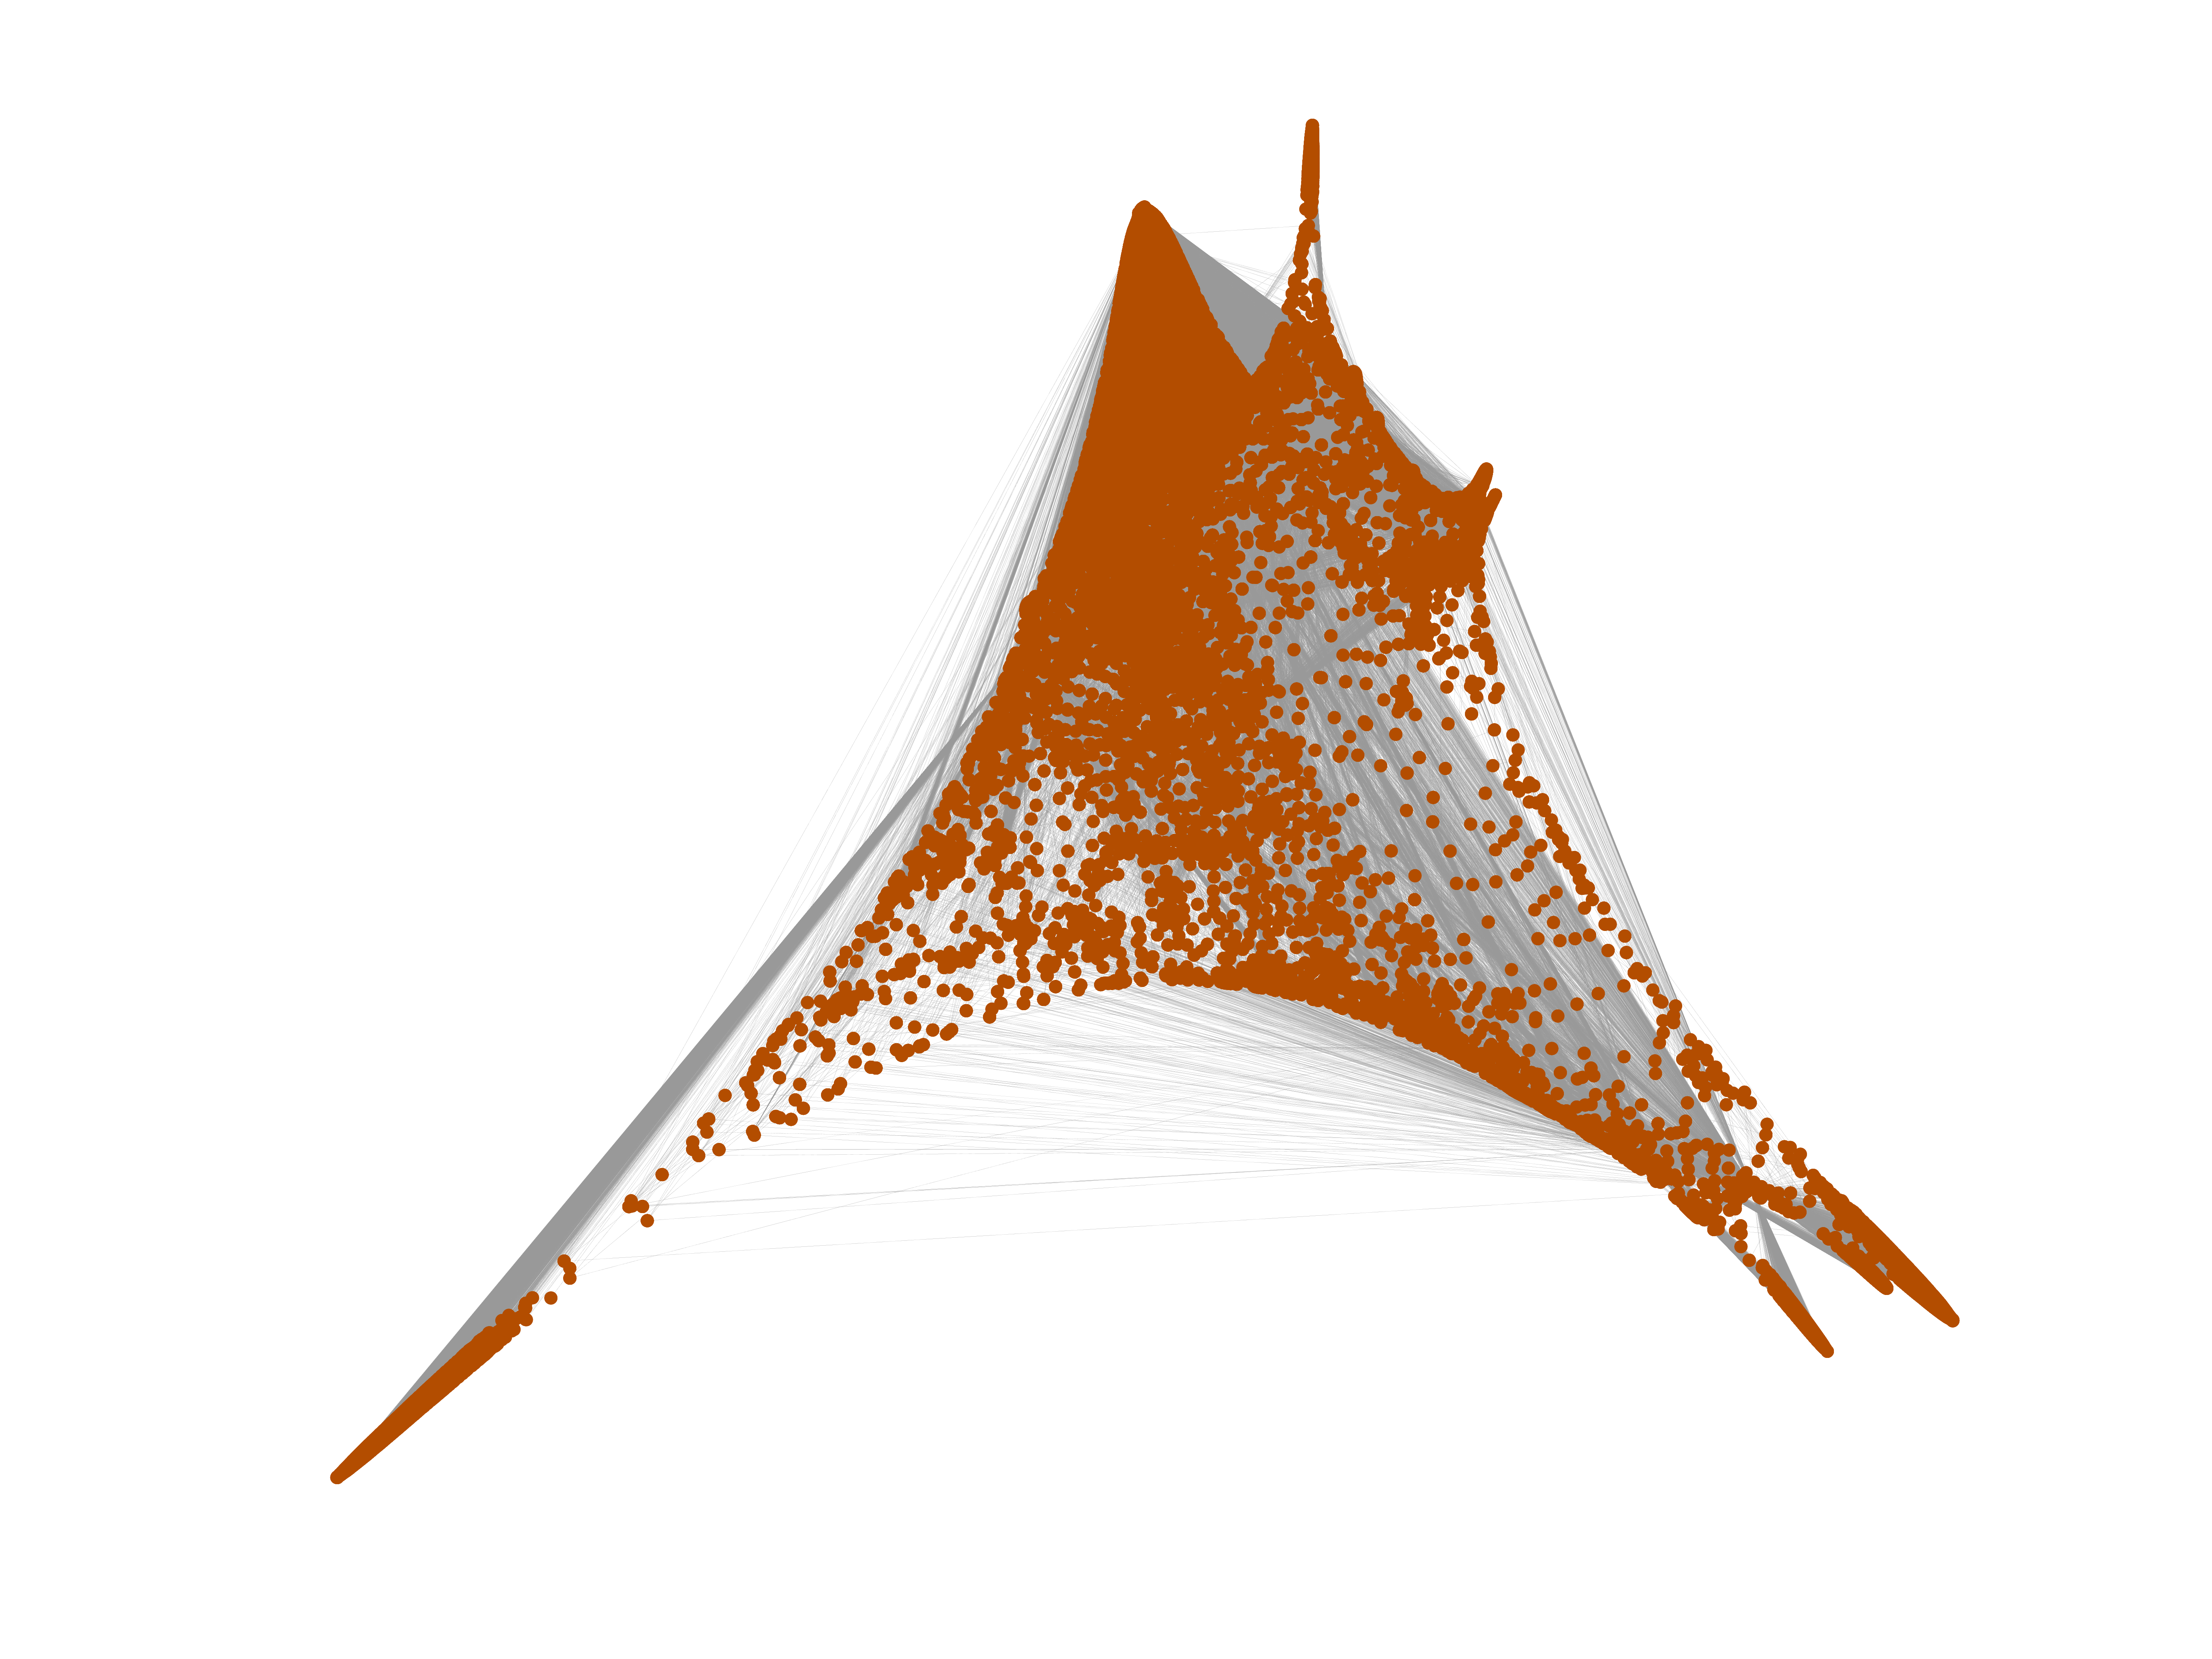
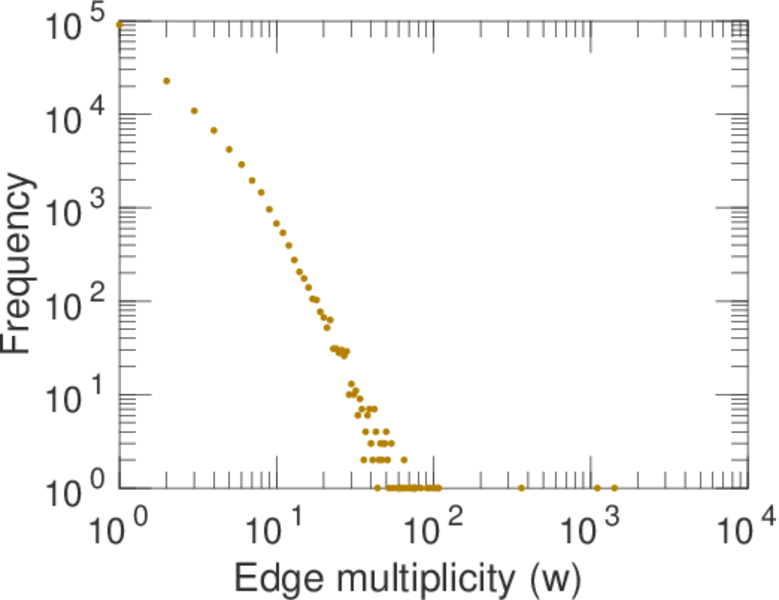
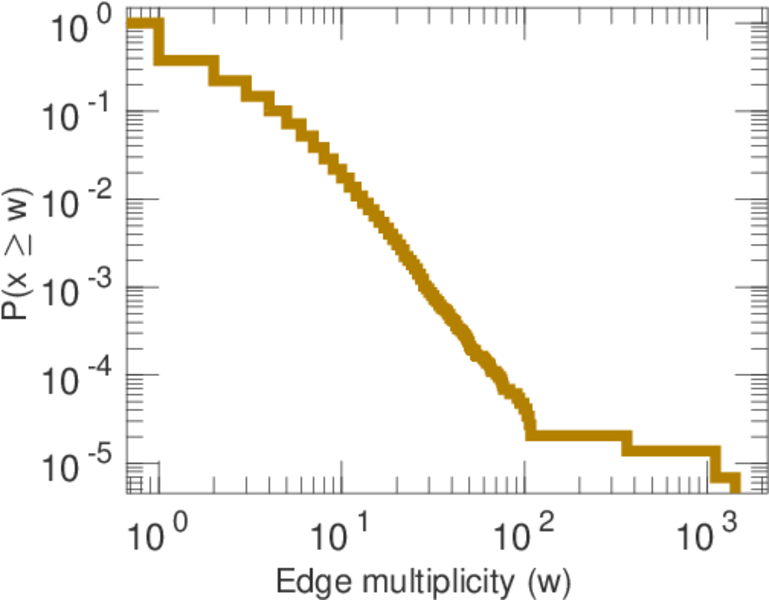
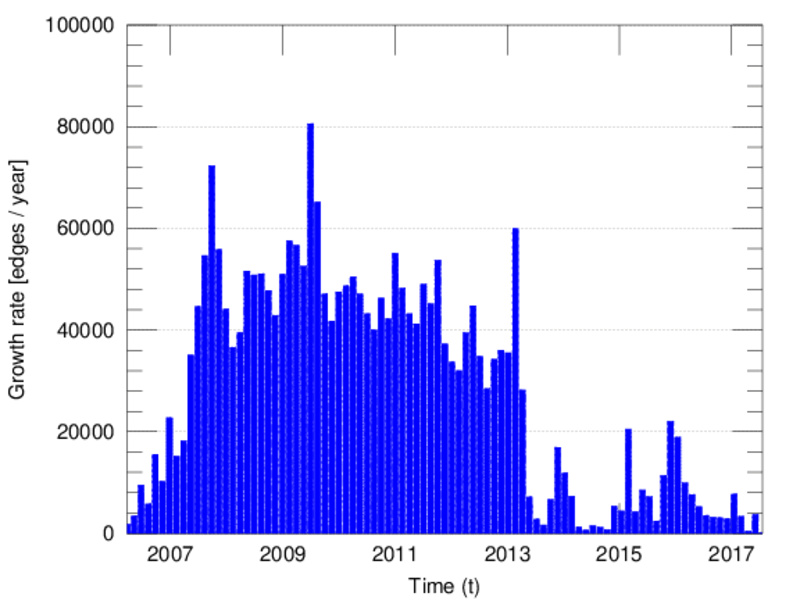
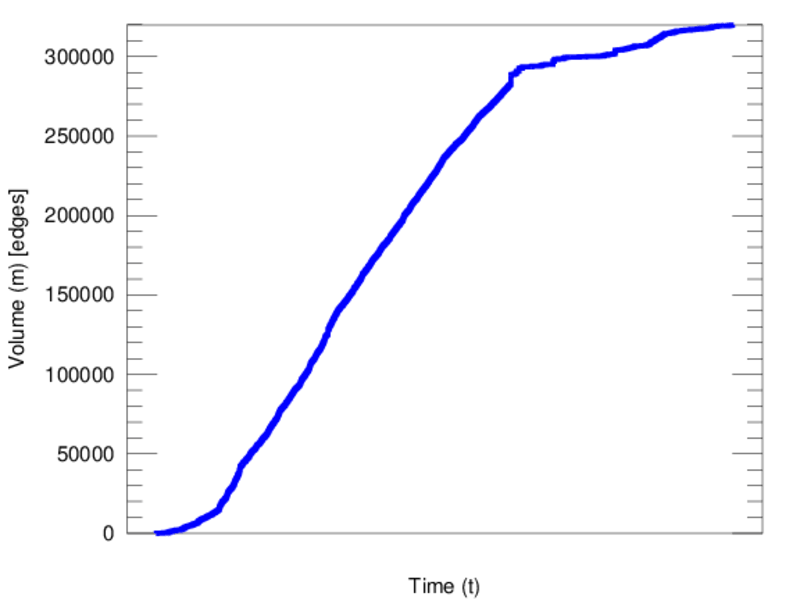
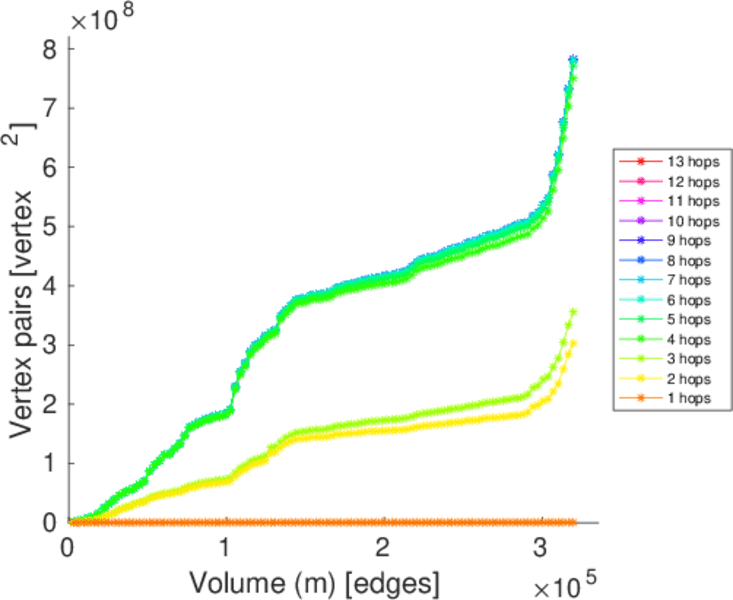
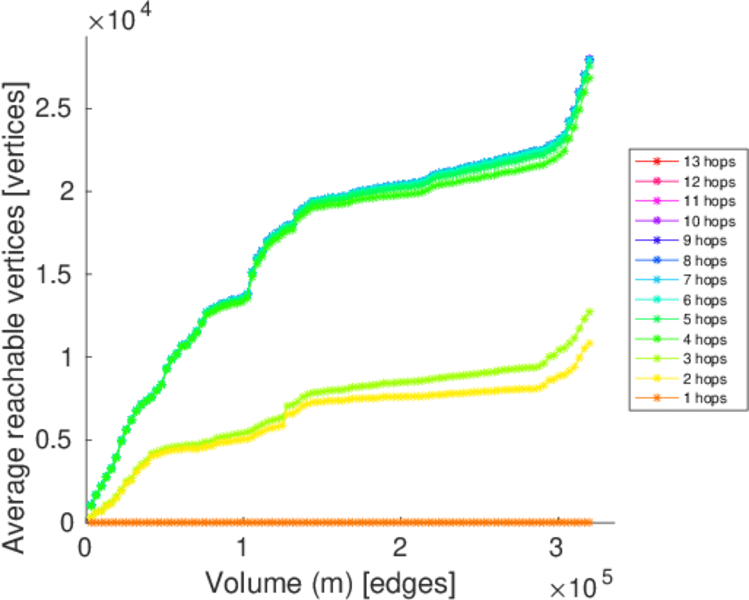
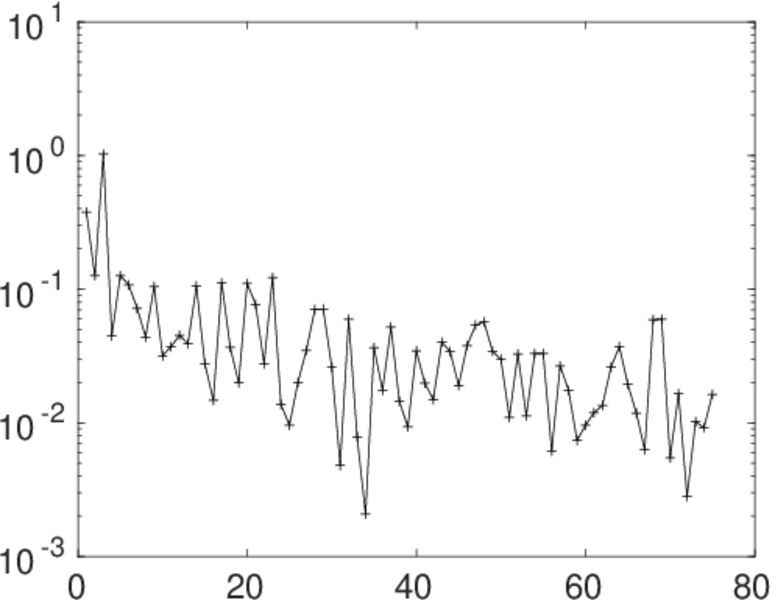
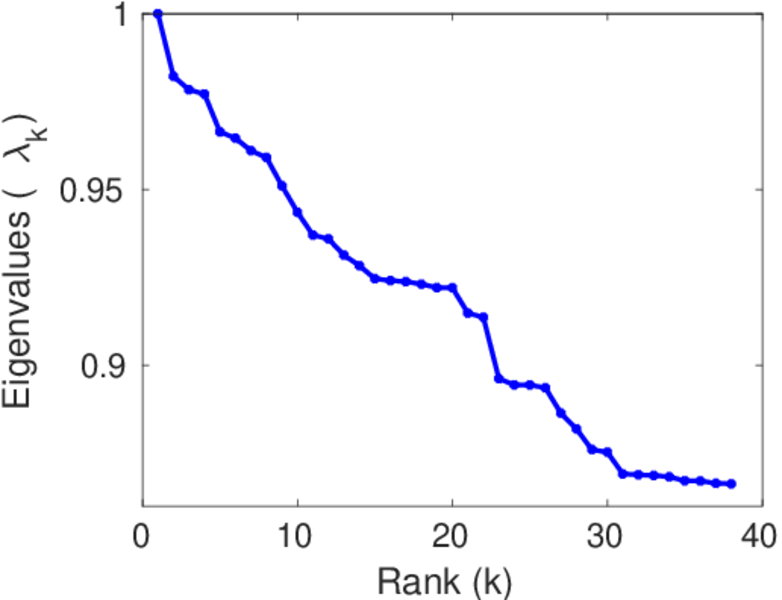
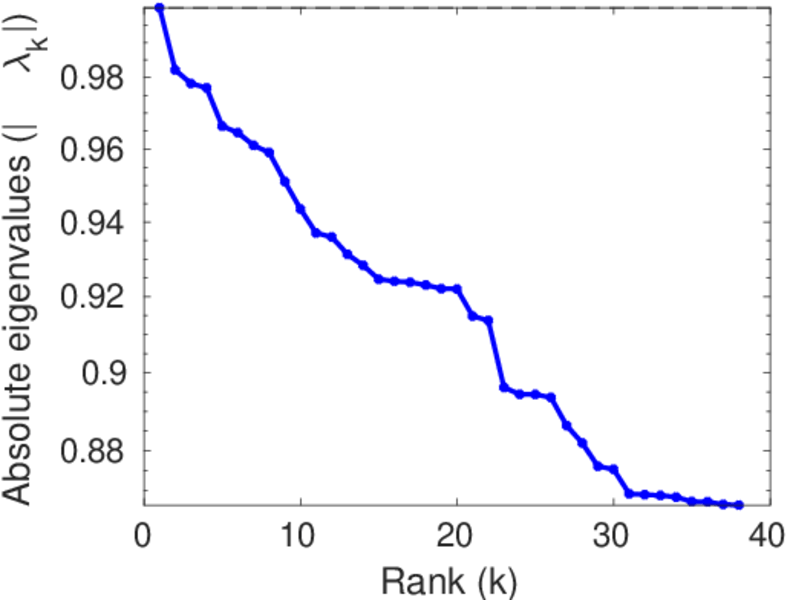
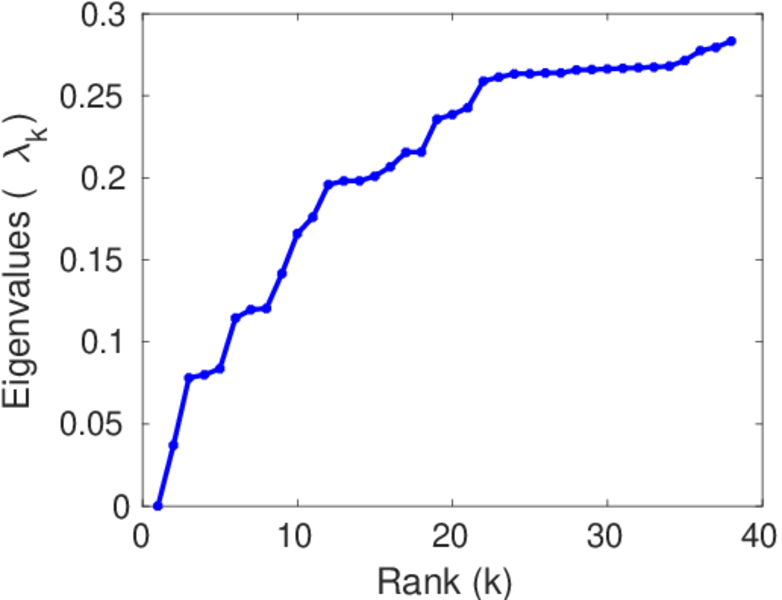
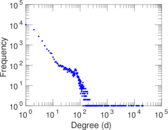
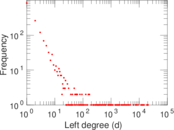
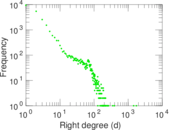
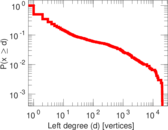
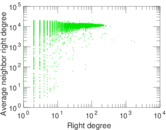
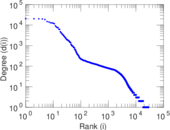
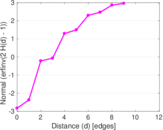
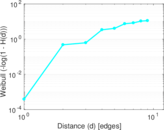
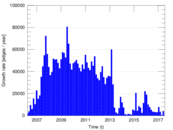
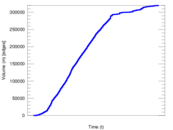
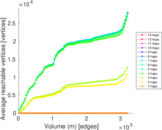
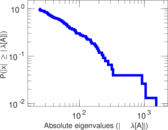
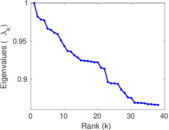
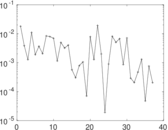
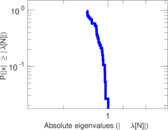
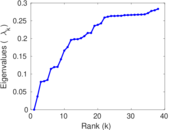
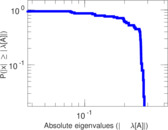
Plots


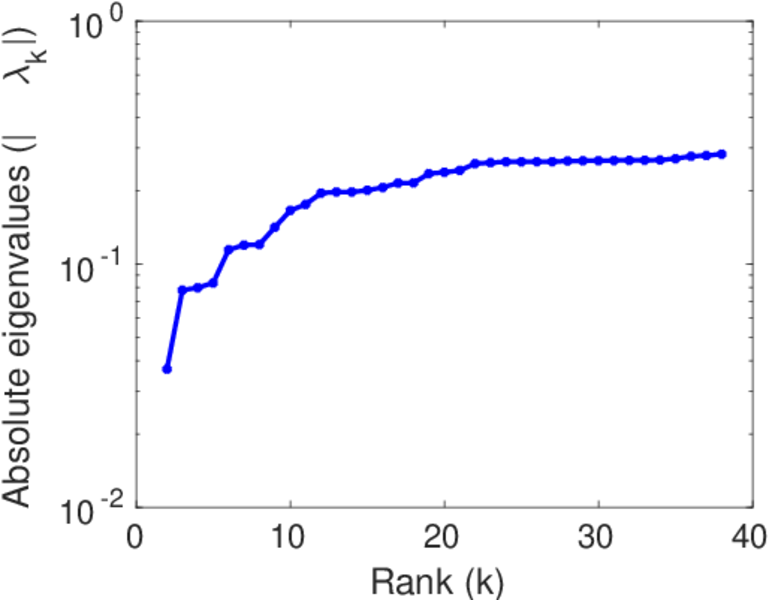
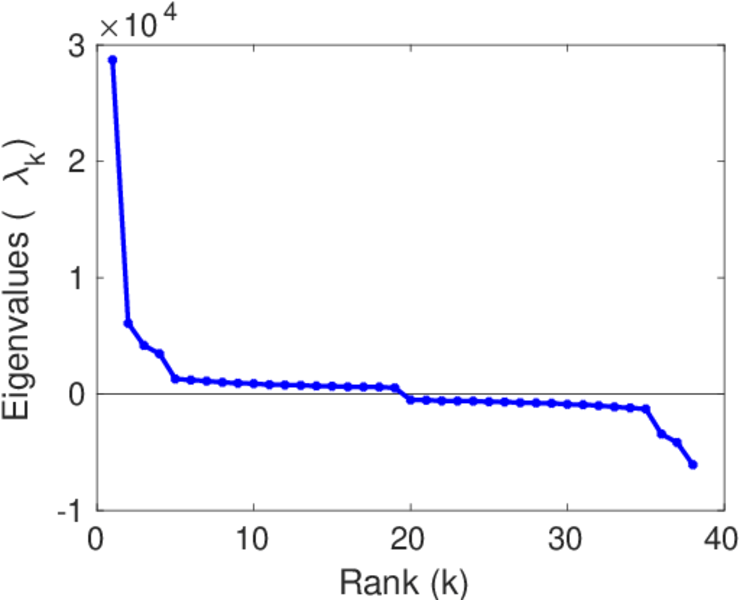
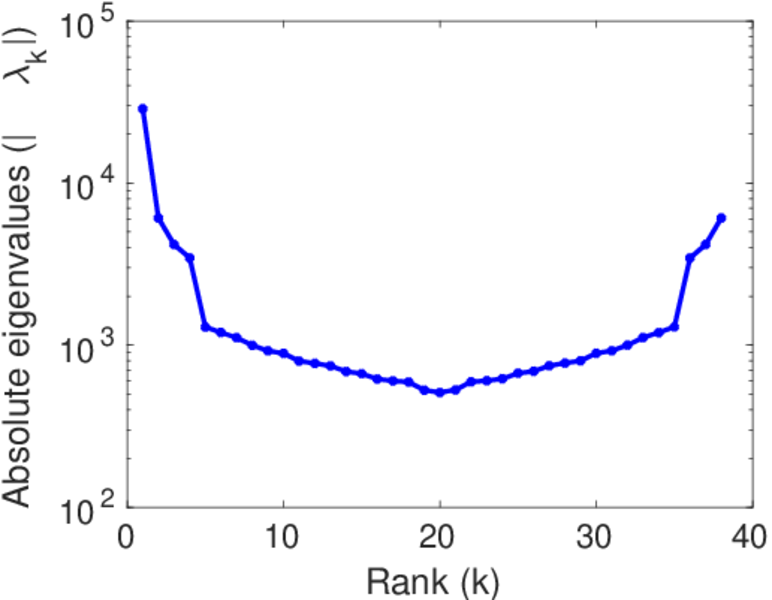
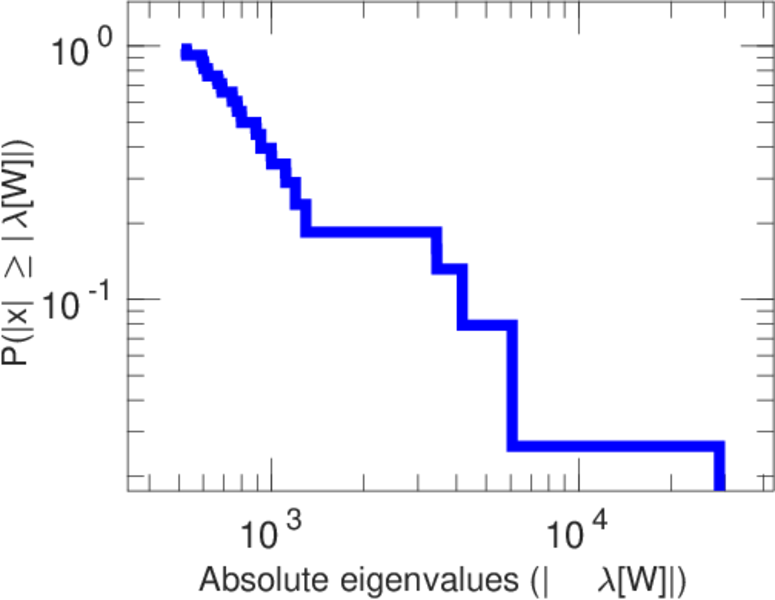
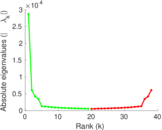
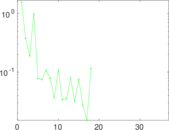
Matrix decompositions plots


Downloads
References
|
[1]
|
Jérôme Kunegis.
KONECT – The Koblenz Network Collection.
In Proc. Int. Conf. on World Wide Web Companion, pages
1343–1350, 2013.
[ http ]
|
|
[2]
|
Wikimedia Foundation.
Wikimedia downloads.
http://dumps.wikimedia.org/, January 2010.
|
 KONECT ‣ Networks ‣
Buy Me a Coffee
KONECT ‣ Networks ‣
Buy Me a Coffee