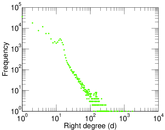
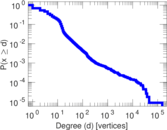
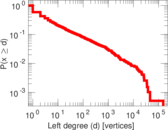
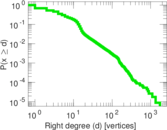
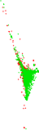
Wikipedia edits (ba)
This is the bipartite edit network of the Bashkir Wikipedia. It contains users
and pages from the Bashkir Wikipedia, connected by edit events. Each edge
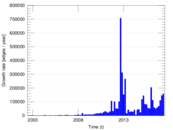
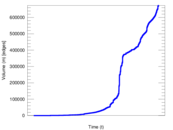
represents an edit. The dataset includes the timestamp of each edit.
Metadata
Statistics
| Size | n = | 114,918
|
| Left size | n1 = | 1,934
|
| Right size | n2 = | 112,984
|
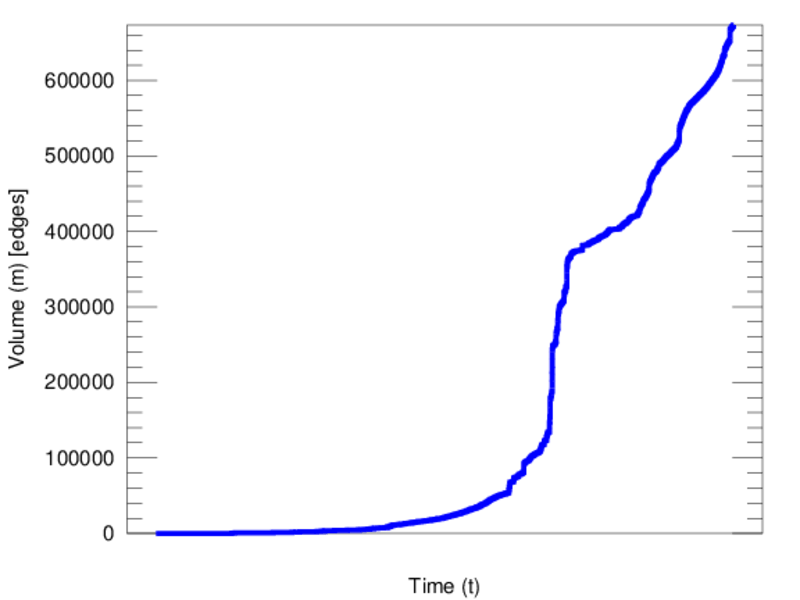
| Volume | m = | 673,465
|
| Unique edge count | m̿ = | 331,141
|
| Wedge count | s = | 3,047,044,813
|
| Claw count | z = | 29,507,163,224,391
|
| Cross count | x = | 259,256,611,337,867,808
|
| Square count | q = | 1,868,325,650
|
| 4-Tour count | T4 = | 27,135,497,318
|
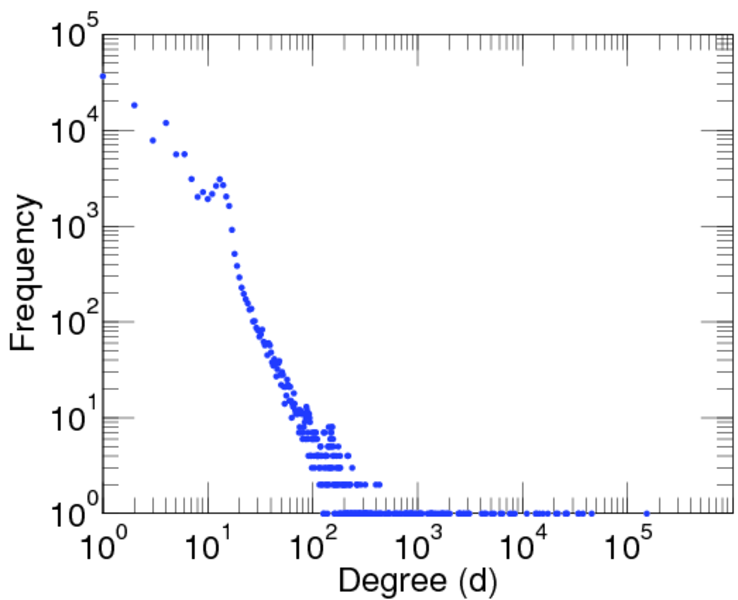
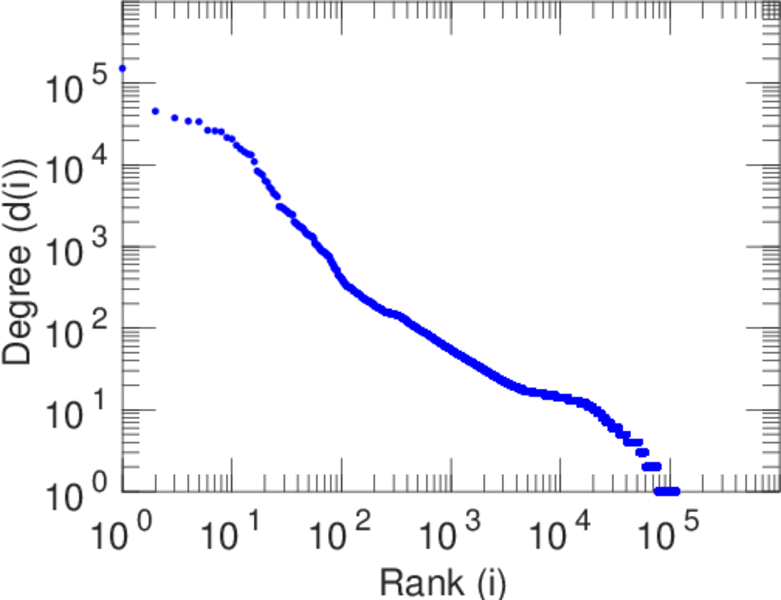
| Maximum degree | dmax = | 151,953
|
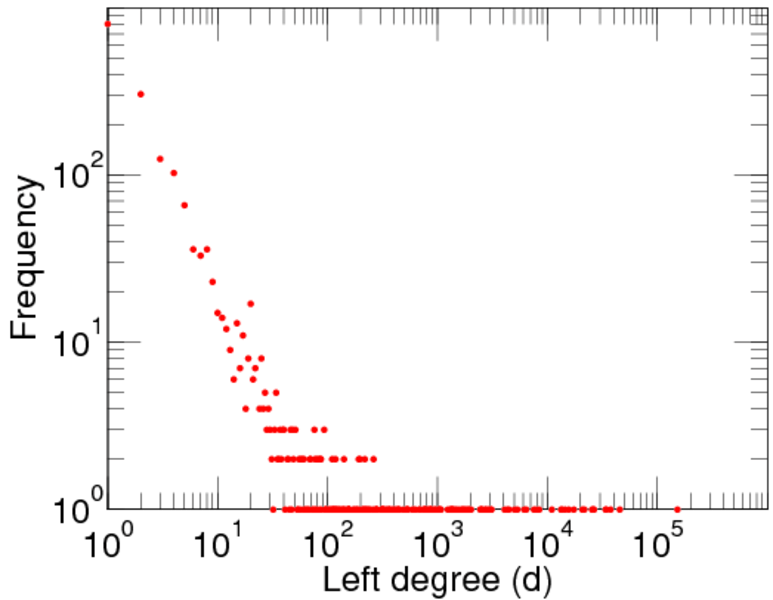
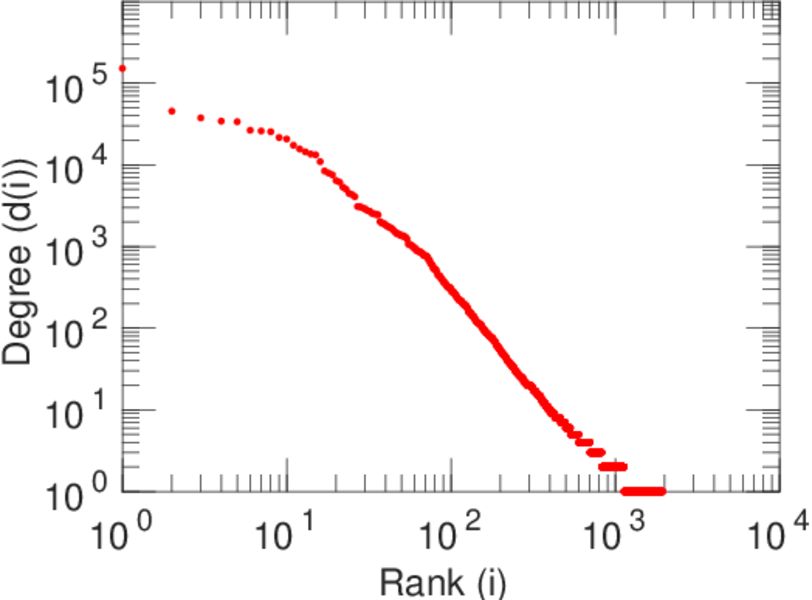
| Maximum left degree | d1max = | 151,953
|
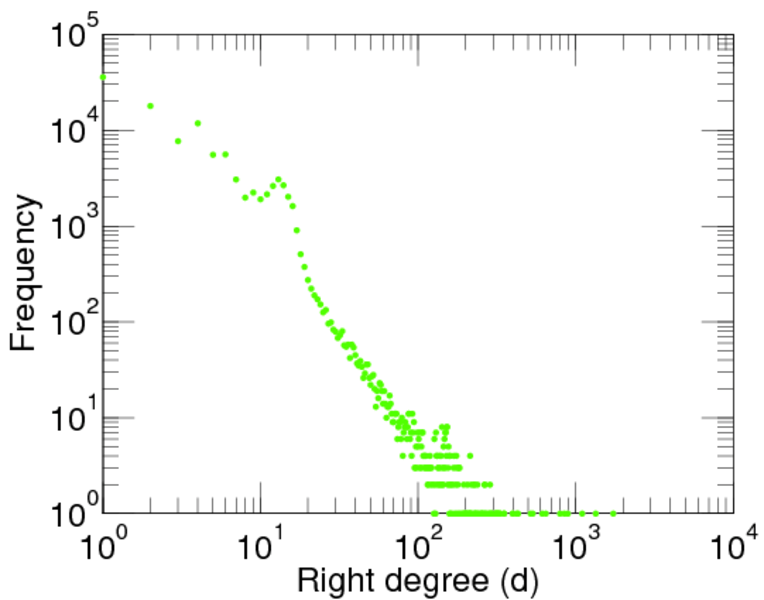
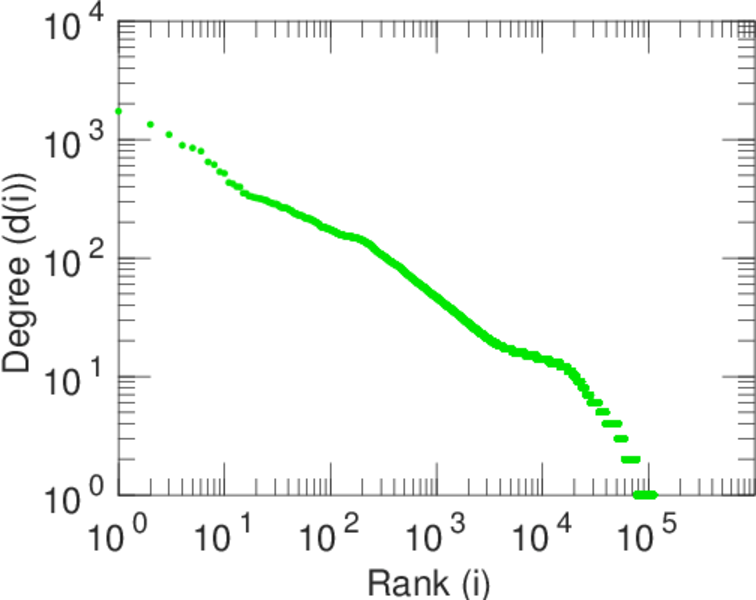
| Maximum right degree | d2max = | 1,732
|
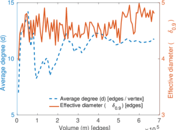
| Average degree | d = | 11.720 8
|
| Average left degree | d1 = | 348.224
|
| Average right degree | d2 = | 5.960 71
|
| Fill | p = | 0.001 515 44
|
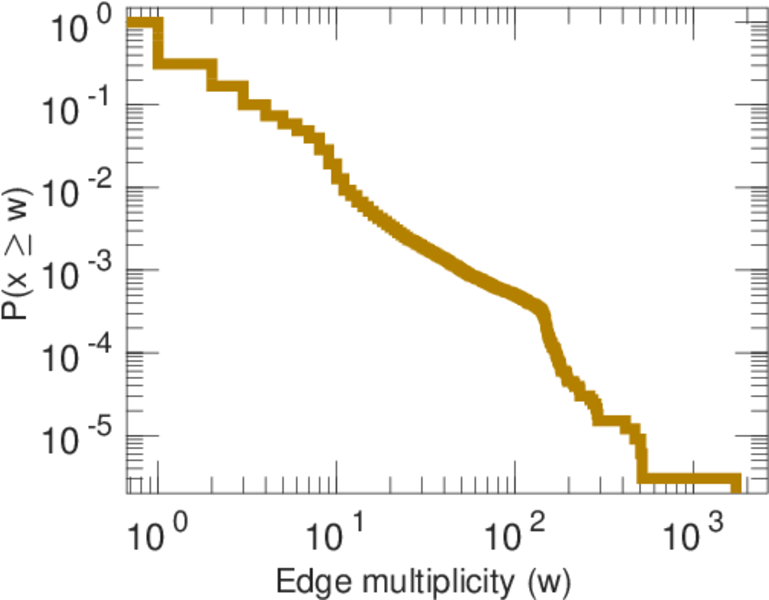
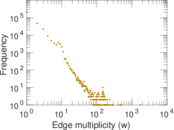
| Average edge multiplicity | m̃ = | 2.033 77
|
| Size of LCC | N = | 114,158
|
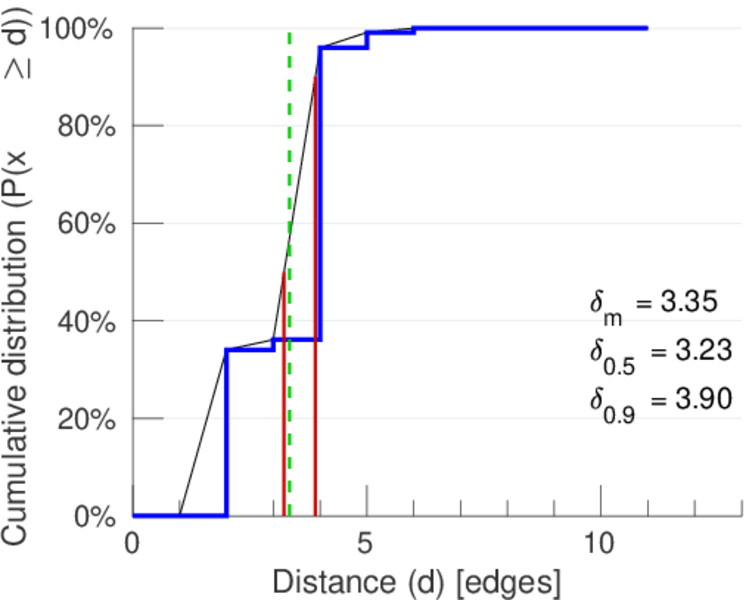
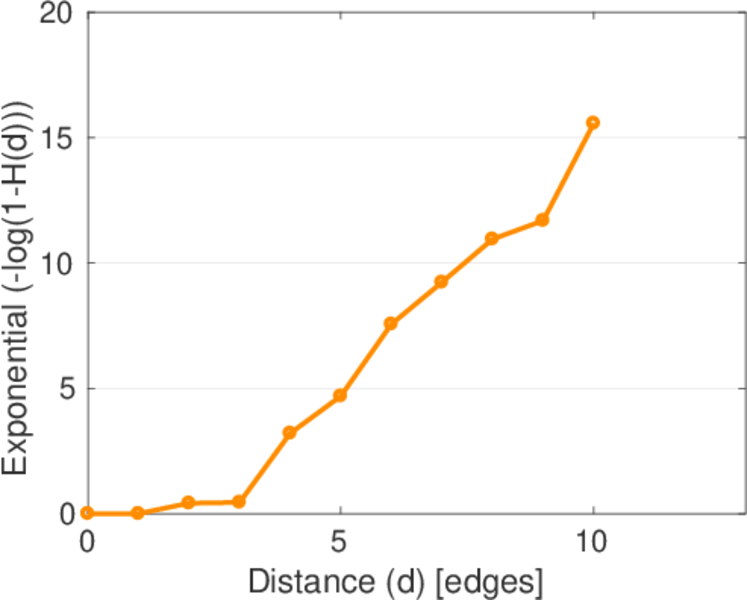
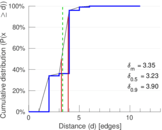
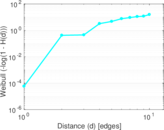
| Diameter | δ = | 14
|
| 50-Percentile effective diameter | δ0.5 = | 3.232 23
|
| 90-Percentile effective diameter | δ0.9 = | 3.900 74
|
| Median distance | δM = | 4
|
| Mean distance | δm = | 3.348 87
|
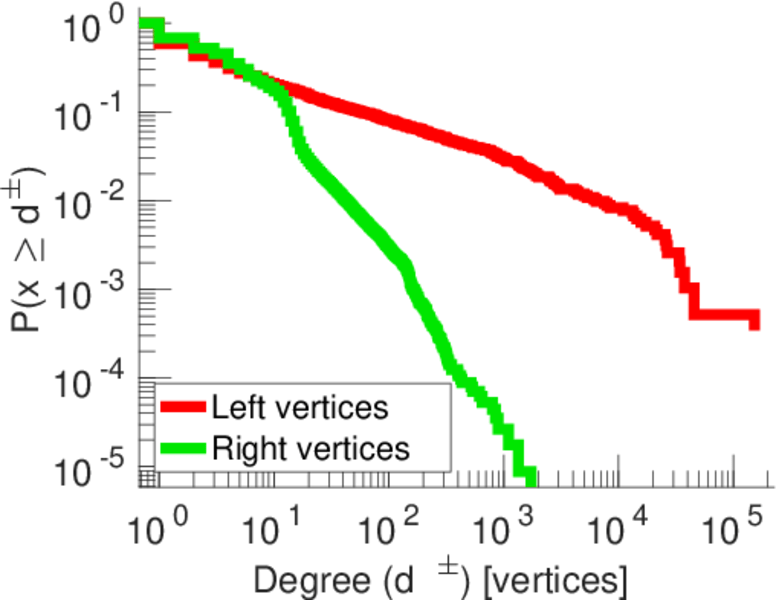
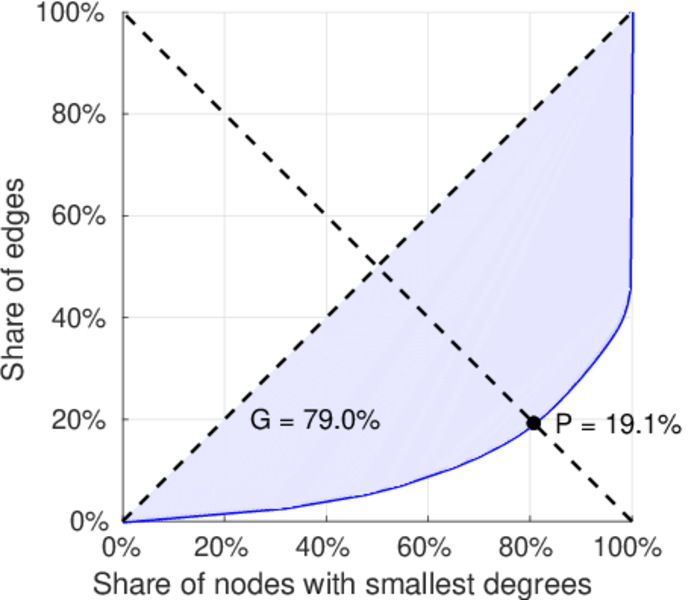
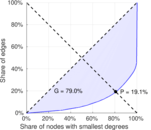
| Gini coefficient | G = | 0.790 735
|
| Balanced inequality ratio | P = | 0.191 030
|
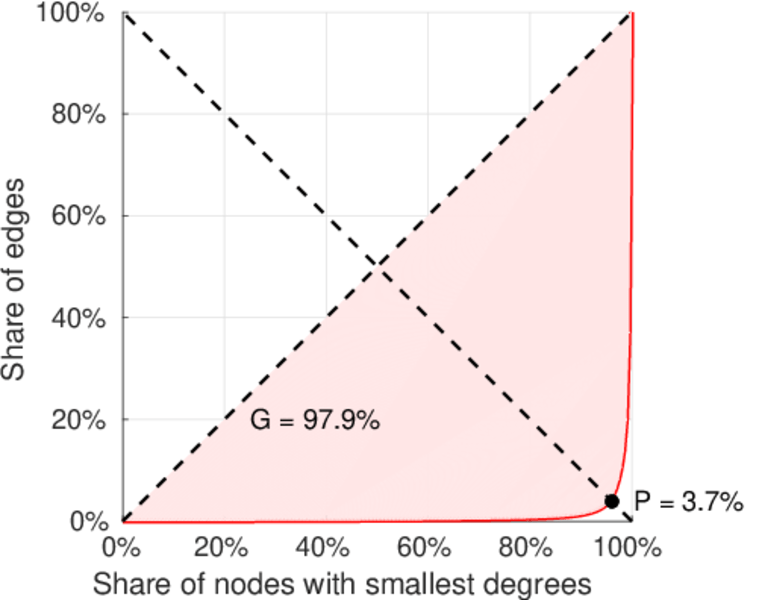
| Left balanced inequality ratio | P1 = | 0.037 321 9
|
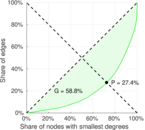
| Right balanced inequality ratio | P2 = | 0.274 241
|
| Relative edge distribution entropy | Her = | 0.696 783
|
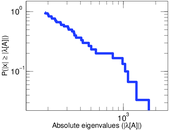
| Tail power law exponent | γt = | 2.371 00
|
| Degree assortativity | ρ = | −0.286 432
|
| Degree assortativity p-value | pρ = | 0.000 00
|
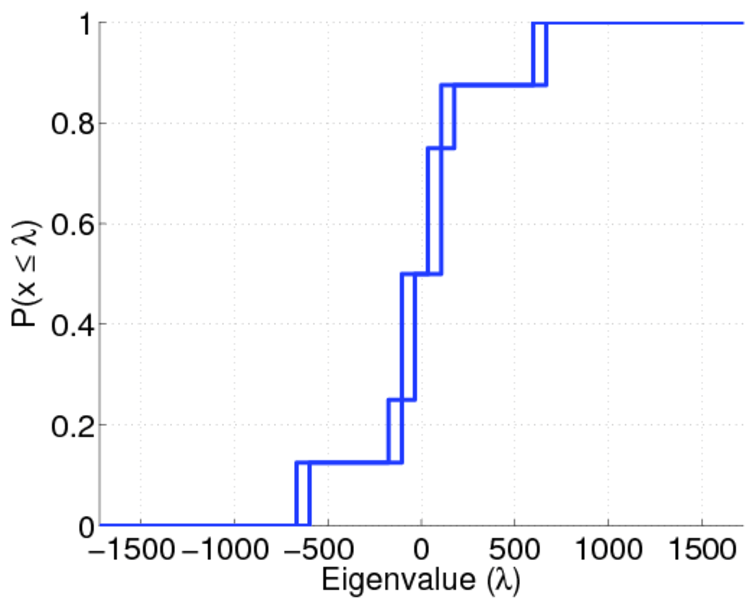
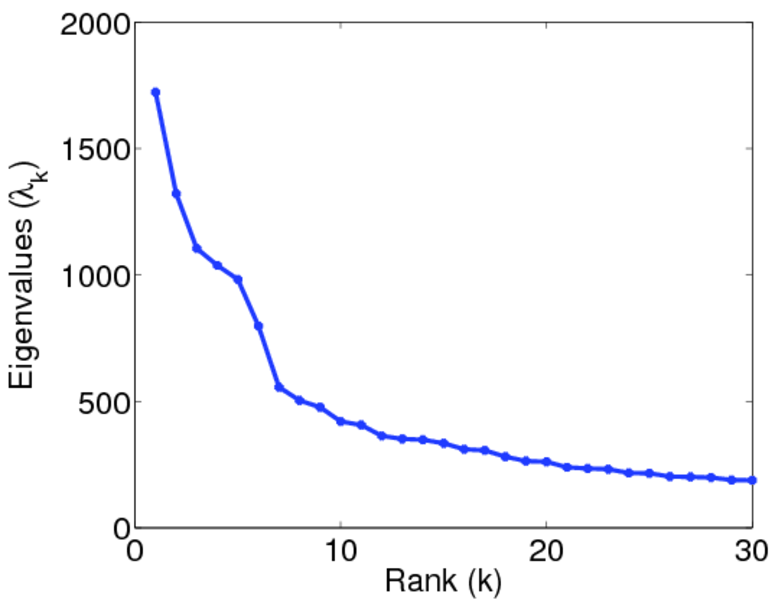
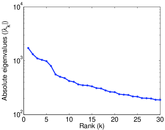
| Spectral norm | α = | 1,723.01
|
| Algebraic connectivity | a = | 0.009 139 01
|
| Spectral separation | |λ1[A] / λ2[A]| = | 1.303 32
|
| Controllability | C = | 111,164
|
| Relative controllability | Cr = | 0.968 463
|
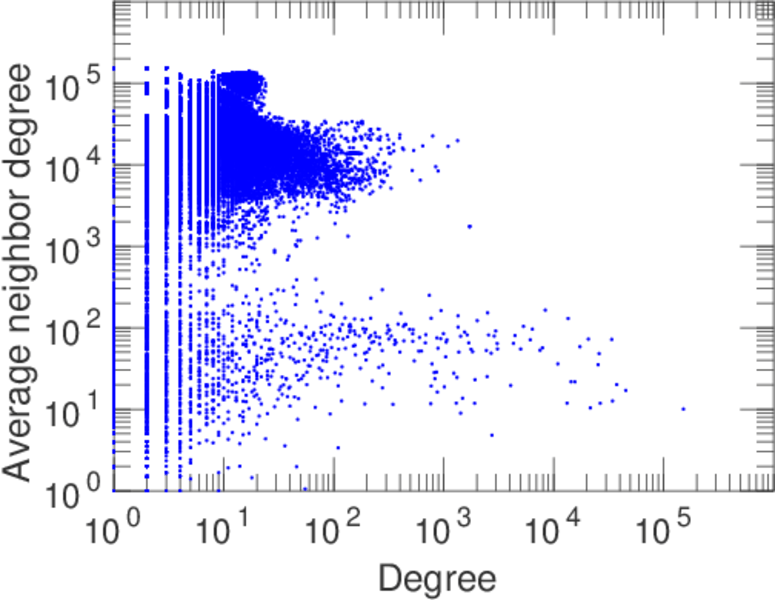
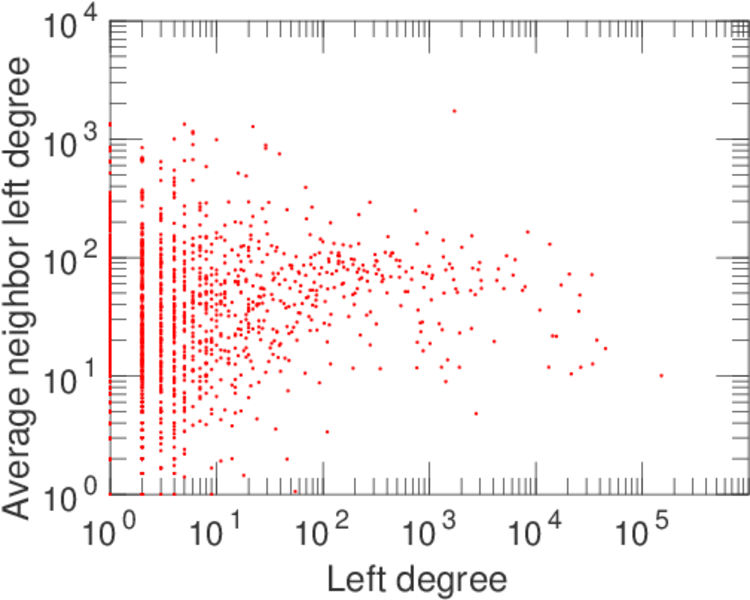
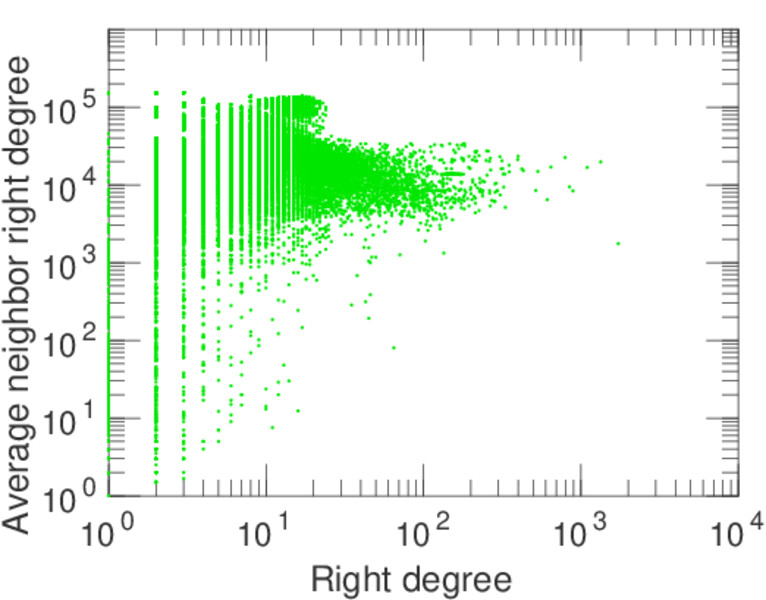
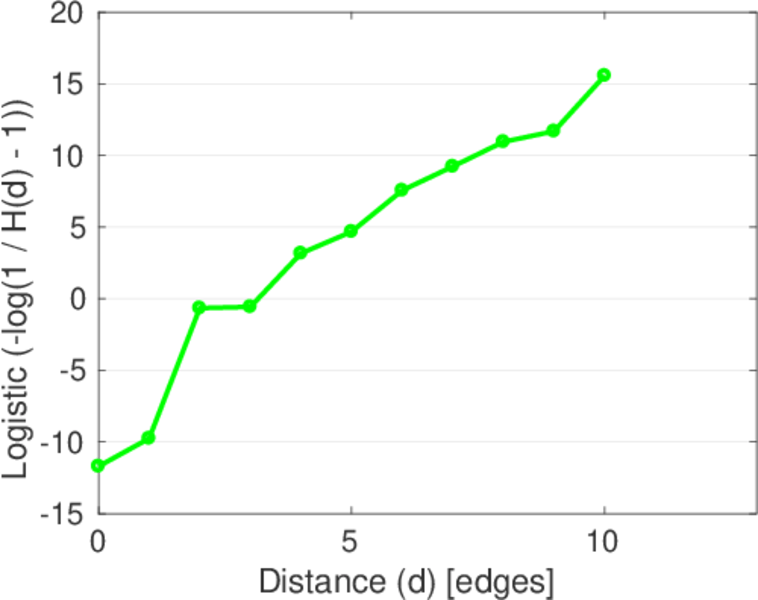
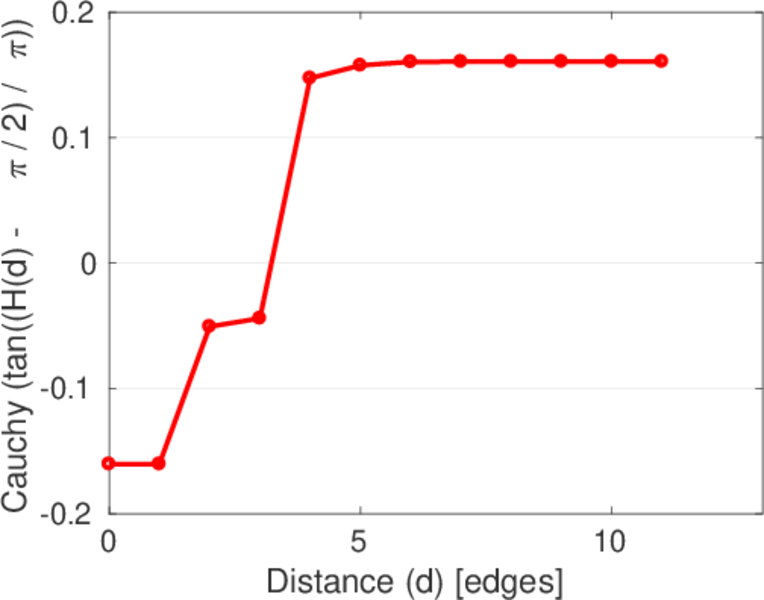
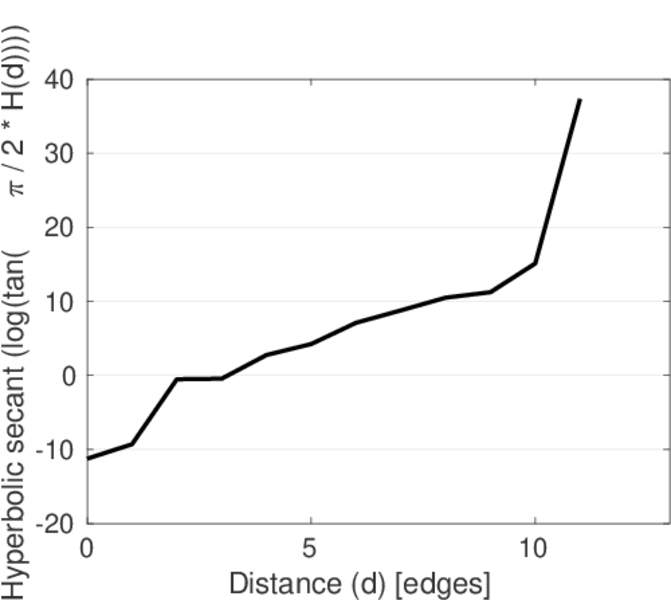
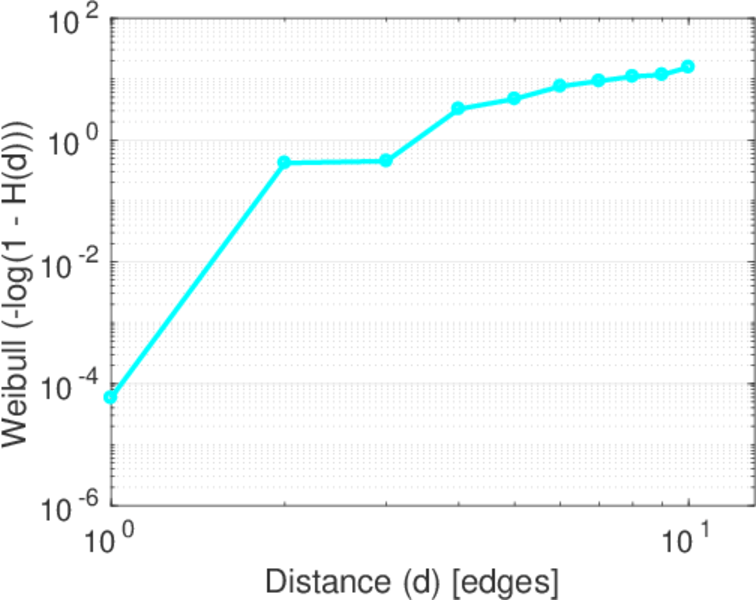
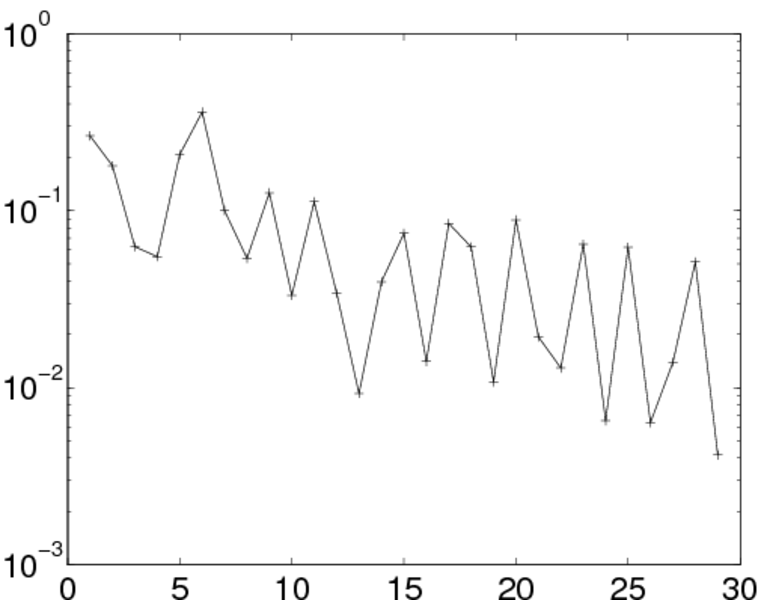
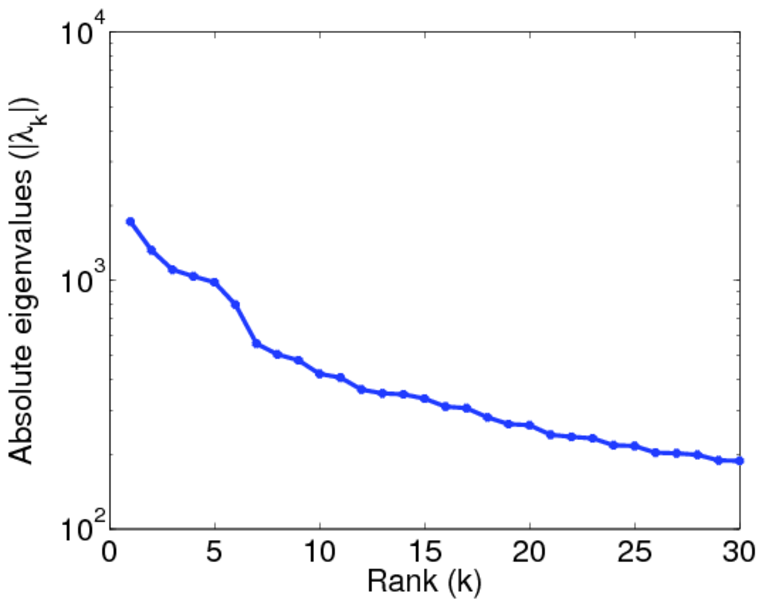
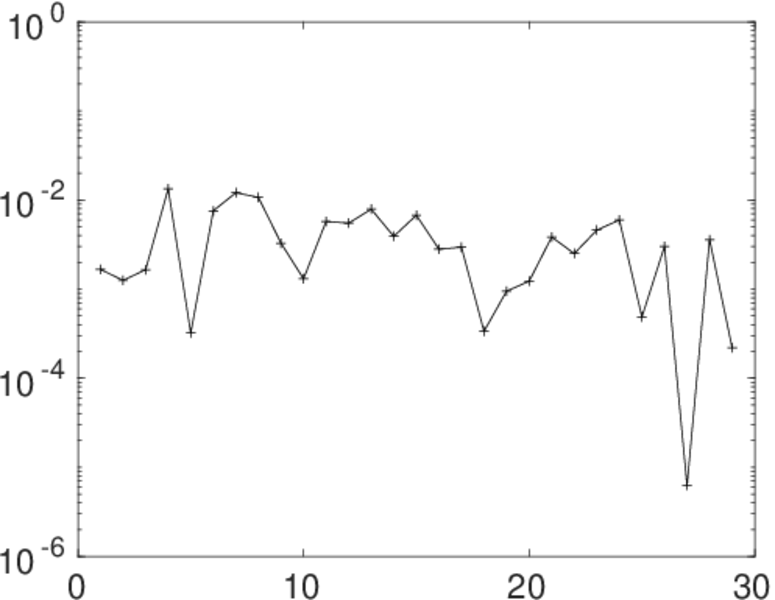
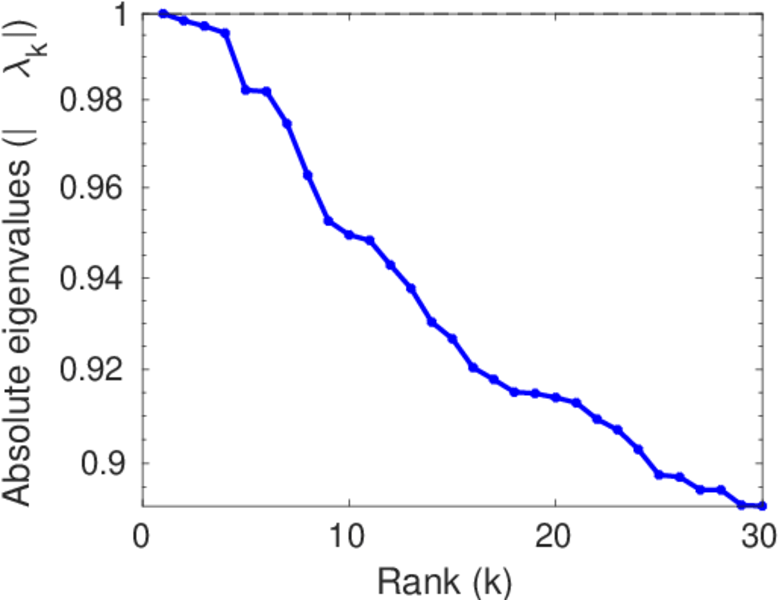
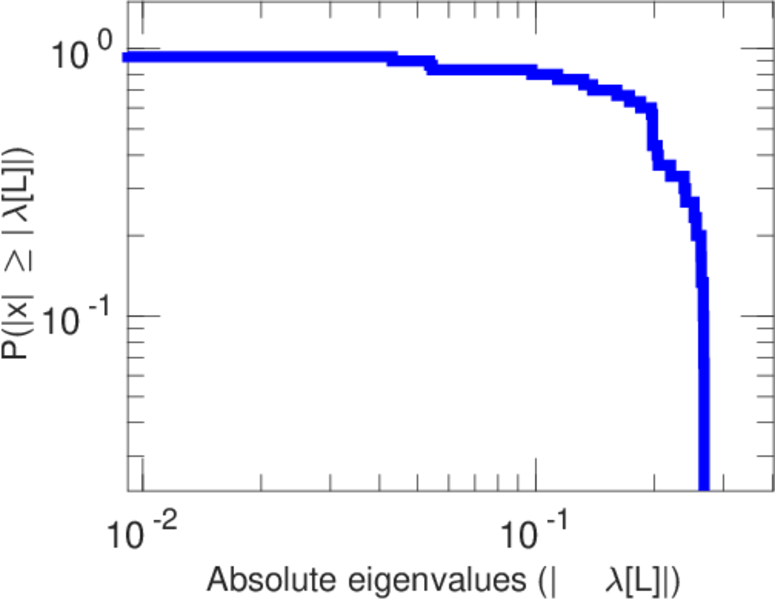
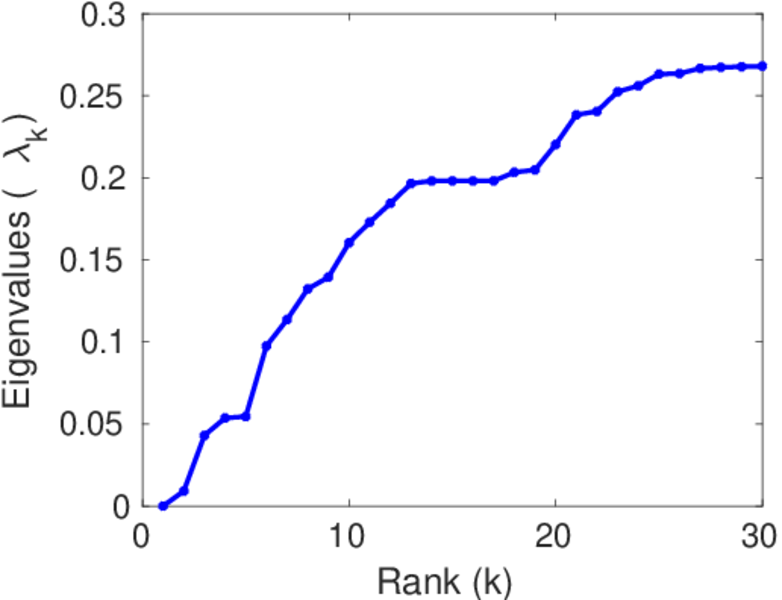
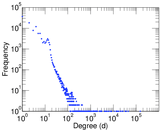
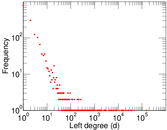
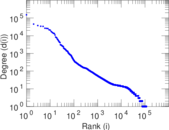
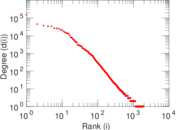
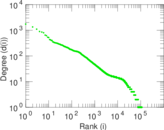
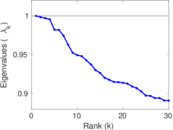
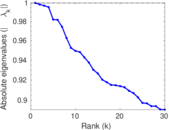
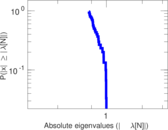
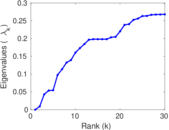
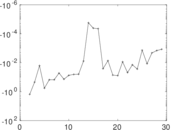
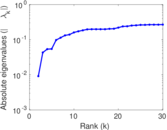
Plots


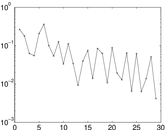
Matrix decompositions plots


Downloads
References
|
[1]
|
Jérôme Kunegis.
KONECT – The Koblenz Network Collection.
In Proc. Int. Conf. on World Wide Web Companion, pages
1343–1350, 2013.
[ http ]
|
|
[2]
|
Wikimedia Foundation.
Wikimedia downloads.
http://dumps.wikimedia.org/, January 2010.
|
 KONECT ‣ Networks ‣
Buy Me a Coffee
KONECT ‣ Networks ‣
Buy Me a Coffee