Wikipedia edits (bcl)
This is the bipartite edit network of the Bikol Central Wikipedia. It contains
users and pages from the Bikol Central Wikipedia, connected by edit events.
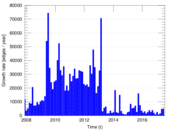
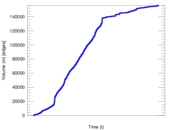
Each edge represents an edit. The dataset includes the timestamp of each edit.
Metadata
Statistics
| Size | n = | 13,304
|
| Left size | n1 = | 1,230
|
| Right size | n2 = | 12,074
|
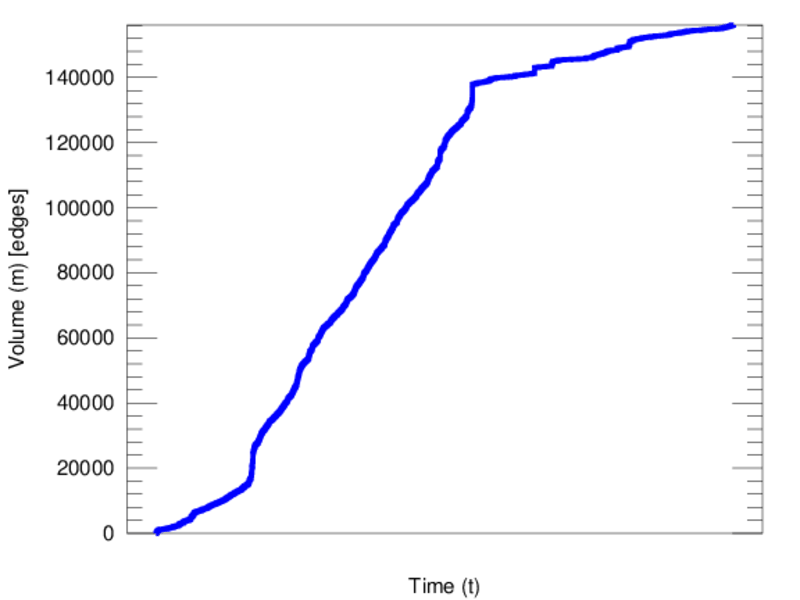
| Volume | m = | 156,093
|
| Unique edge count | m̿ = | 79,756
|
| Wedge count | s = | 100,391,232
|
| Claw count | z = | 138,325,988,347
|
| Cross count | x = | 182,127,254,314,338
|
| Square count | q = | 237,408,609
|
| 4-Tour count | T4 = | 2,301,106,088
|
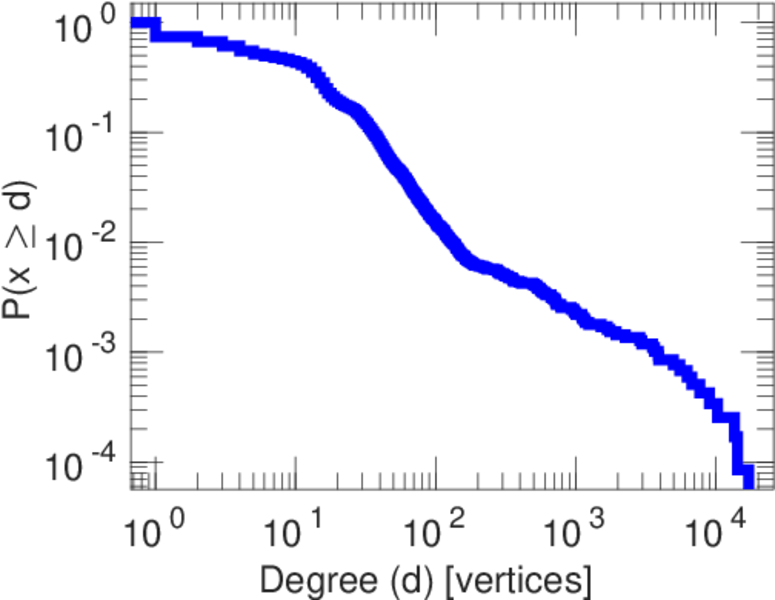
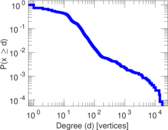
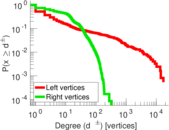
| Maximum degree | dmax = | 17,131
|
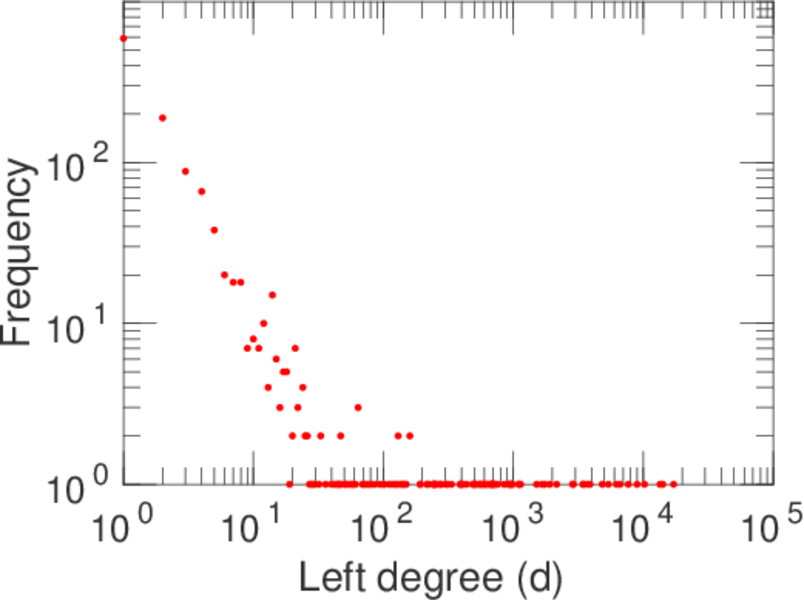
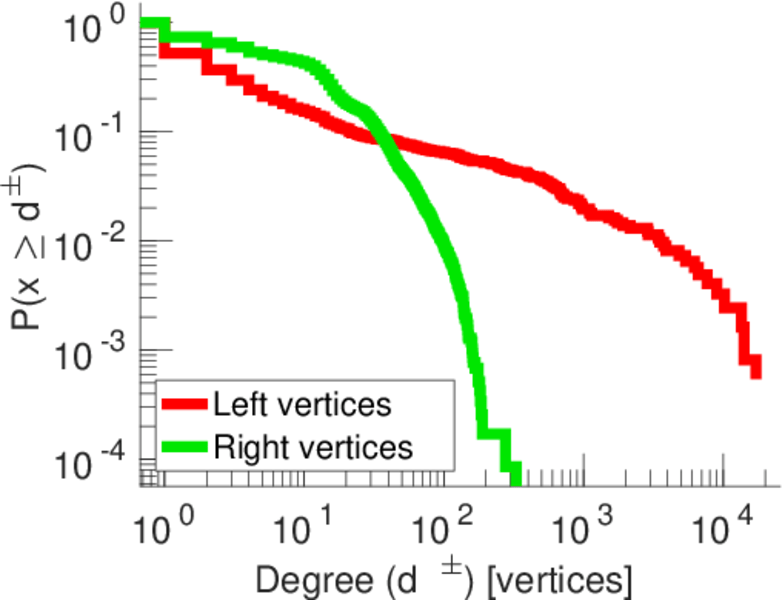
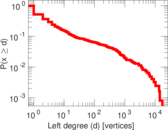
| Maximum left degree | d1max = | 17,131
|
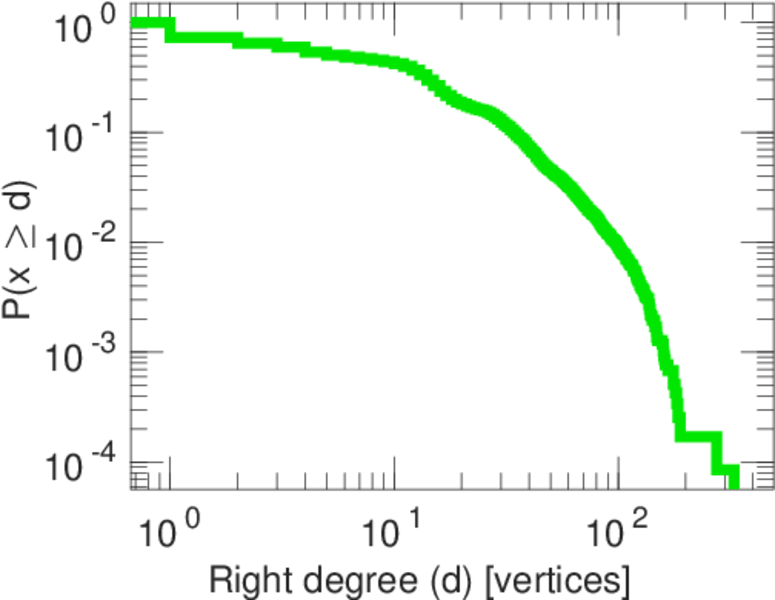
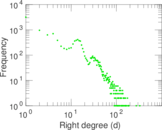
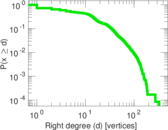
| Maximum right degree | d2max = | 329
|
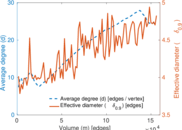
| Average degree | d = | 23.465 6
|
| Average left degree | d1 = | 126.905
|
| Average right degree | d2 = | 12.928 0
|
| Fill | p = | 0.005 370 41
|
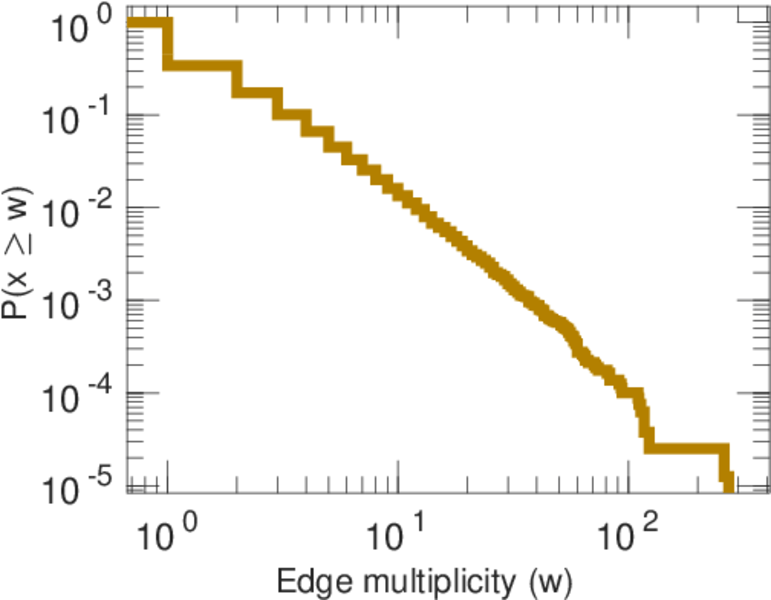
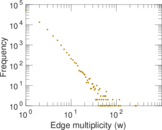
| Average edge multiplicity | m̃ = | 1.957 13
|
| Size of LCC | N = | 12,374
|
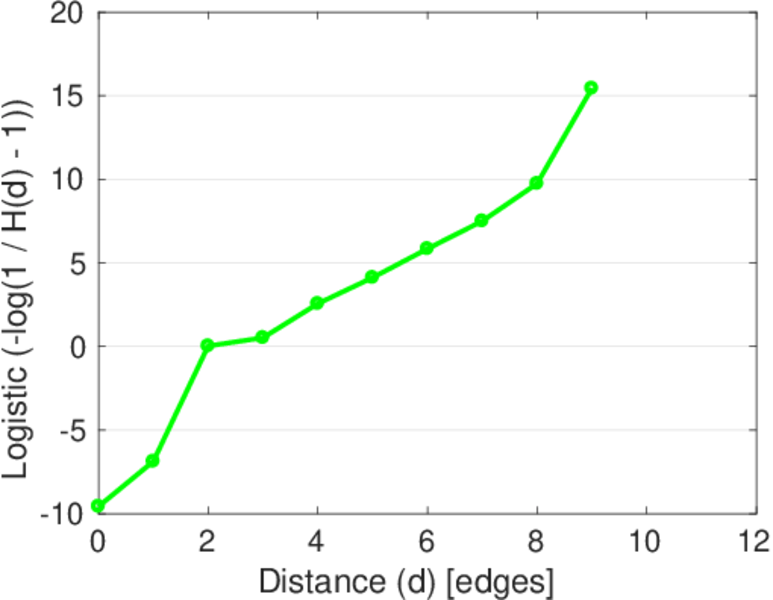
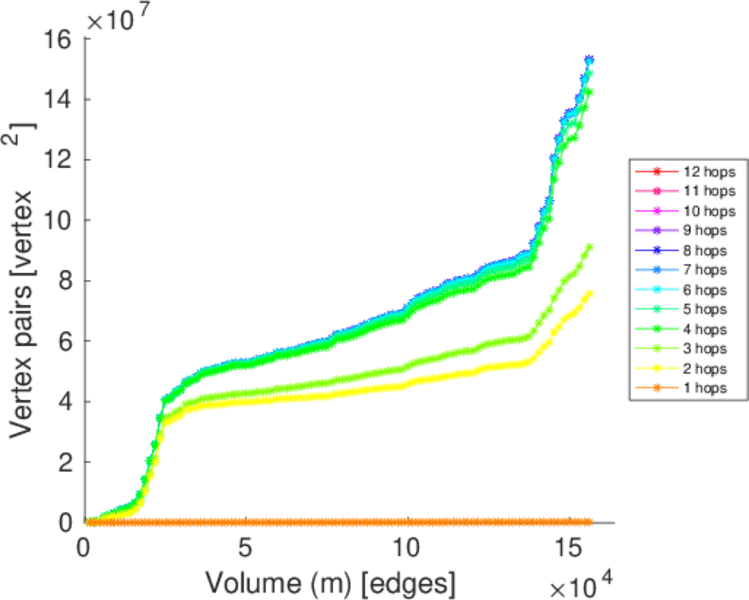
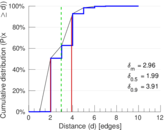
| Diameter | δ = | 12
|
| 50-Percentile effective diameter | δ0.5 = | 1.987 05
|
| 90-Percentile effective diameter | δ0.9 = | 3.906 54
|
| Median distance | δM = | 2
|
| Mean distance | δm = | 2.956 56
|
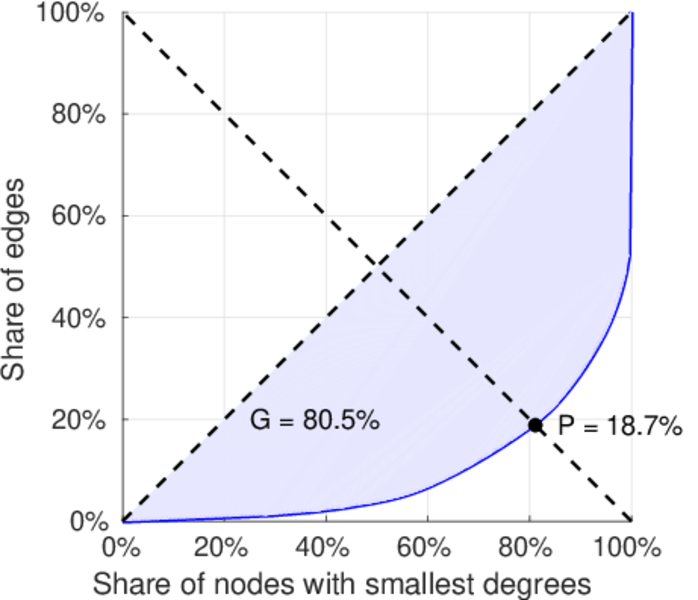
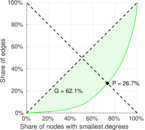
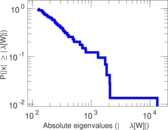
| Gini coefficient | G = | 0.798 758
|
| Balanced inequality ratio | P = | 0.193 603
|
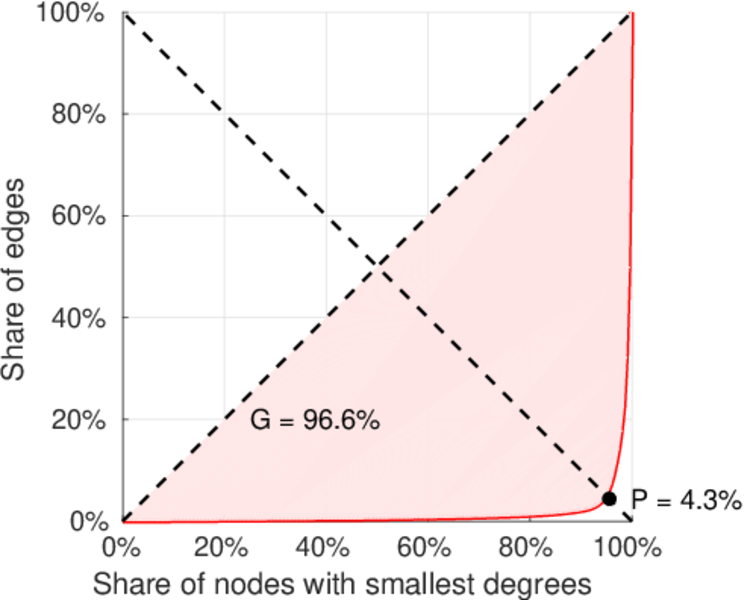
| Left balanced inequality ratio | P1 = | 0.042 634 8
|
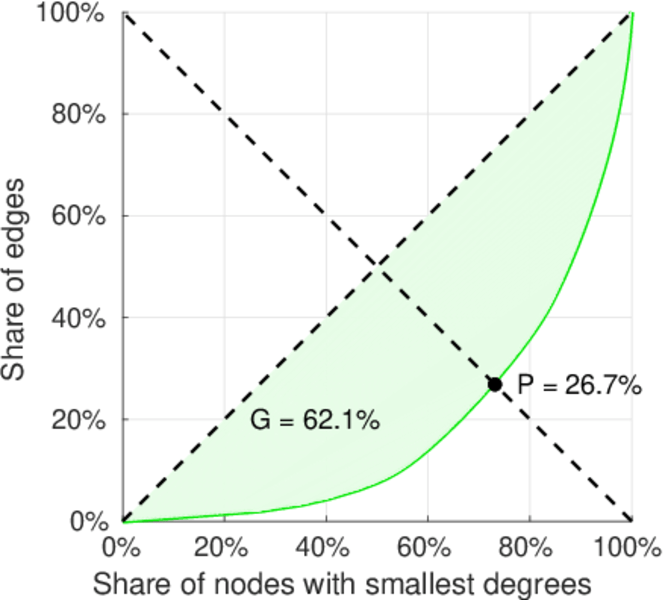
| Right balanced inequality ratio | P2 = | 0.267 072
|
| Relative edge distribution entropy | Her = | 0.753 009
|
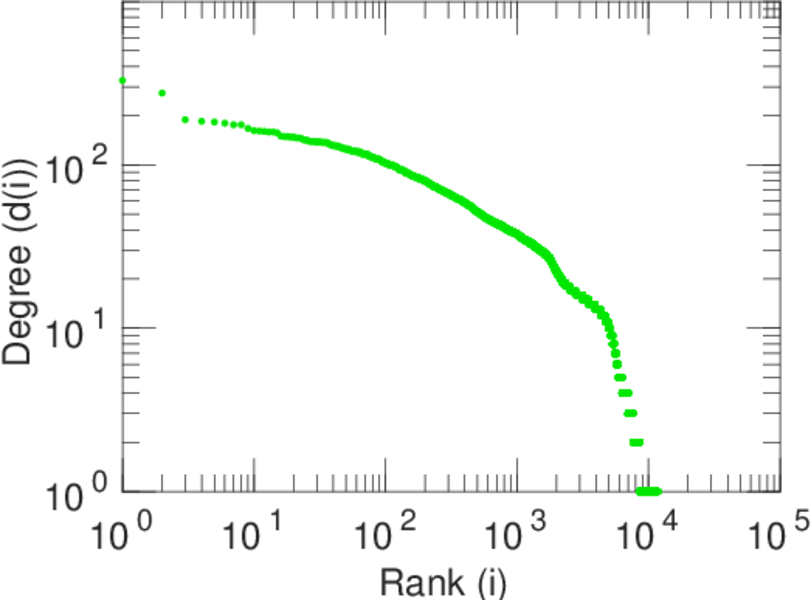
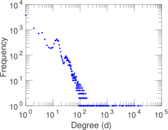
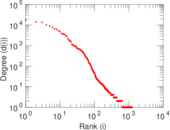
| Power law exponent | γ = | 1.822 58
|
| Tail power law exponent | γt = | 2.911 00
|
| Tail power law exponent with p | γ3 = | 2.911 00
|
| p-value | p = | 0.000 00
|
| Left tail power law exponent with p | γ3,1 = | 1.731 00
|
| Left p-value | p1 = | 0.000 00
|
| Right tail power law exponent with p | γ3,2 = | 5.231 00
|
| Right p-value | p2 = | 0.000 00
|
| Degree assortativity | ρ = | −0.294 982
|
| Degree assortativity p-value | pρ = | 0.000 00
|
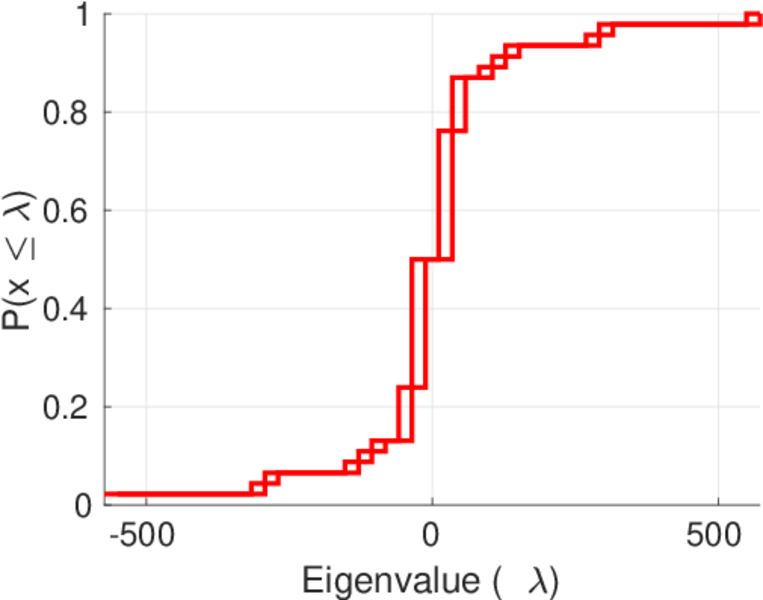
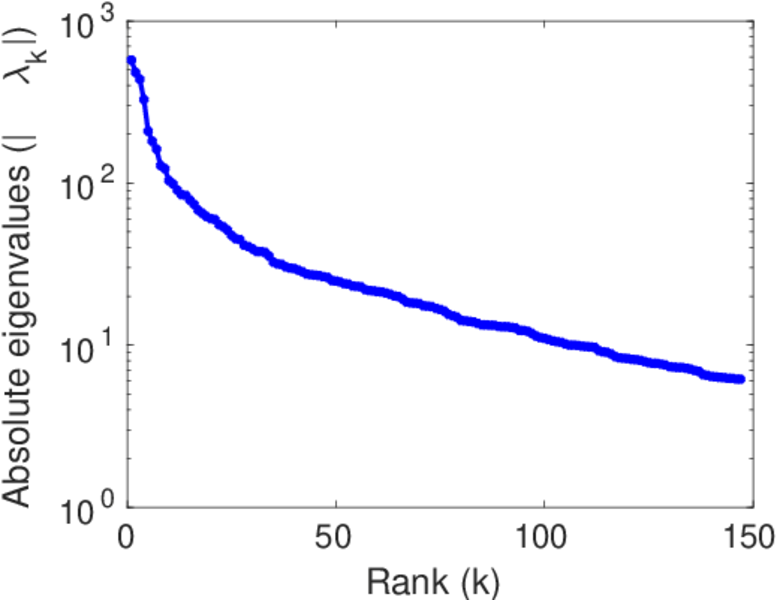
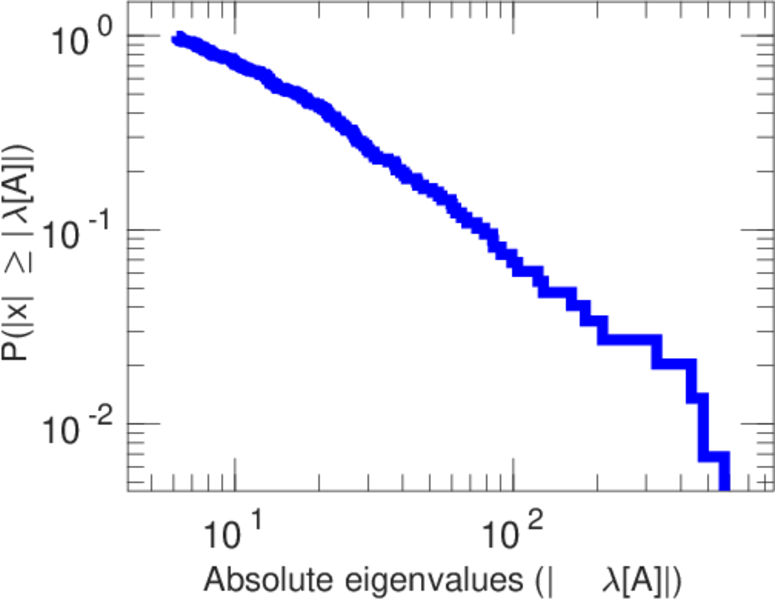
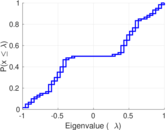
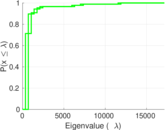
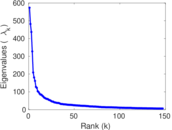
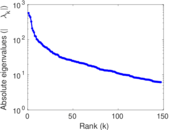
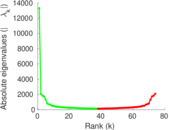
| Spectral norm | α = | 573.319
|
| Algebraic connectivity | a = | 0.024 720 4
|
| Spectral separation | |λ1[A] / λ2[A]| = | 1.190 52
|
| Controllability | C = | 10,758
|
| Relative controllability | Cr = | 0.828 558
|
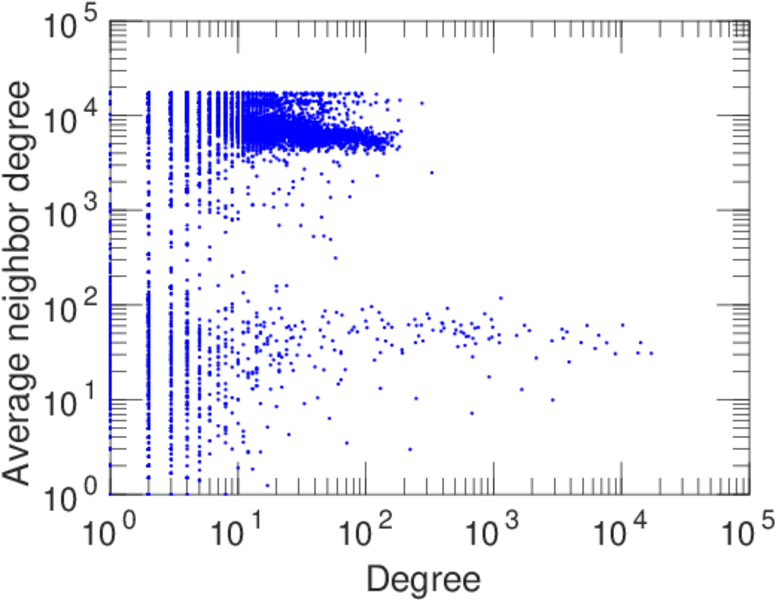
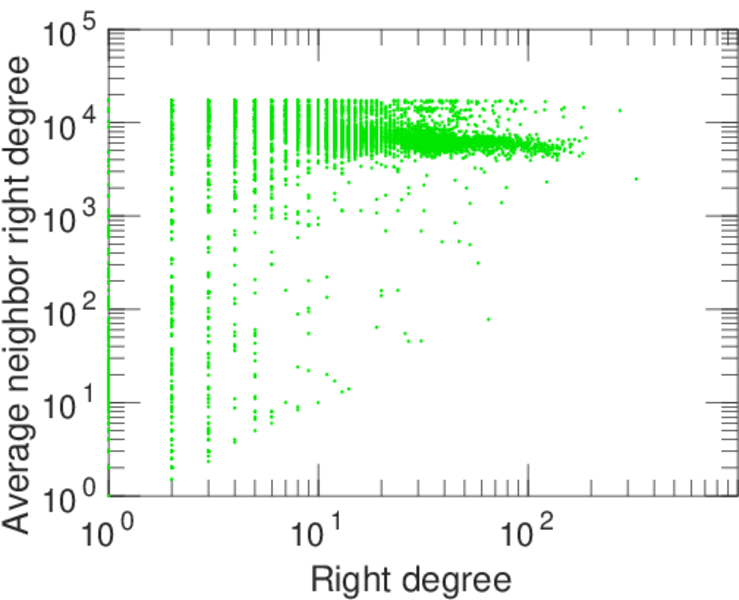
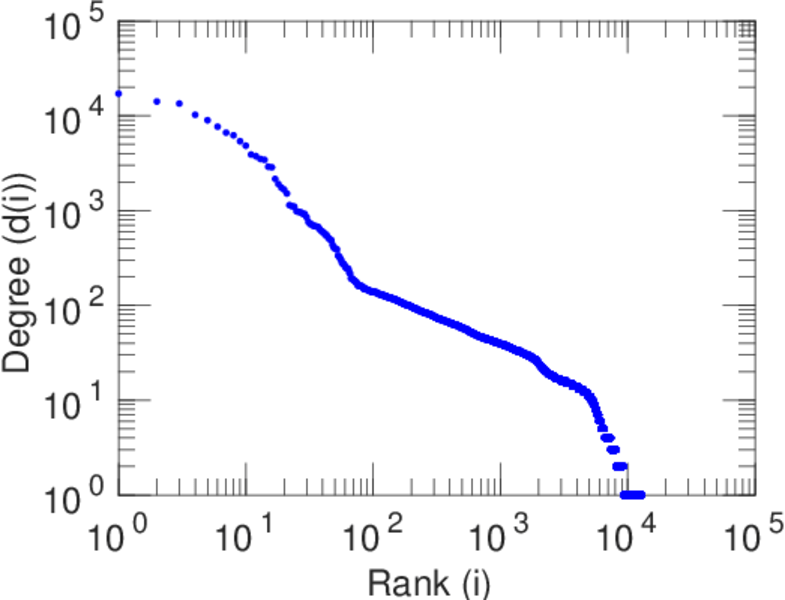
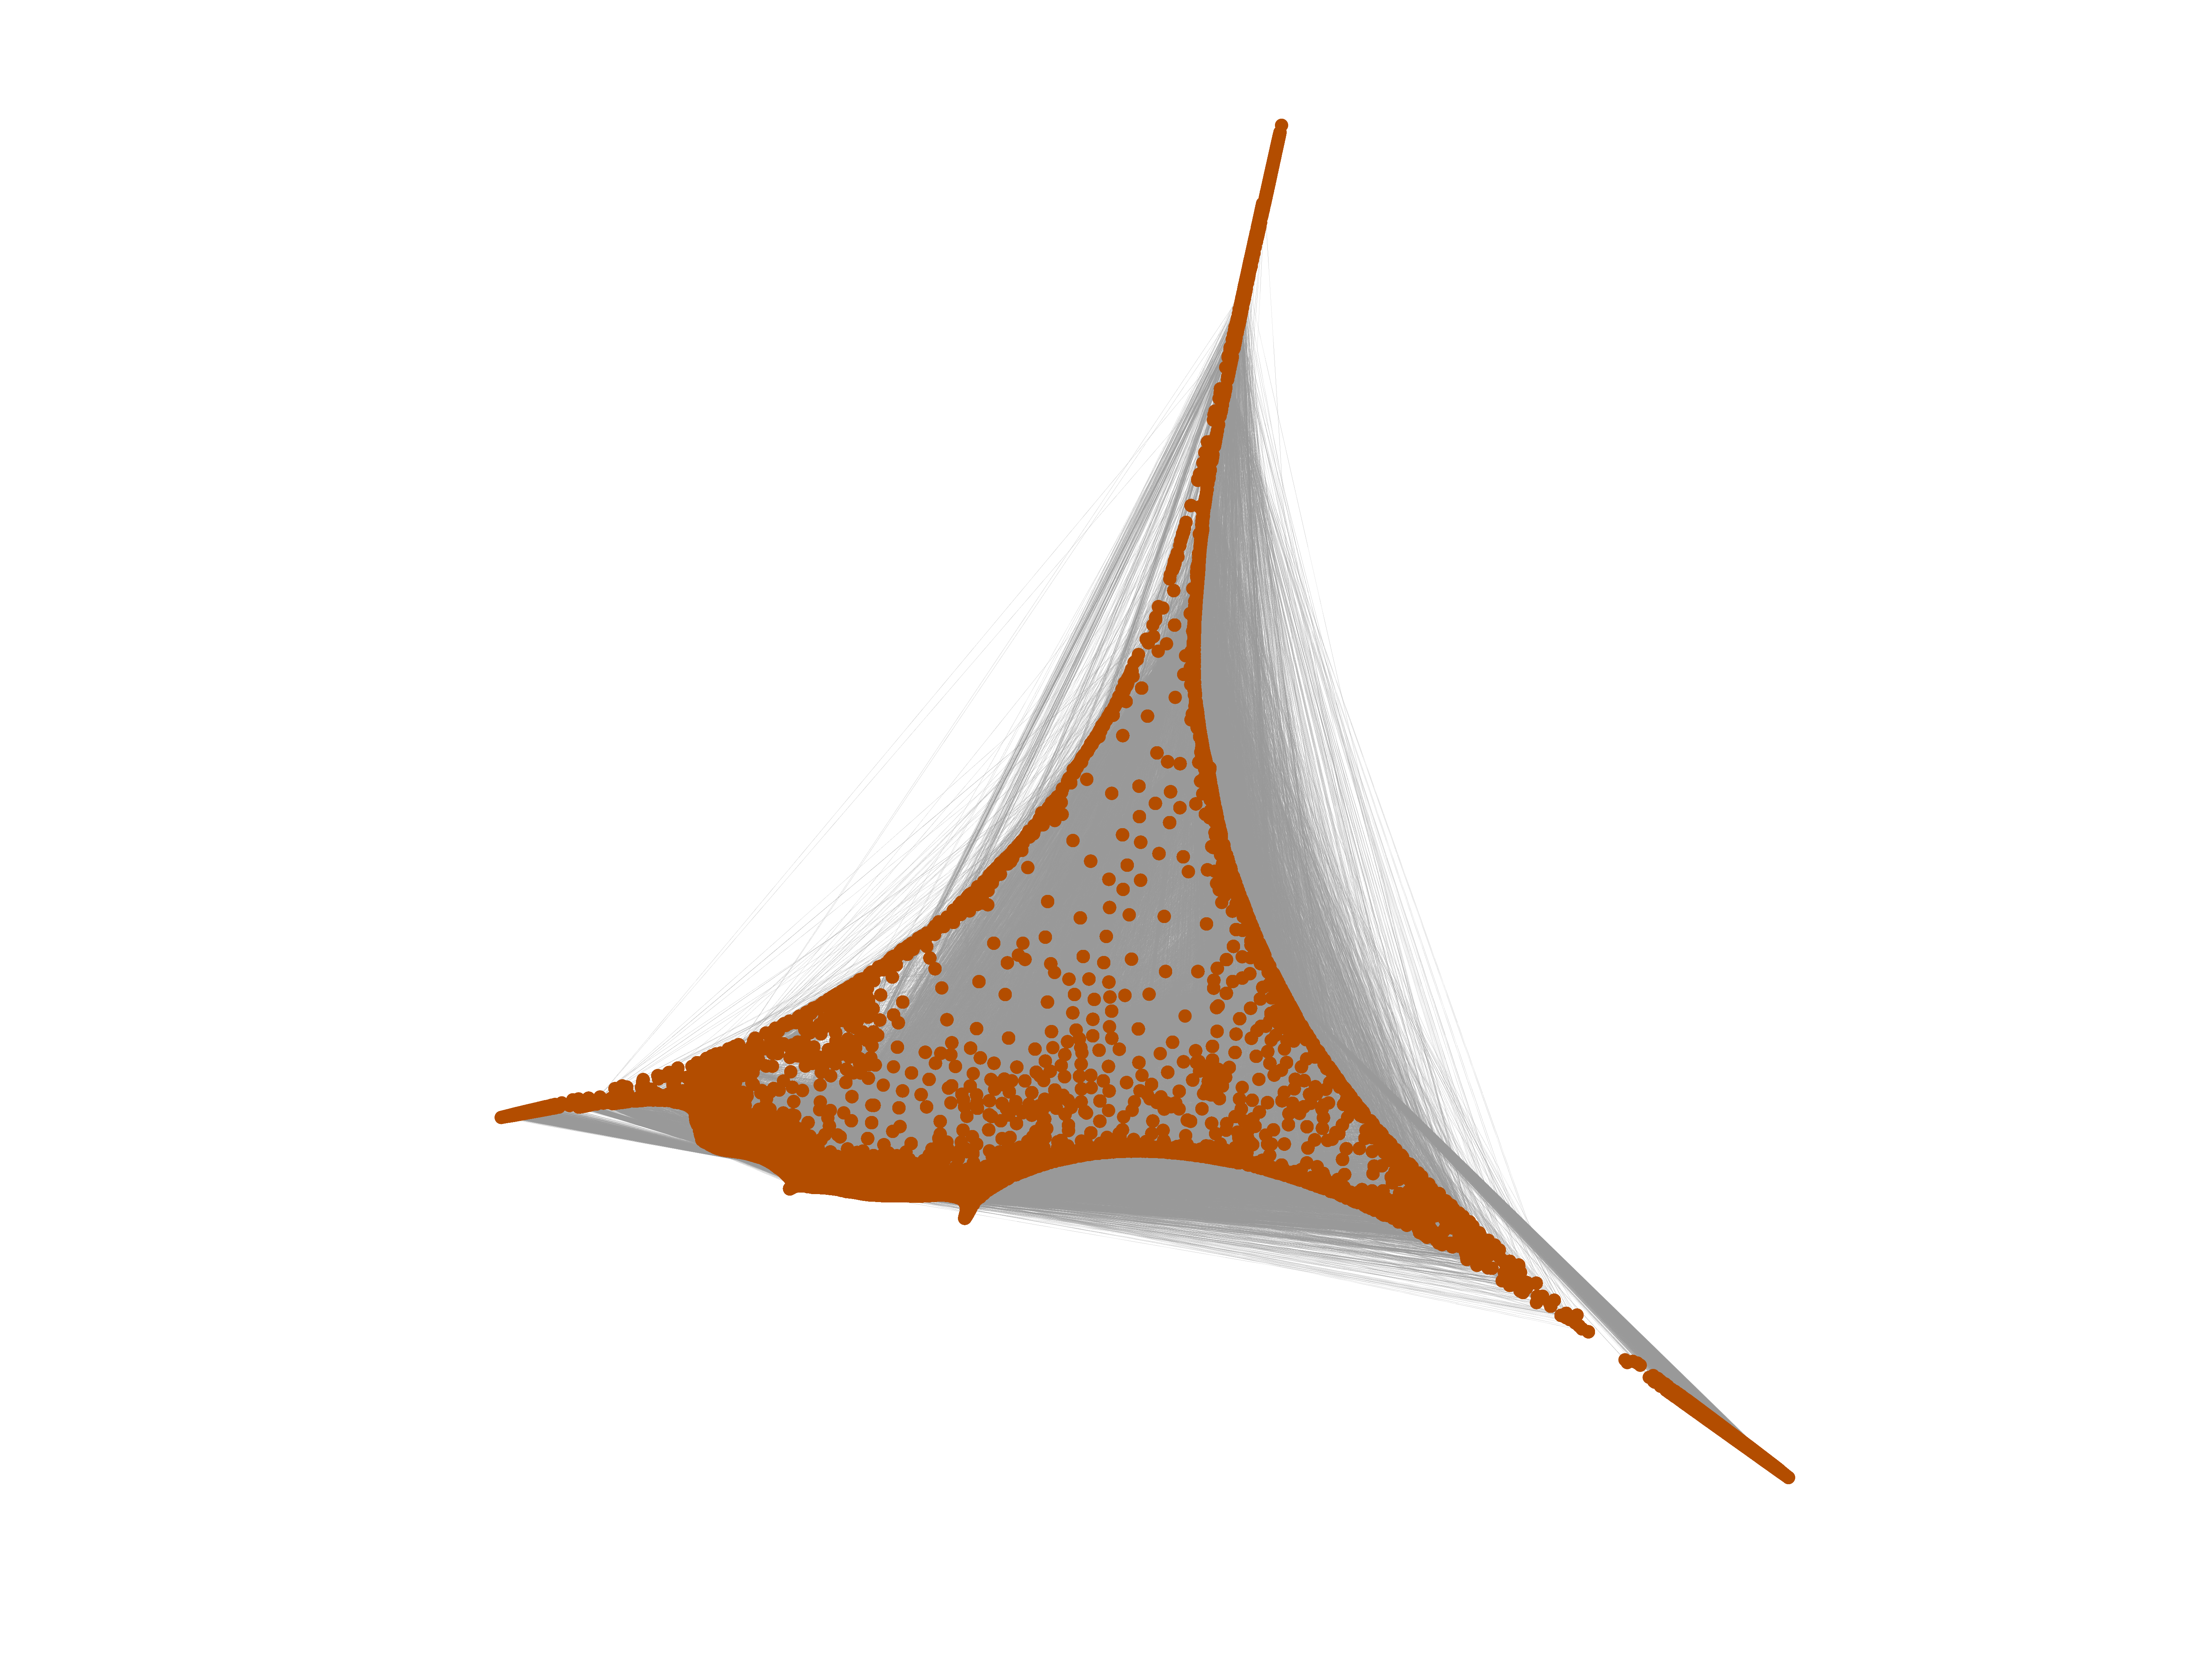
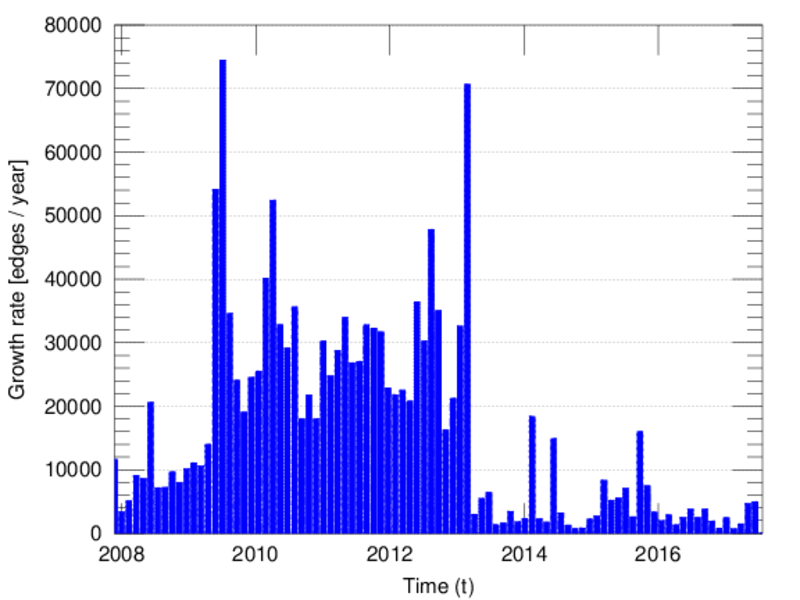
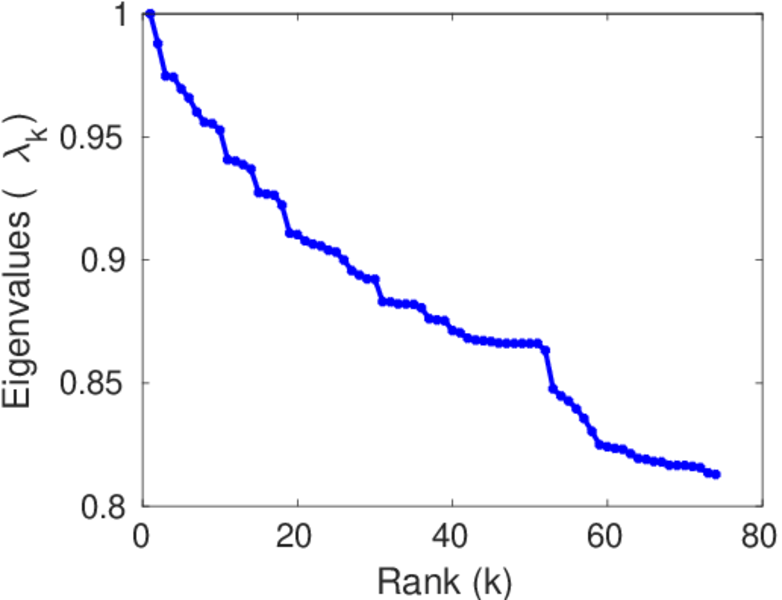
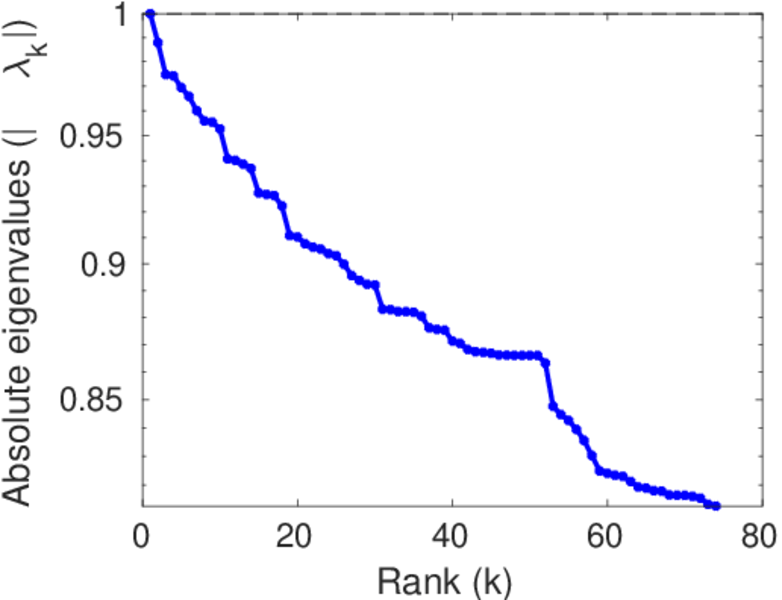
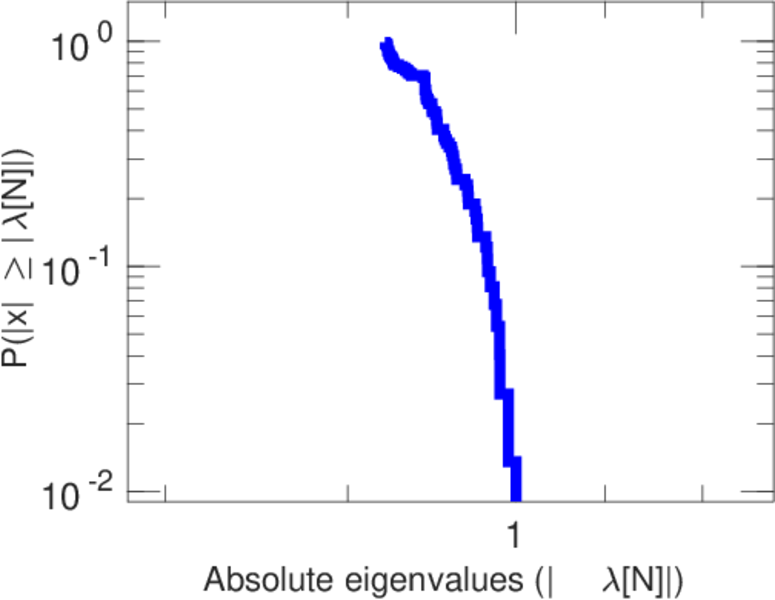
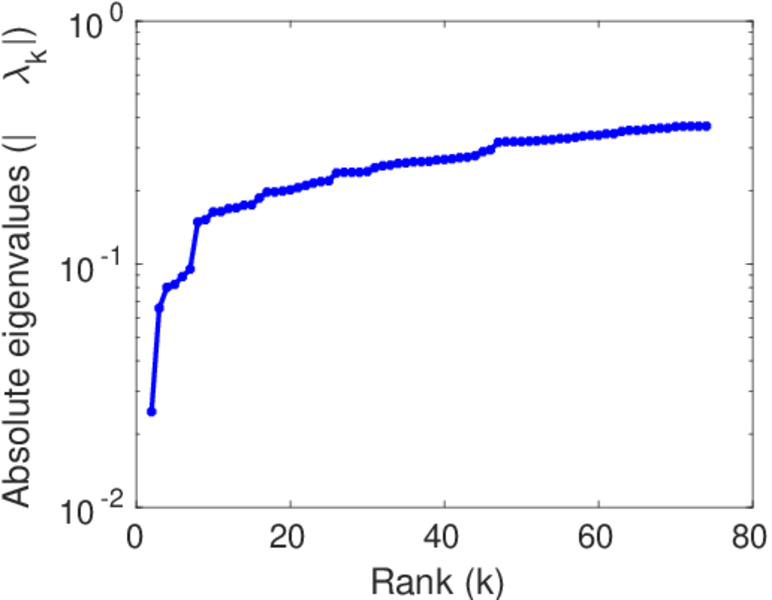
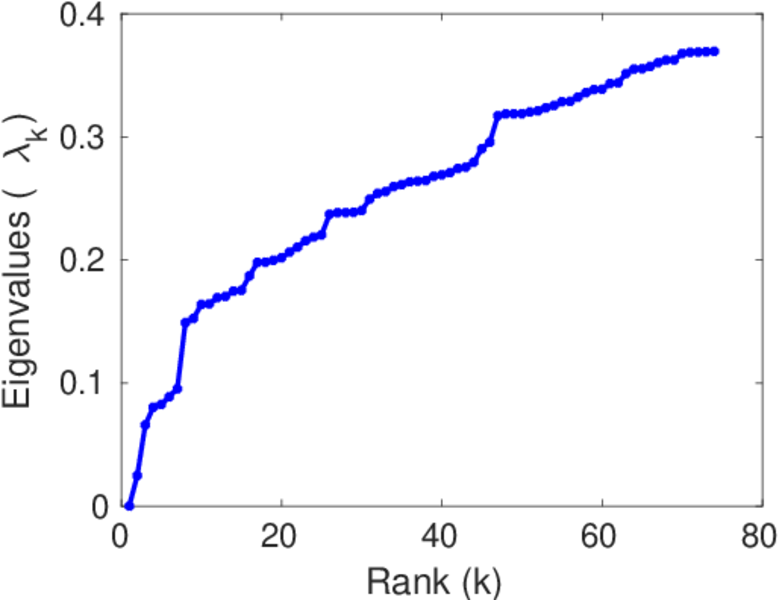
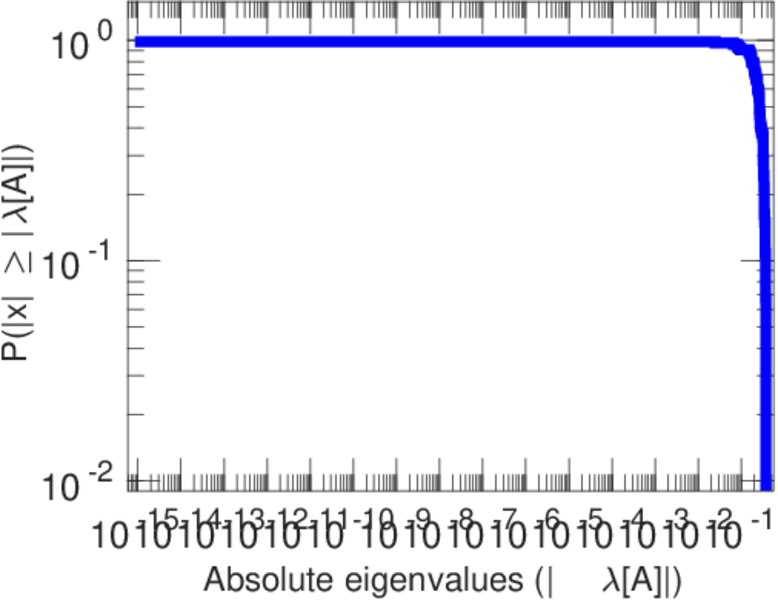
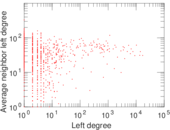
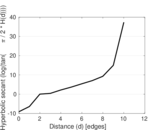
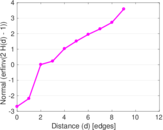
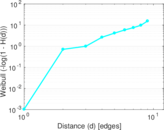
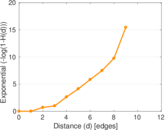
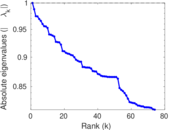
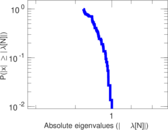
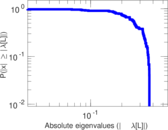
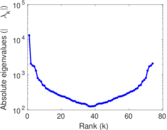
Plots


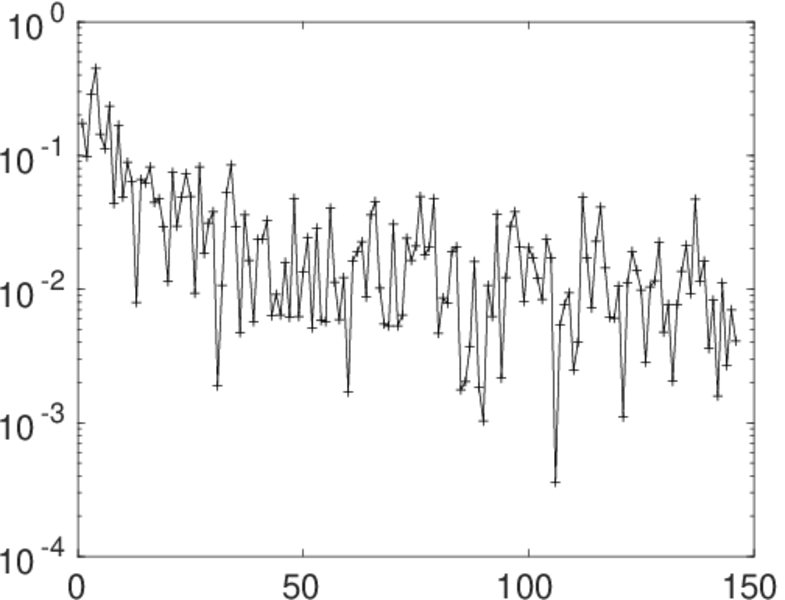
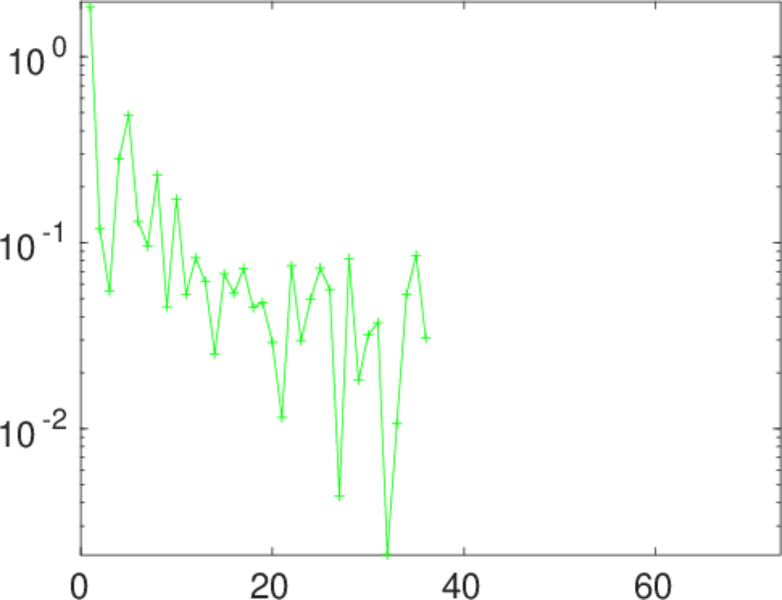
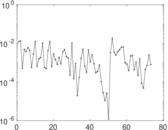
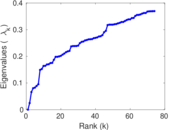
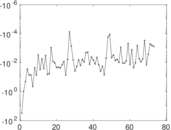
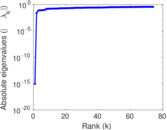
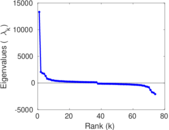
Matrix decompositions plots


Downloads
References
|
[1]
|
Jérôme Kunegis.
KONECT – The Koblenz Network Collection.
In Proc. Int. Conf. on World Wide Web Companion, pages
1343–1350, 2013.
[ http ]
|
|
[2]
|
Wikimedia Foundation.
Wikimedia downloads.
http://dumps.wikimedia.org/, January 2010.
|
 KONECT ‣ Networks ‣
Buy Me a Coffee
KONECT ‣ Networks ‣
Buy Me a Coffee