Wikipedia edits (be)
This is the bipartite edit network of the Belarusian Wikipedia. It contains
users and pages from the Belarusian Wikipedia, connected by edit events. Each
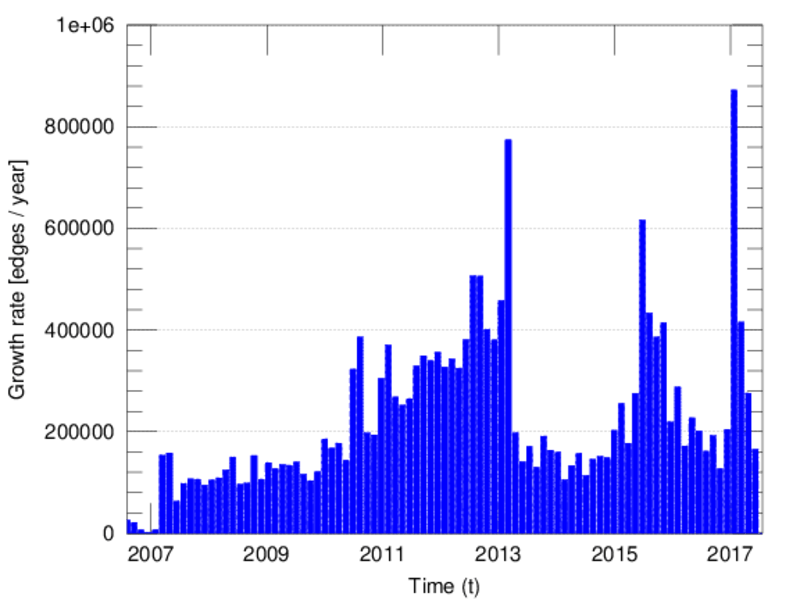
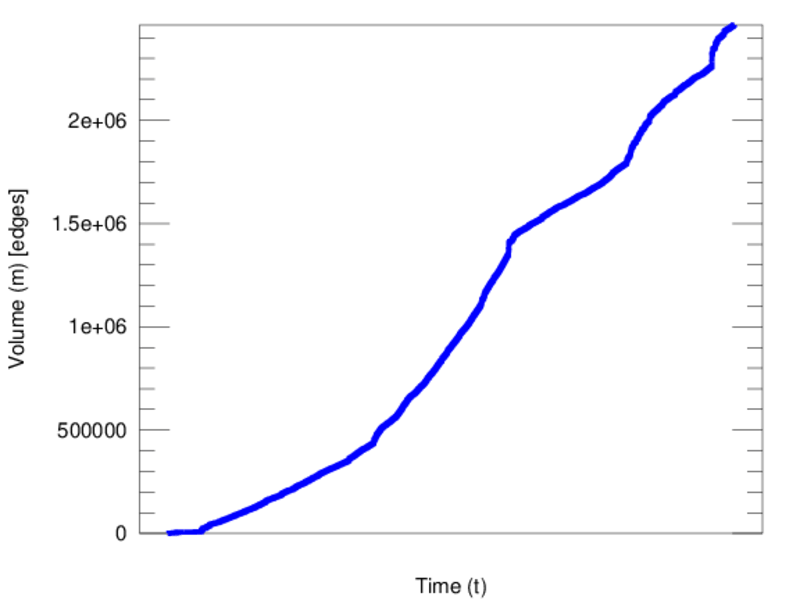
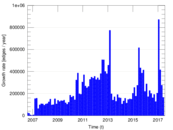
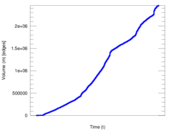
edge represents an edit. The dataset includes the timestamp of each edit.
Metadata
Statistics
| Size | n = | 446,889
|
| Left size | n1 = | 7,489
|
| Right size | n2 = | 439,400
|
| Volume | m = | 2,461,702
|
| Unique edge count | m̿ = | 1,393,066
|
| Wedge count | s = | 29,230,878,977
|
| Claw count | z = | 789,986,316,663,629
|
| Cross count | x = | 1.932 66 × 1019
|
| Square count | q = | 15,426,065,880
|
| 4-Tour count | T4 = | 240,336,472,036
|
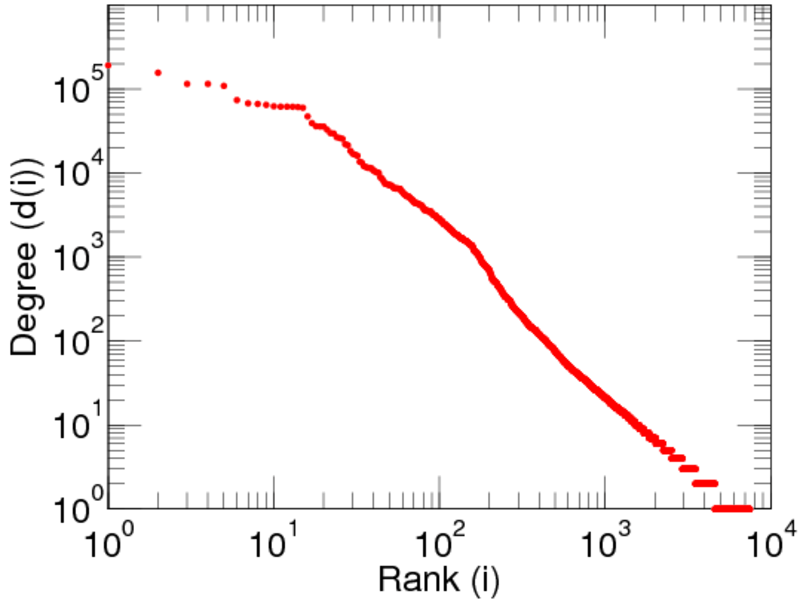
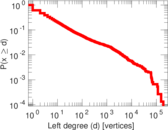
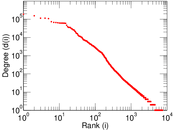
| Maximum degree | dmax = | 191,119
|
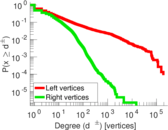
| Maximum left degree | d1max = | 191,119
|
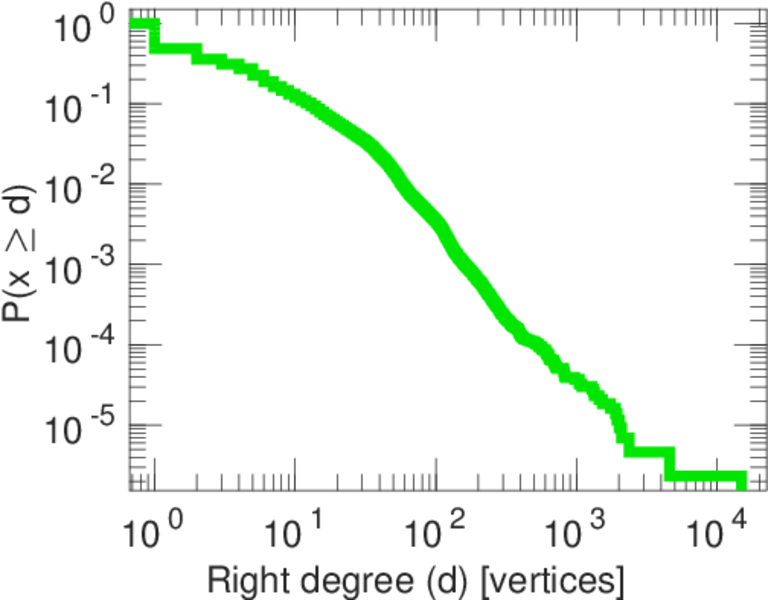
| Maximum right degree | d2max = | 14,899
|
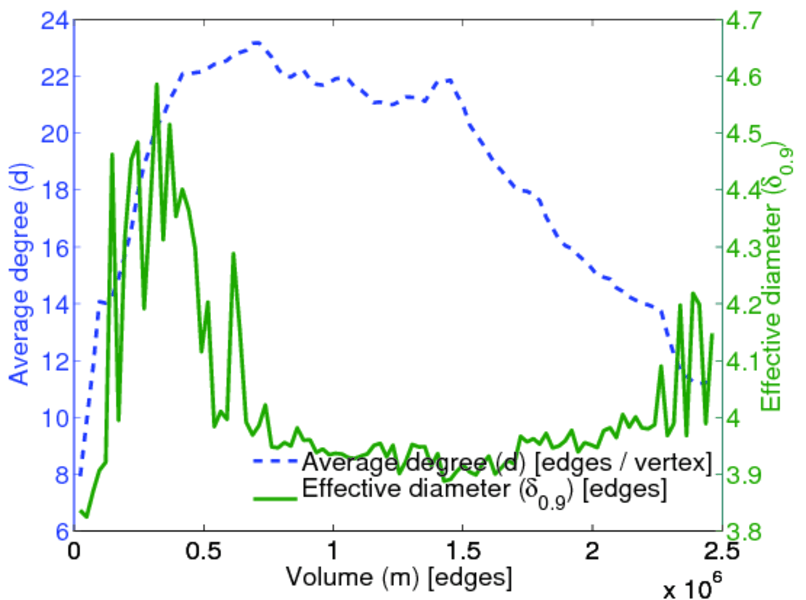
| Average degree | d = | 11.017 1
|
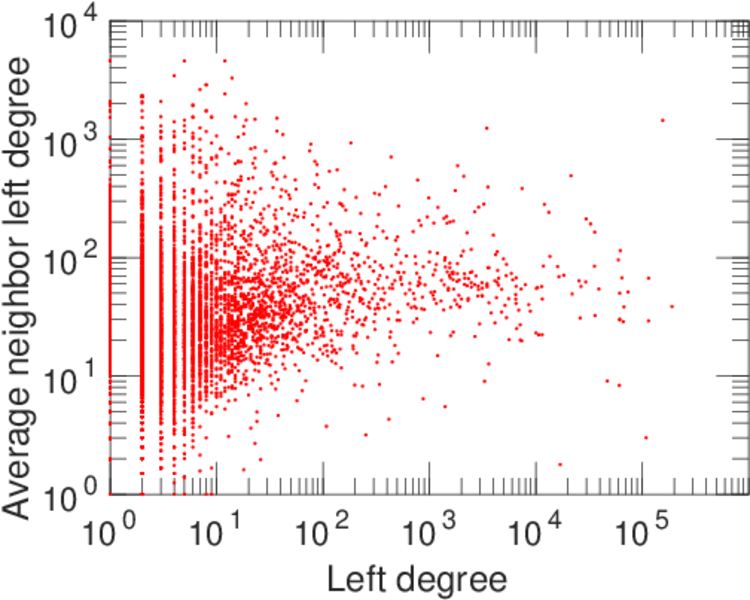
| Average left degree | d1 = | 328.709
|
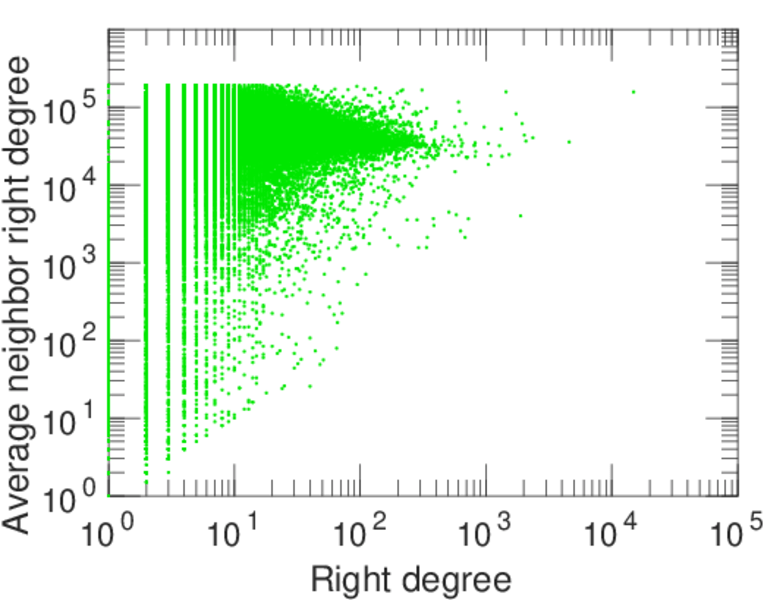
| Average right degree | d2 = | 5.602 42
|
| Fill | p = | 0.000 423 339
|
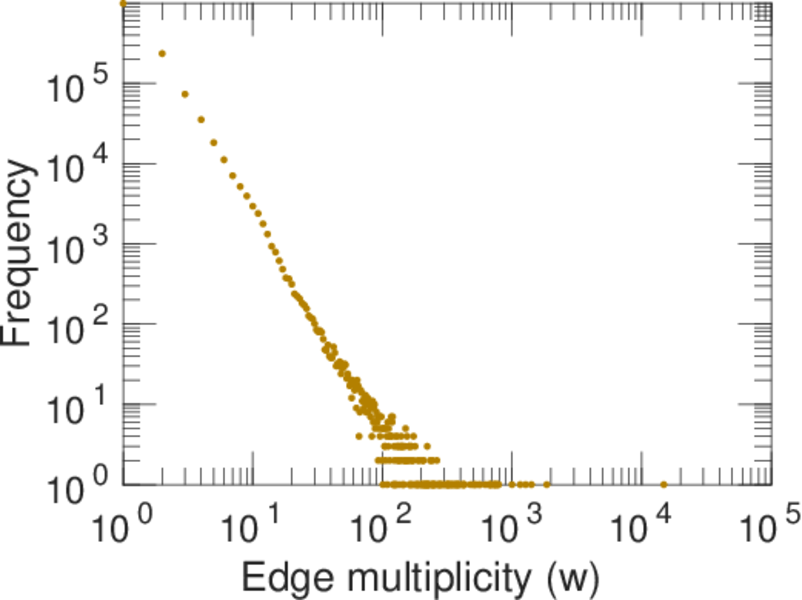
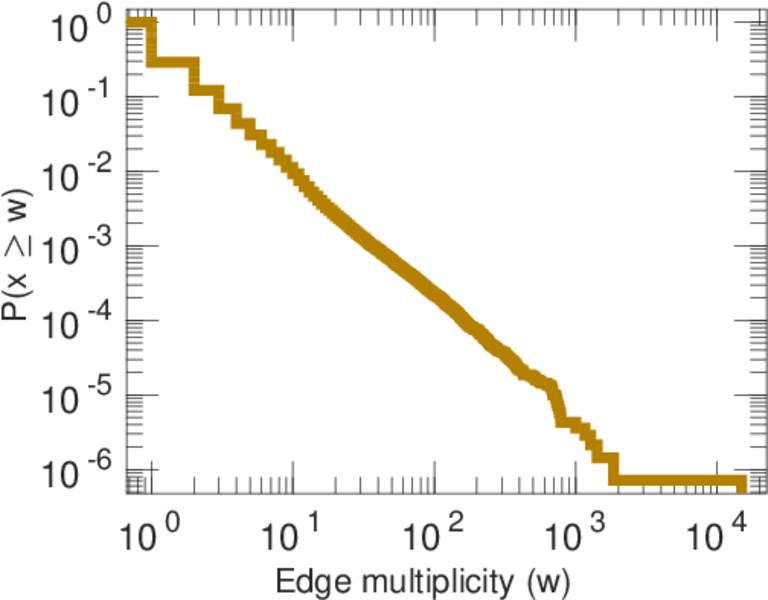
| Average edge multiplicity | m̃ = | 1.767 11
|
| Size of LCC | N = | 436,756
|
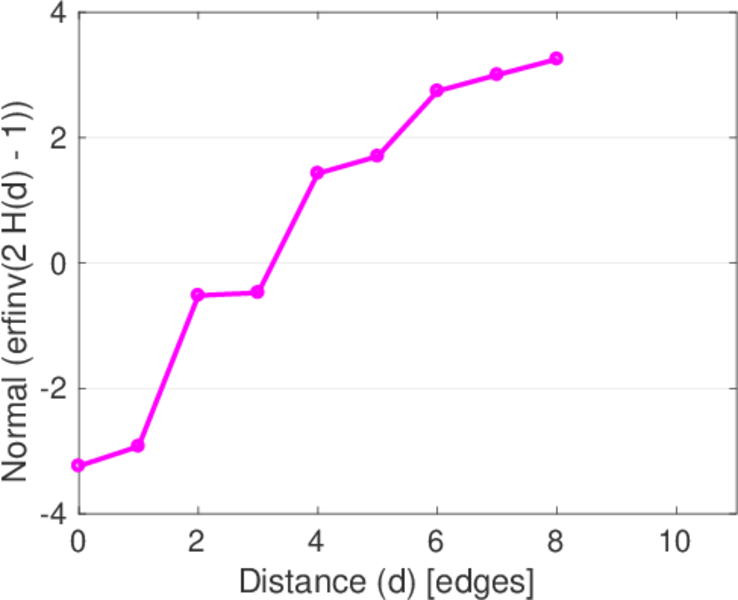
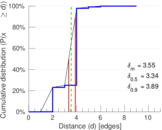
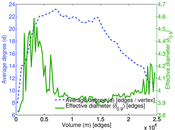
| Diameter | δ = | 12
|
| 50-Percentile effective diameter | δ0.5 = | 3.343 11
|
| 90-Percentile effective diameter | δ0.9 = | 3.892 62
|
| Median distance | δM = | 4
|
| Mean distance | δm = | 3.549 07
|
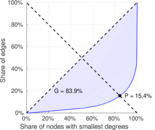
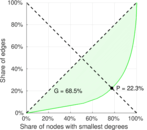
| Gini coefficient | G = | 0.841 924
|
| Balanced inequality ratio | P = | 0.154 606
|
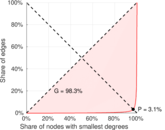
| Left balanced inequality ratio | P1 = | 0.031 364 1
|
| Right balanced inequality ratio | P2 = | 0.223 081
|
| Relative edge distribution entropy | Her = | 0.696 858
|
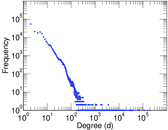
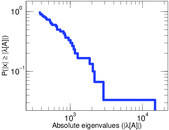
| Power law exponent | γ = | 2.548 32
|
| Tail power law exponent | γt = | 1.921 00
|
| Tail power law exponent with p | γ3 = | 1.921 00
|
| p-value | p = | 0.000 00
|
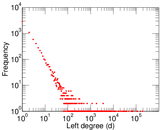
| Left tail power law exponent with p | γ3,1 = | 1.691 00
|
| Left p-value | p1 = | 0.000 00
|
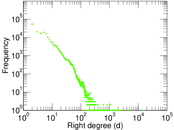
| Right tail power law exponent with p | γ3,2 = | 4.541 00
|
| Right p-value | p2 = | 0.000 00
|
| Degree assortativity | ρ = | −0.387 220
|
| Degree assortativity p-value | pρ = | 0.000 00
|
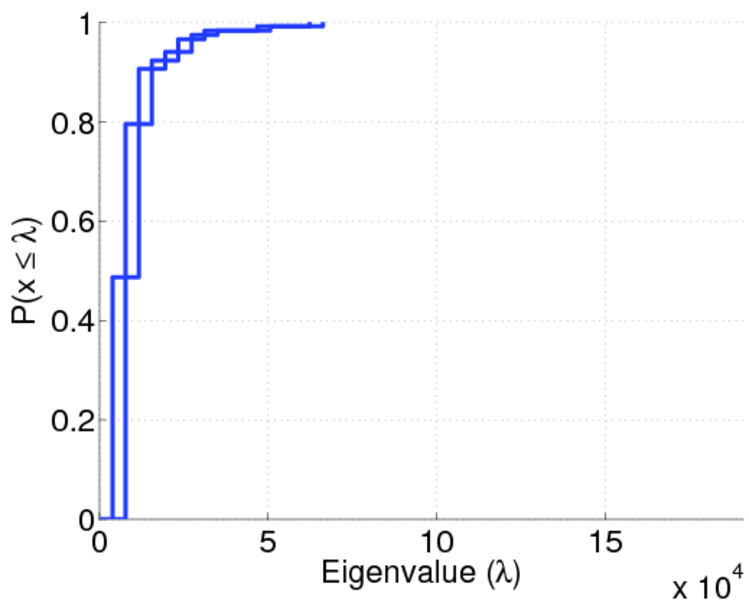
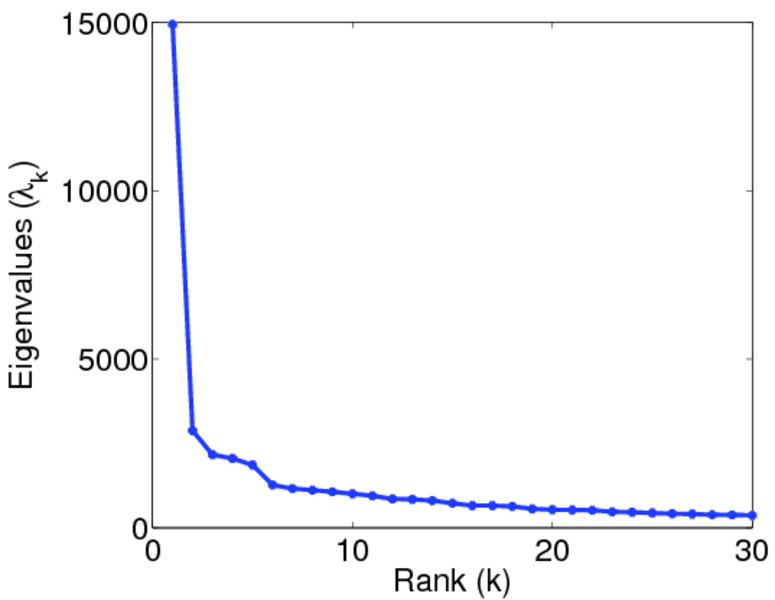
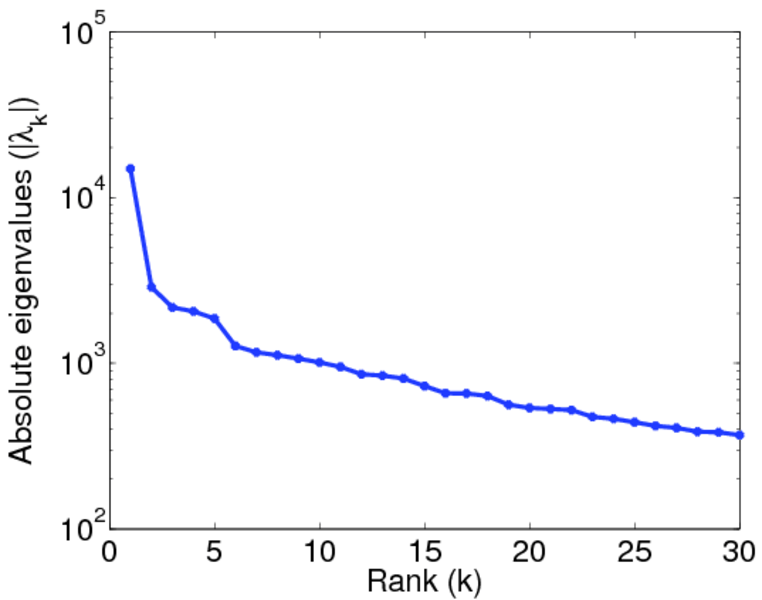
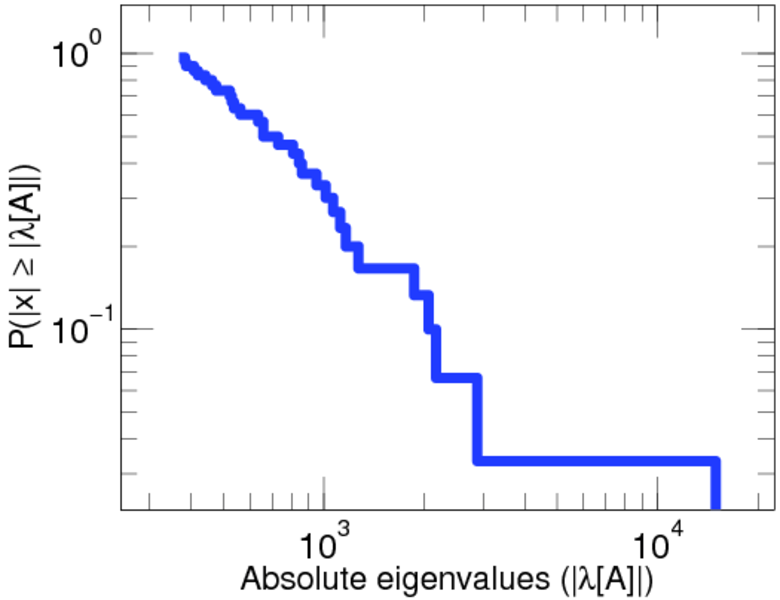
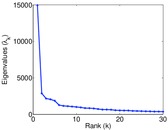
| Spectral norm | α = | 14,933.9
|
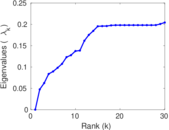
| Algebraic connectivity | a = | 0.047 497 4
|
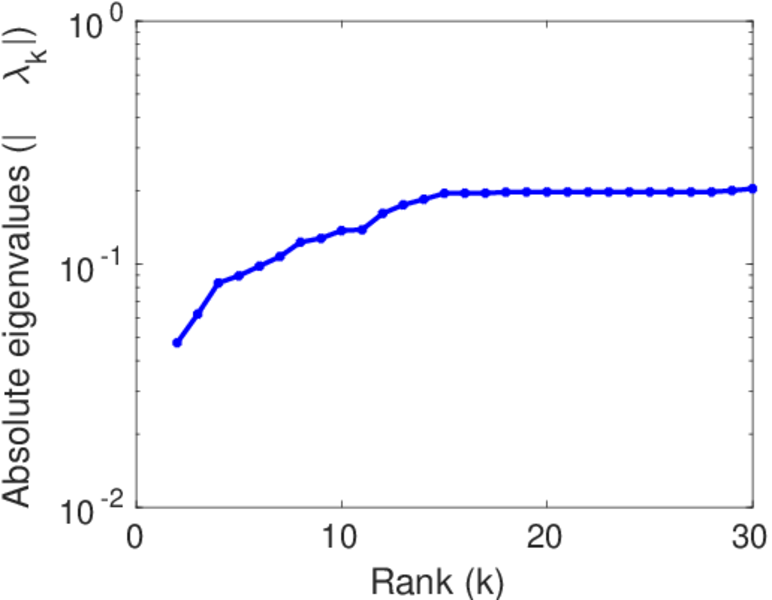
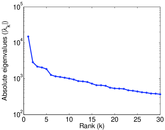
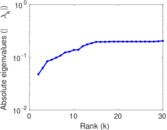
| Spectral separation | |λ1[A] / λ2[A]| = | 5.183 16
|
| Controllability | C = | 423,755
|
| Relative controllability | Cr = | 0.967 758
|
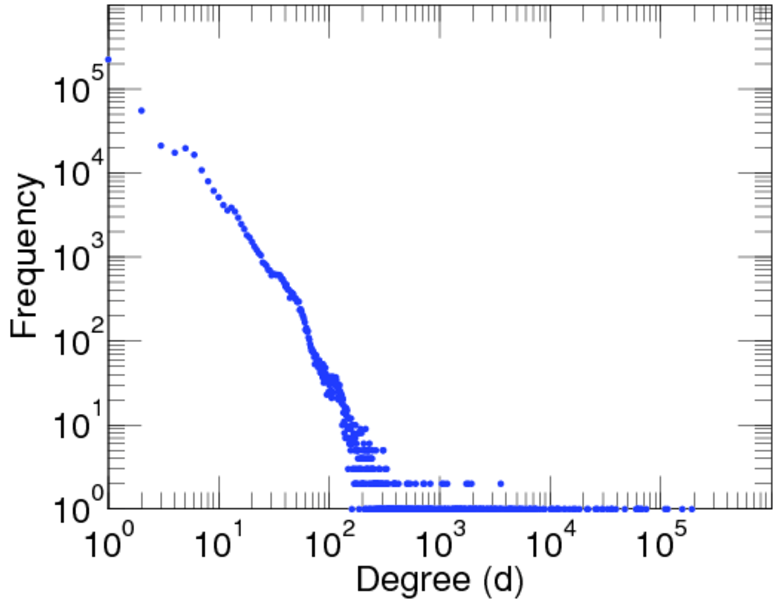
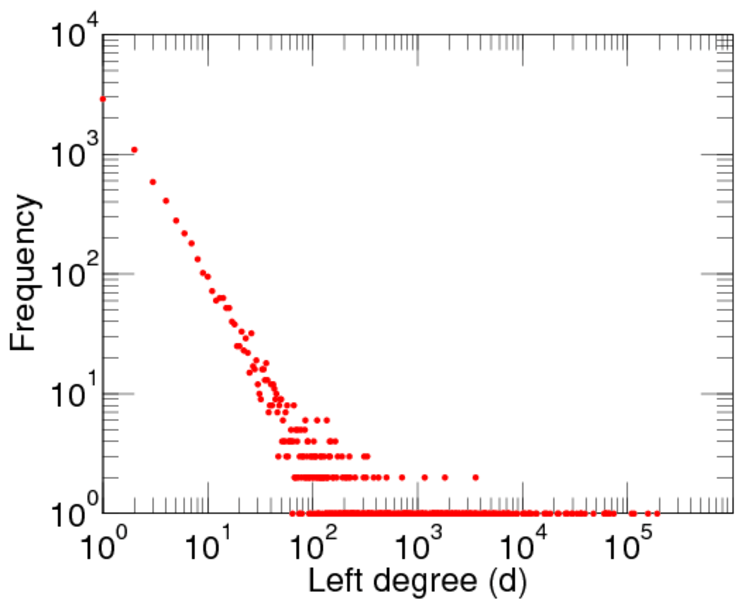
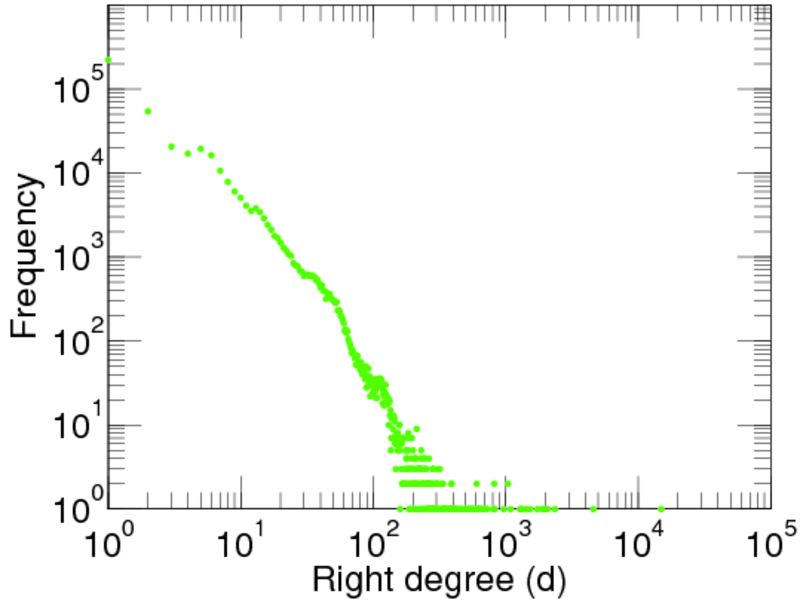
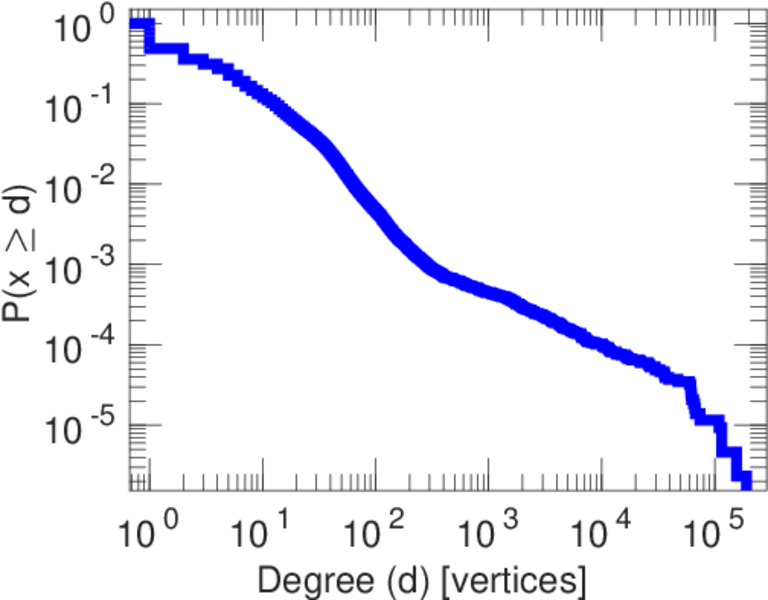
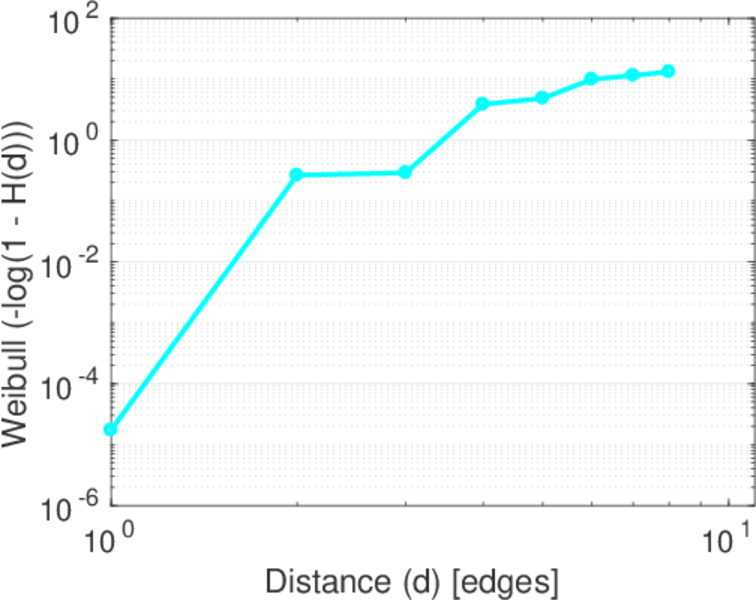
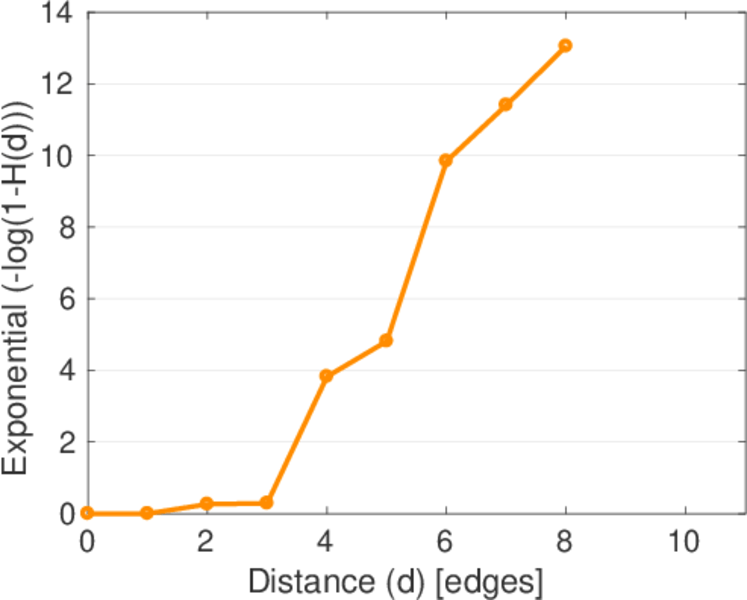
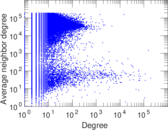
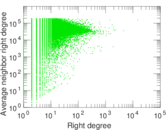
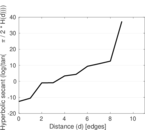
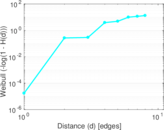
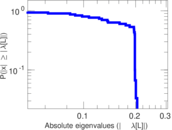
Plots


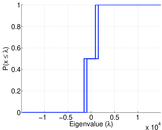
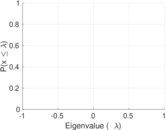
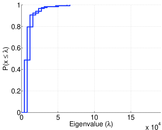


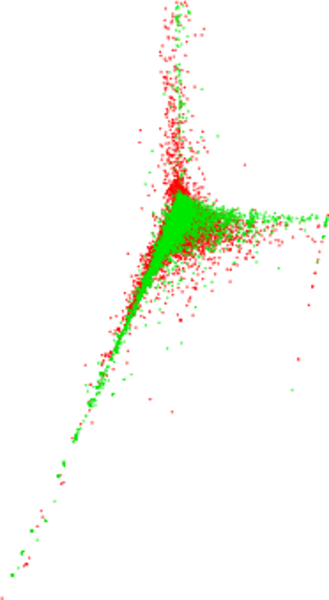
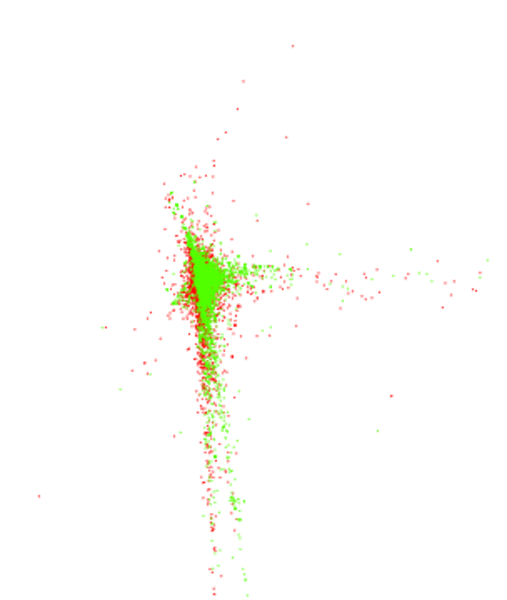
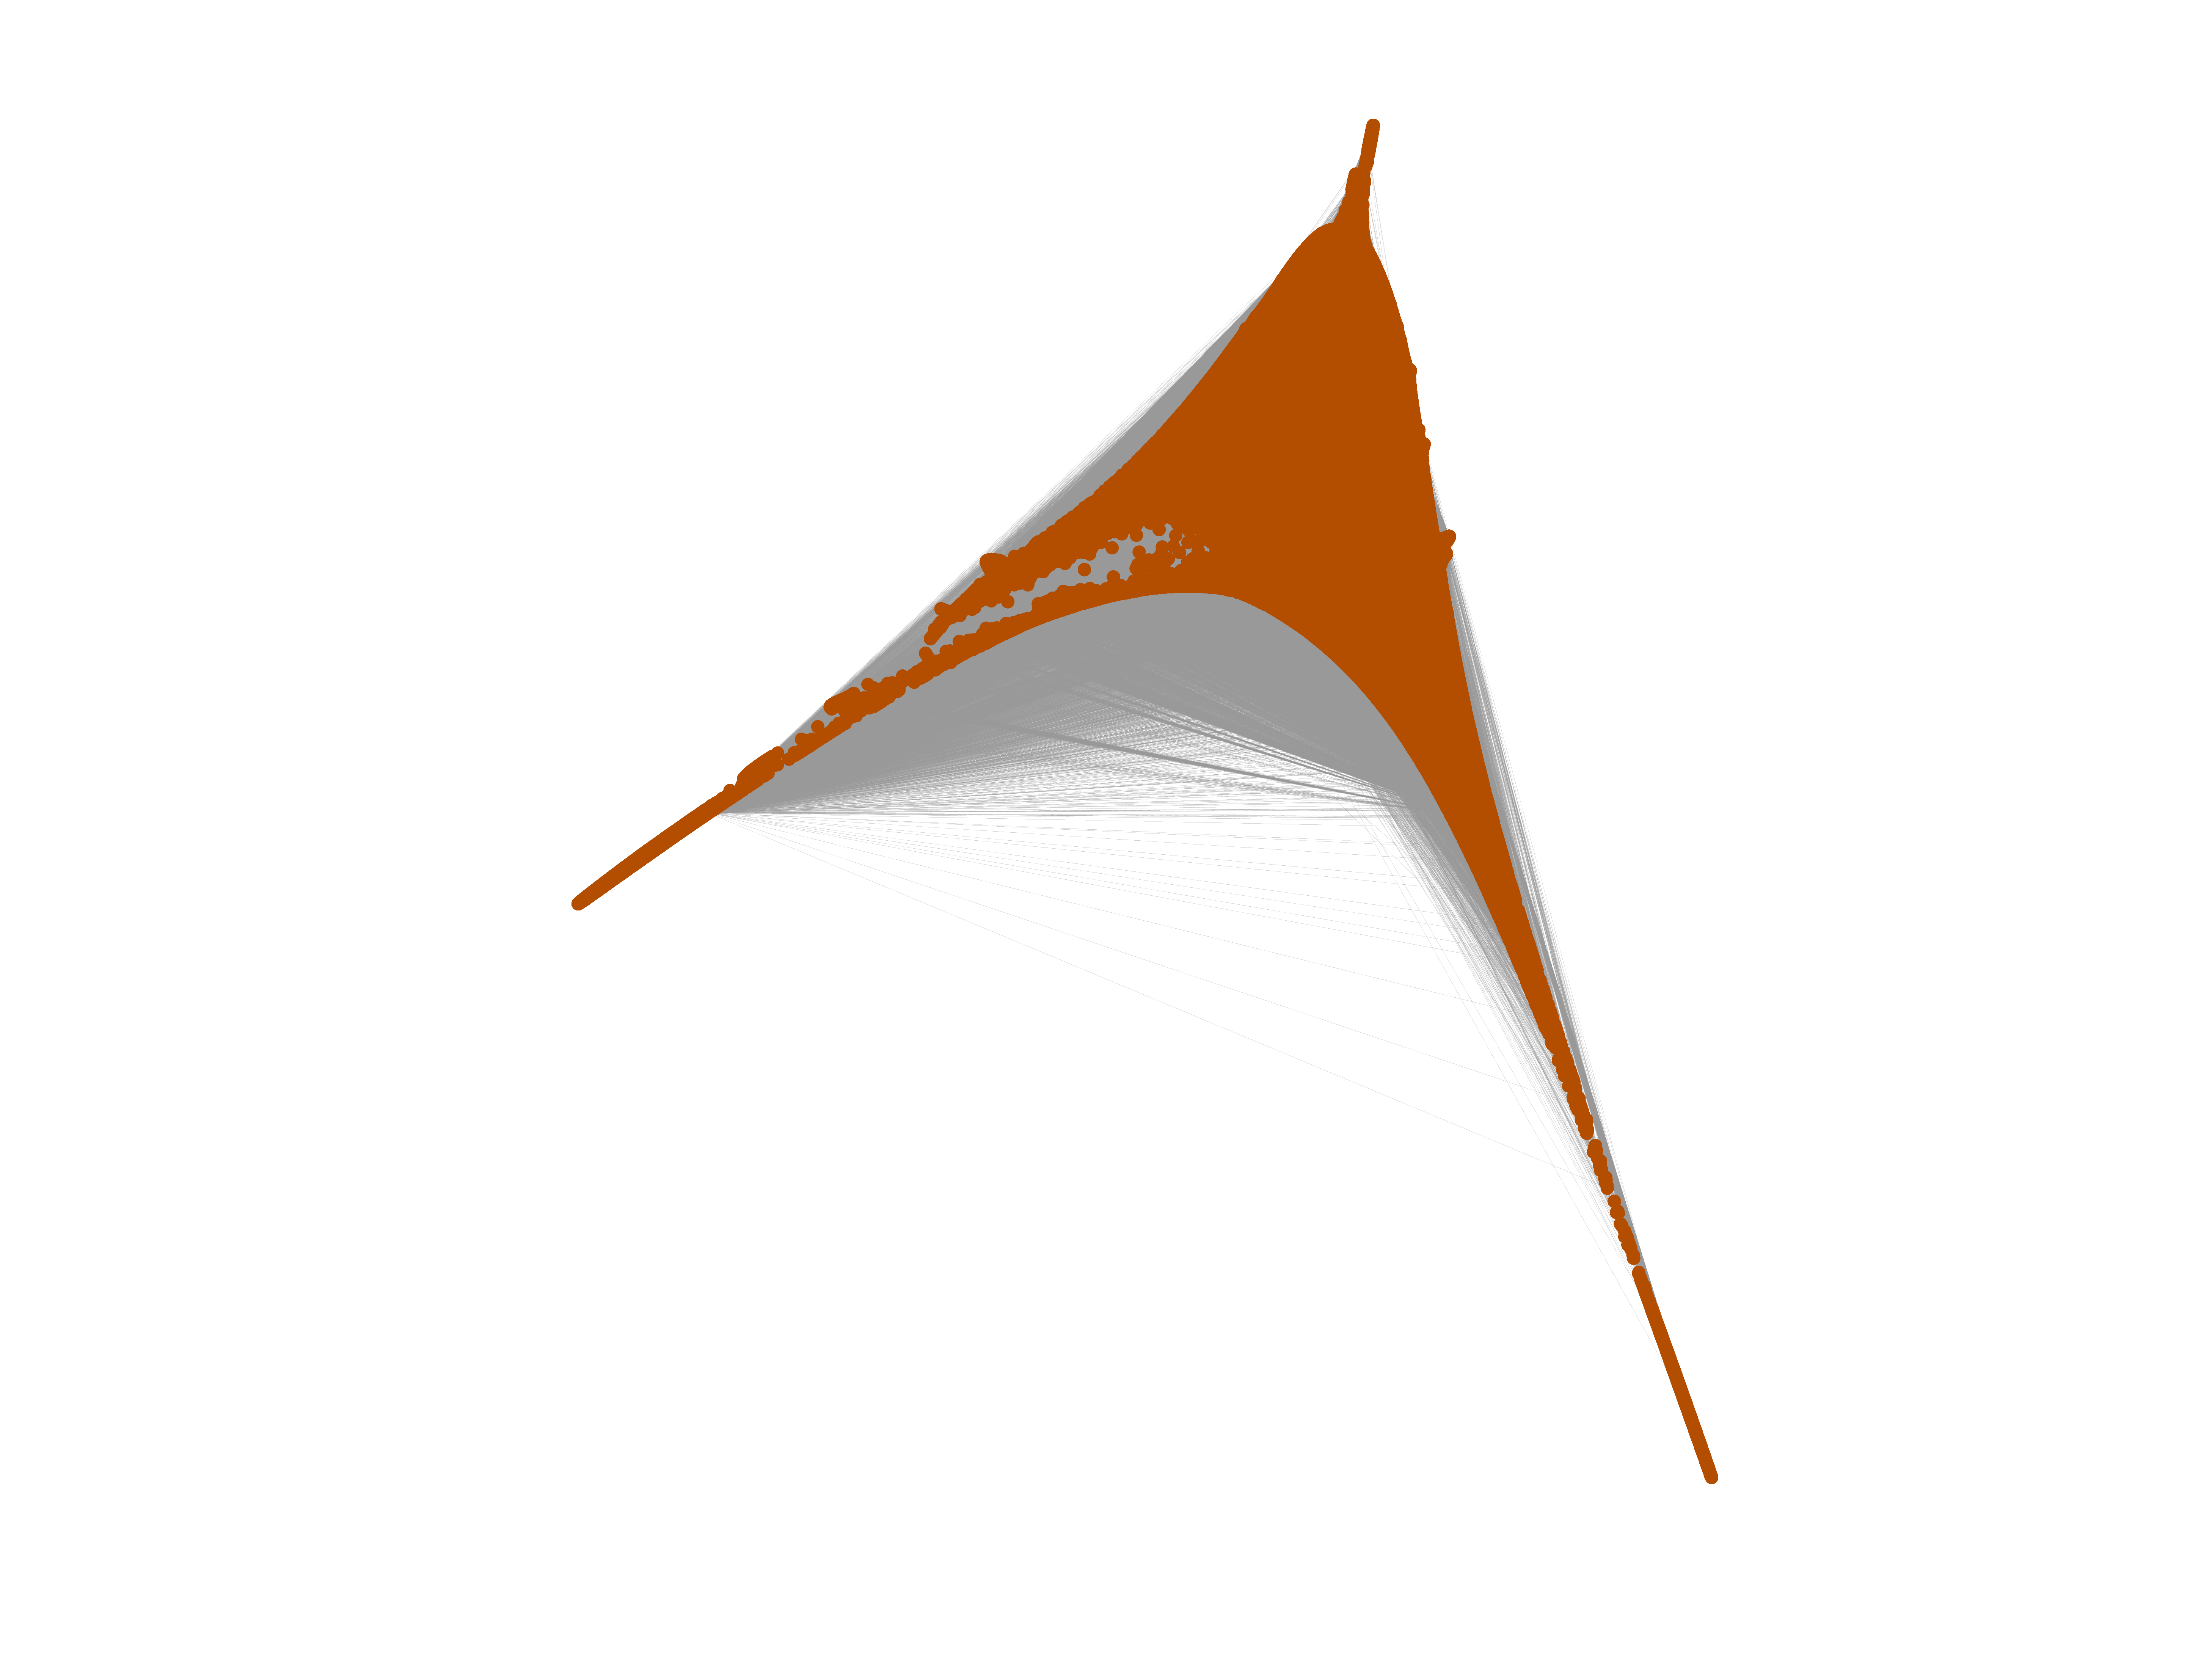
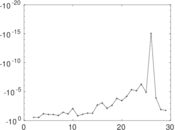
Matrix decompositions plots
Downloads
References
|
[1]
|
Jérôme Kunegis.
KONECT – The Koblenz Network Collection.
In Proc. Int. Conf. on World Wide Web Companion, pages
1343–1350, 2013.
[ http ]
|
|
[2]
|
Wikimedia Foundation.
Wikimedia downloads.
http://dumps.wikimedia.org/, January 2010.
|
 KONECT ‣ Networks ‣
Buy Me a Coffee
KONECT ‣ Networks ‣
Buy Me a Coffee