Wiktionary edits (be)
This is the bipartite edit network of the Belarusian Wiktionary. It contains
users and pages from the Belarusian Wiktionary, connected by edit events. Each
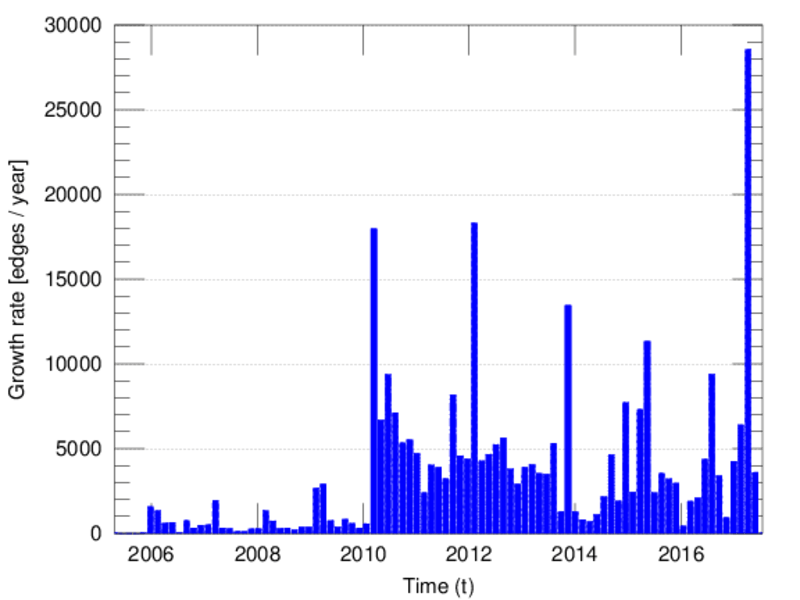
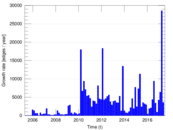
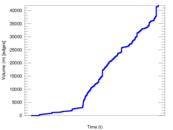
edge represents an edit. The dataset includes the timestamp of each edit.
Metadata
Statistics
| Size | n = | 7,426
|
| Left size | n1 = | 301
|
| Right size | n2 = | 7,125
|
| Volume | m = | 41,935
|
| Unique edge count | m̿ = | 24,847
|
| Wedge count | s = | 28,295,012
|
| Claw count | z = | 34,202,981,725
|
| Cross count | x = | 36,867,405,291,862
|
| Square count | q = | 27,067,311
|
| 4-Tour count | T4 = | 329,769,194
|
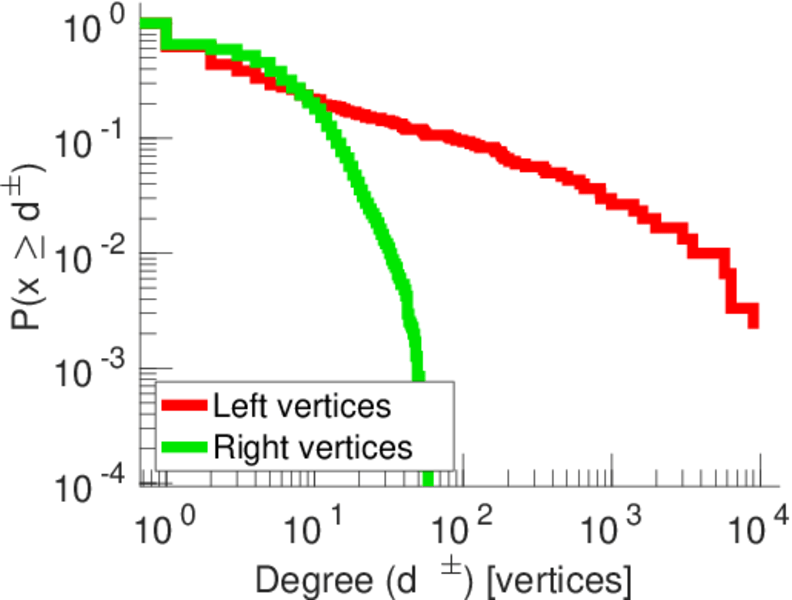
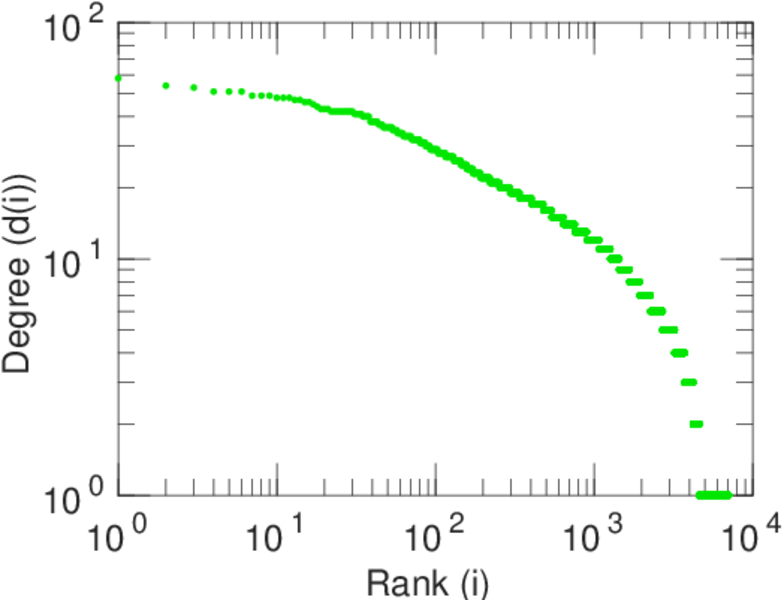
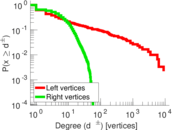
| Maximum degree | dmax = | 9,006
|
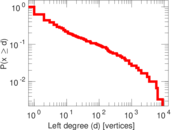
| Maximum left degree | d1max = | 9,006
|
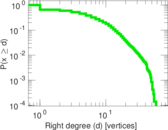
| Maximum right degree | d2max = | 58
|
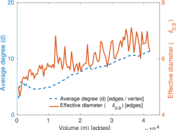
| Average degree | d = | 11.294 1
|
| Average left degree | d1 = | 139.319
|
| Average right degree | d2 = | 5.885 61
|
| Fill | p = | 0.011 585 7
|
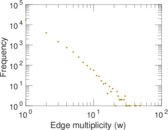
| Average edge multiplicity | m̃ = | 1.687 73
|
| Size of LCC | N = | 7,119
|
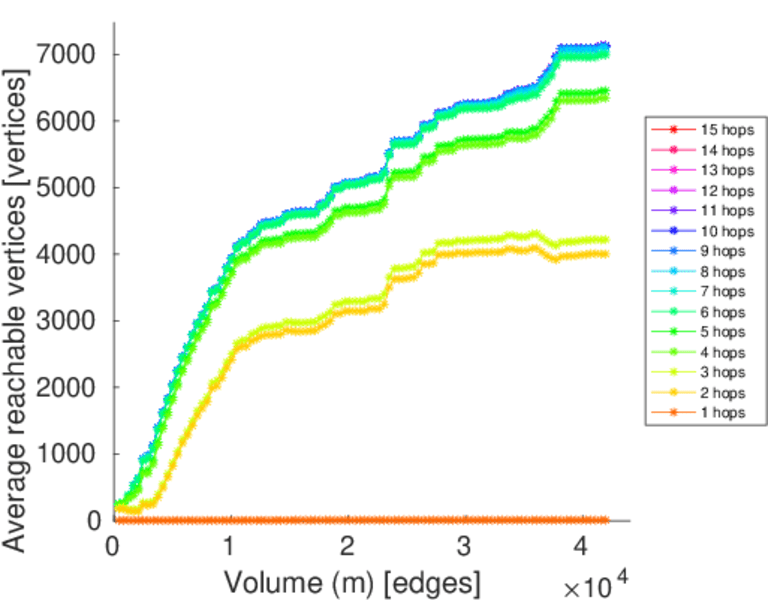
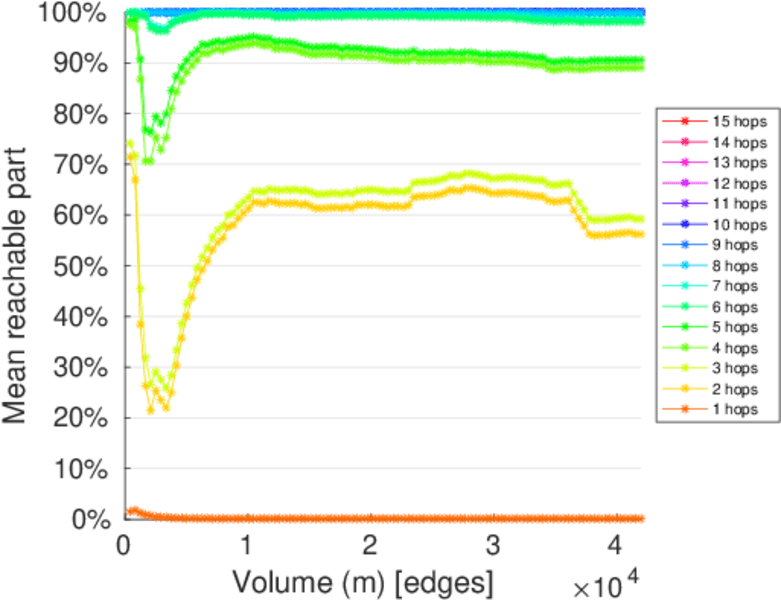
| Diameter | δ = | 15
|
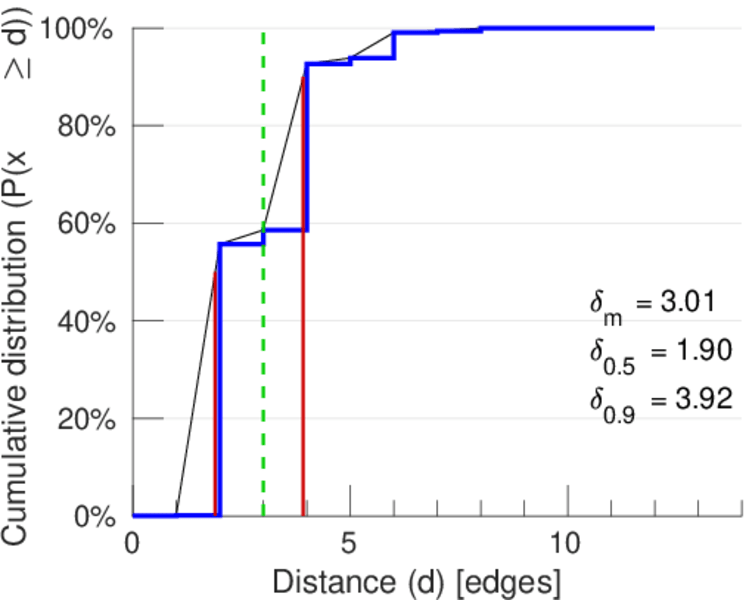
| 50-Percentile effective diameter | δ0.5 = | 1.897 63
|
| 90-Percentile effective diameter | δ0.9 = | 3.923 30
|
| Median distance | δM = | 2
|
| Mean distance | δm = | 3.008 34
|
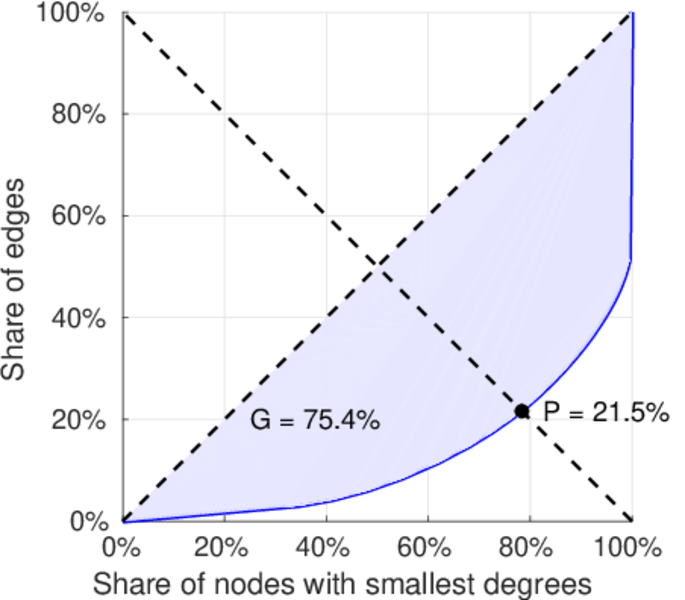
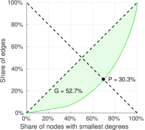
| Gini coefficient | G = | 0.752 219
|
| Balanced inequality ratio | P = | 0.216 991
|
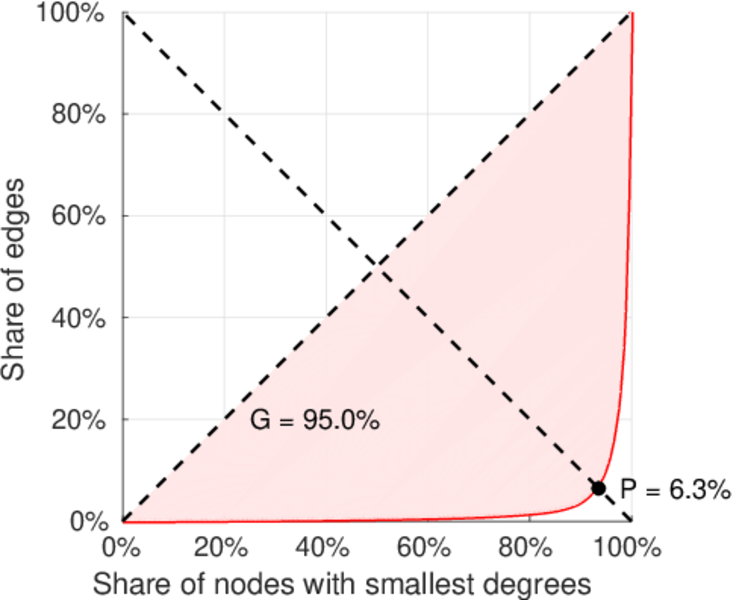
| Left balanced inequality ratio | P1 = | 0.062 930 7
|
| Right balanced inequality ratio | P2 = | 0.303 350
|
| Relative edge distribution entropy | Her = | 0.725 836
|
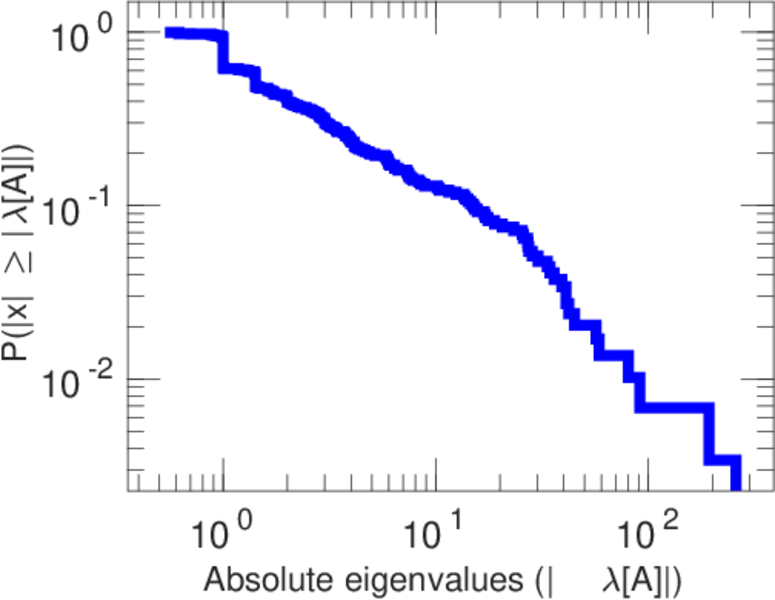
| Power law exponent | γ = | 2.062 29
|
| Tail power law exponent | γt = | 3.291 00
|
| Tail power law exponent with p | γ3 = | 3.291 00
|
| p-value | p = | 0.000 00
|
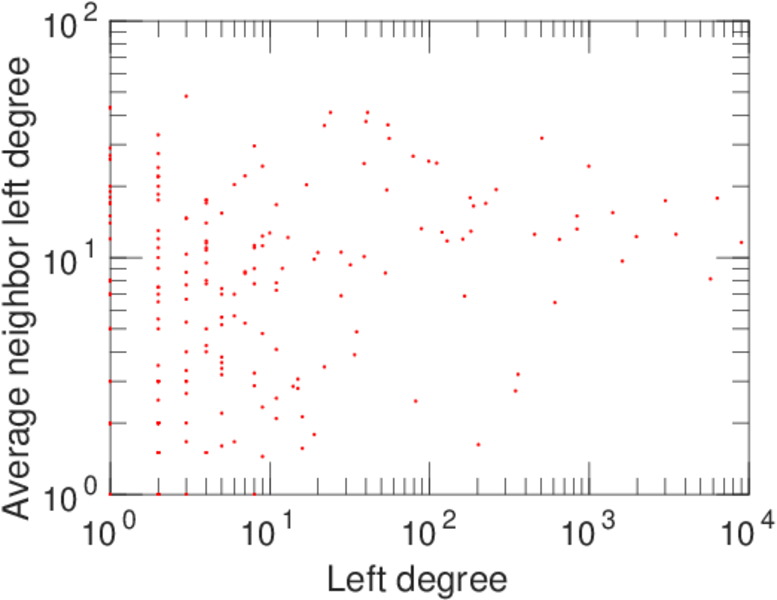
| Left tail power law exponent with p | γ3,1 = | 1.581 00
|
| Left p-value | p1 = | 0.001 000 00
|
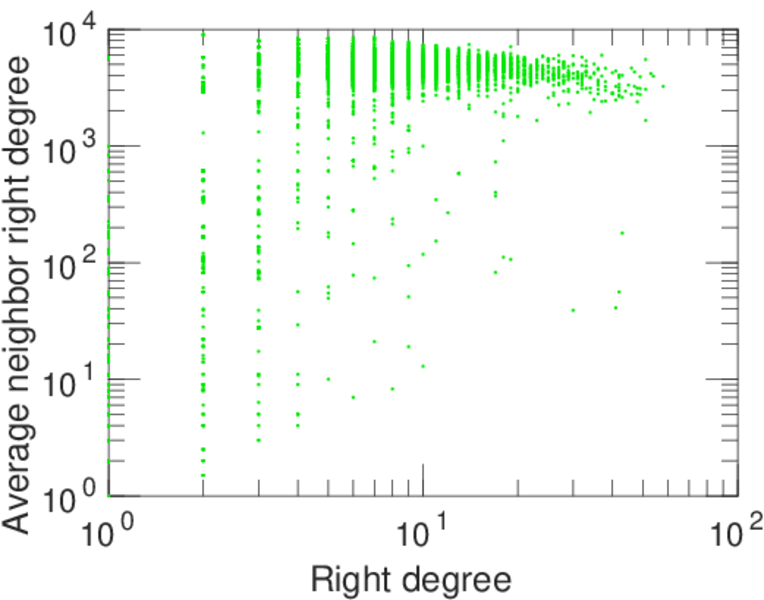
| Right tail power law exponent with p | γ3,2 = | 6.931 00
|
| Right p-value | p2 = | 0.093 000 0
|
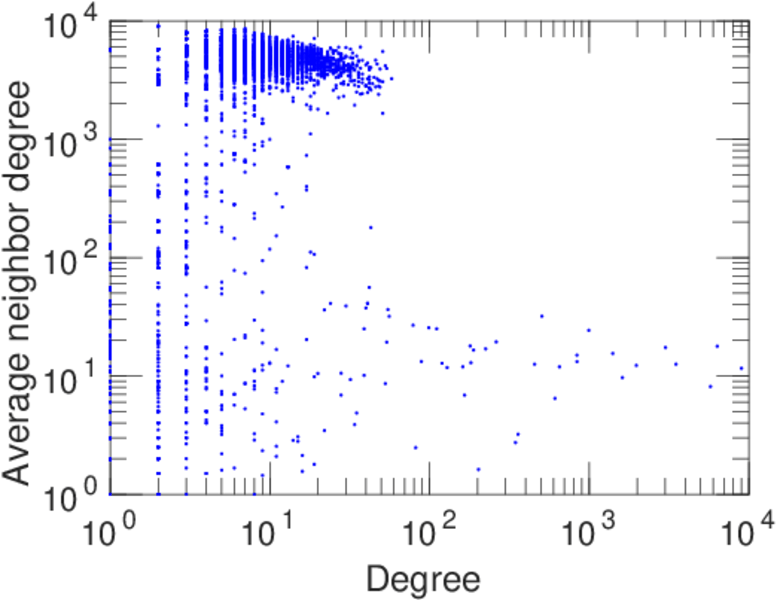
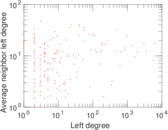
| Degree assortativity | ρ = | −0.193 906
|
| Degree assortativity p-value | pρ = | 4.499 01 × 10−209
|
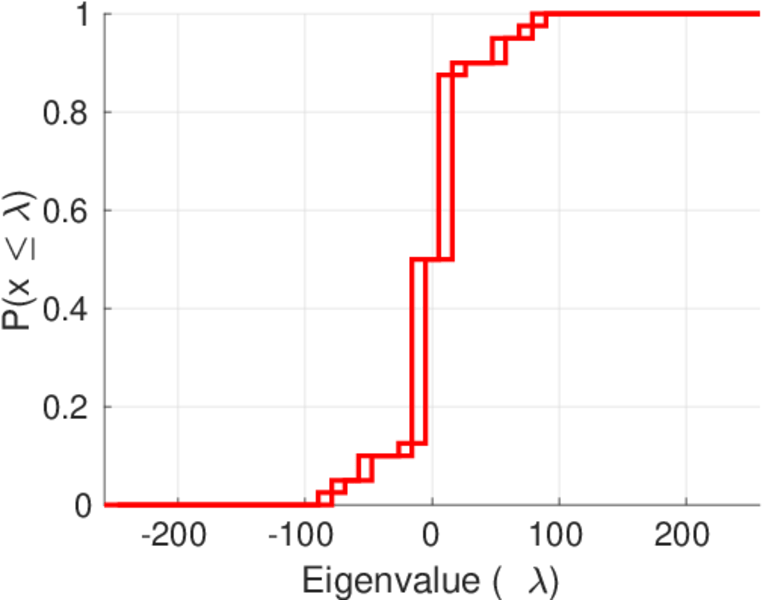
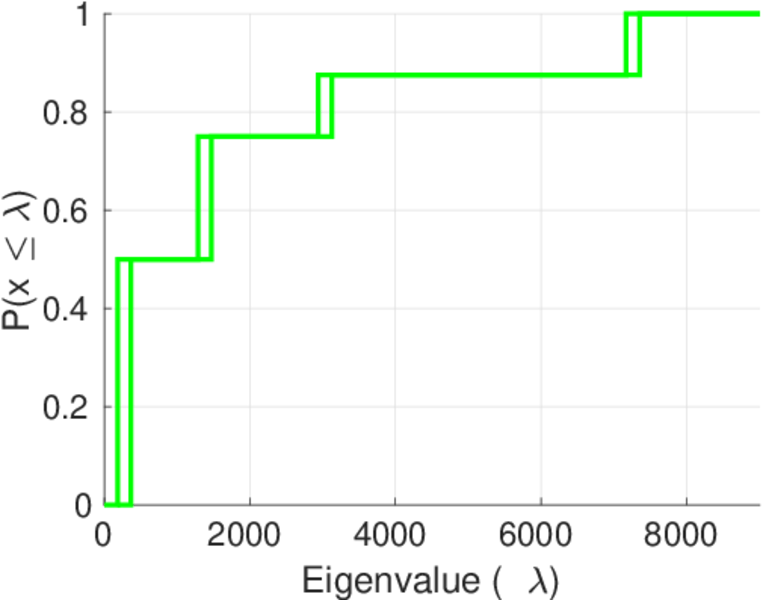
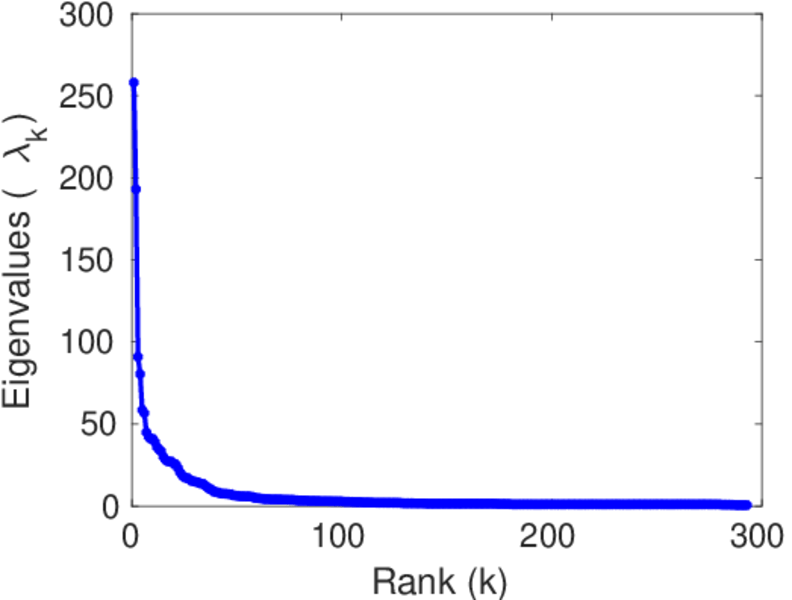
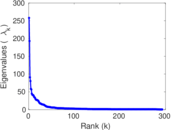
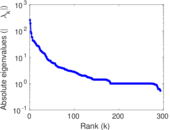
| Spectral norm | α = | 258.009
|
| Algebraic connectivity | a = | 0.019 834 5
|
| Spectral separation | |λ1[A] / λ2[A]| = | 1.336 94
|
| Controllability | C = | 6,783
|
| Relative controllability | Cr = | 0.919 479
|
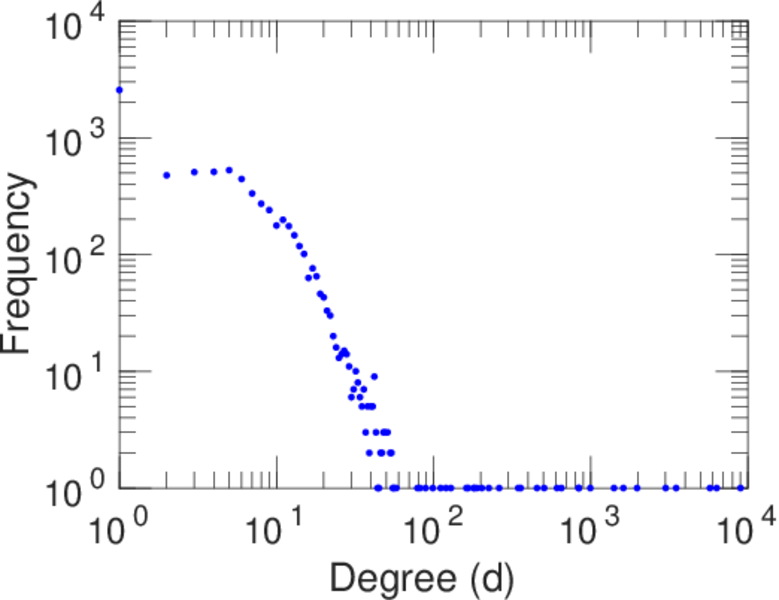
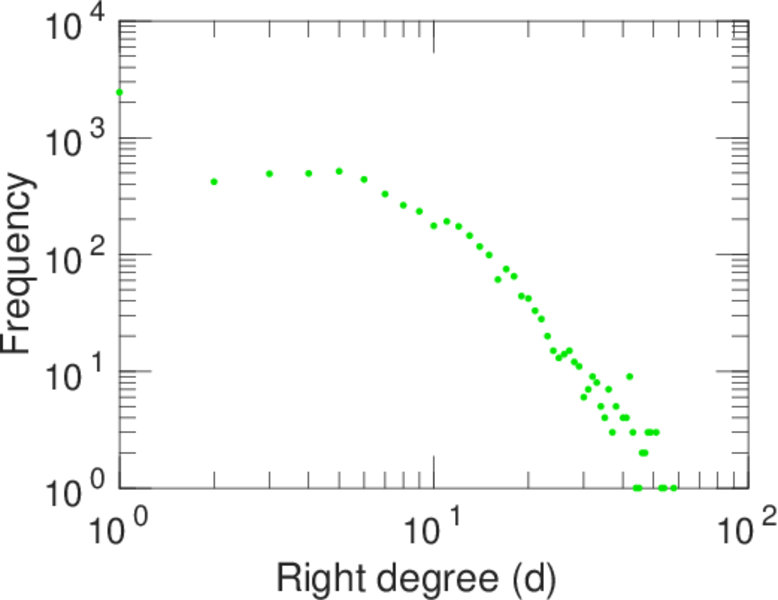
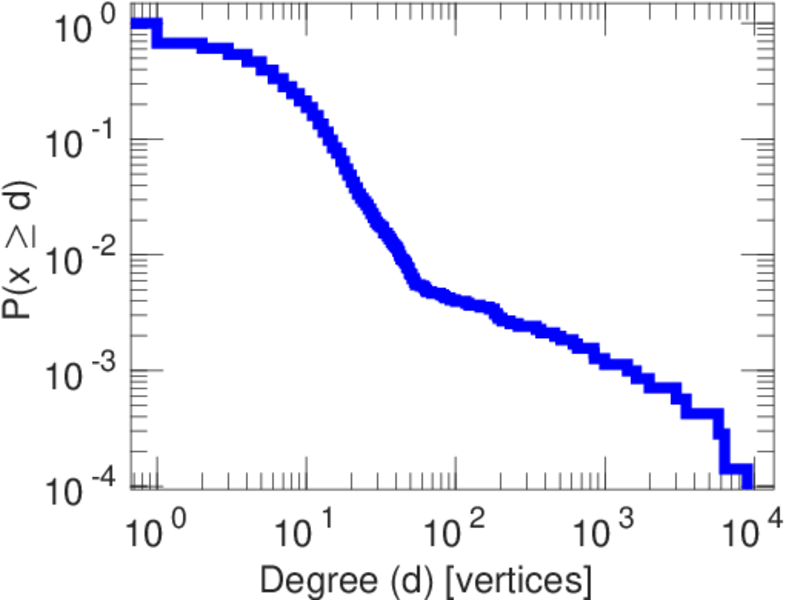
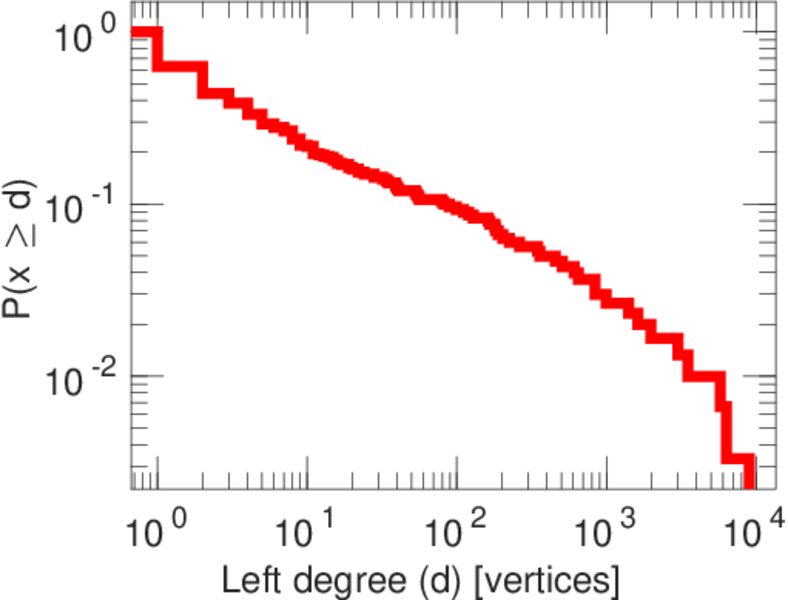
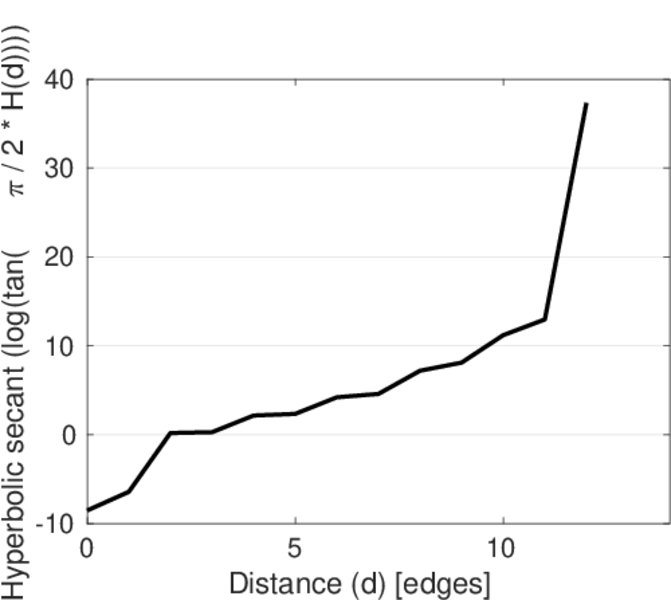
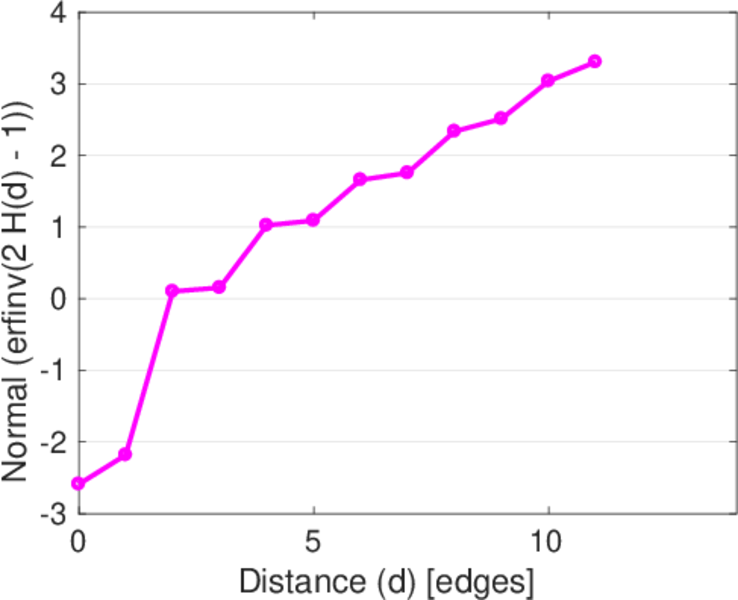
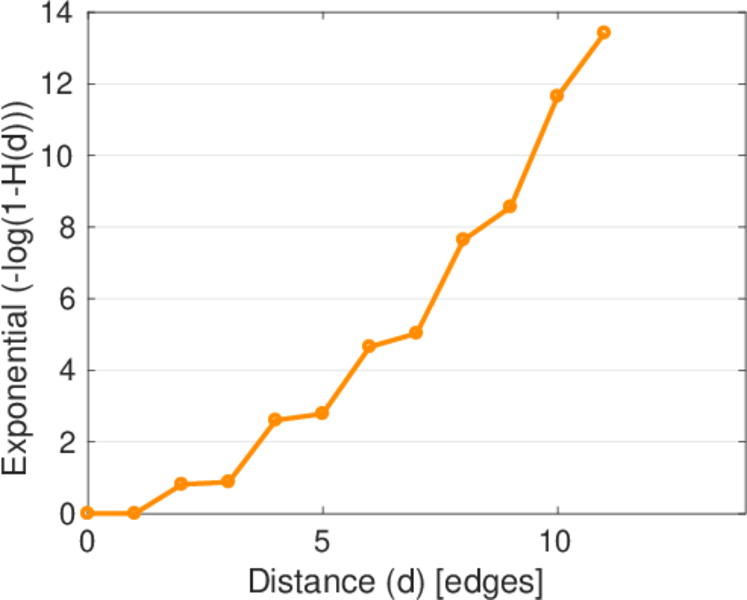
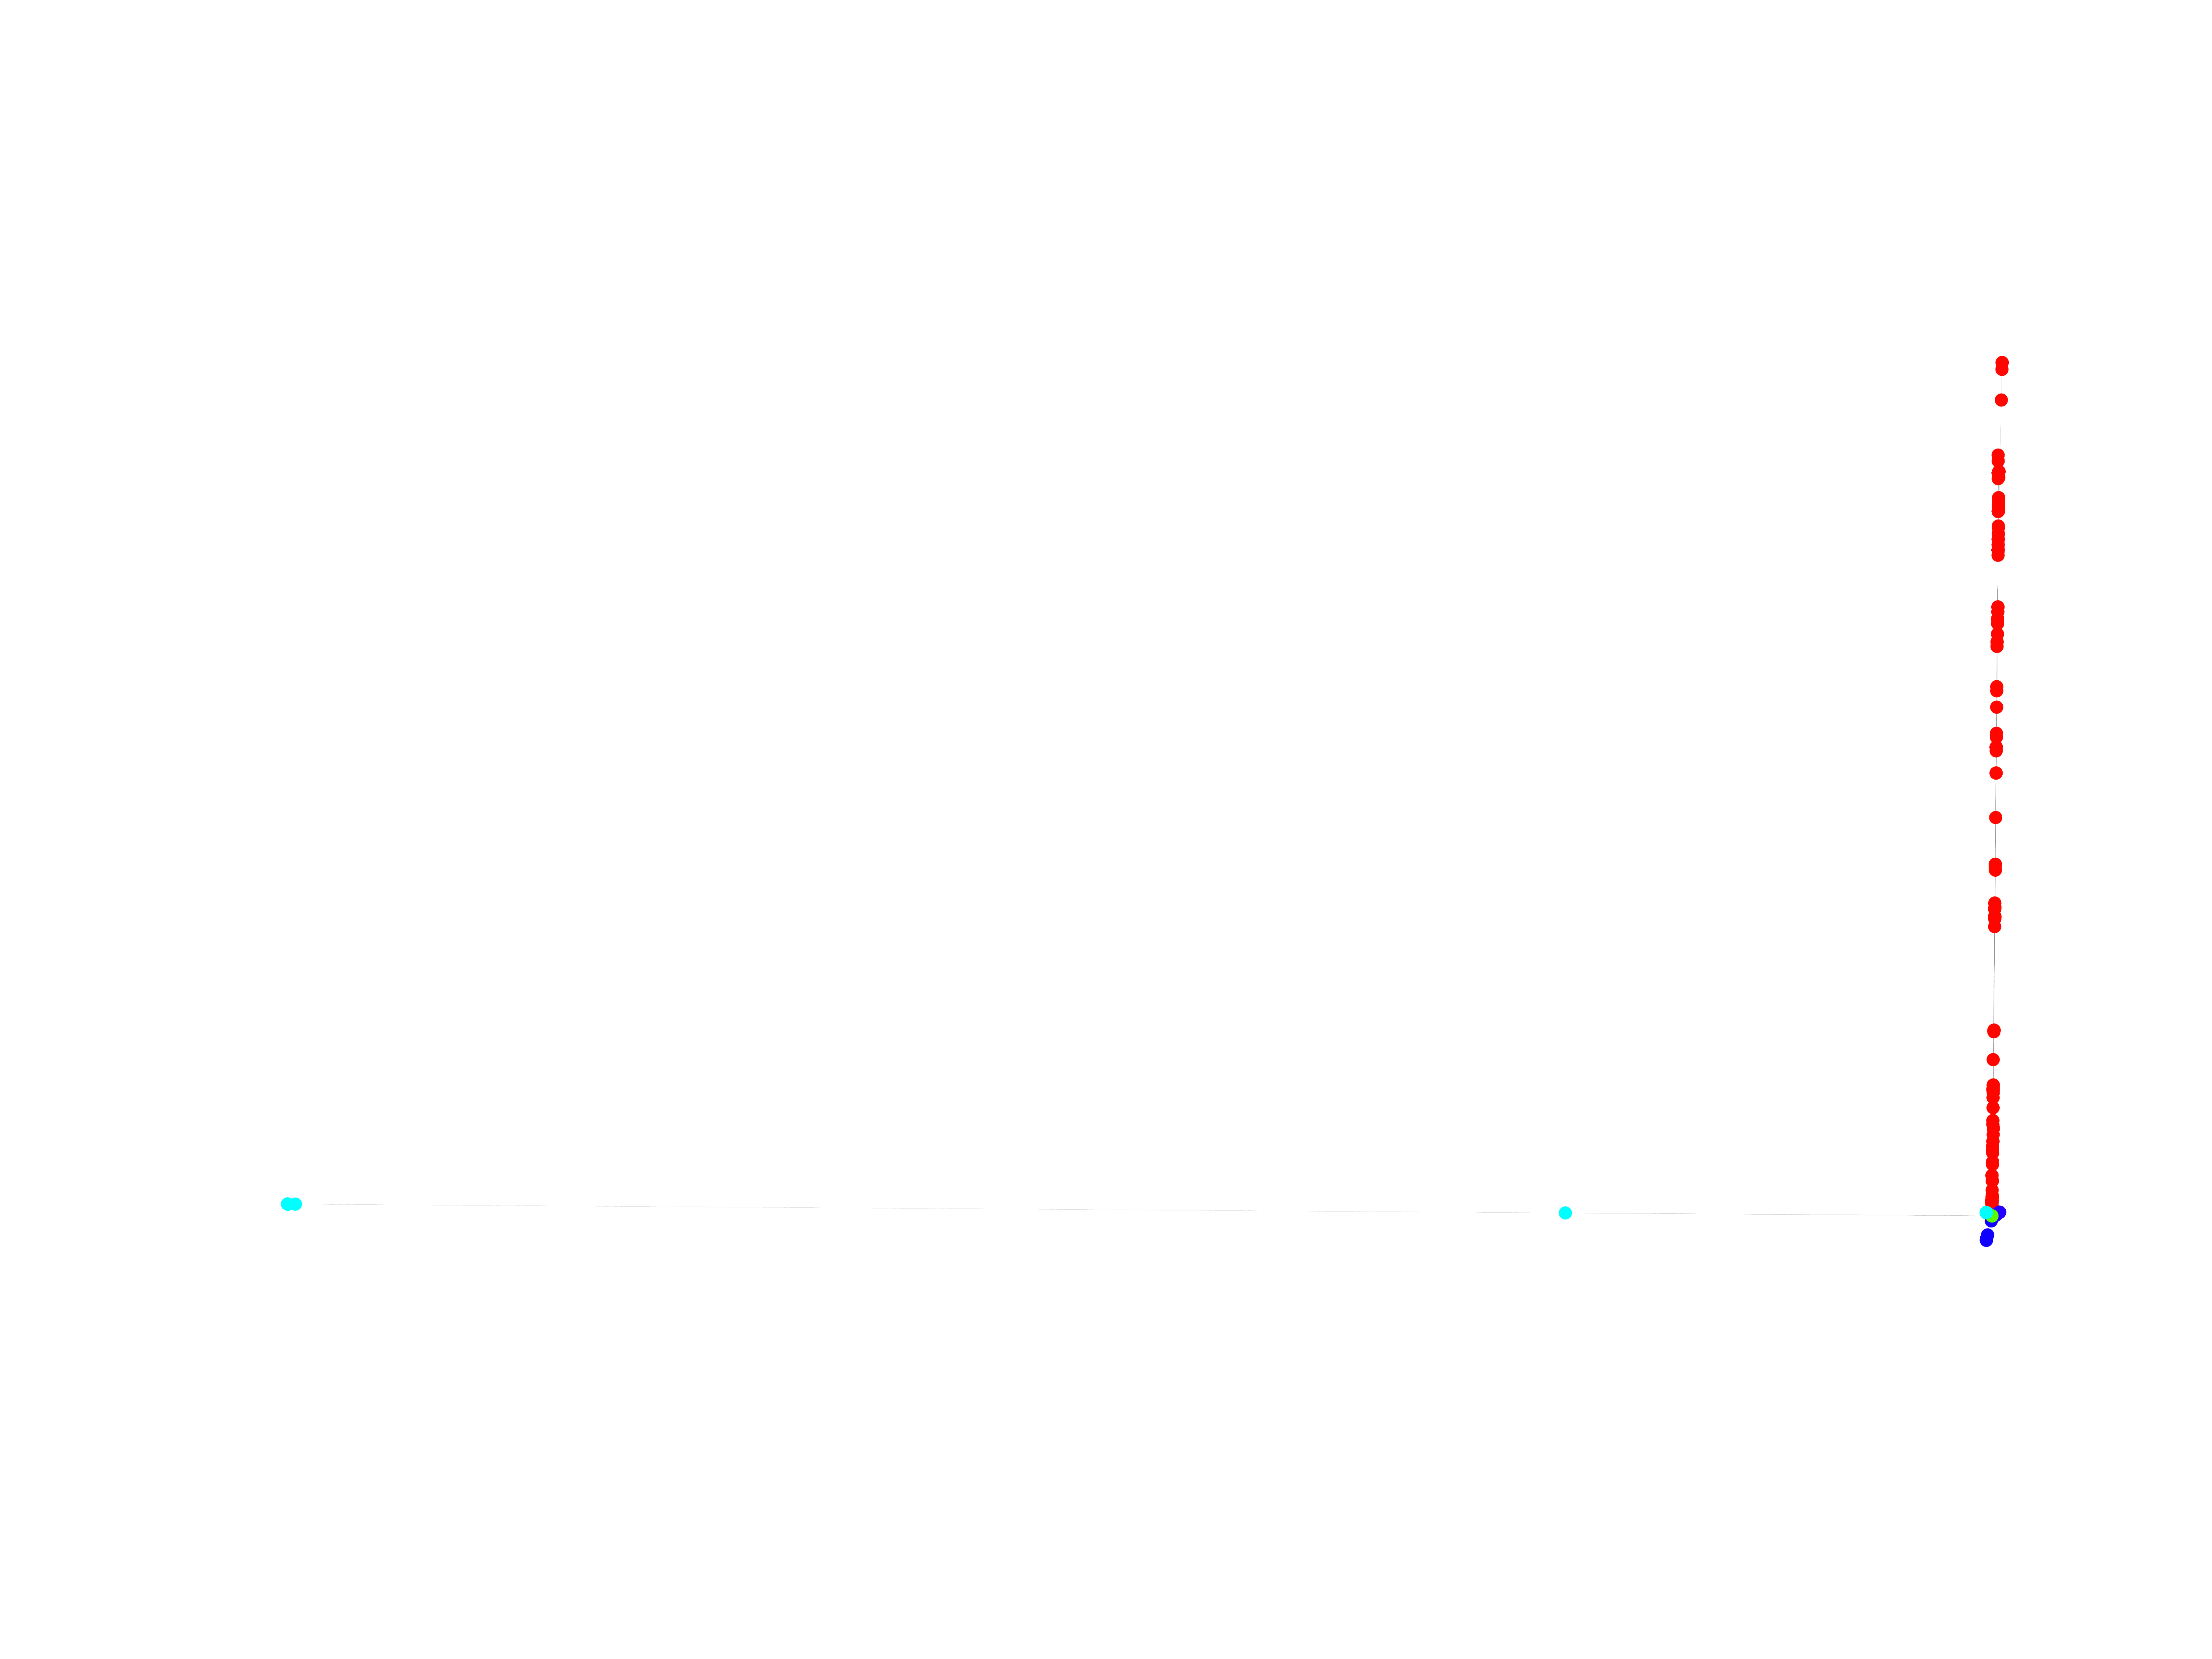
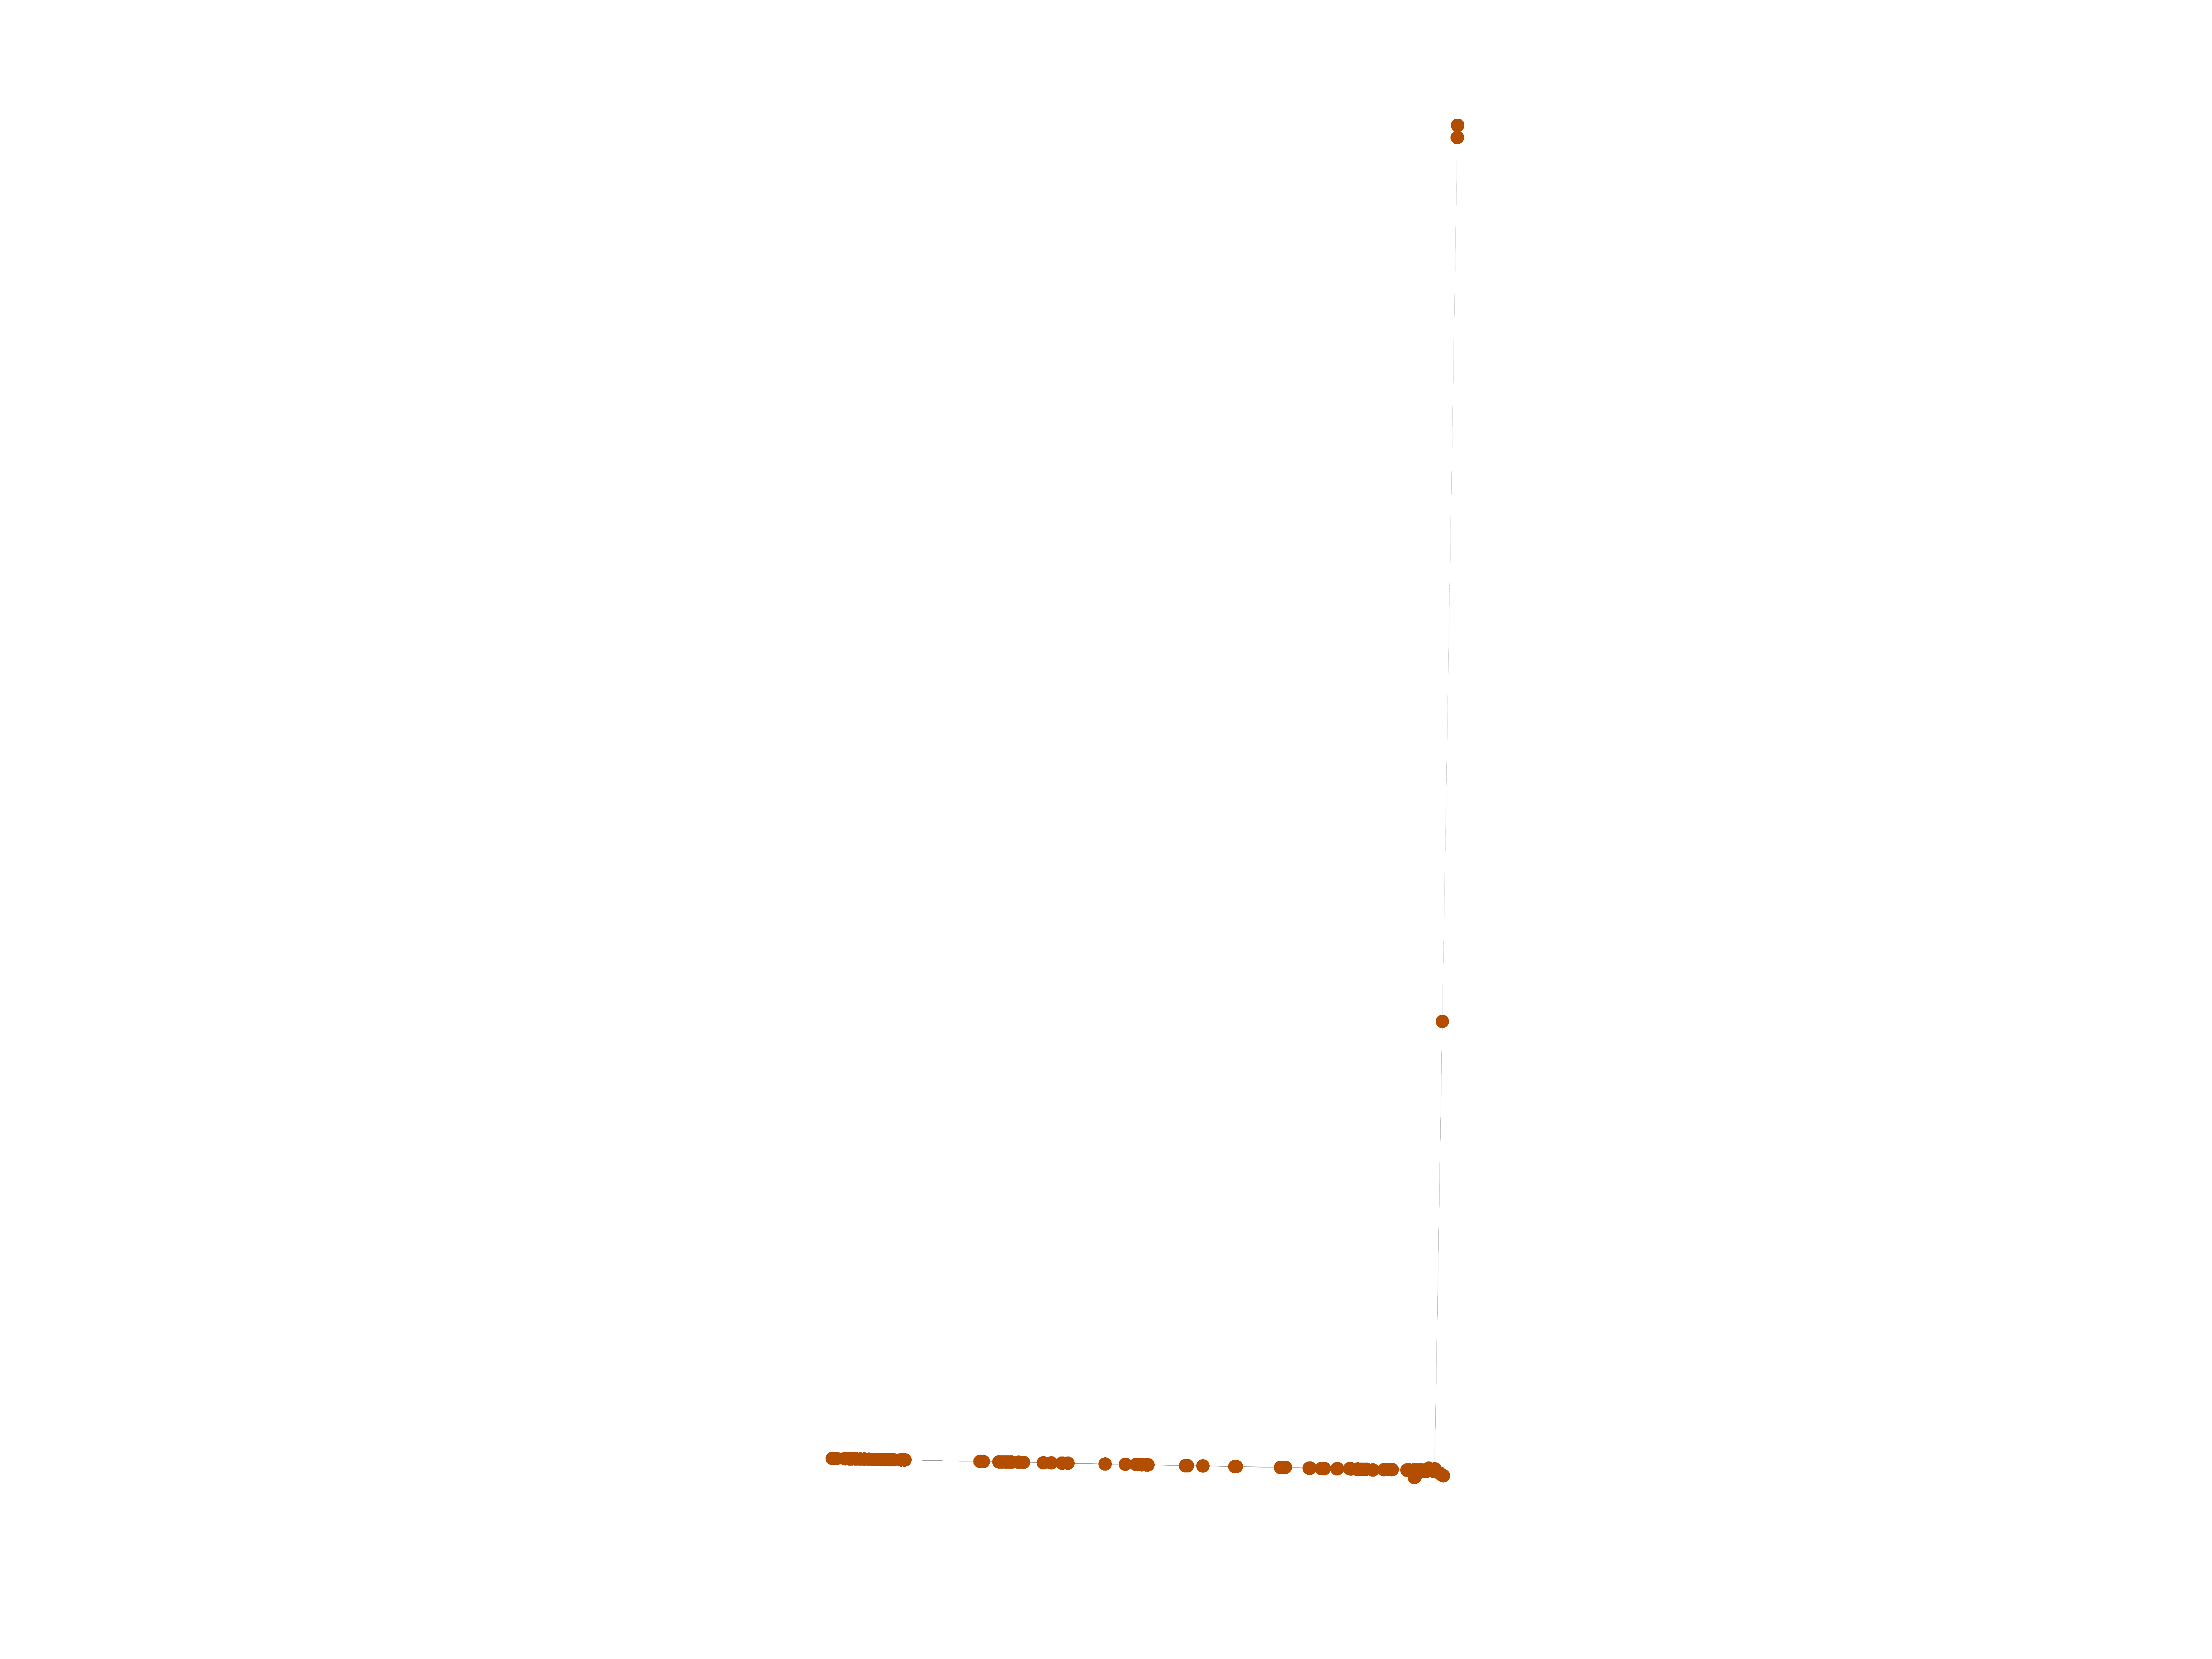
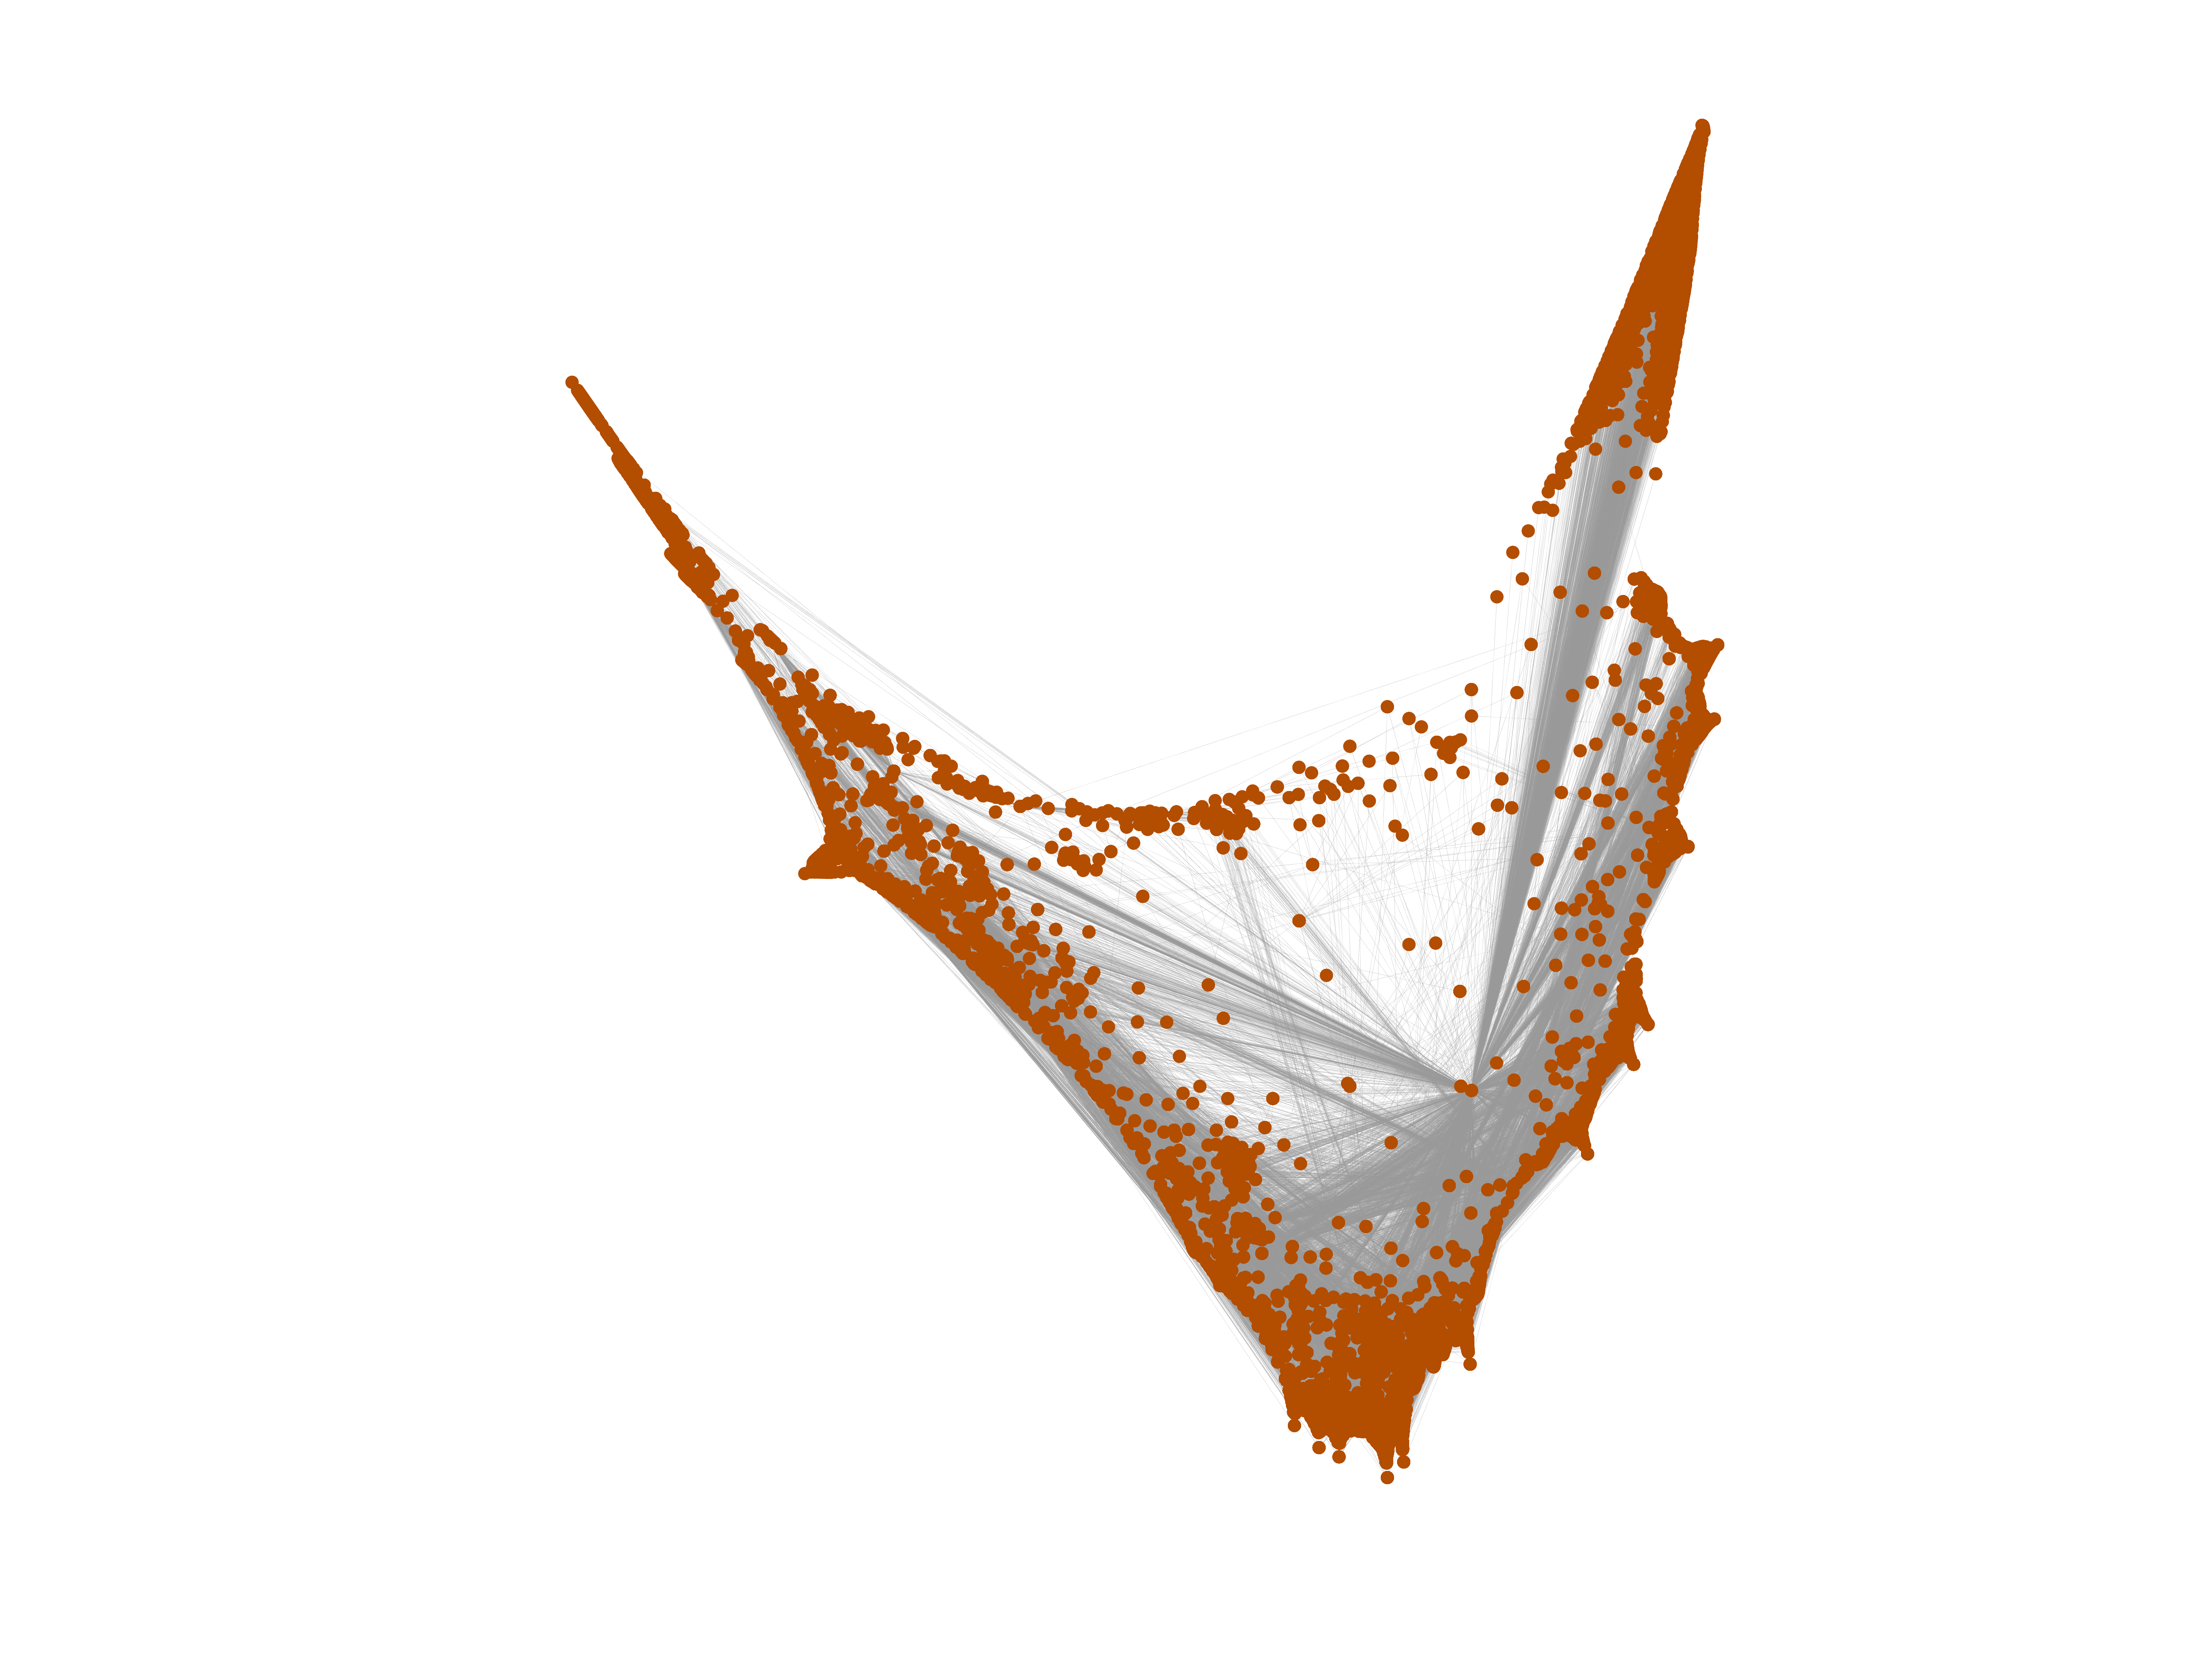
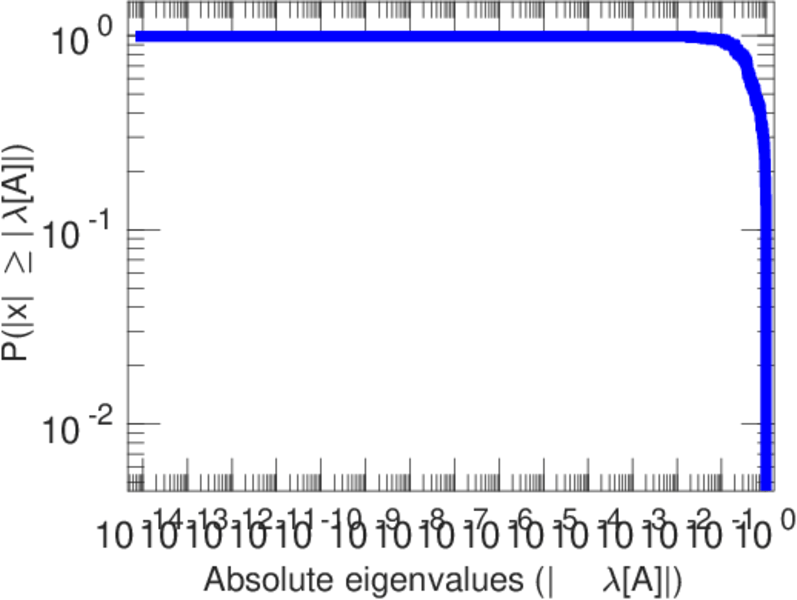
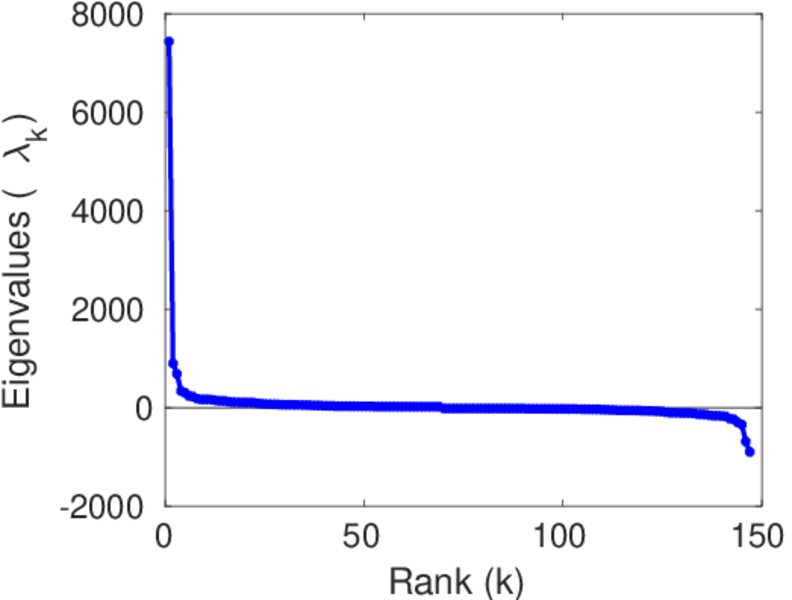
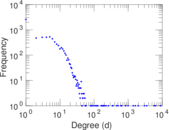
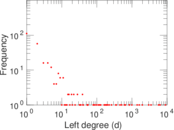
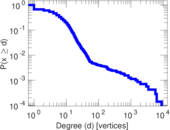
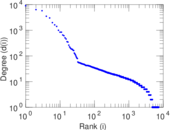
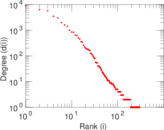
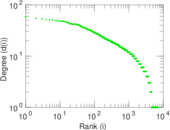
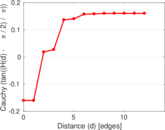
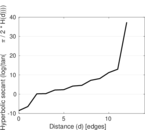
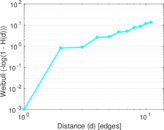
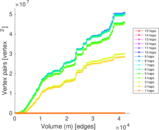
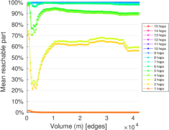
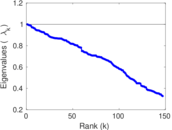
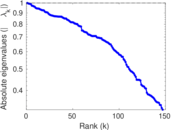
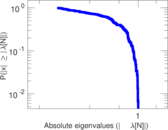
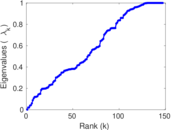
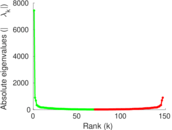
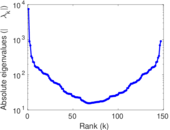
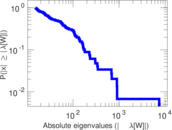
Plots


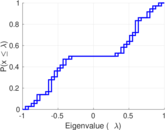

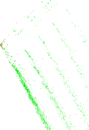
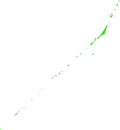
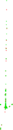


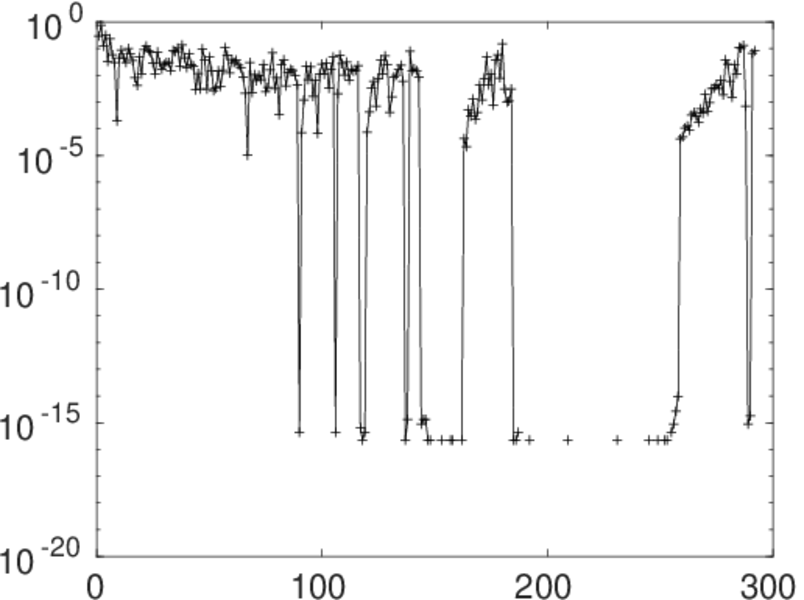
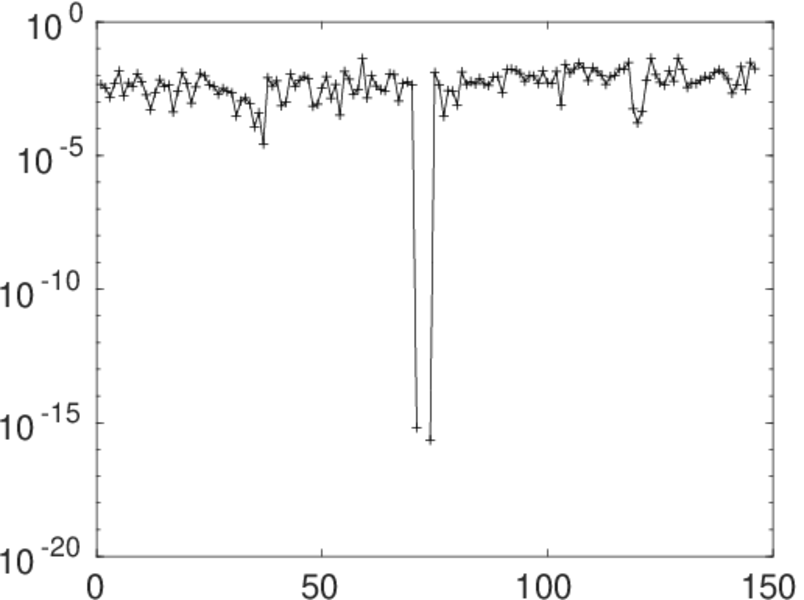
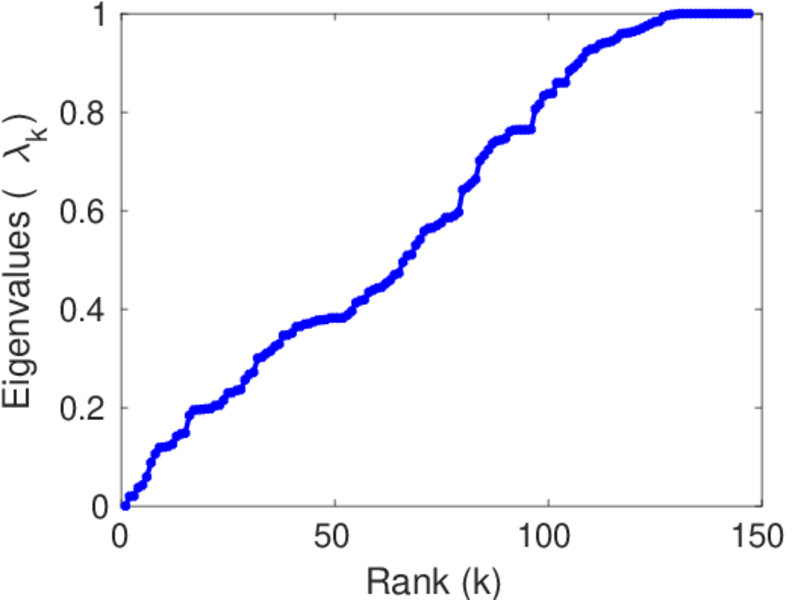
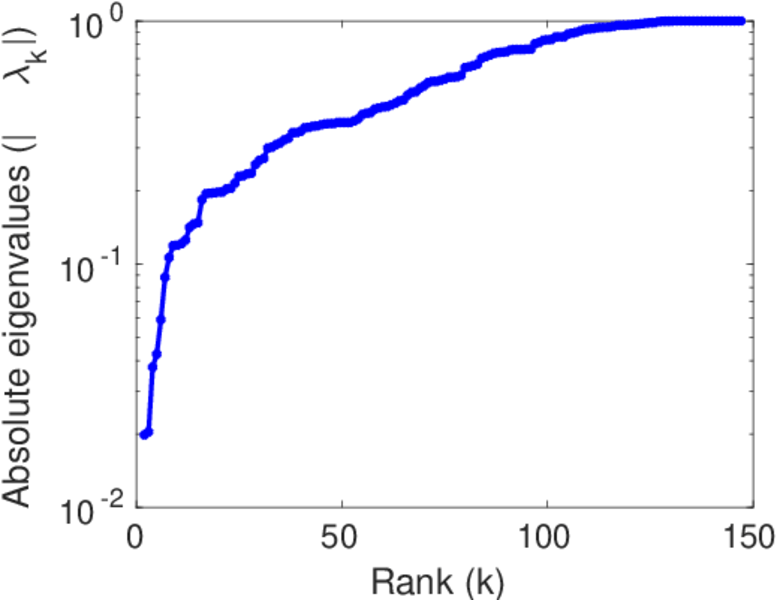
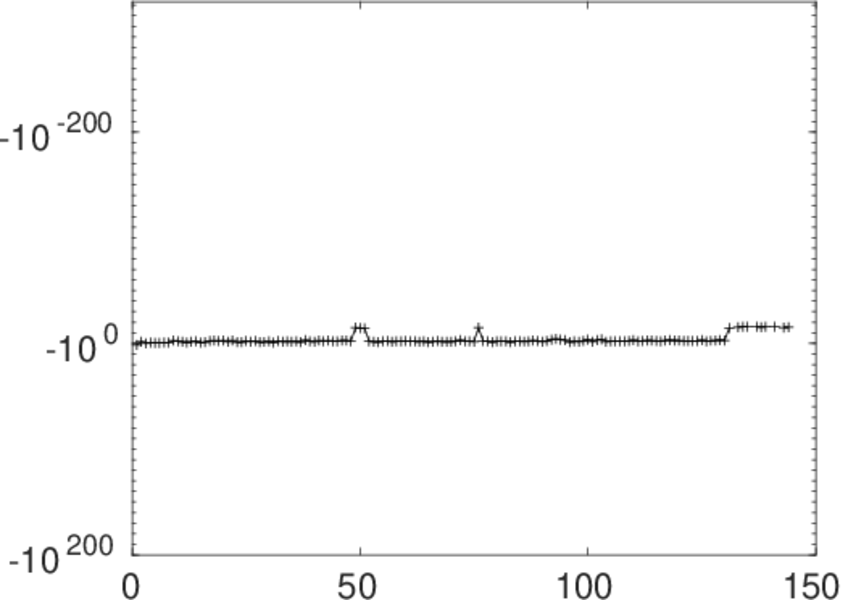
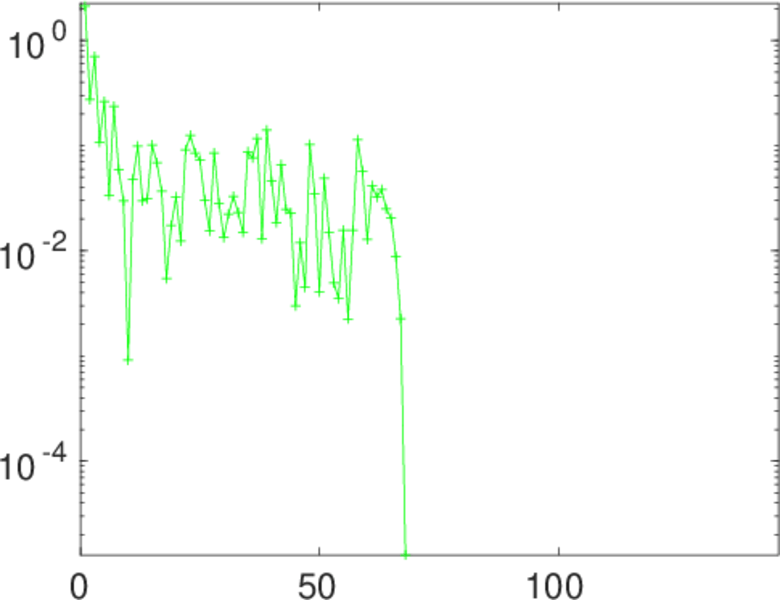
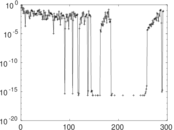
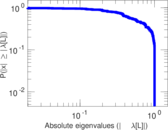
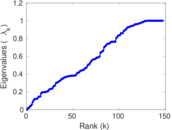
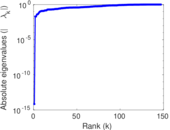
Matrix decompositions plots


Downloads
References
|
[1]
|
Jérôme Kunegis.
KONECT – The Koblenz Network Collection.
In Proc. Int. Conf. on World Wide Web Companion, pages
1343–1350, 2013.
[ http ]
|
|
[2]
|
Wikimedia Foundation.
Wikimedia downloads.
http://dumps.wikimedia.org/, January 2010.
|
 KONECT ‣ Networks ‣
Buy Me a Coffee
KONECT ‣ Networks ‣
Buy Me a Coffee