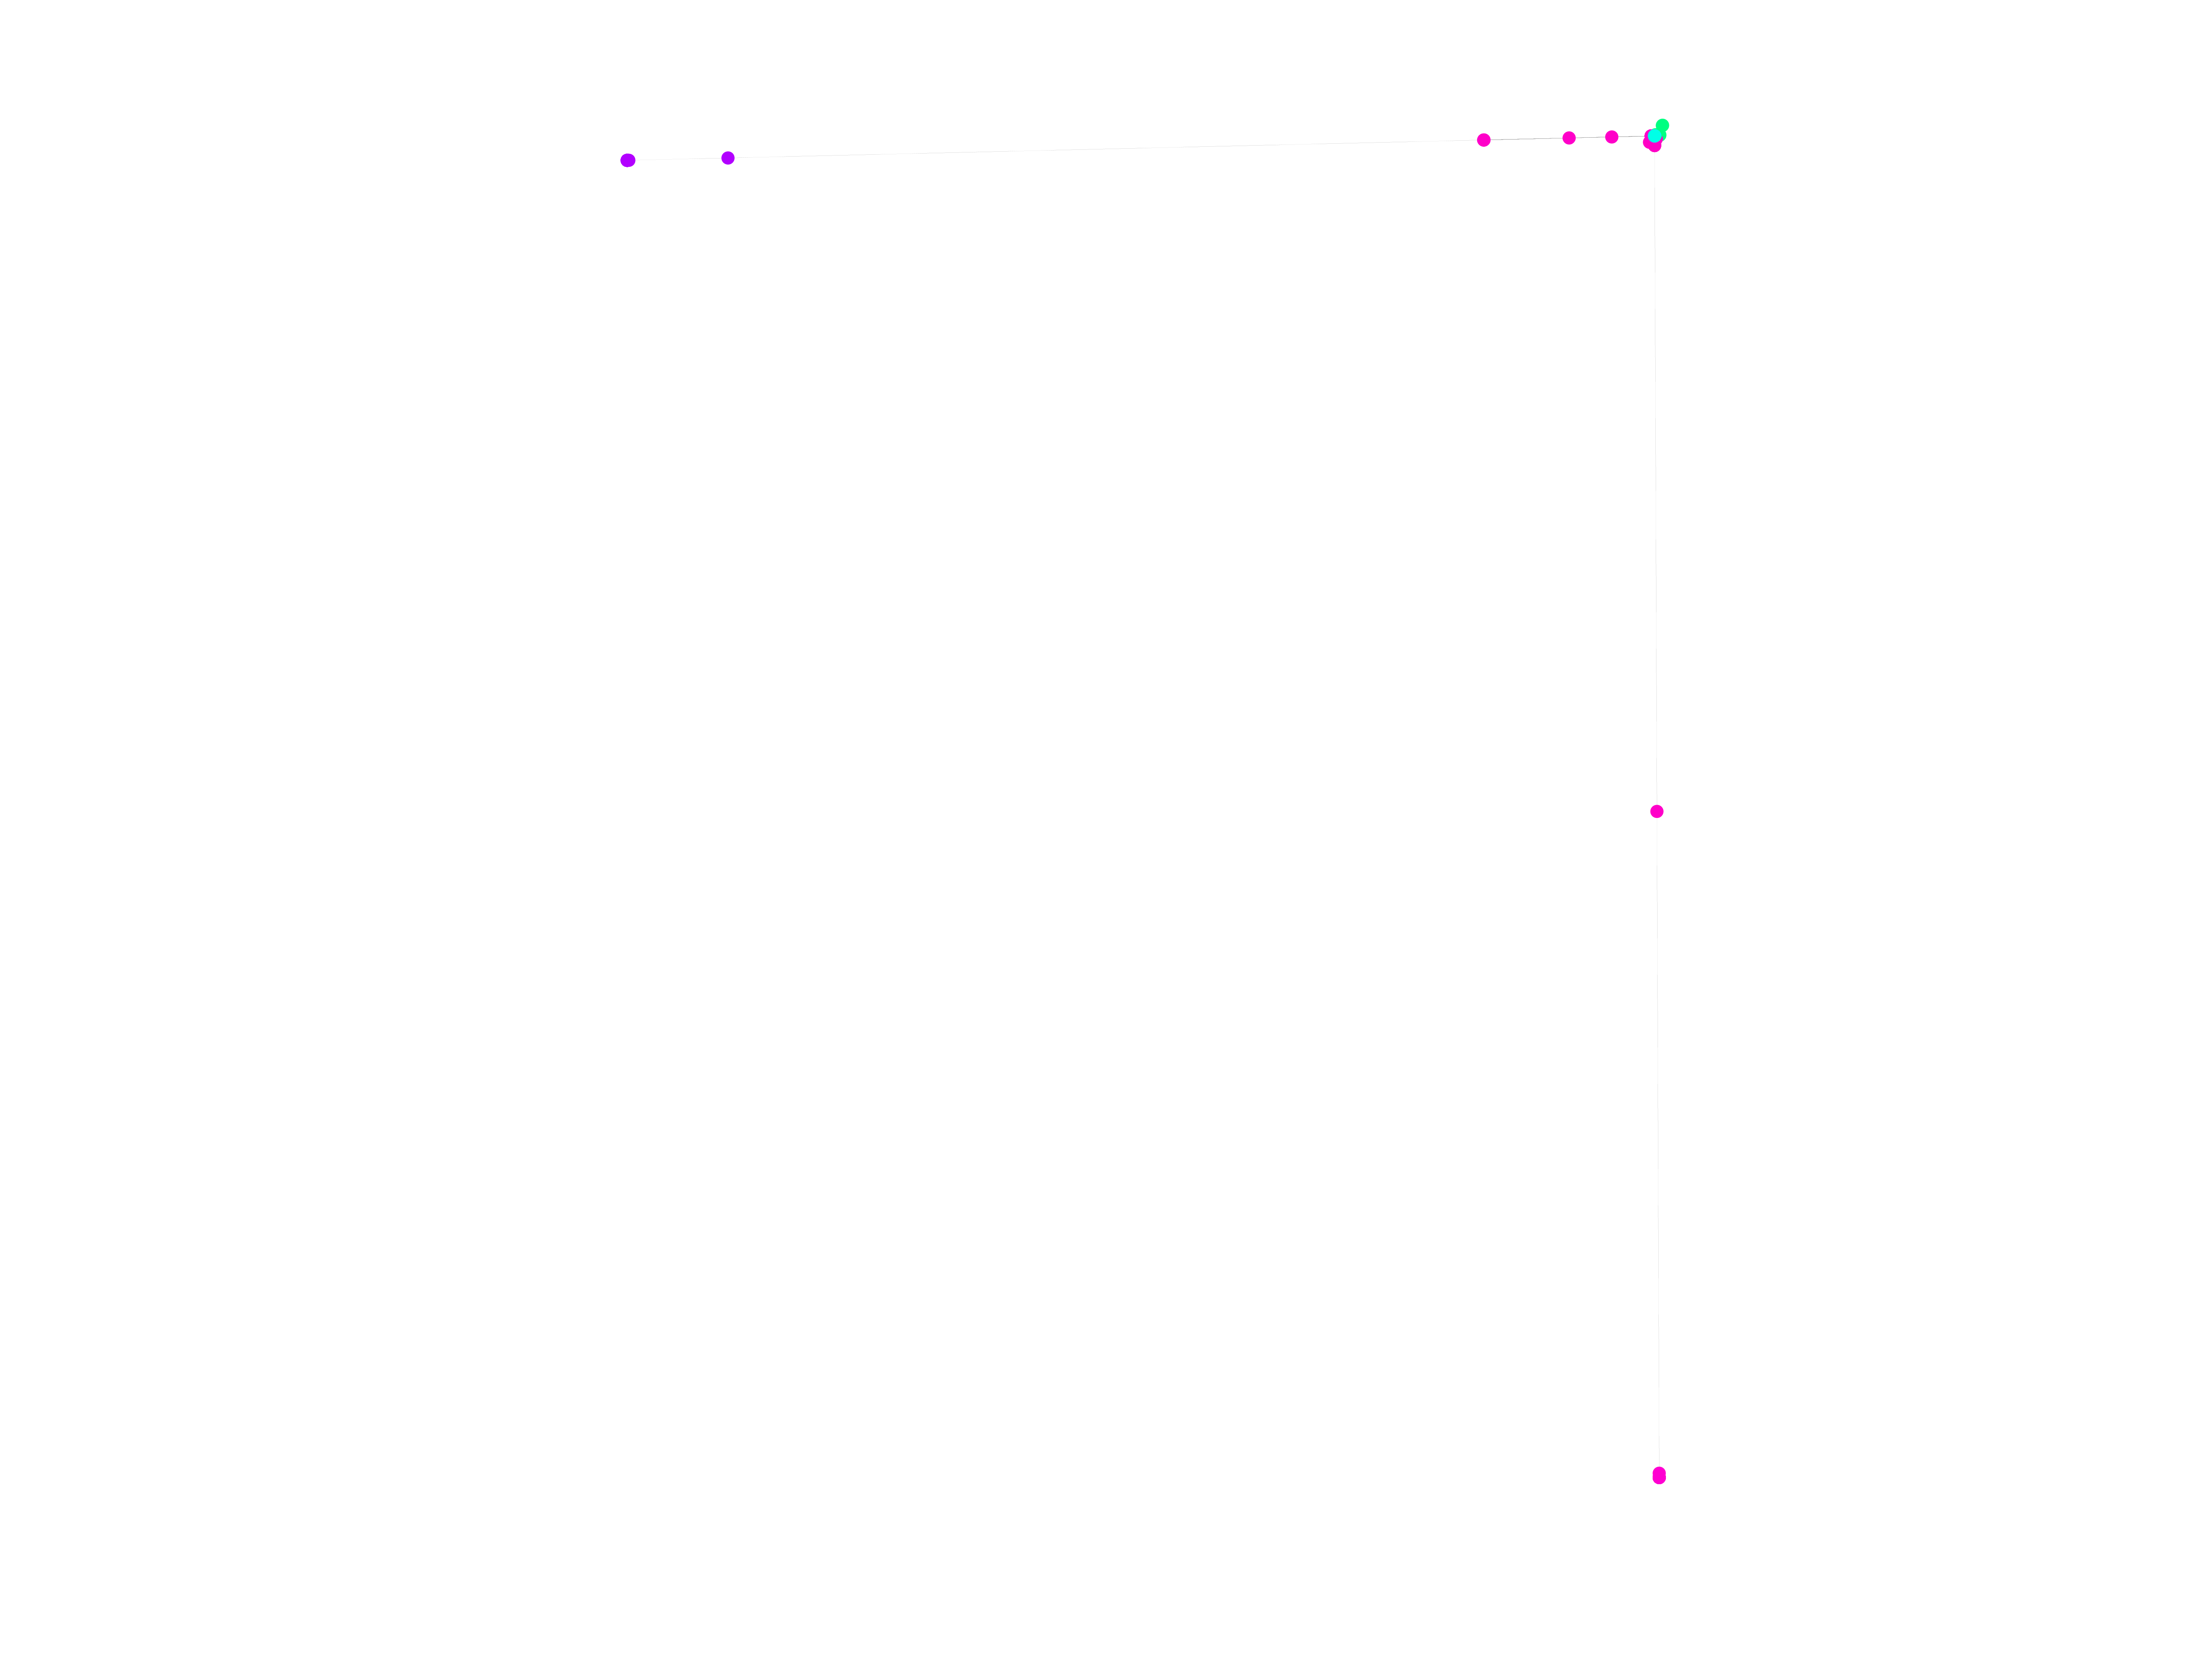
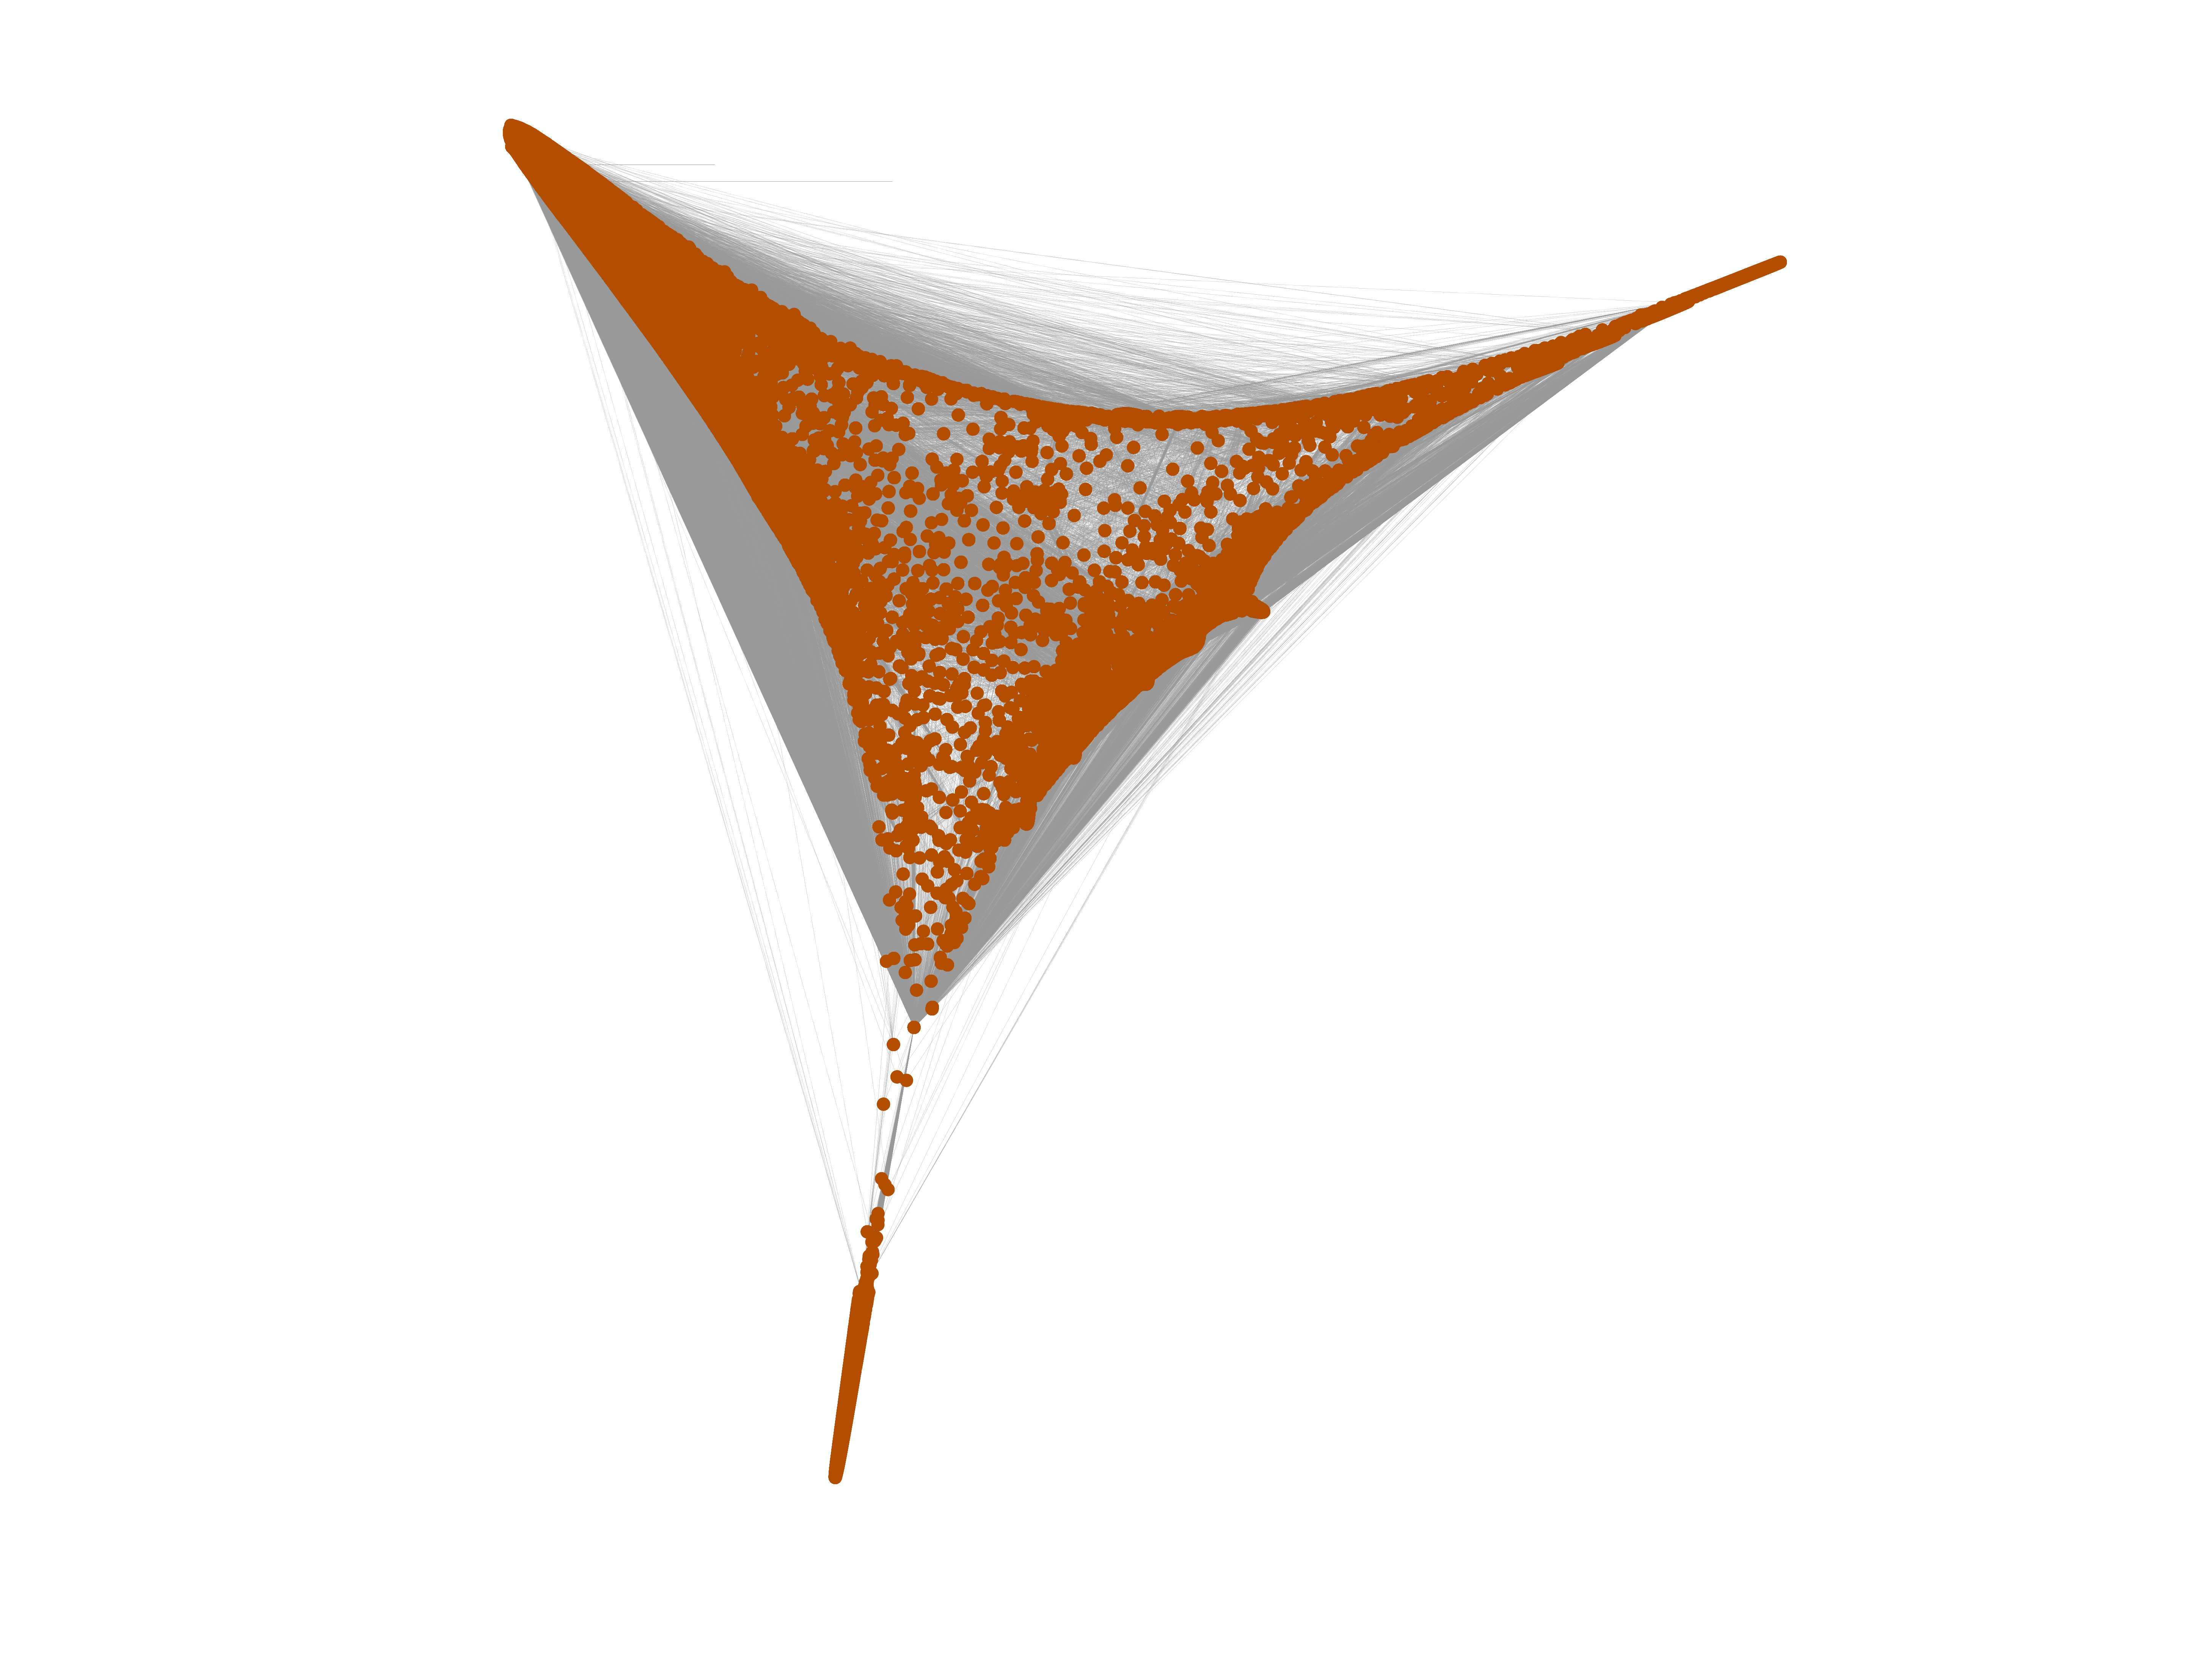
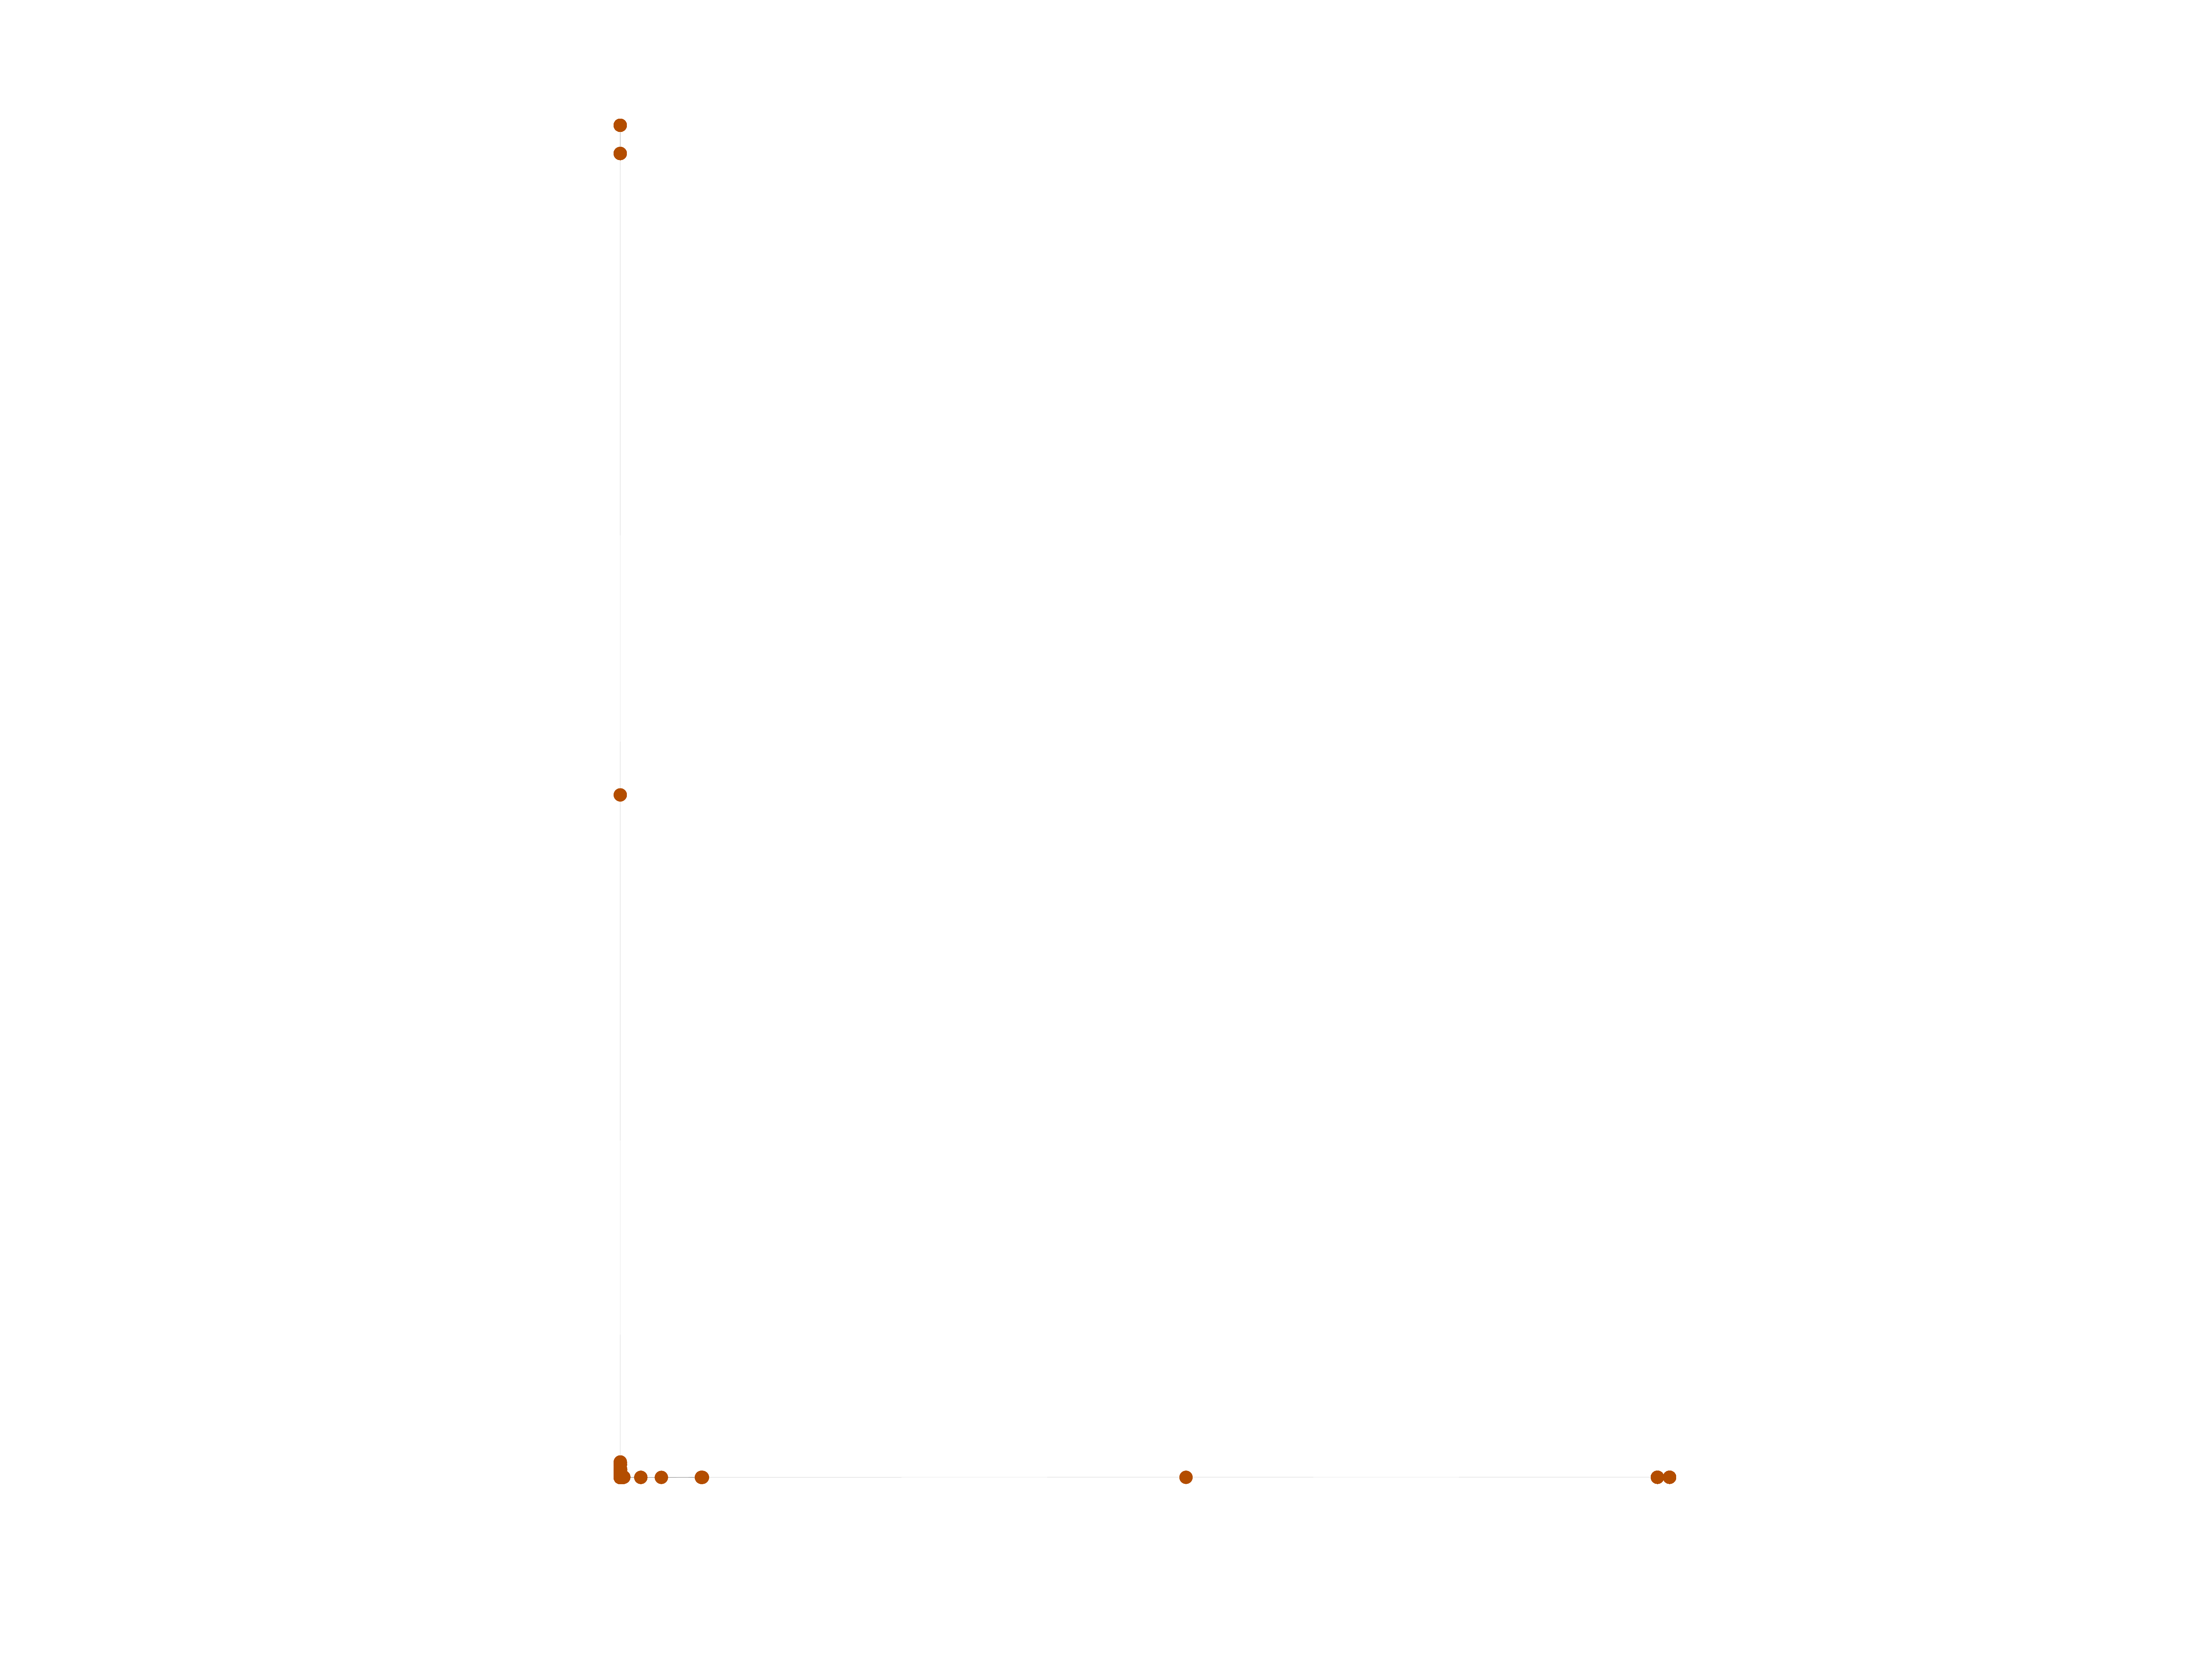
Wikipedia edits (bh)
This is the bipartite edit network of the भोजपुरी Wikipedia. It
contains users and pages from the भोजपुरी Wikipedia, connected by
edit events. Each edge represents an edit. The dataset includes the timestamp
of each edit.
Metadata
Statistics
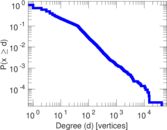
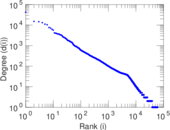
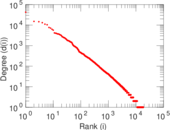
| Size | n = | 61,119
|
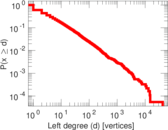
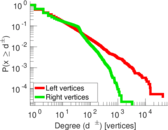
| Left size | n1 = | 18,352
|
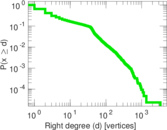
| Right size | n2 = | 42,767
|
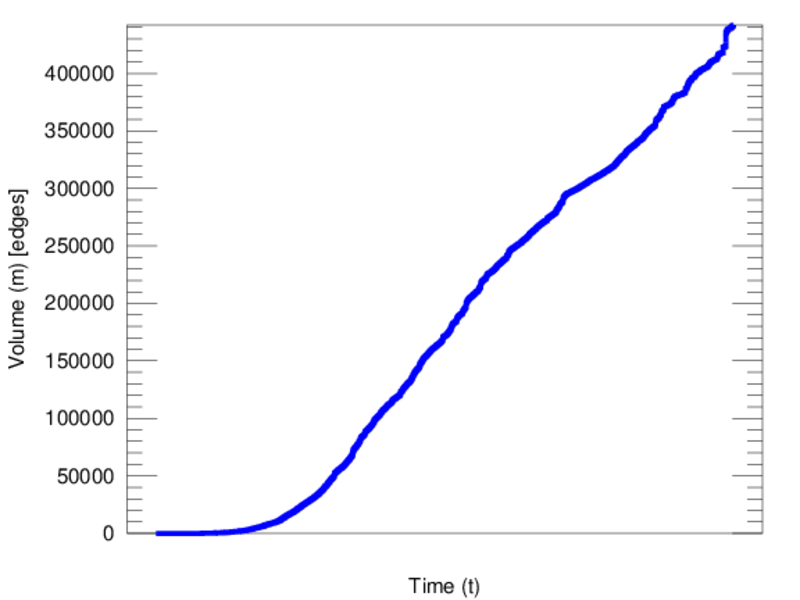
| Volume | m = | 442,118
|
| Unique edge count | m̿ = | 217,454
|
| Wedge count | s = | 526,520,443
|
| Claw count | z = | 3,115,225,981,101
|
| Cross count | x = | 16,811,397,318,416,034
|
| Square count | q = | 387,809,757
|
| 4-Tour count | T4 = | 5,209,034,440
|
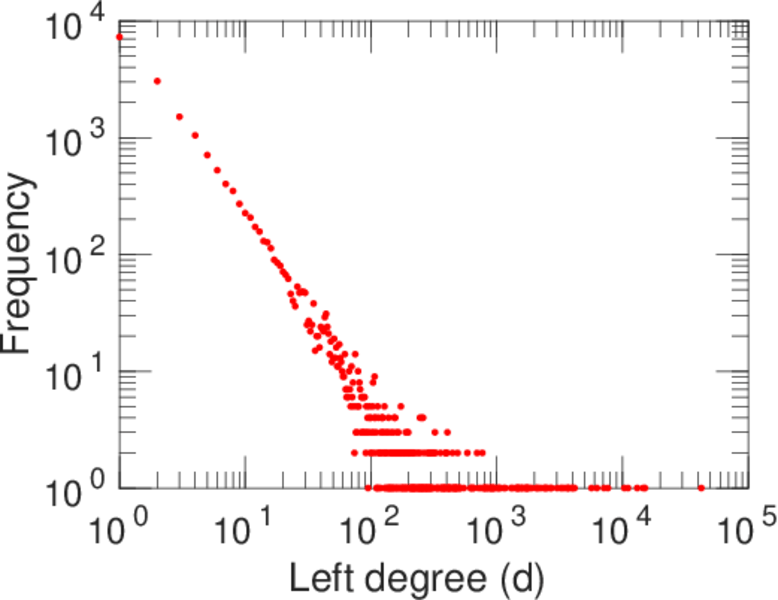
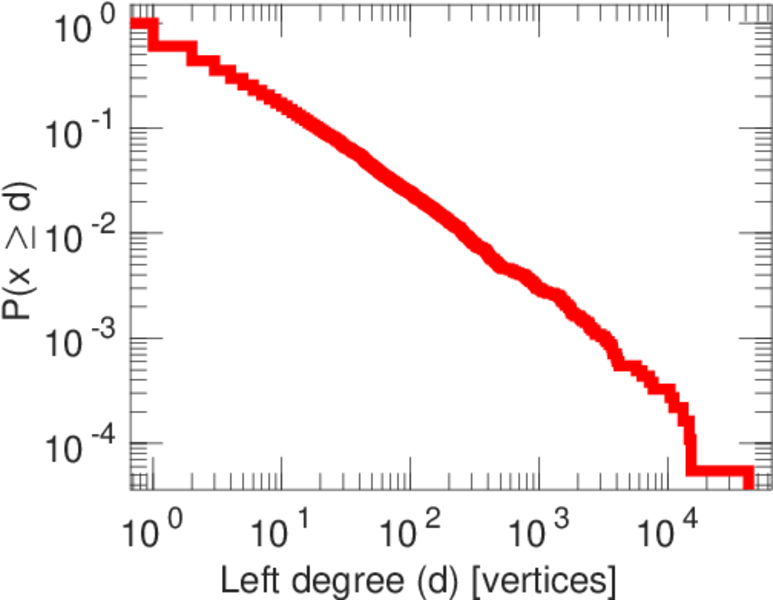
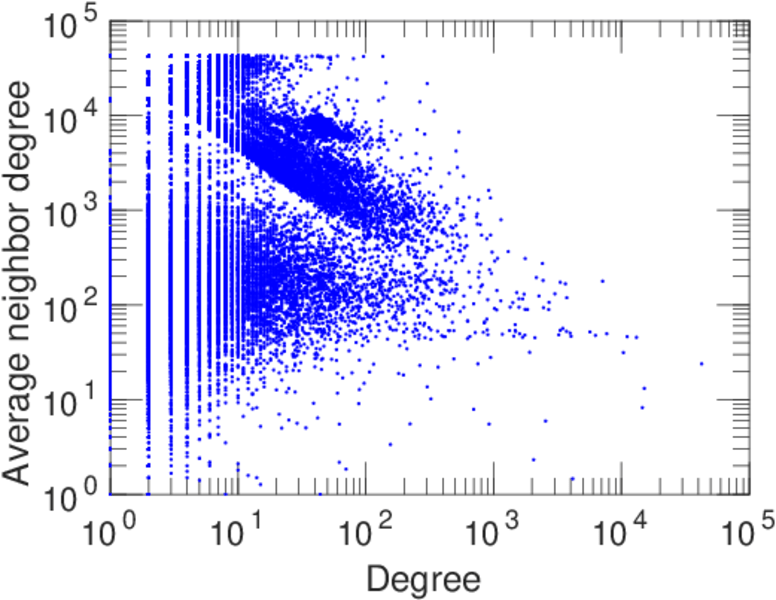
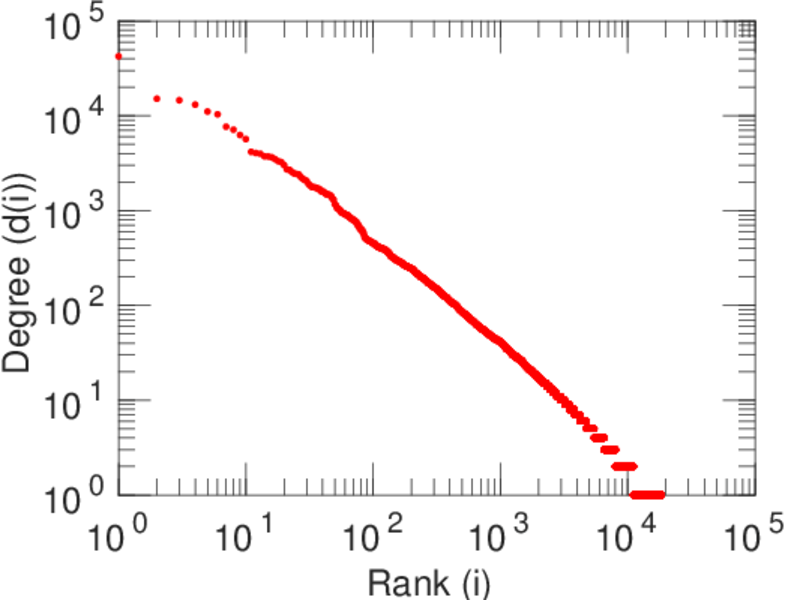
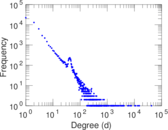
| Maximum degree | dmax = | 42,426
|
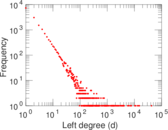
| Maximum left degree | d1max = | 42,426
|
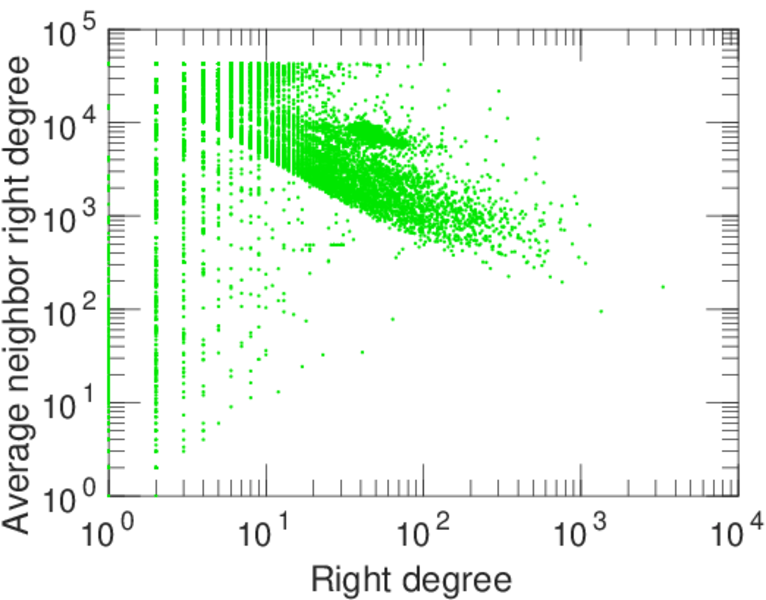
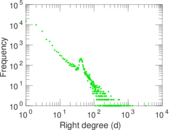
| Maximum right degree | d2max = | 3,329
|
| Average degree | d = | 14.467 4
|
| Average left degree | d1 = | 24.091 0
|
| Average right degree | d2 = | 10.337 8
|
| Fill | p = | 0.000 277 061
|
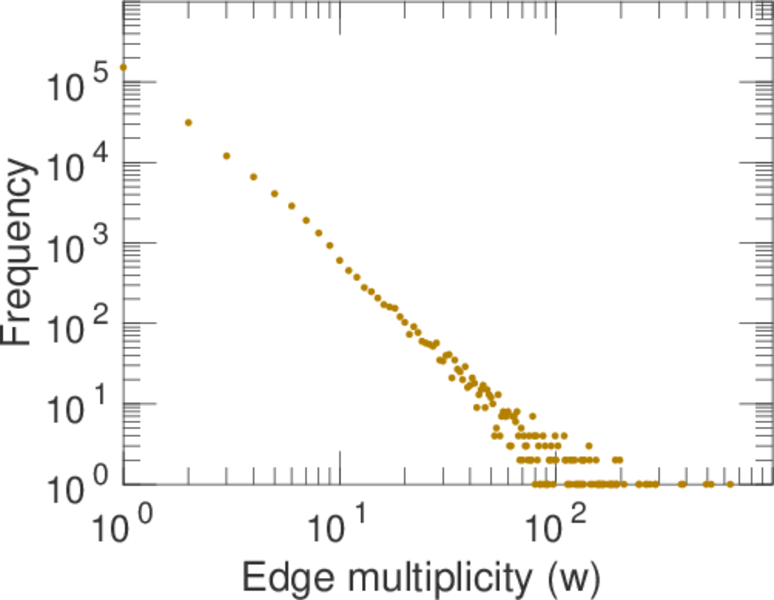
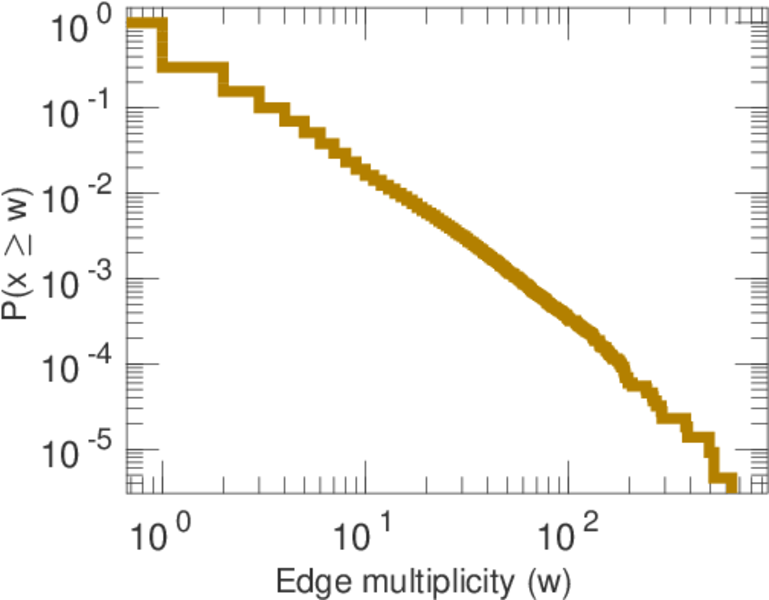
| Average edge multiplicity | m̃ = | 2.033 16
|
| Size of LCC | N = | 60,668
|
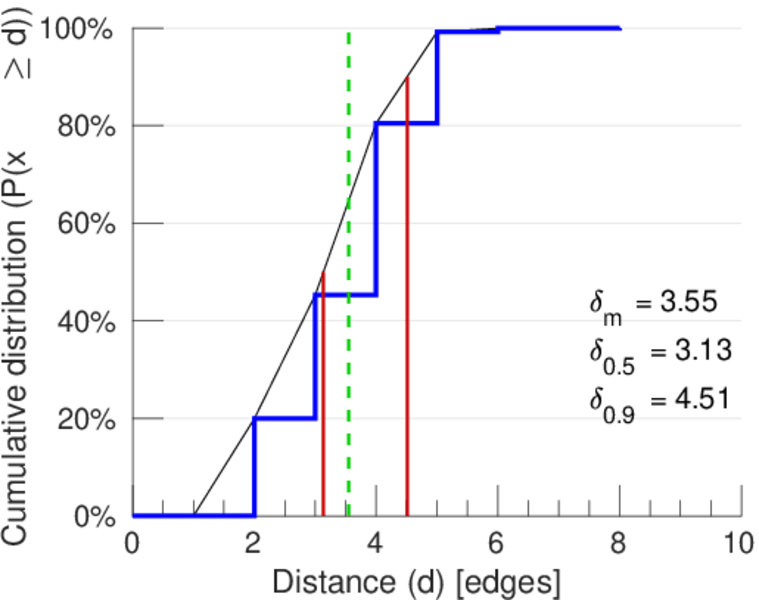
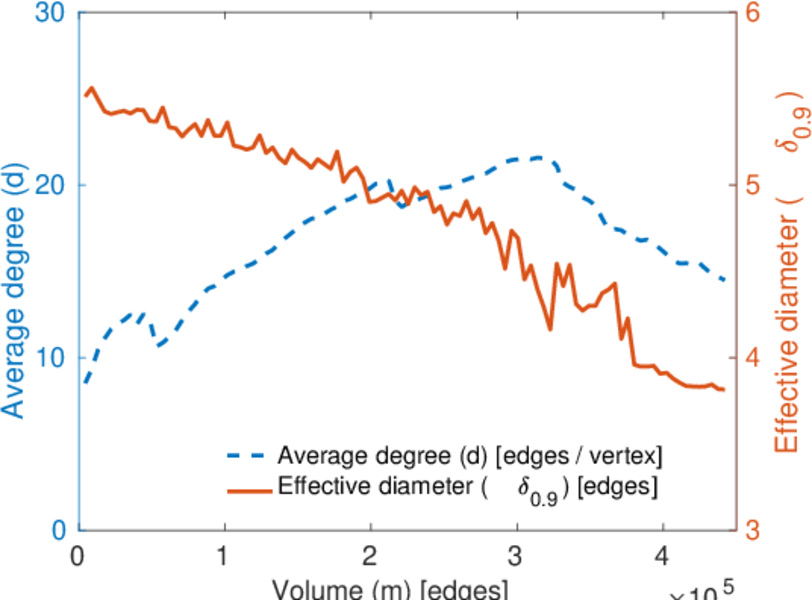
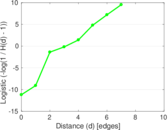
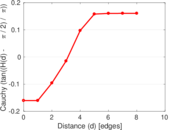
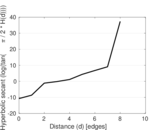
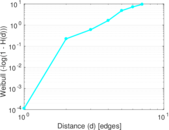
| Diameter | δ = | 10
|
| 50-Percentile effective diameter | δ0.5 = | 3.134 43
|
| 90-Percentile effective diameter | δ0.9 = | 4.509 83
|
| Median distance | δM = | 4
|
| Mean distance | δm = | 3.552 16
|
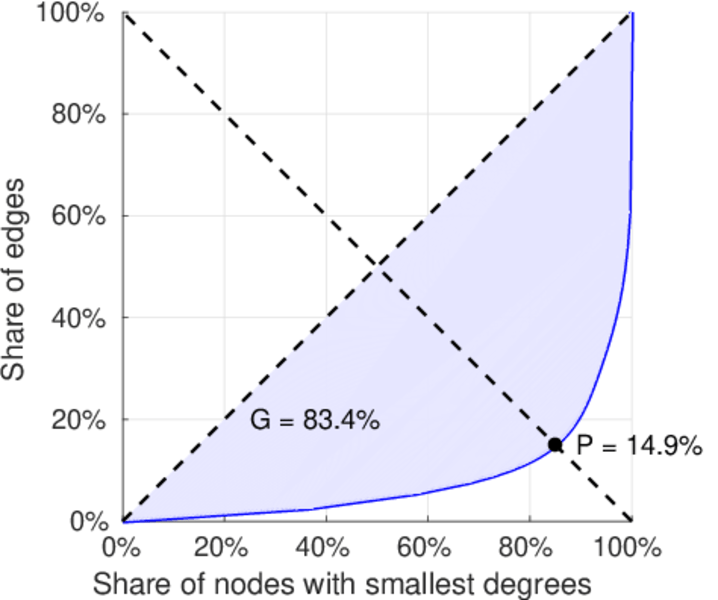
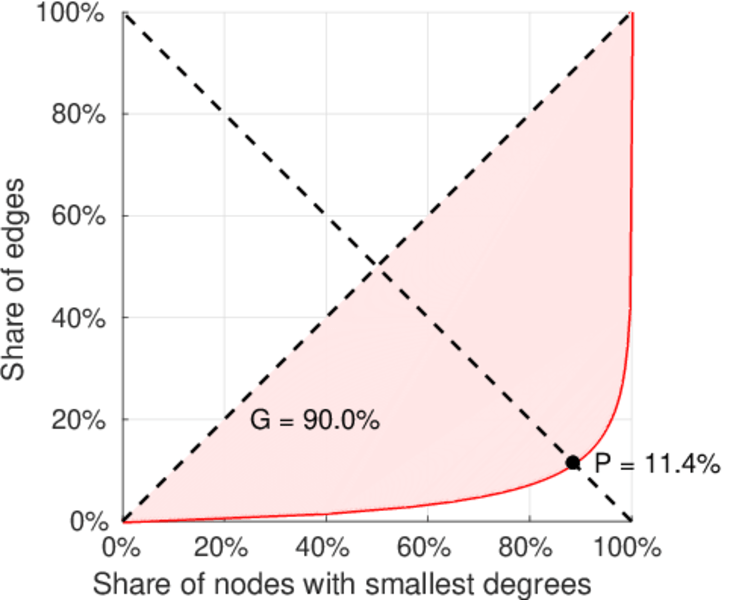
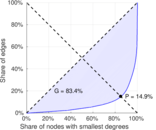
| Gini coefficient | G = | 0.827 951
|
| Balanced inequality ratio | P = | 0.157 175
|
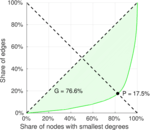
| Left balanced inequality ratio | P1 = | 0.113 653
|
| Right balanced inequality ratio | P2 = | 0.174 822
|
| Relative edge distribution entropy | Her = | 0.786 672
|
| Power law exponent | γ = | 2.268 21
|
| Tail power law exponent | γt = | 2.321 00
|
| Tail power law exponent with p | γ3 = | 2.321 00
|
| p-value | p = | 0.187 000
|
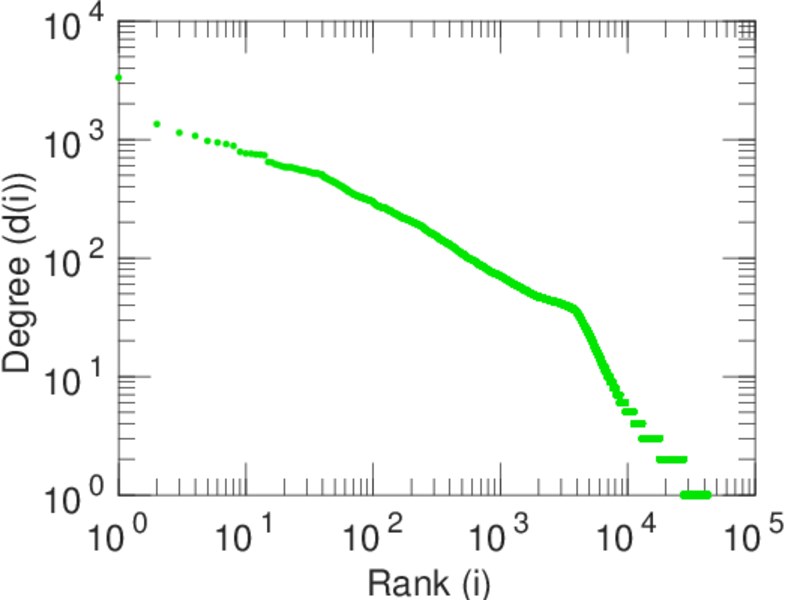
| Left tail power law exponent with p | γ3,1 = | 1.921 00
|
| Left p-value | p1 = | 0.901 000
|
| Right tail power law exponent with p | γ3,2 = | 3.271 00
|
| Right p-value | p2 = | 0.297 000
|
| Degree assortativity | ρ = | −0.251 078
|
| Degree assortativity p-value | pρ = | 0.000 00
|
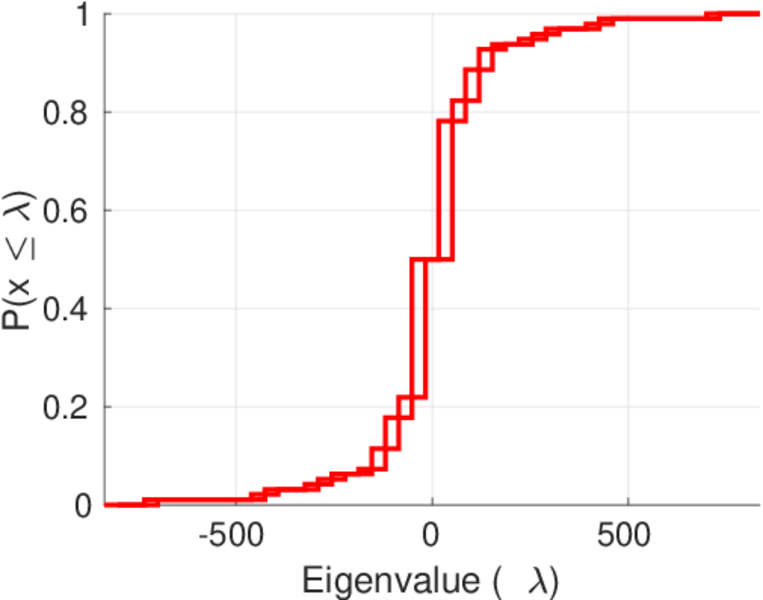
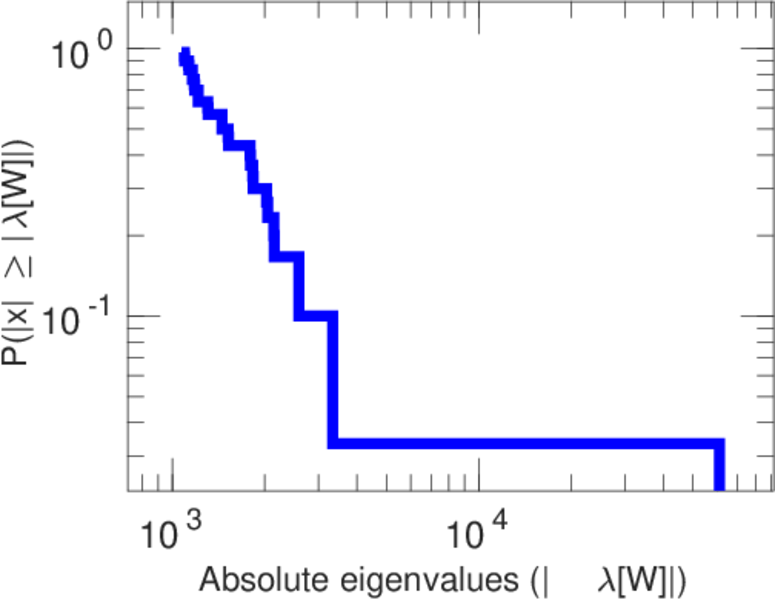
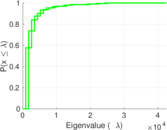
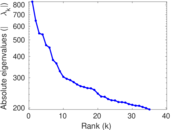
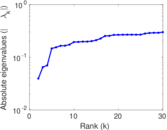
| Spectral norm | α = | 835.705
|
| Algebraic connectivity | a = | 0.039 390 1
|
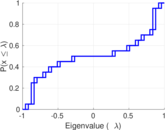
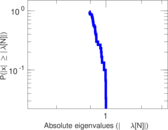
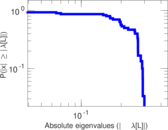
| Spectral separation | |λ1[A] / λ2[A]| = | 1.291 48
|
| Controllability | C = | 50,222
|
| Relative controllability | Cr = | 0.822 260
|
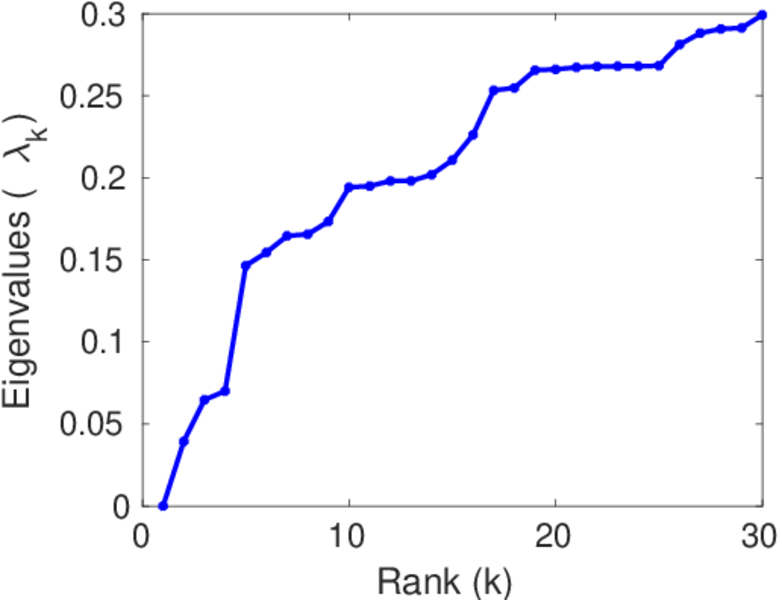
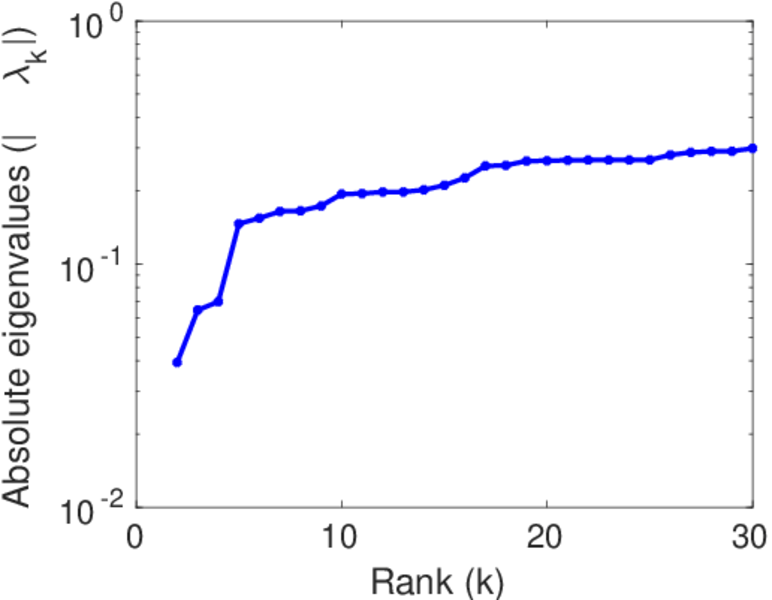
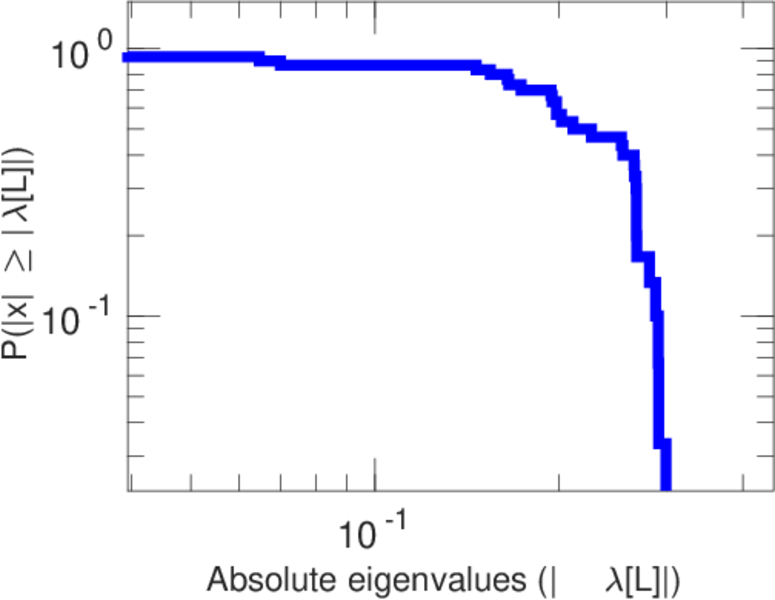
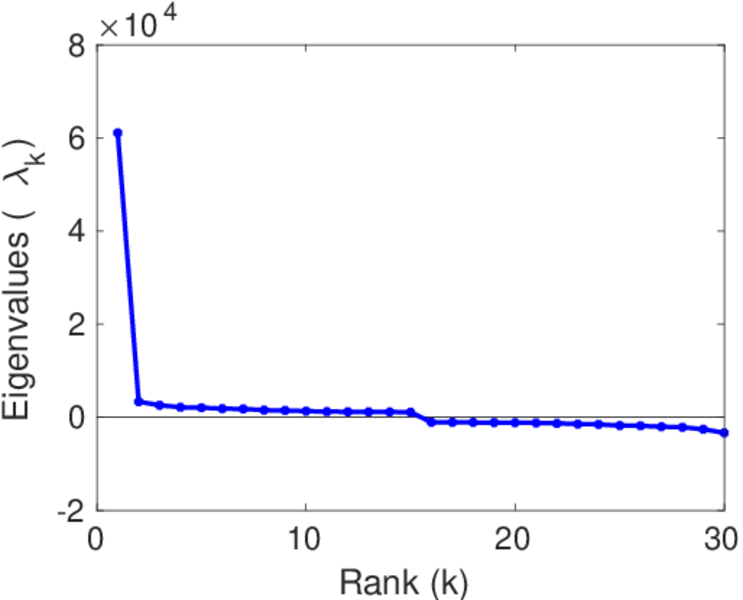
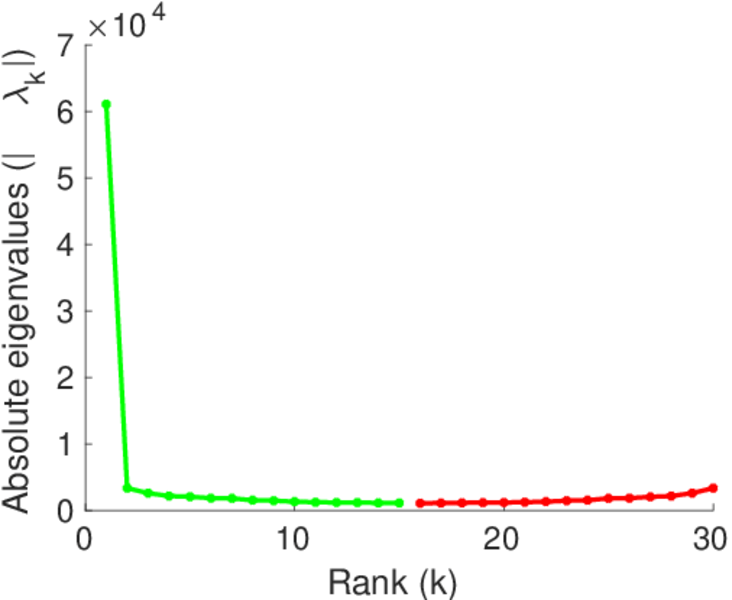
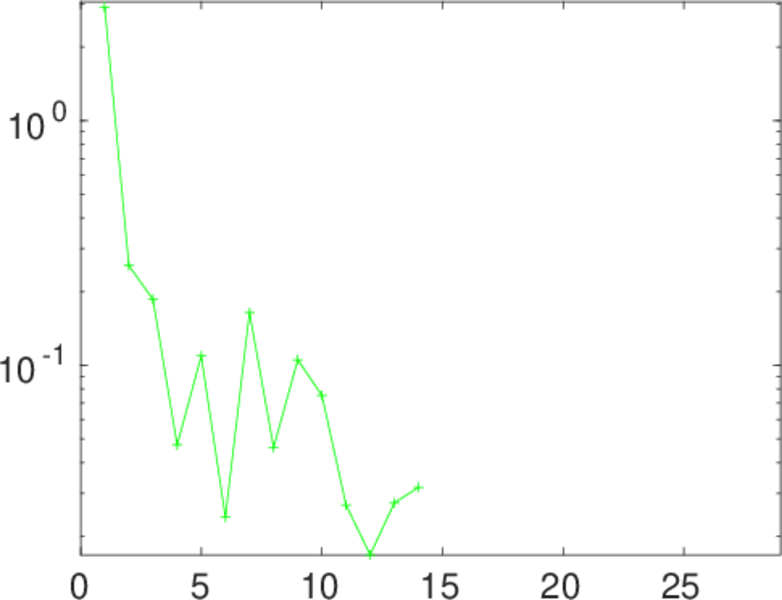
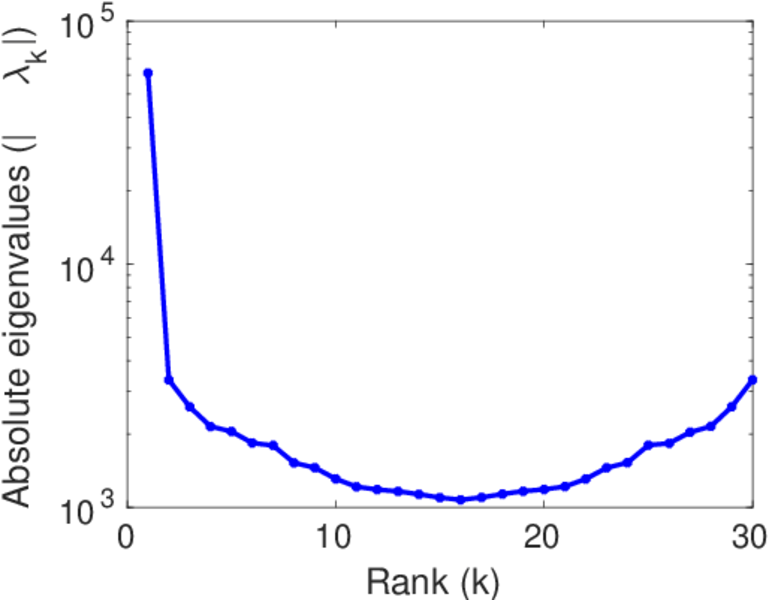
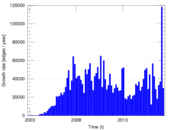
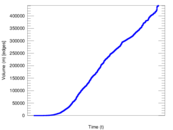
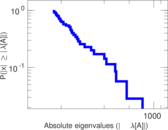
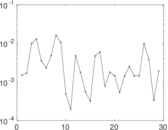
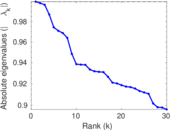
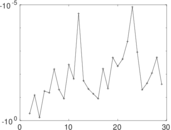
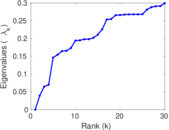
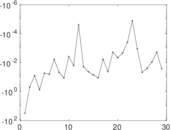
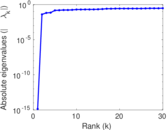
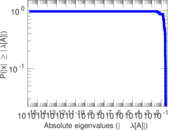
Plots


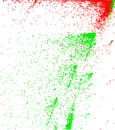
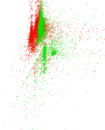
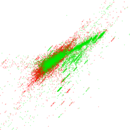


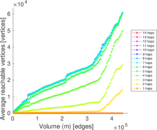


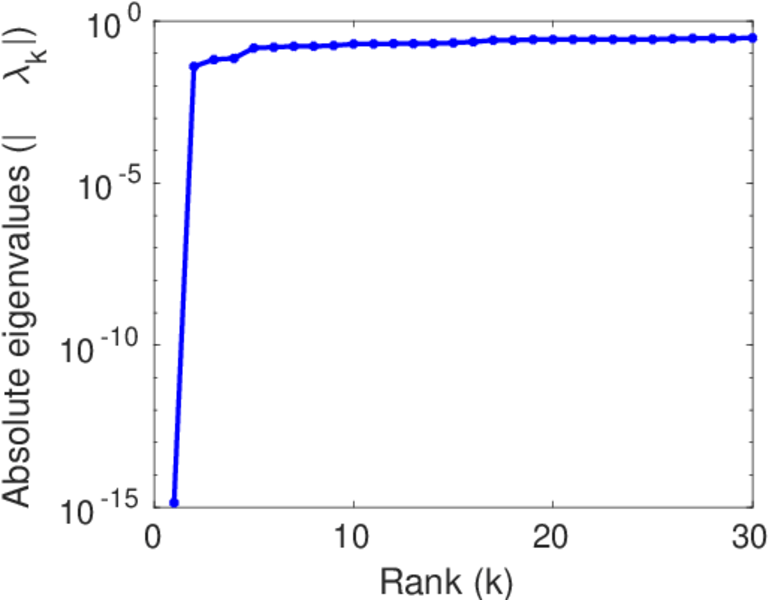
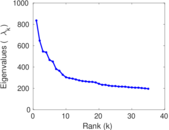
Matrix decompositions plots


Downloads
References
|
[1]
|
Jérôme Kunegis.
KONECT – The Koblenz Network Collection.
In Proc. Int. Conf. on World Wide Web Companion, pages
1343–1350, 2013.
[ http ]
|
|
[2]
|
Wikimedia Foundation.
Wikimedia downloads.
http://dumps.wikimedia.org/, January 2010.
|
 KONECT ‣ Networks ‣
Buy Me a Coffee
KONECT ‣ Networks ‣
Buy Me a Coffee