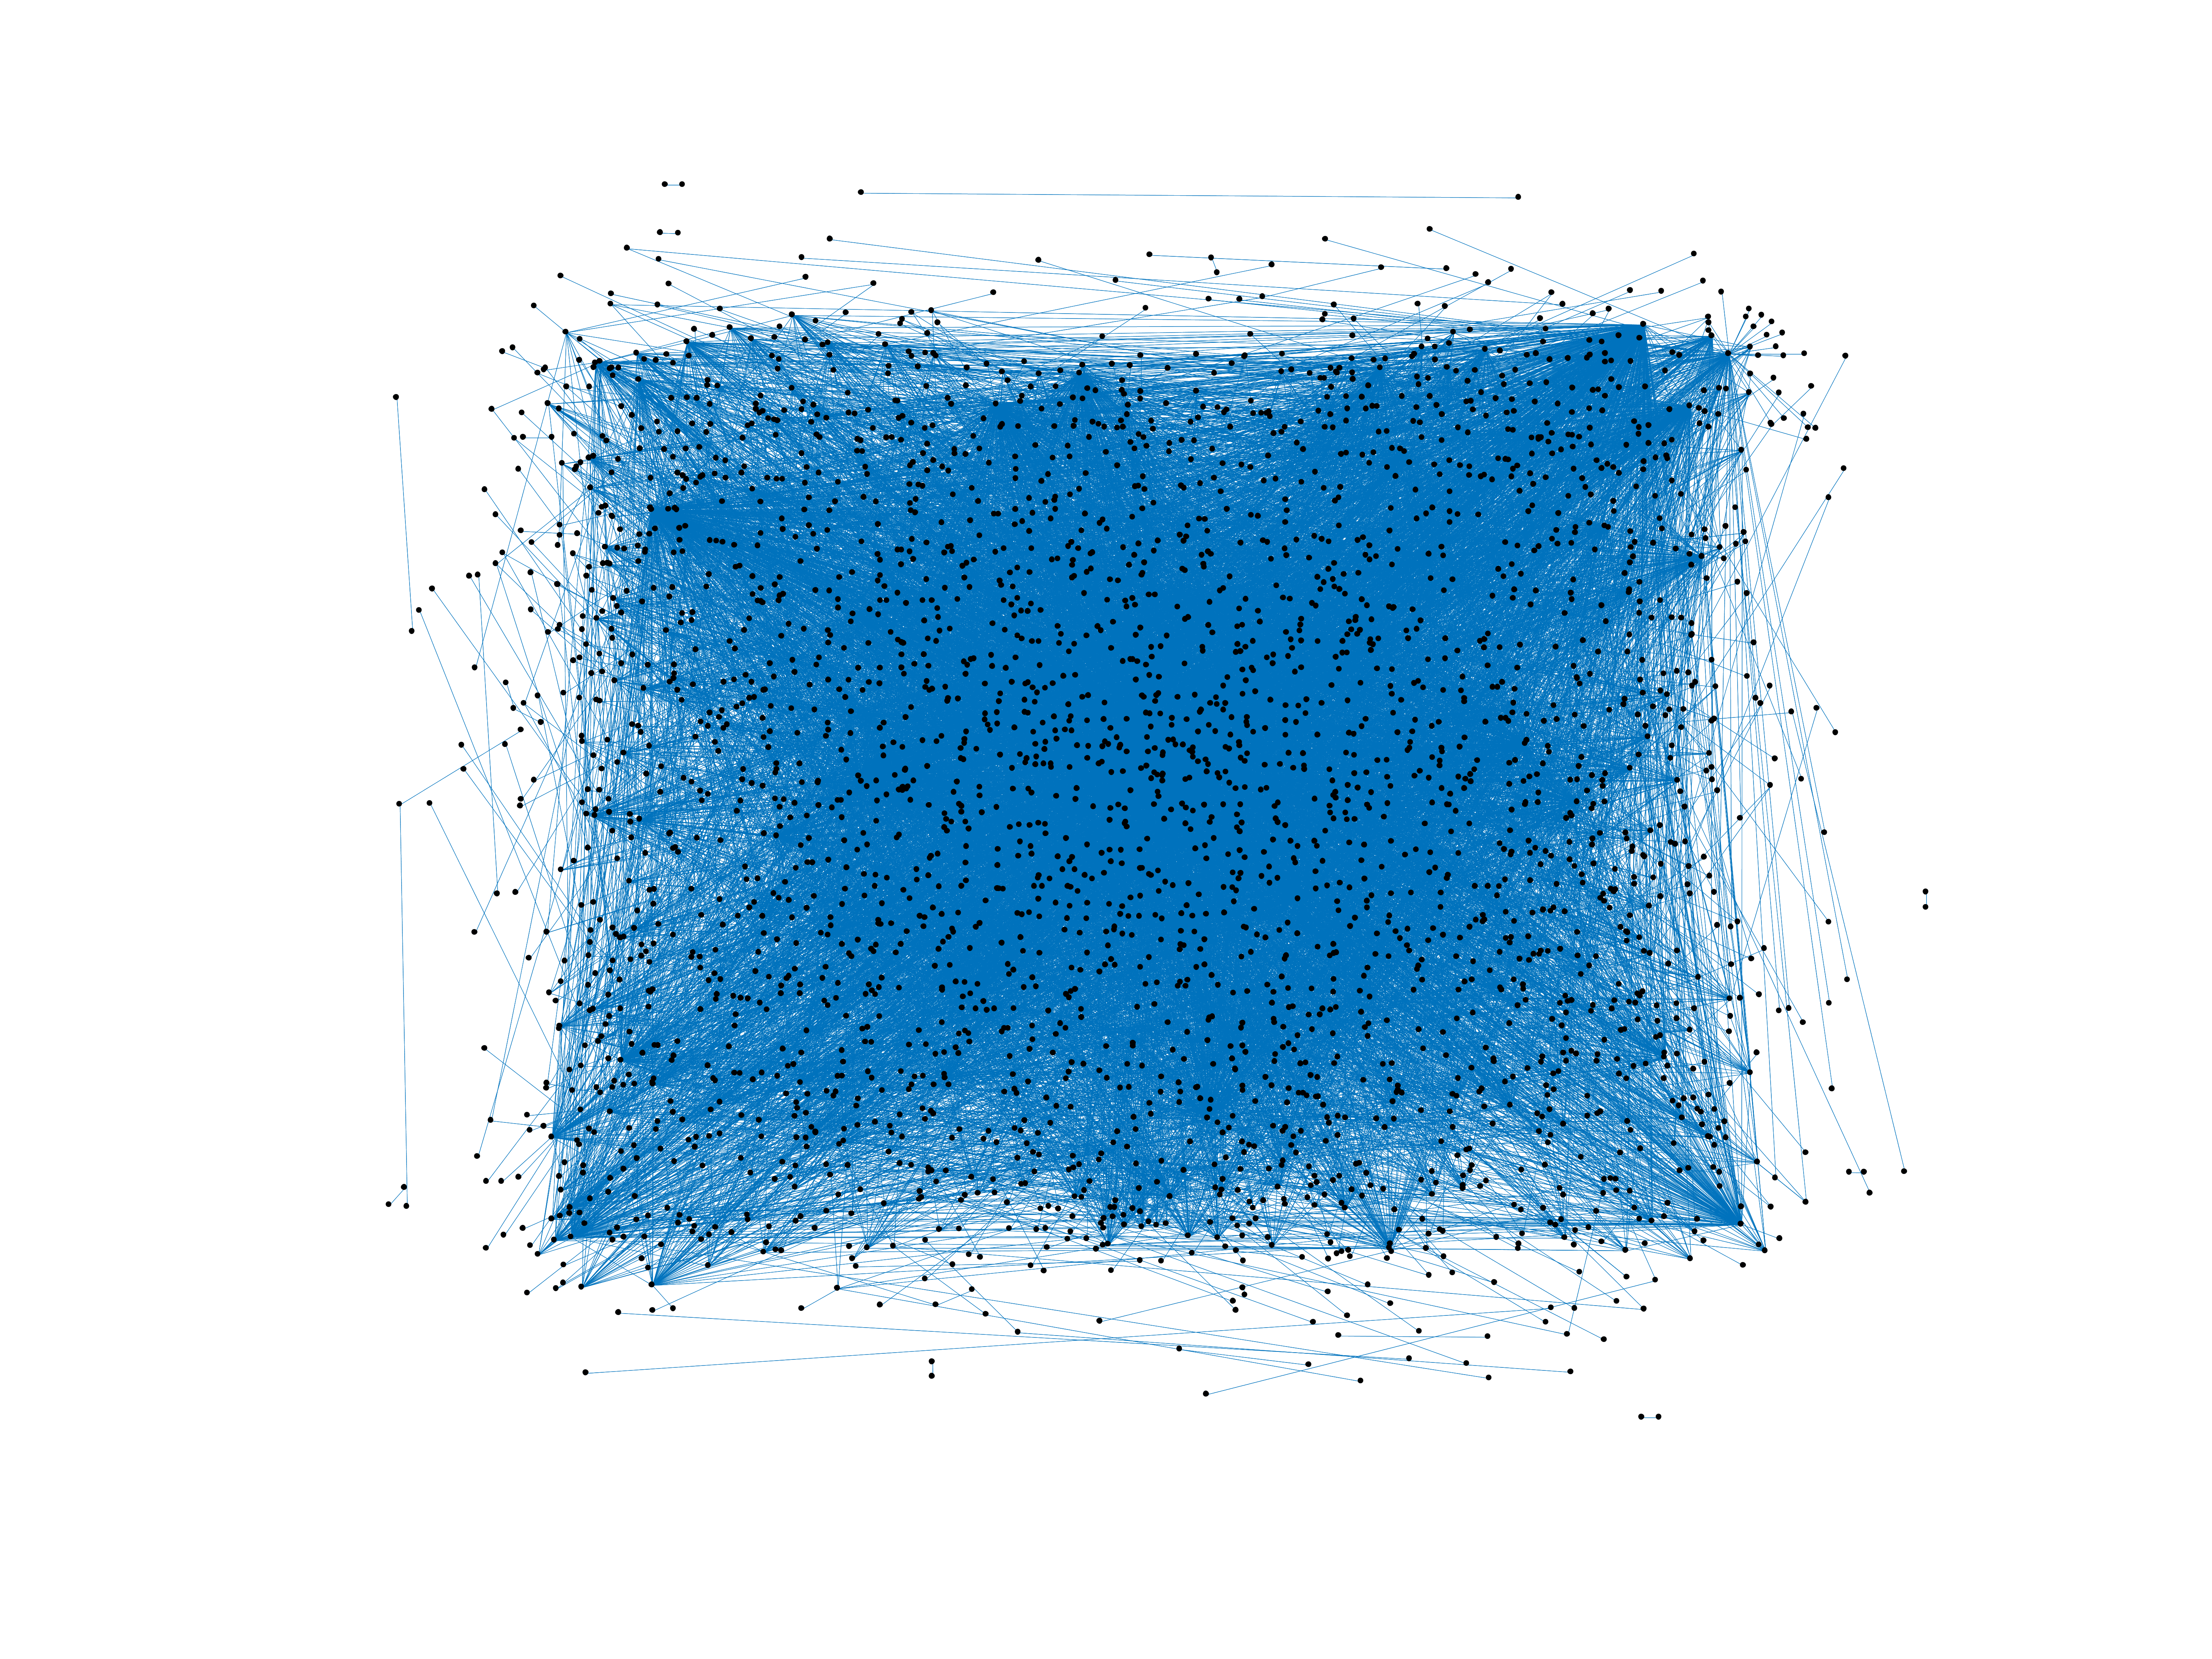
Wikipedia edits (bi)
This is the bipartite edit network of the Bislama Wikipedia. It contains users
and pages from the Bislama Wikipedia, connected by edit events. Each edge
represents an edit. The dataset includes the timestamp of each edit.
Metadata
Statistics
| Size | n = | 3,646
|
| Left size | n1 = | 863
|
| Right size | n2 = | 2,783
|
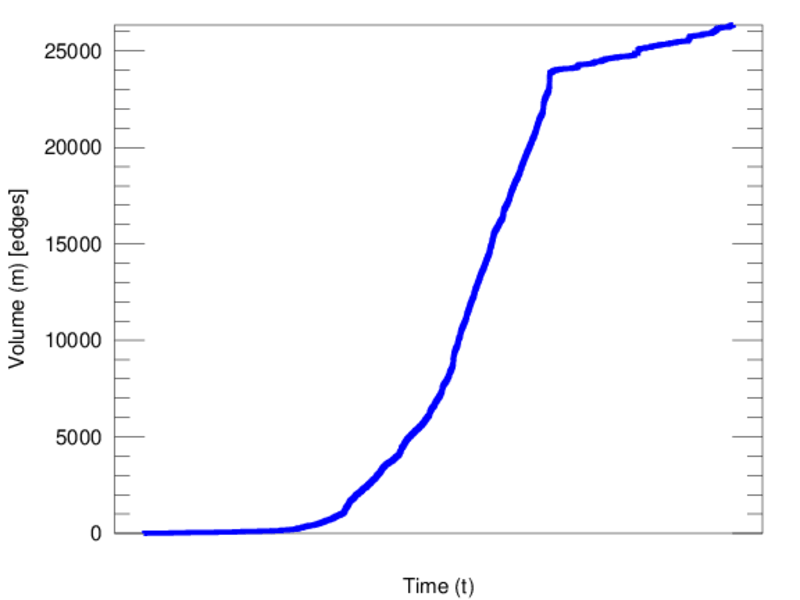
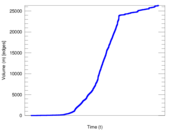
| Volume | m = | 26,344
|
| Unique edge count | m̿ = | 11,802
|
| Wedge count | s = | 1,103,350
|
| Claw count | z = | 98,626,090
|
| Cross count | x = | 8,899,005,539
|
| Square count | q = | 3,848,582
|
| 4-Tour count | T4 = | 35,231,096
|
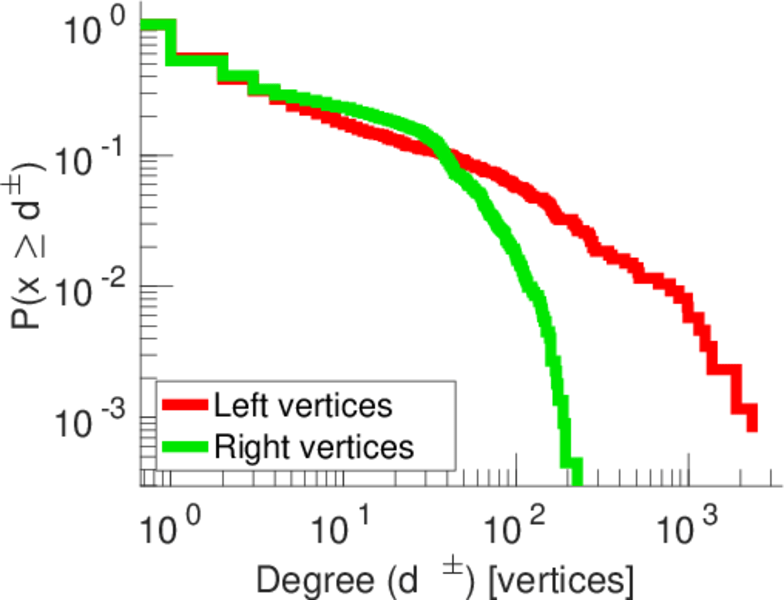
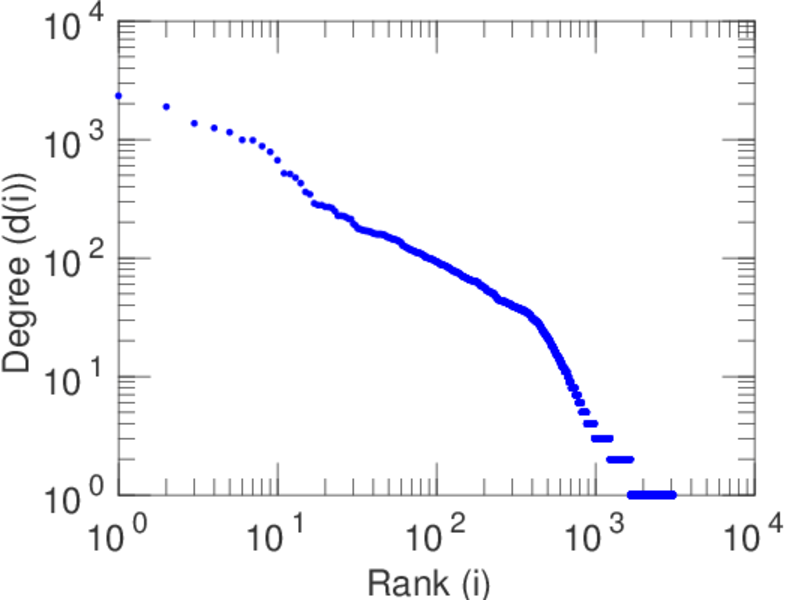
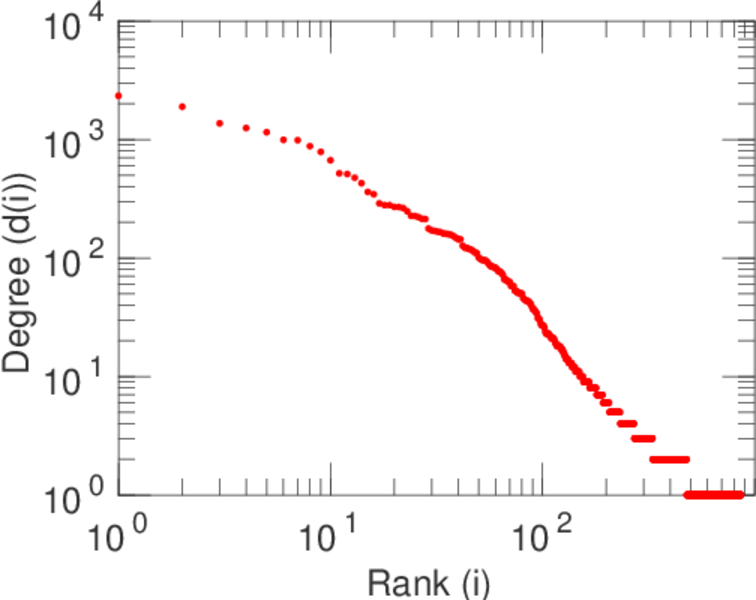
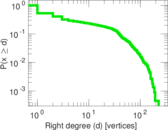
| Maximum degree | dmax = | 2,337
|
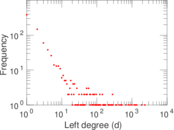
| Maximum left degree | d1max = | 2,337
|
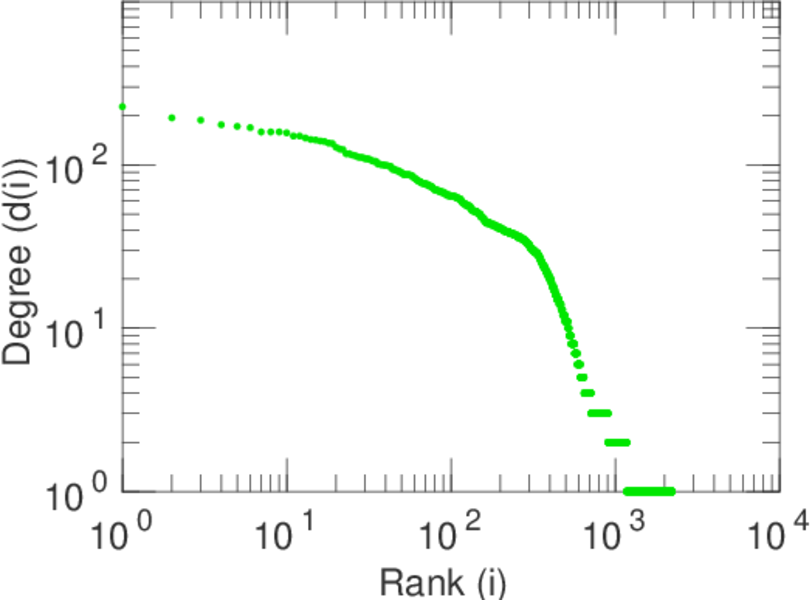
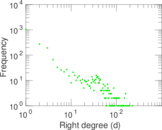
| Maximum right degree | d2max = | 227
|
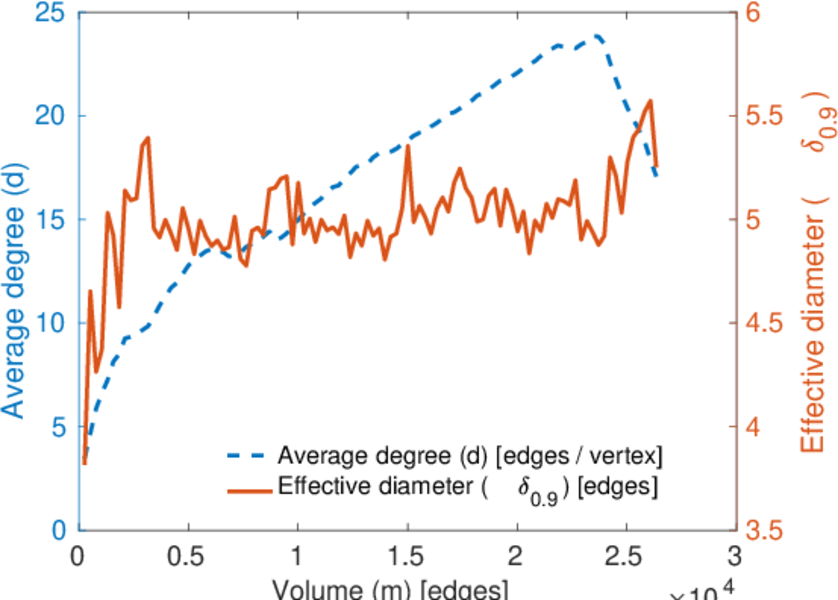
| Average degree | d = | 14.450 9
|
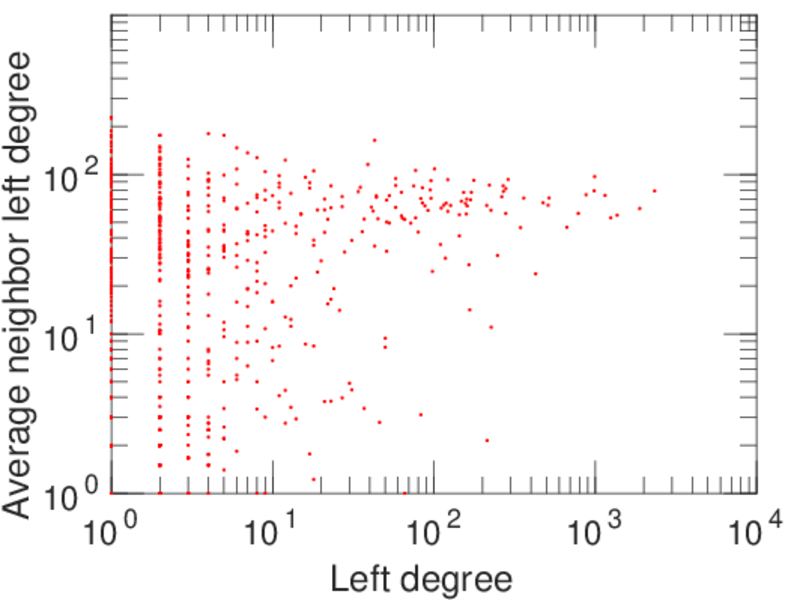
| Average left degree | d1 = | 30.526 1
|
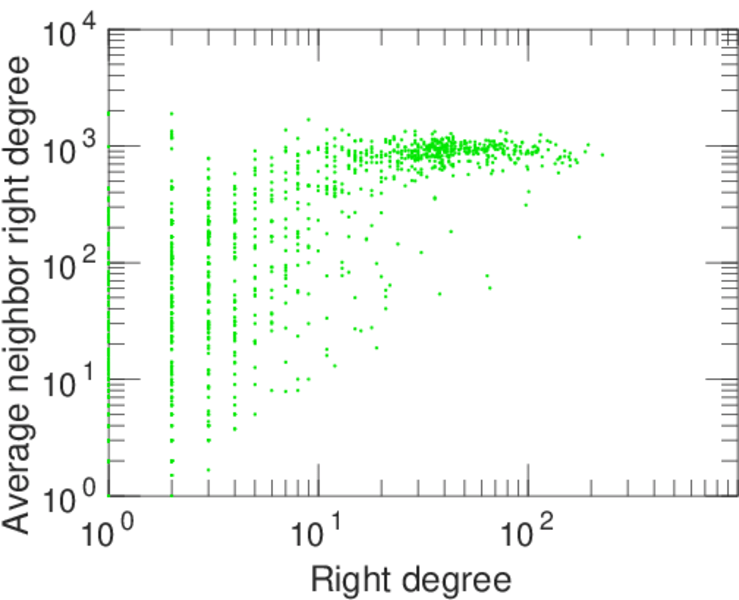
| Average right degree | d2 = | 9.466 04
|
| Fill | p = | 0.004 913 96
|
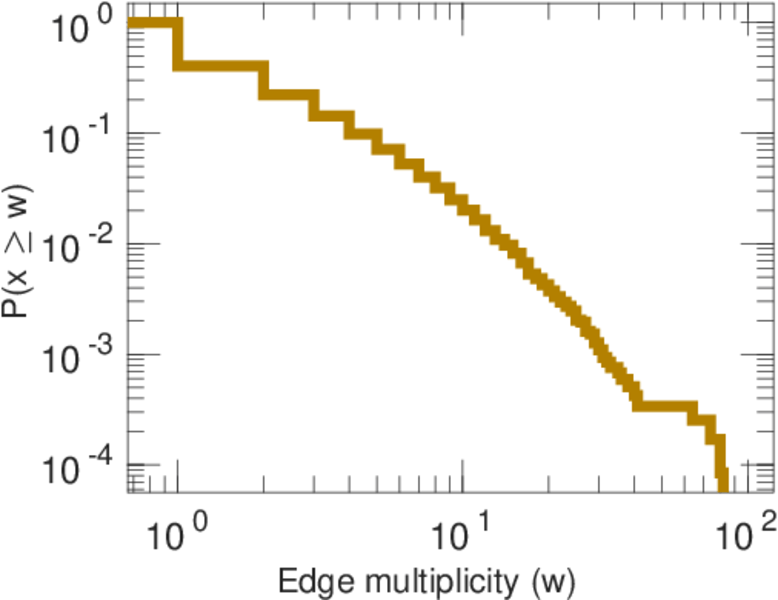
| Average edge multiplicity | m̃ = | 2.232 16
|
| Size of LCC | N = | 2,427
|
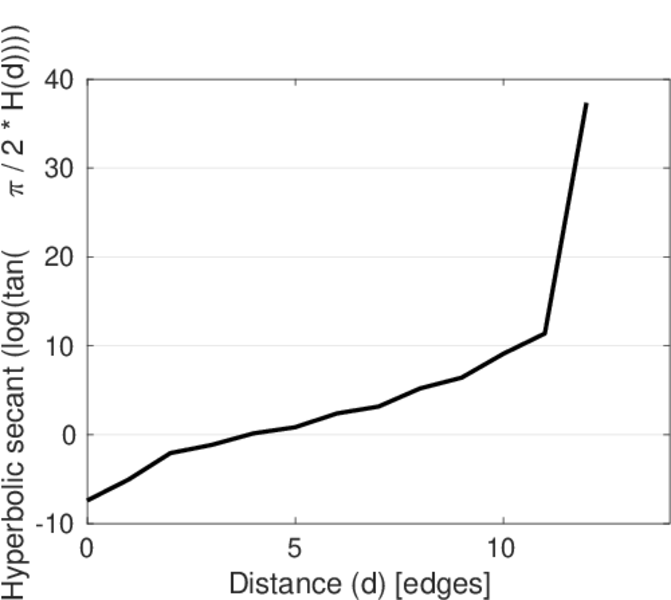
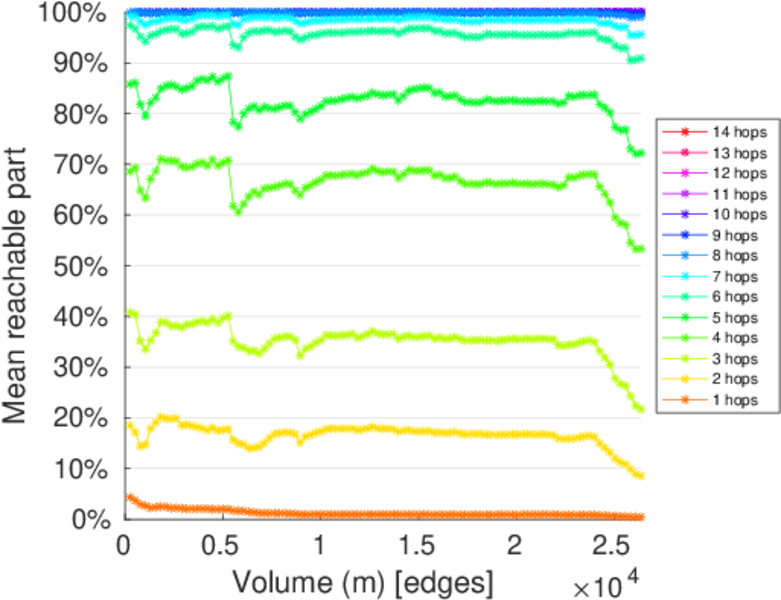
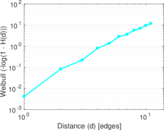
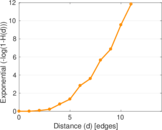
| Diameter | δ = | 14
|
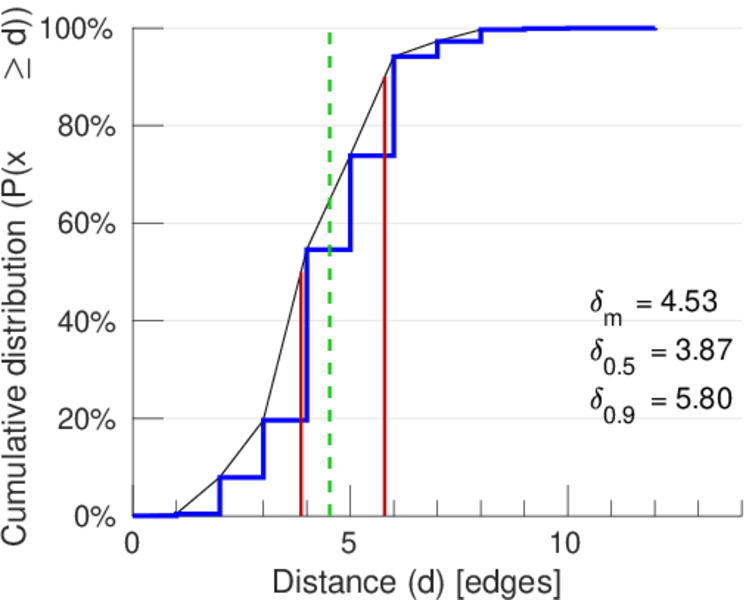
| 50-Percentile effective diameter | δ0.5 = | 3.869 42
|
| 90-Percentile effective diameter | δ0.9 = | 5.796 13
|
| Median distance | δM = | 4
|
| Mean distance | δm = | 4.526 84
|
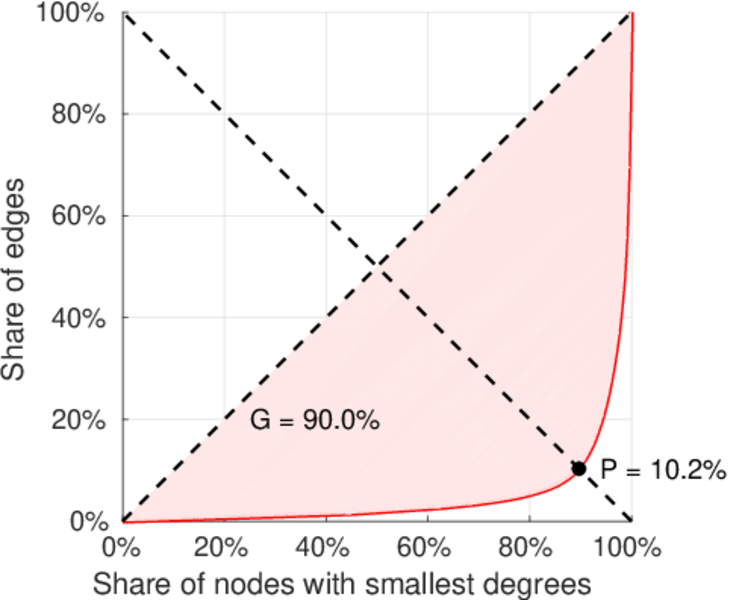
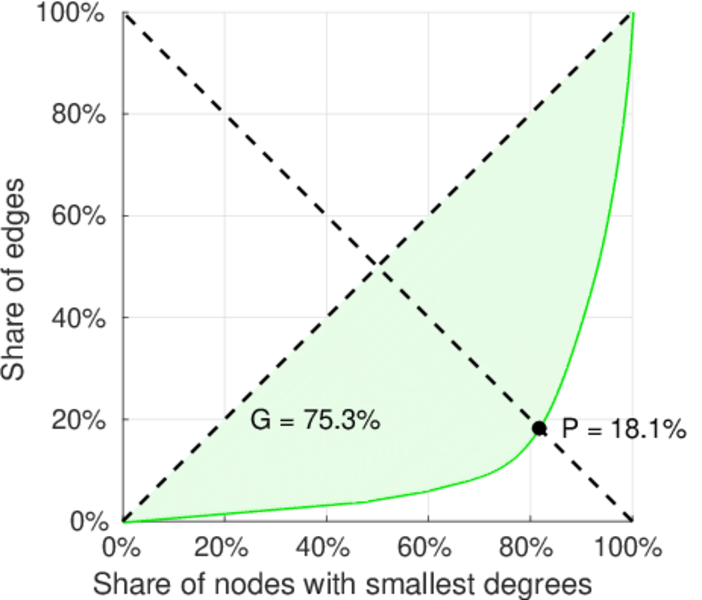
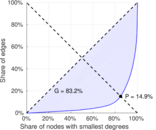
| Gini coefficient | G = | 0.820 080
|
| Balanced inequality ratio | P = | 0.165 047
|
| Left balanced inequality ratio | P1 = | 0.101 579
|
| Right balanced inequality ratio | P2 = | 0.181 142
|
| Relative edge distribution entropy | Her = | 0.817 259
|
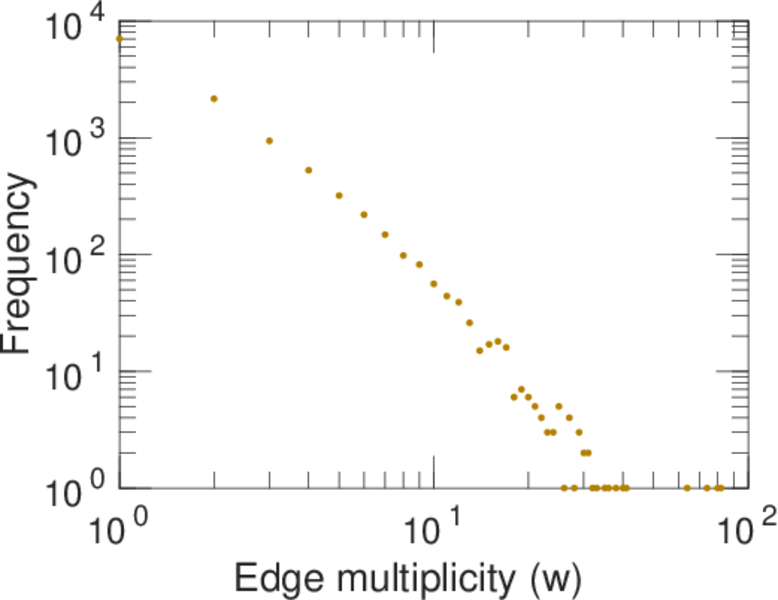
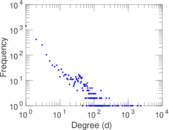
| Power law exponent | γ = | 2.235 30
|
| Tail power law exponent | γt = | 2.541 00
|
| Tail power law exponent with p | γ3 = | 2.541 00
|
| p-value | p = | 0.048 000 0
|
| Left tail power law exponent with p | γ3,1 = | 1.731 00
|
| Left p-value | p1 = | 0.000 00
|
| Right tail power law exponent with p | γ3,2 = | 5.551 00
|
| Right p-value | p2 = | 0.314 000
|
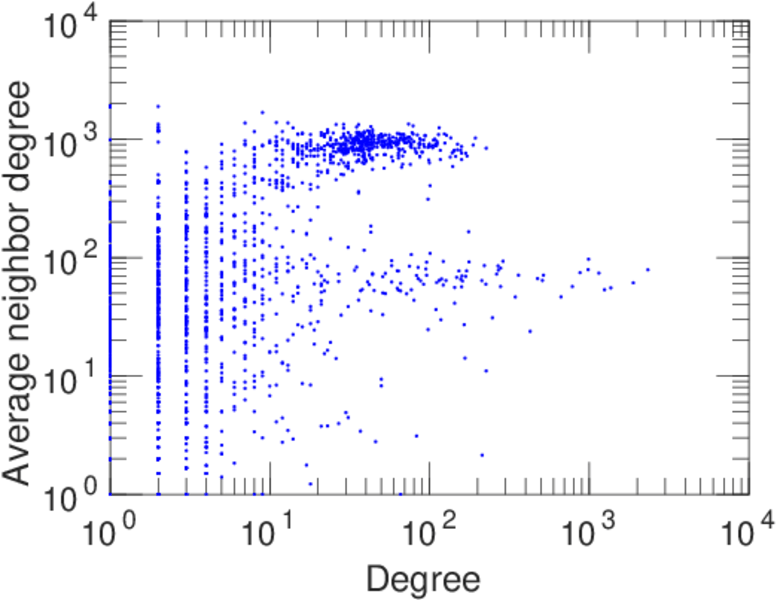
| Degree assortativity | ρ = | +0.071 141 4
|
| Degree assortativity p-value | pρ = | 1.013 32 × 10−14
|
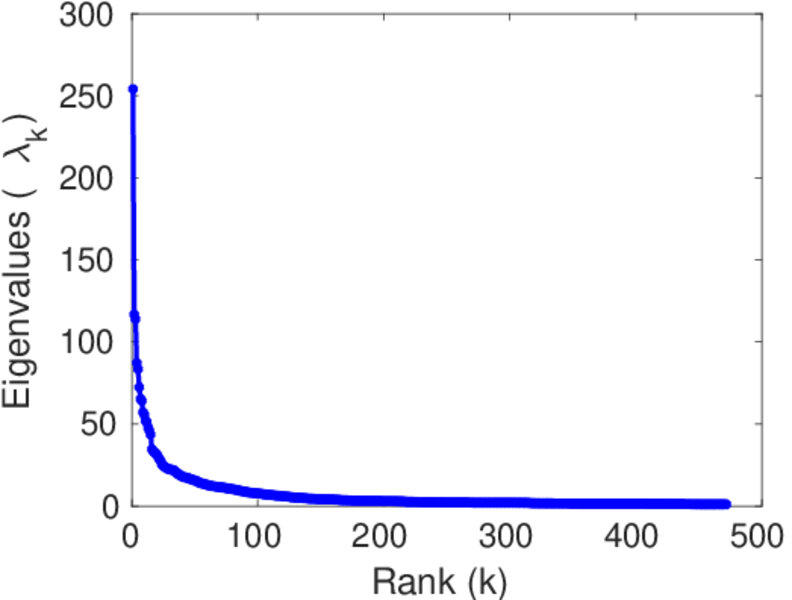
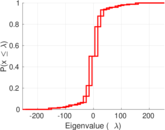
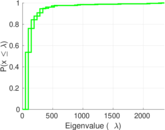
| Spectral norm | α = | 254.066
|
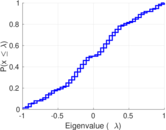
| Algebraic connectivity | a = | 0.023 732 2
|
| Spectral separation | |λ1[A] / λ2[A]| = | 2.176 59
|
| Controllability | C = | 1,526
|
| Relative controllability | Cr = | 0.494 491
|
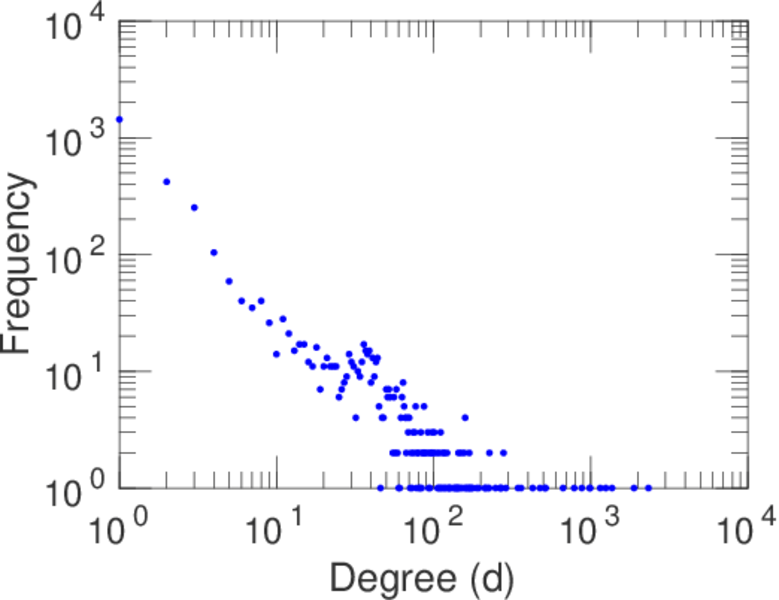
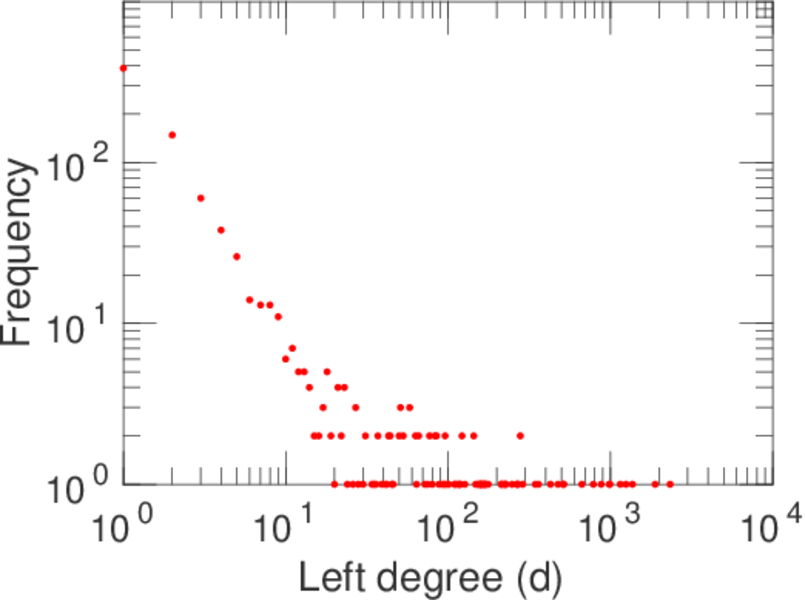
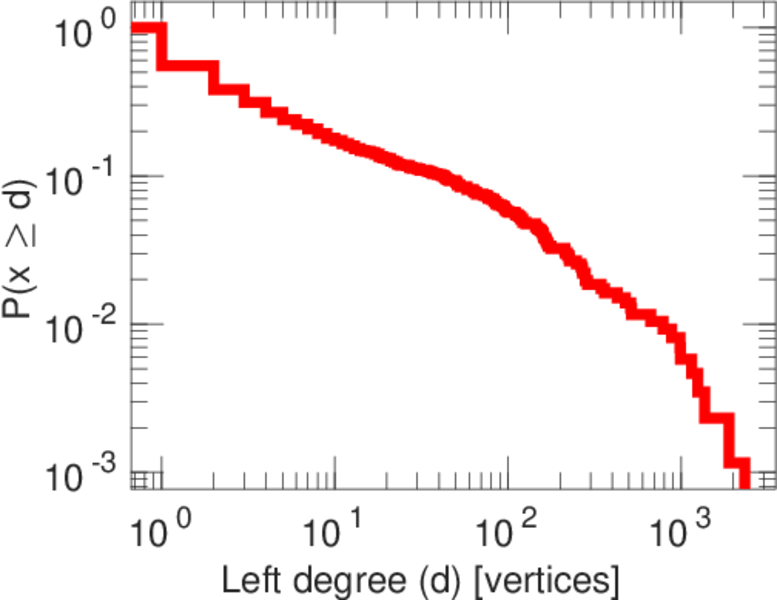
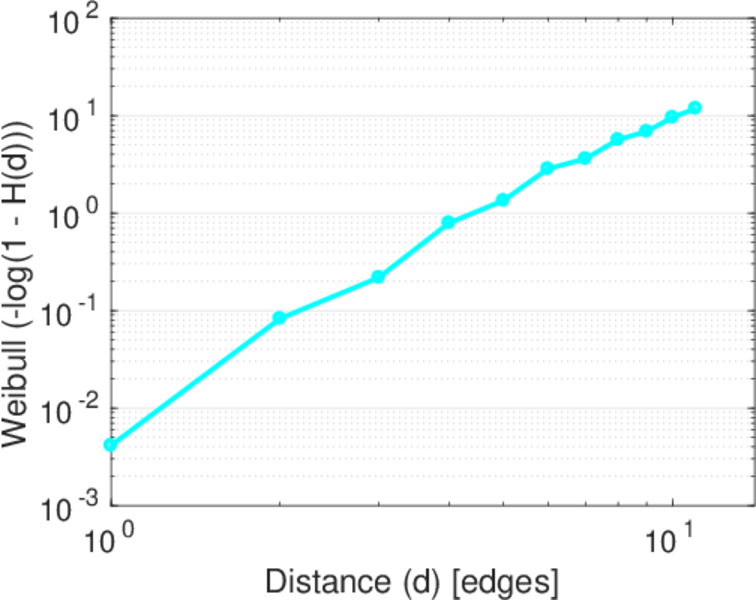
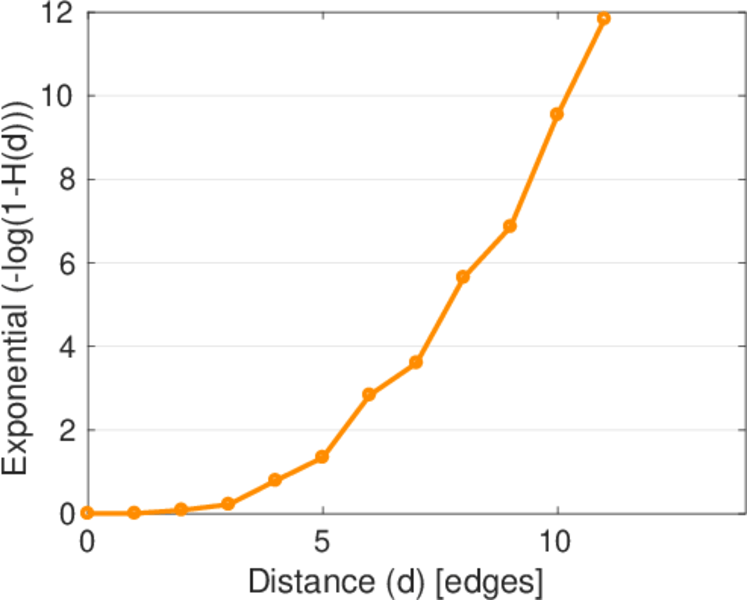
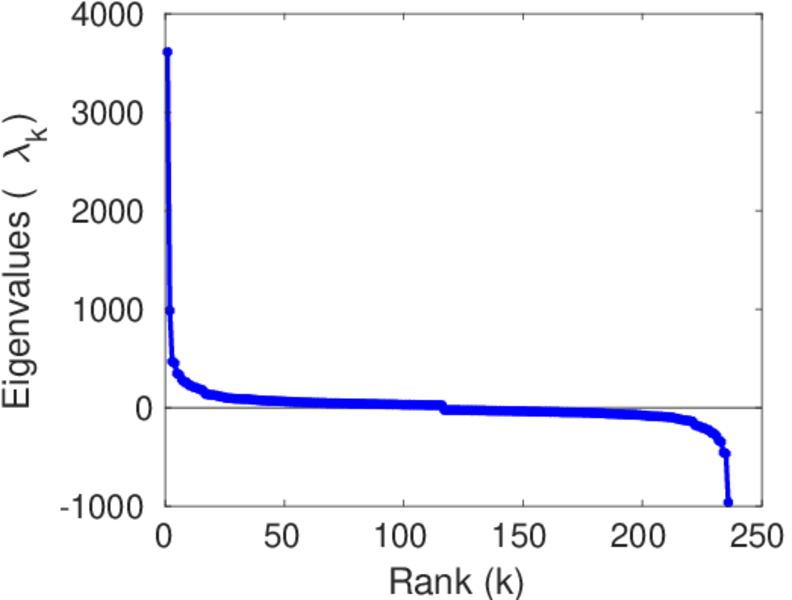
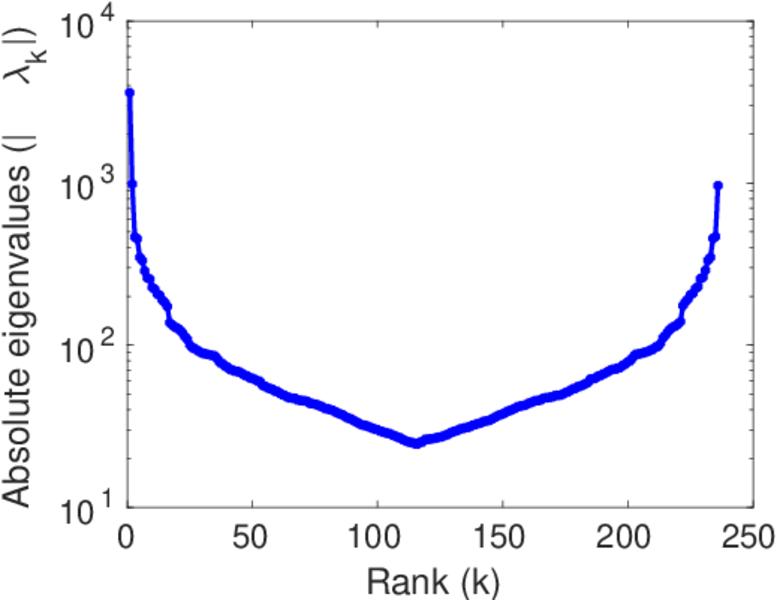
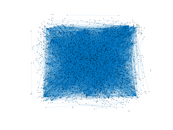
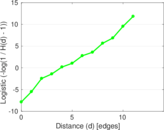
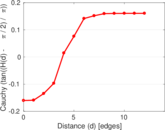
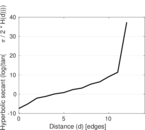
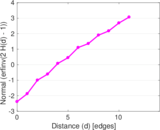
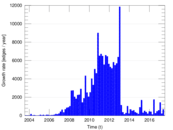
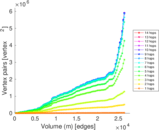
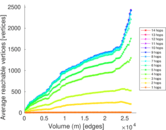
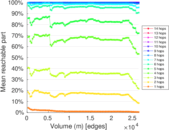
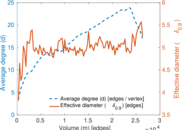
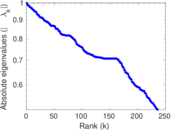
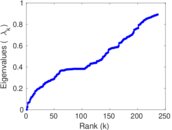
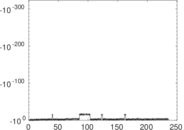
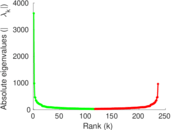
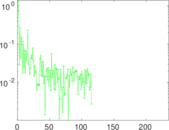
Plots


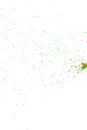
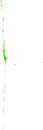
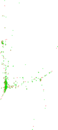


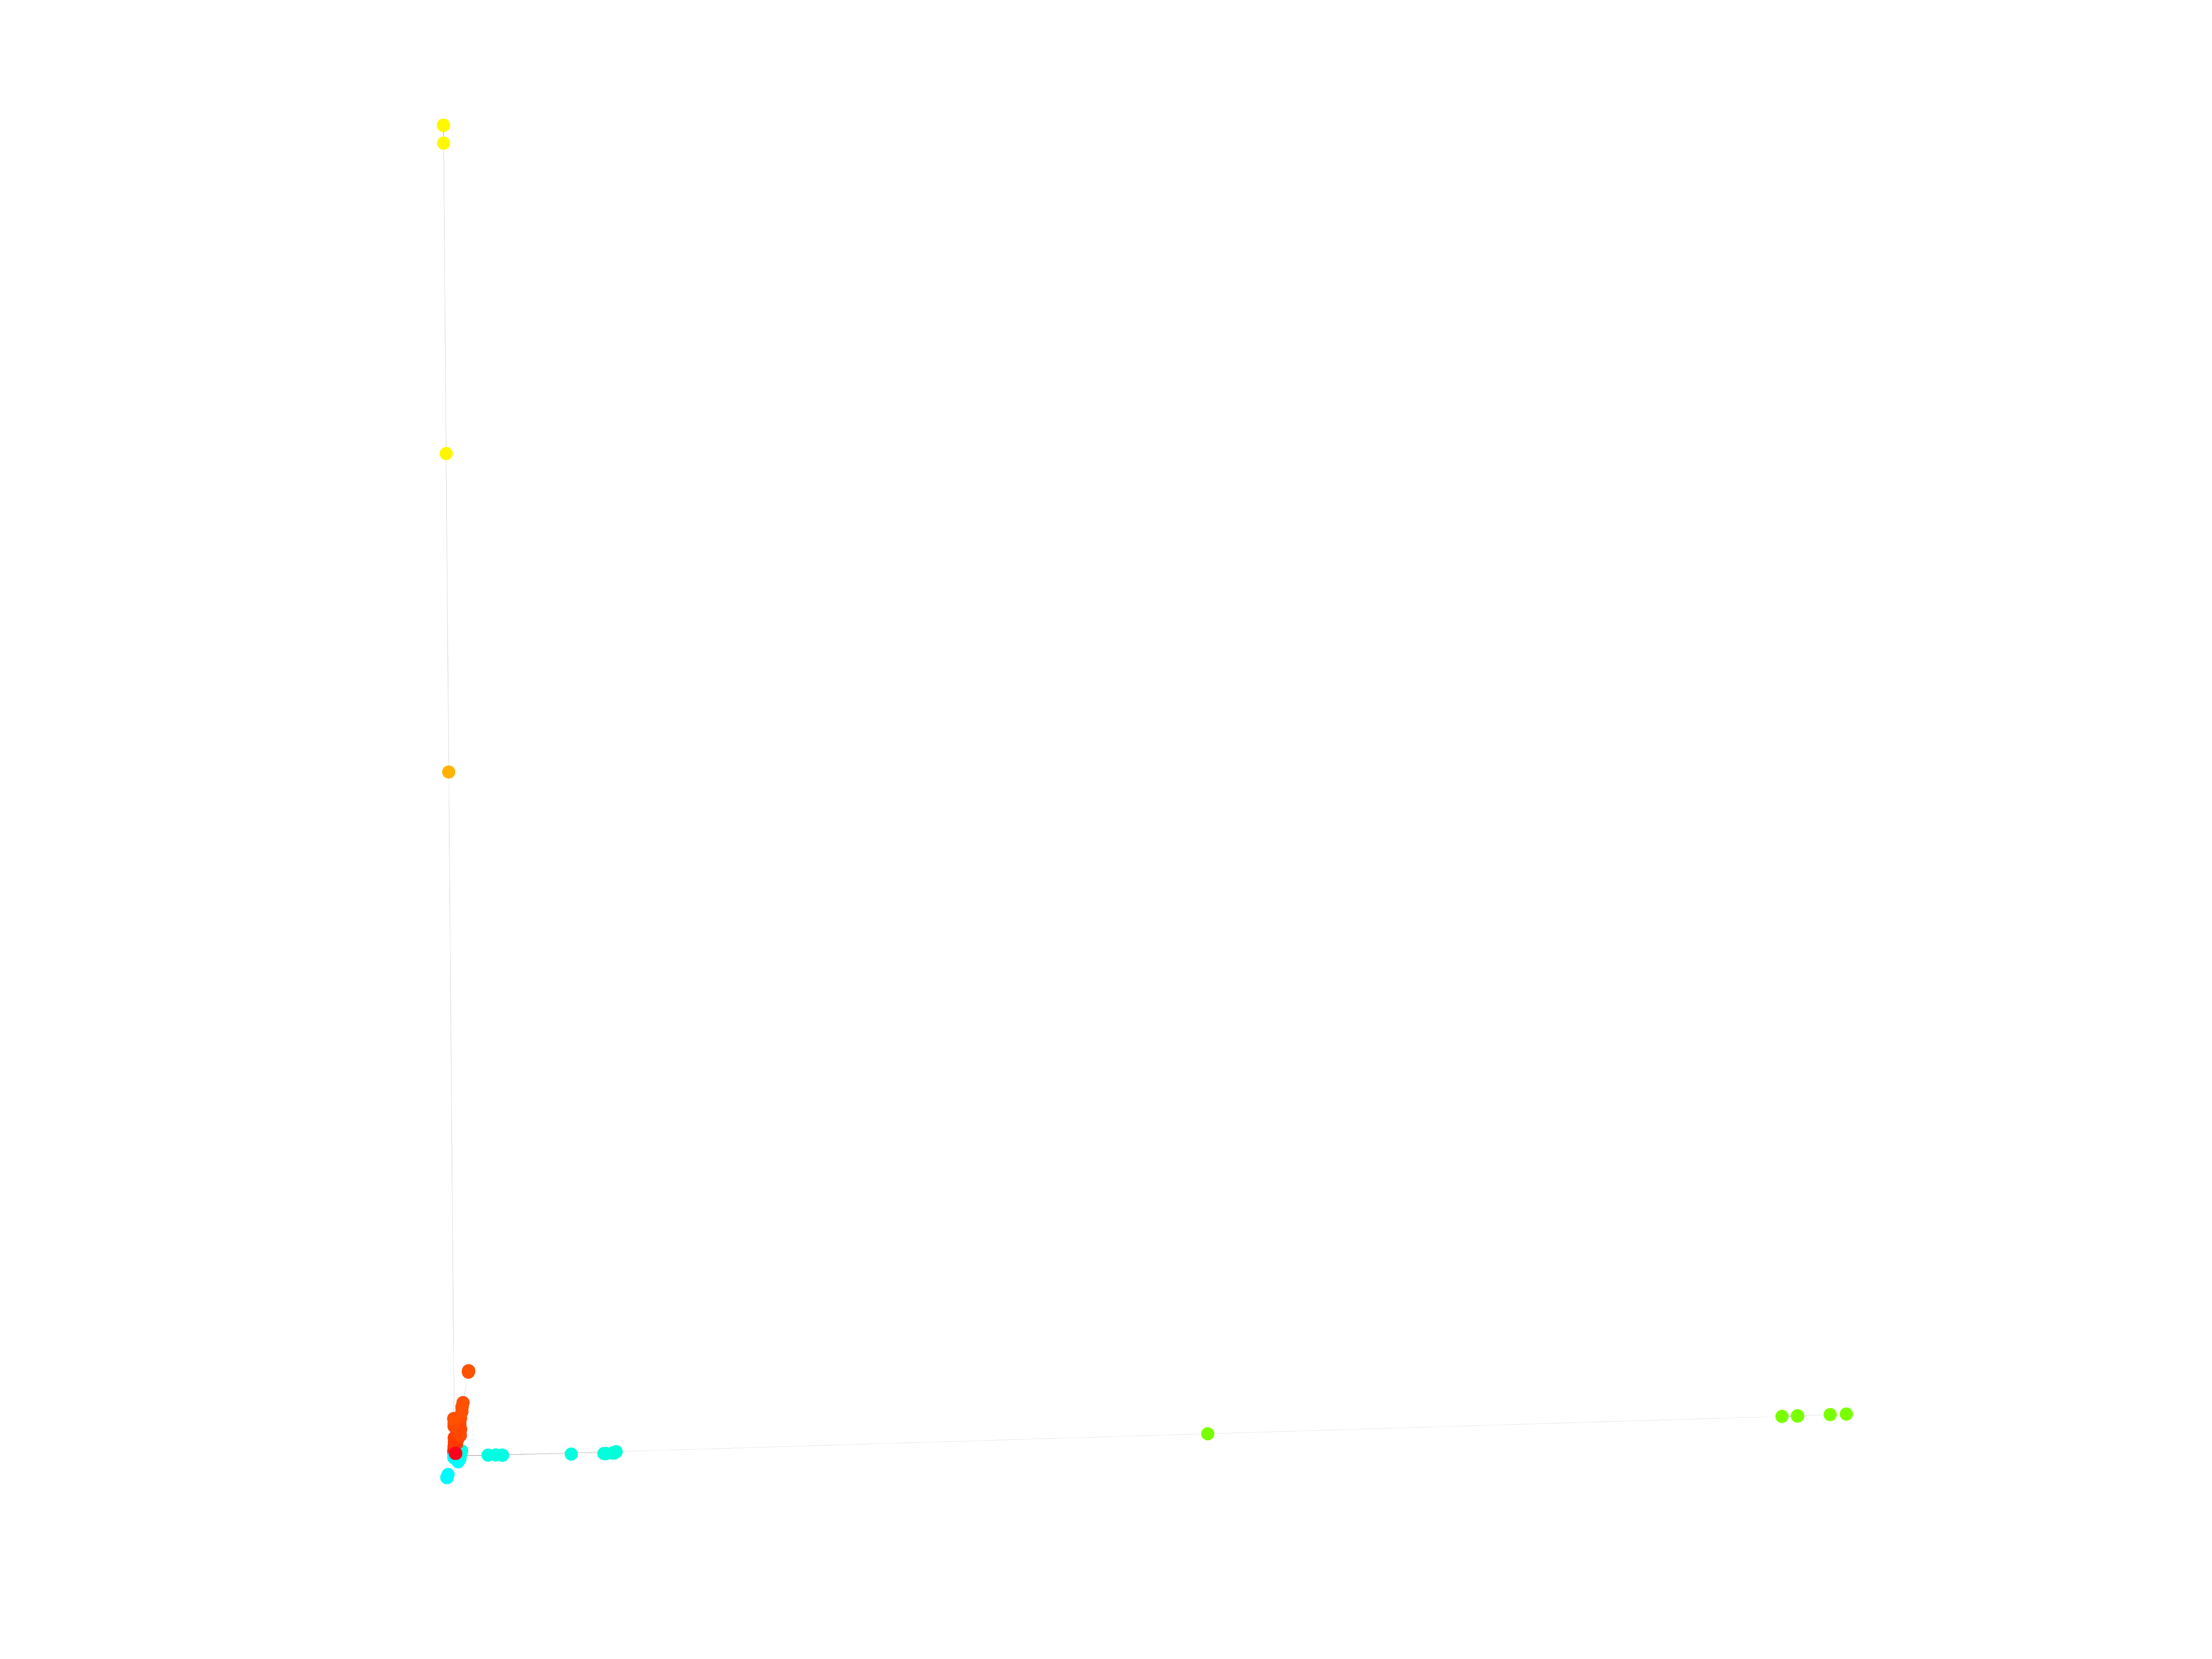
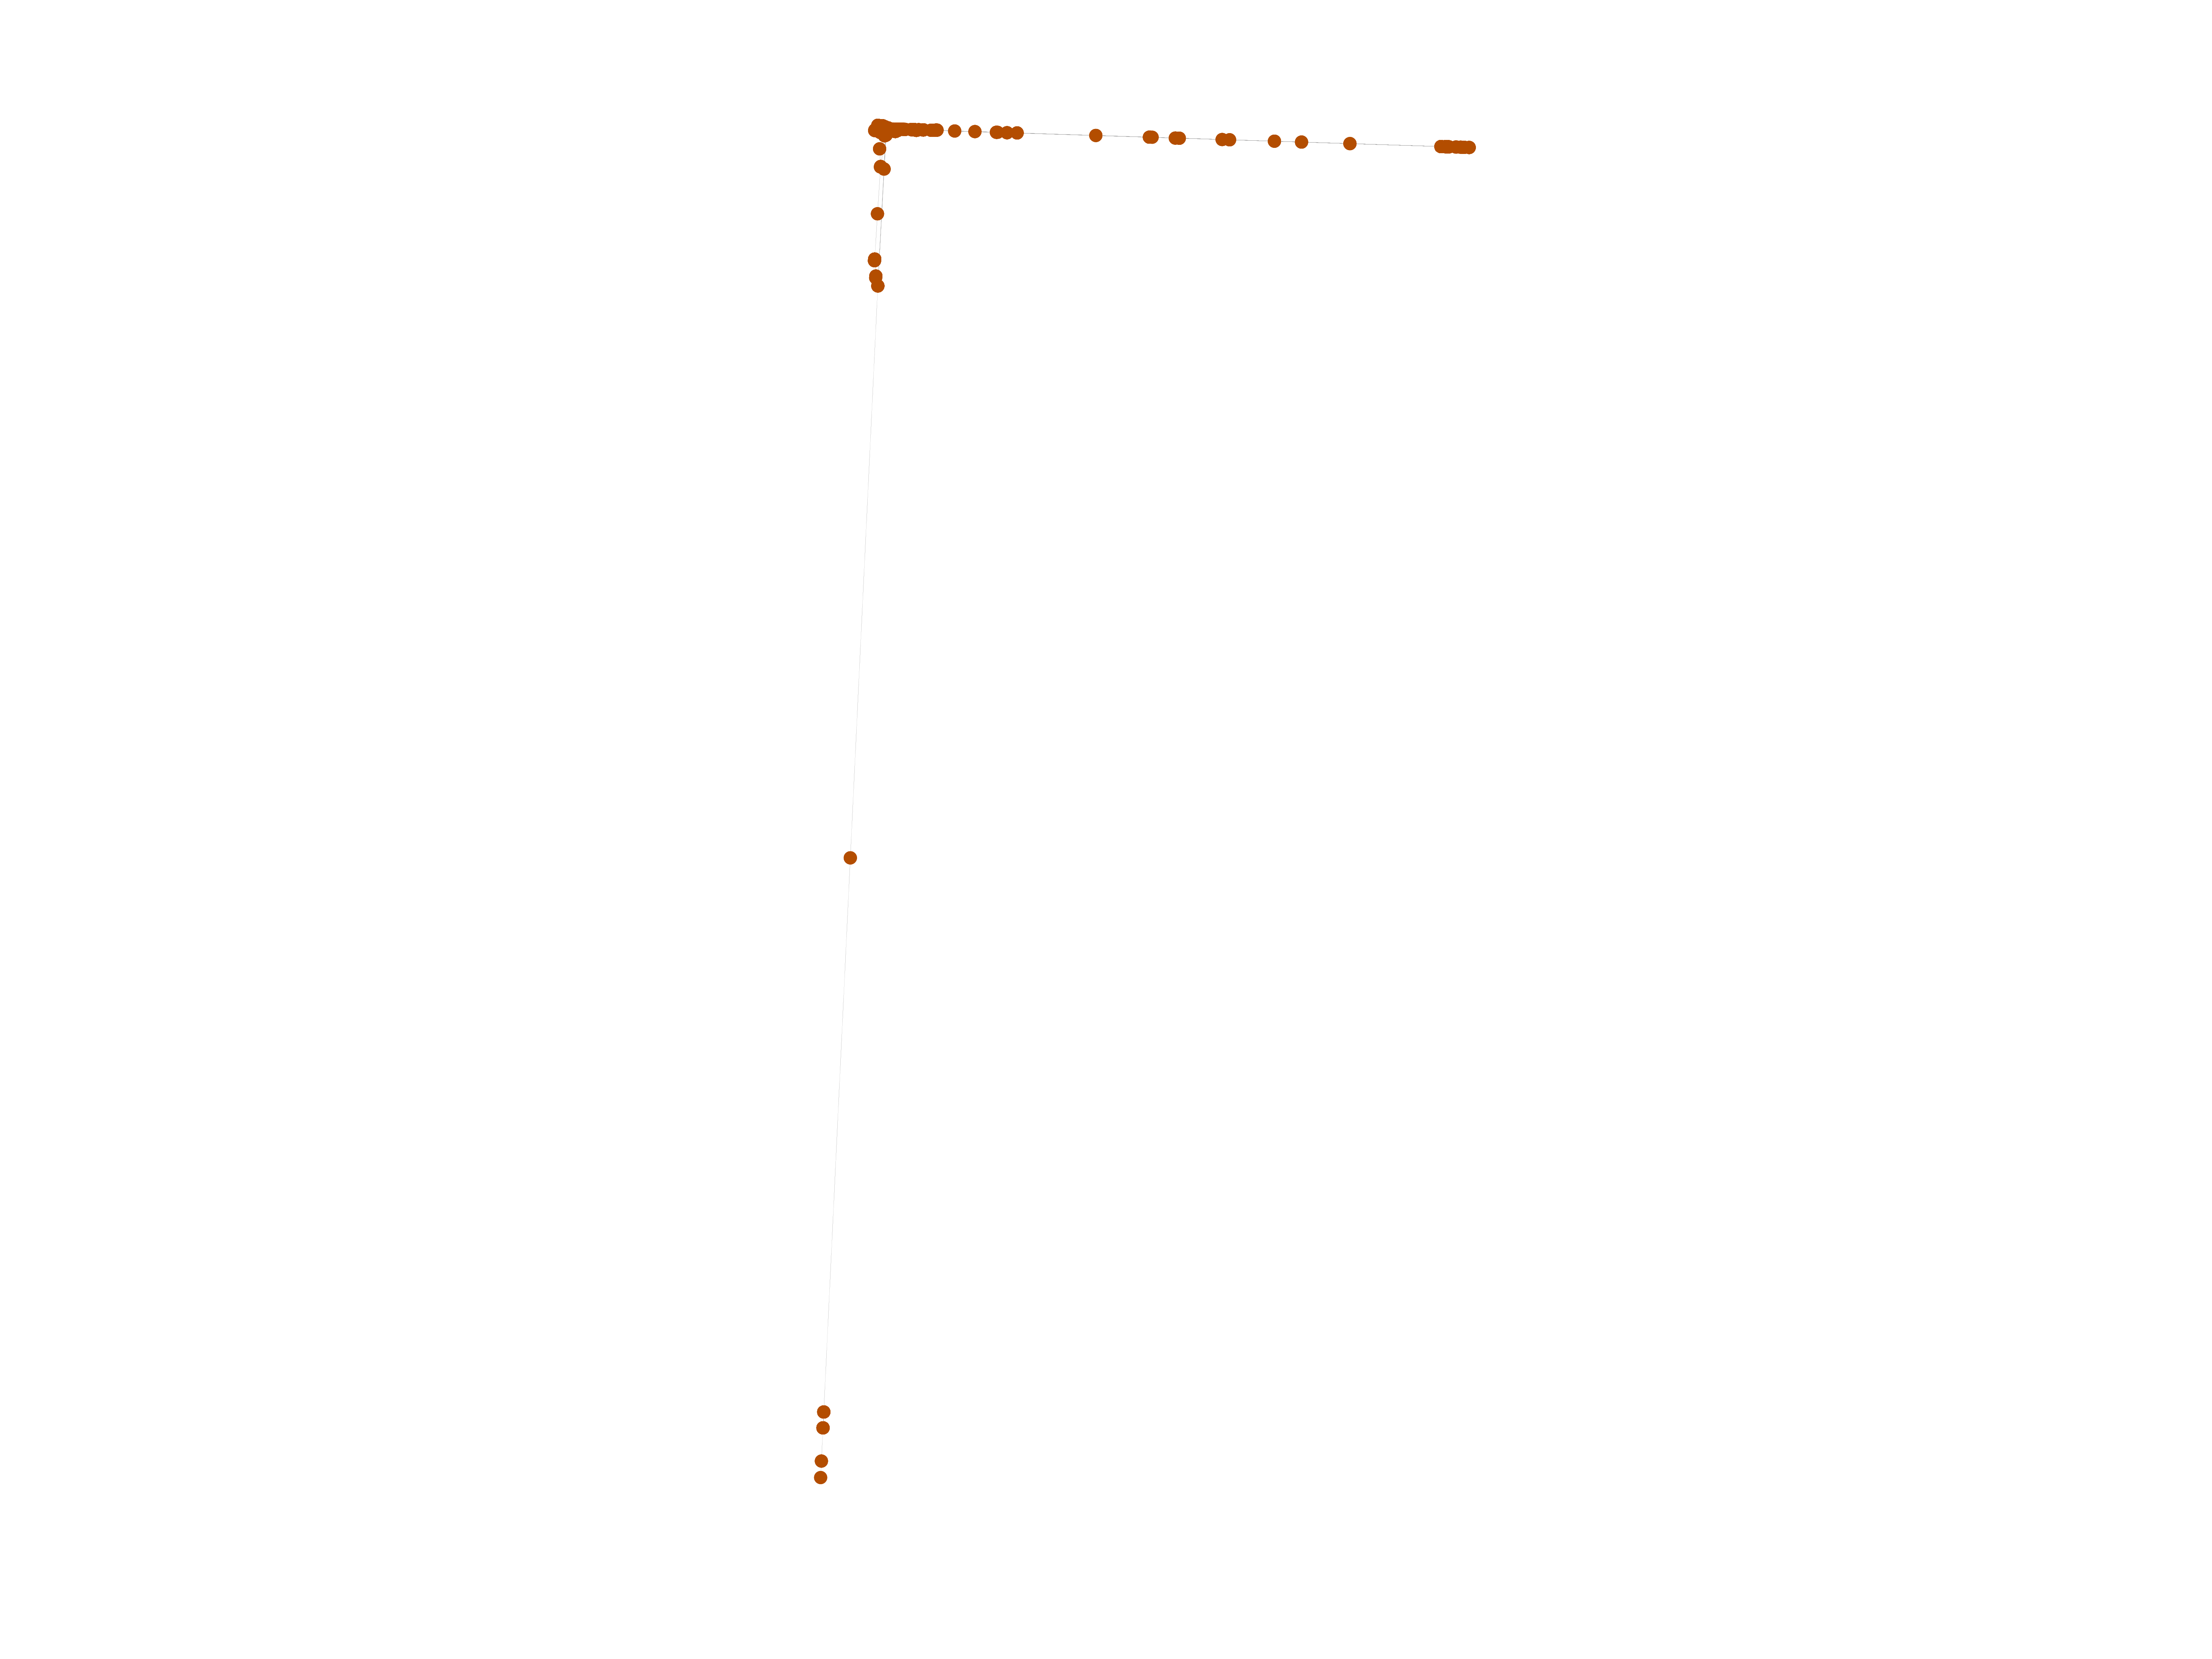
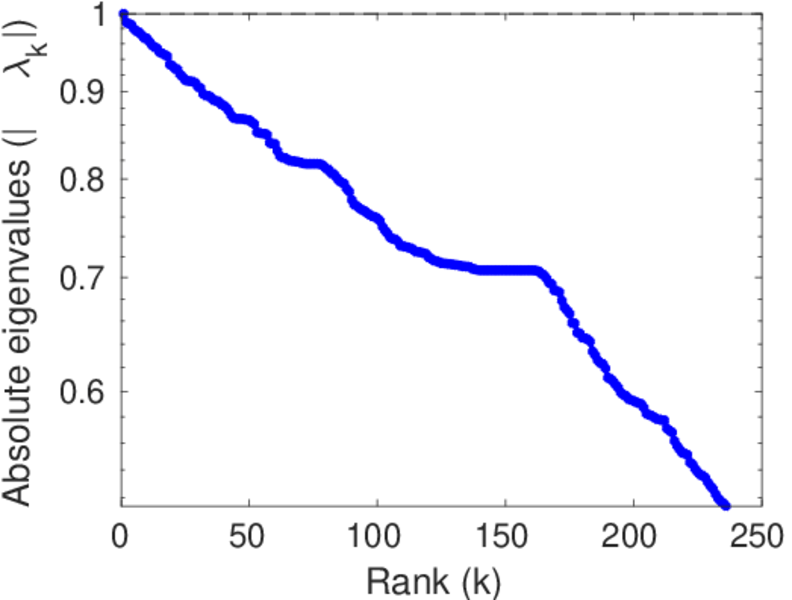
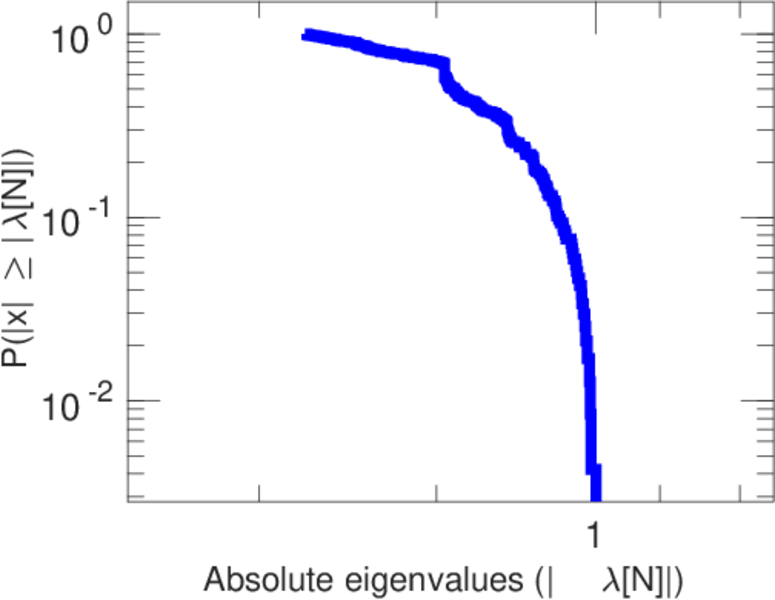
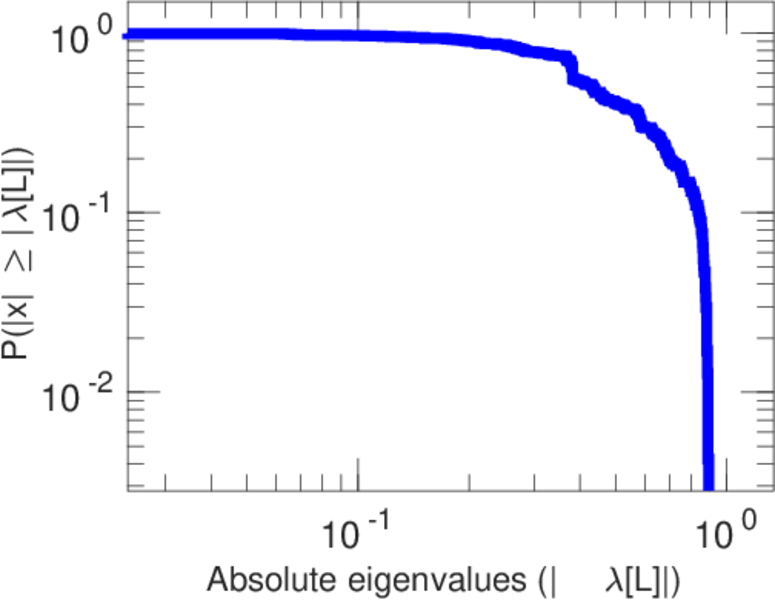
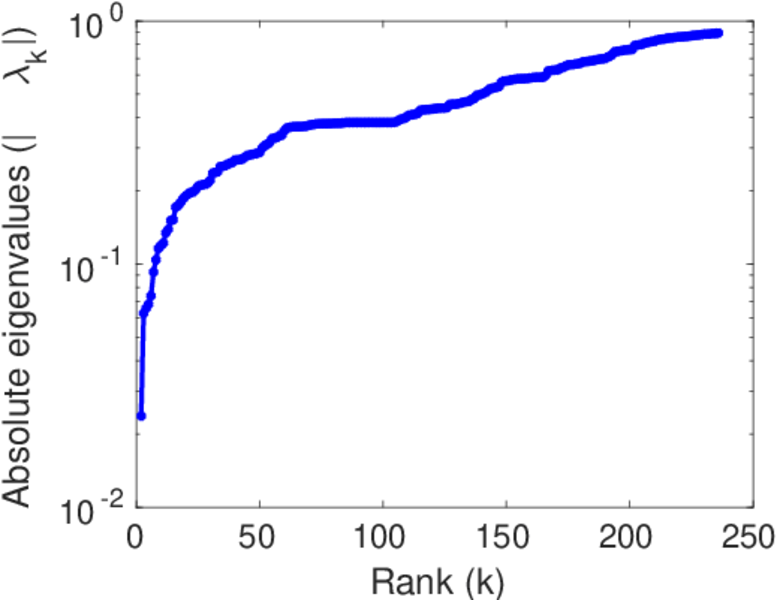
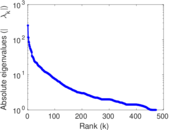
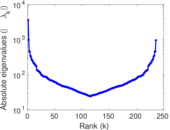
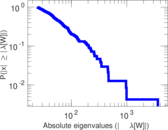
Matrix decompositions plots


Downloads
References
|
[1]
|
Jérôme Kunegis.
KONECT – The Koblenz Network Collection.
In Proc. Int. Conf. on World Wide Web Companion, pages
1343–1350, 2013.
[ http ]
|
|
[2]
|
Wikimedia Foundation.
Wikimedia downloads.
http://dumps.wikimedia.org/, January 2010.
|
 KONECT ‣ Networks ‣
Buy Me a Coffee
KONECT ‣ Networks ‣
Buy Me a Coffee