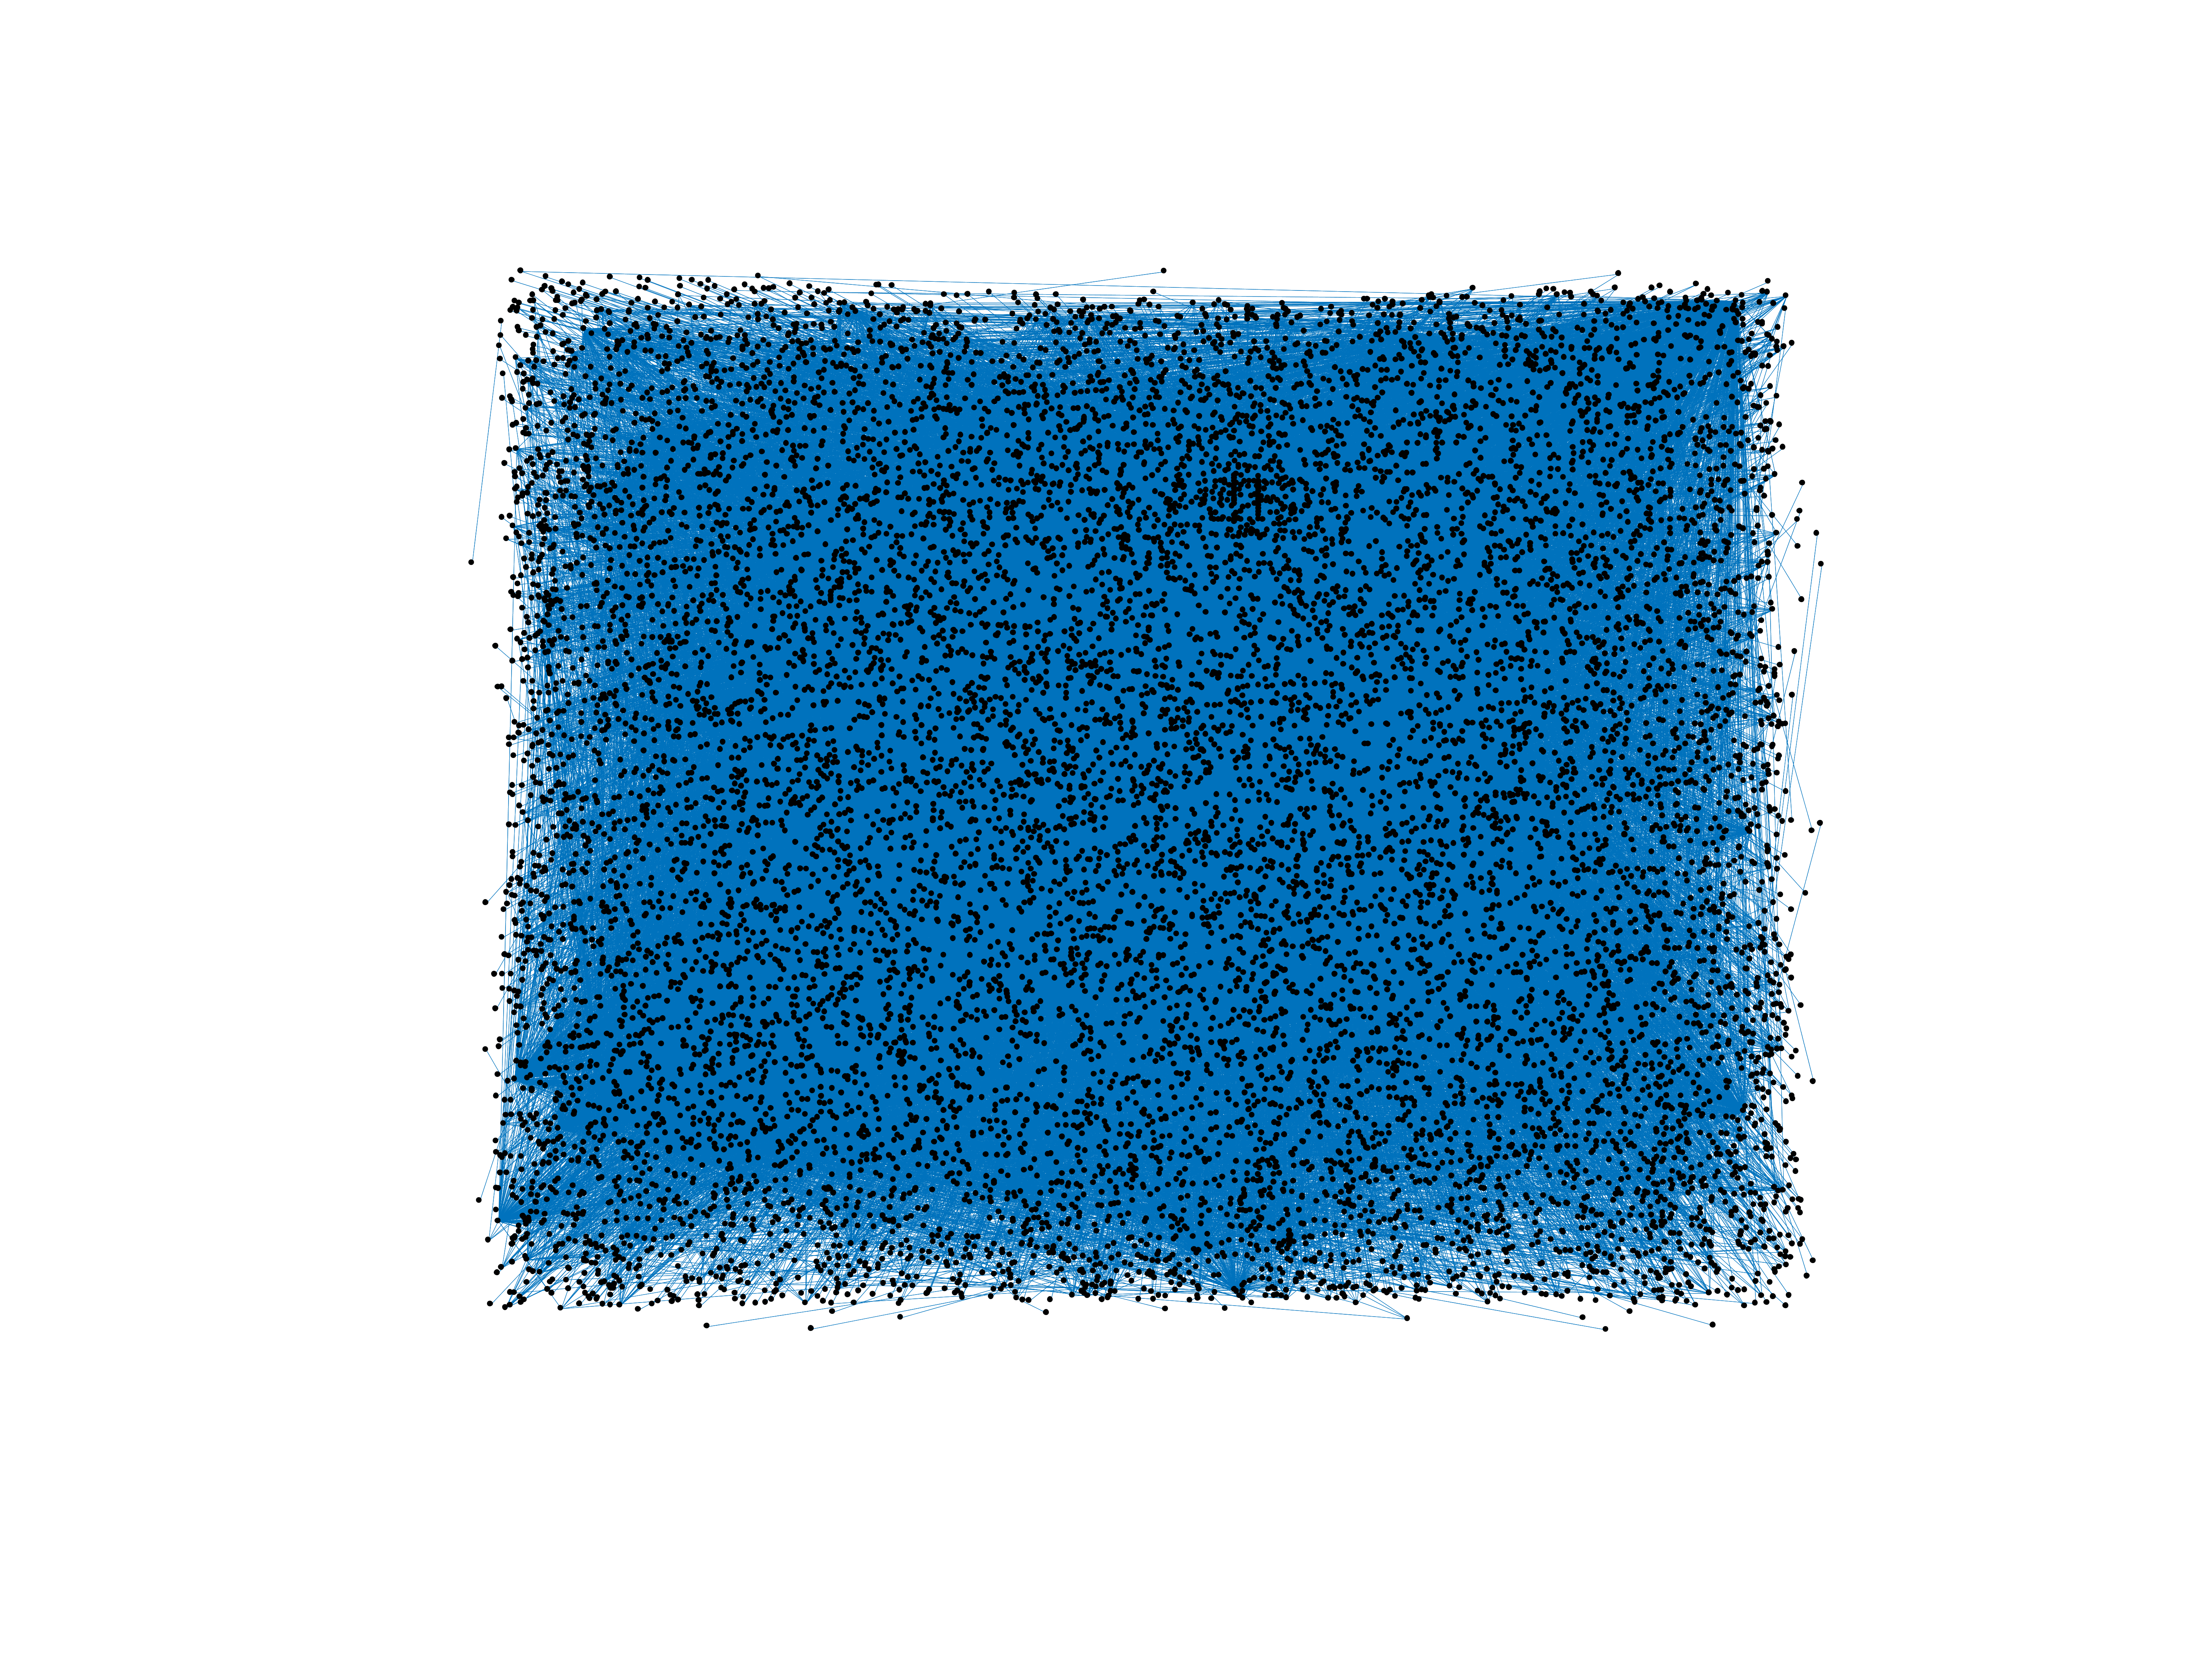
Wikipedia edits (bjn)
This is the bipartite edit network of the Banjar Wikipedia. It contains users
and pages from the Banjar Wikipedia, connected by edit events. Each edge
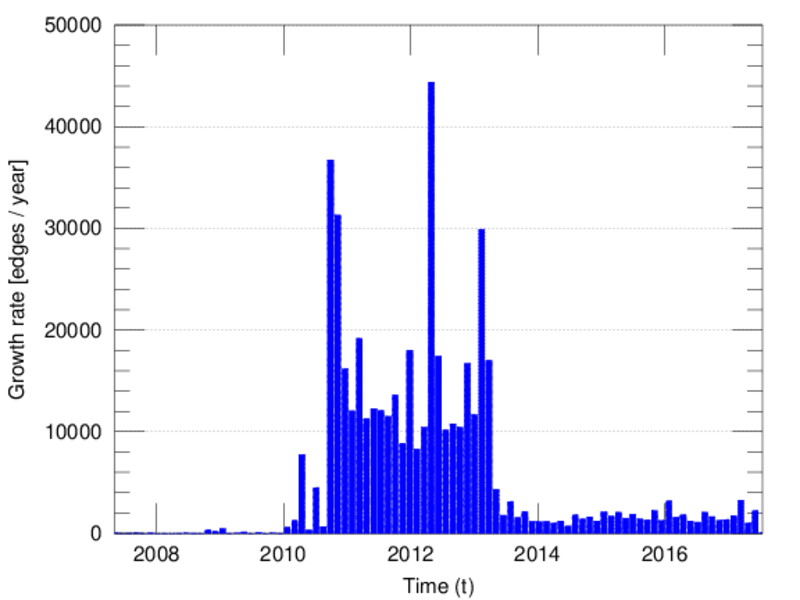
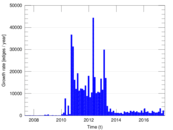
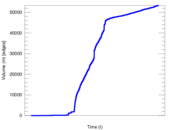
represents an edit. The dataset includes the timestamp of each edit.
Metadata
Statistics
| Size | n = | 12,801
|
| Left size | n1 = | 822
|
| Right size | n2 = | 11,979
|
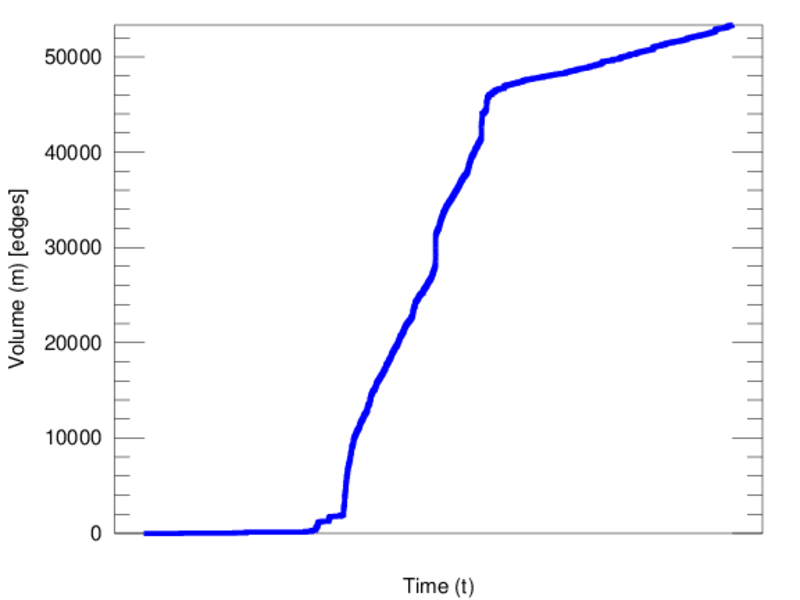
| Volume | m = | 53,330
|
| Unique edge count | m̿ = | 31,918
|
| Wedge count | s = | 42,525,885
|
| Claw count | z = | 96,393,375,906
|
| Cross count | x = | 191,906,509,589,813
|
| Square count | q = | 17,197,376
|
| 4-Tour count | T4 = | 307,776,192
|
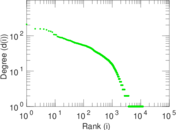
| Maximum degree | dmax = | 10,747
|
| Maximum left degree | d1max = | 10,747
|
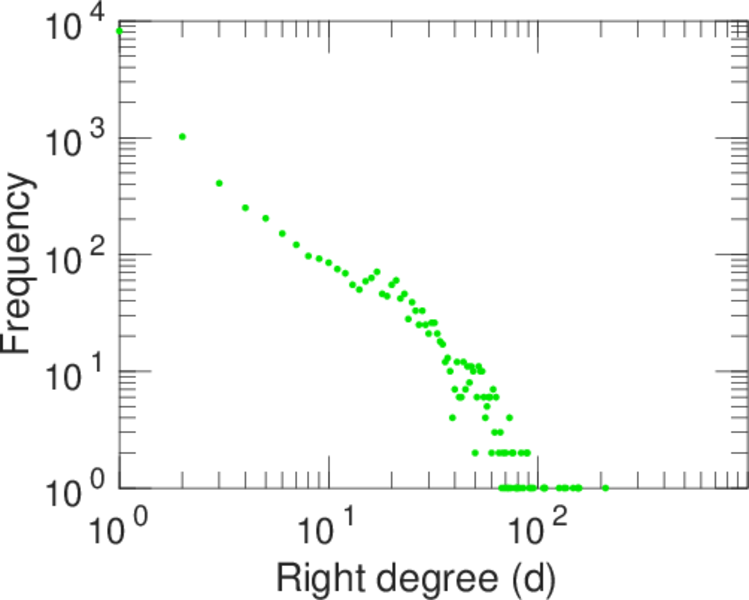
| Maximum right degree | d2max = | 210
|
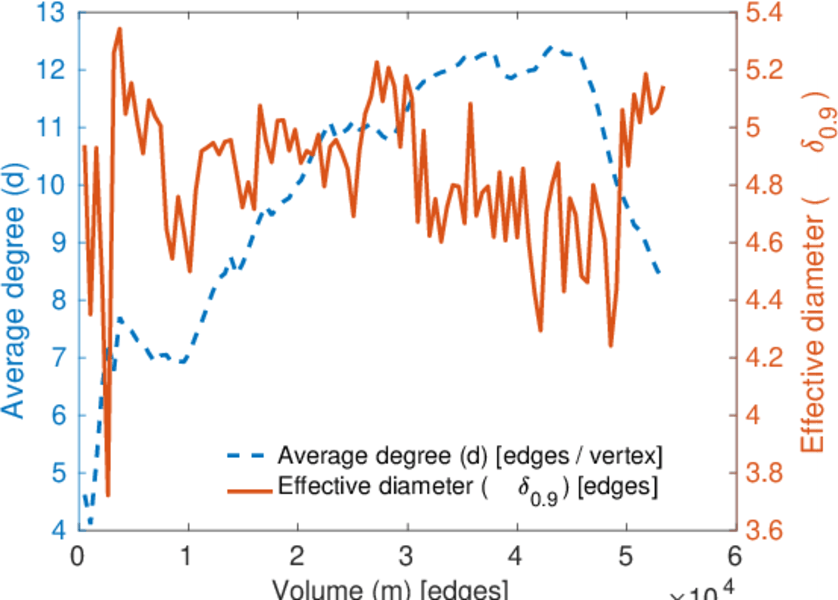
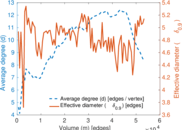
| Average degree | d = | 8.332 16
|
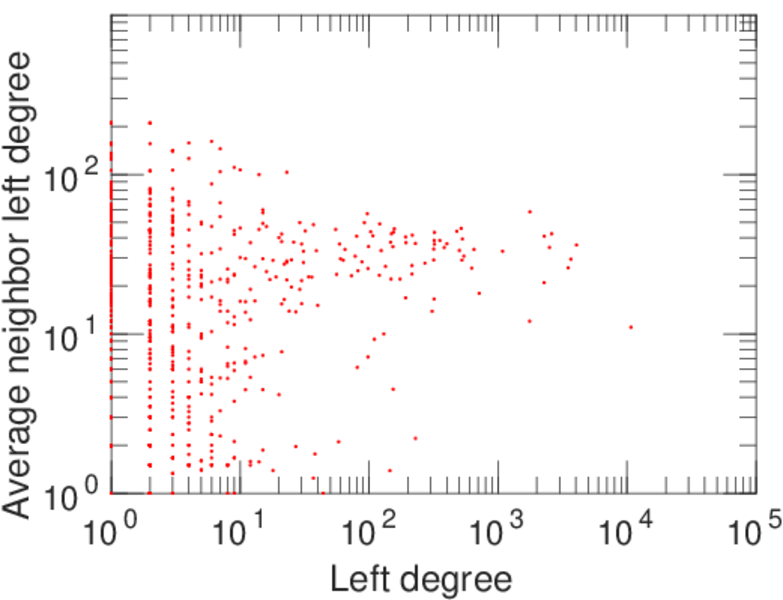
| Average left degree | d1 = | 64.878 3
|
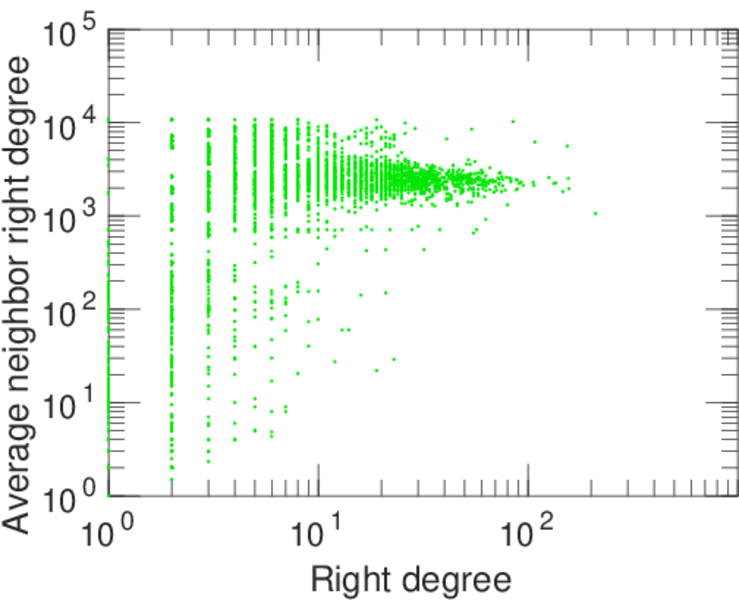
| Average right degree | d2 = | 4.451 96
|
| Fill | p = | 0.003 241 48
|
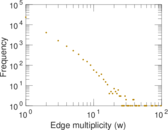
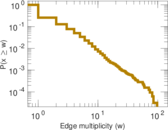
| Average edge multiplicity | m̃ = | 1.670 84
|
| Size of LCC | N = | 12,367
|
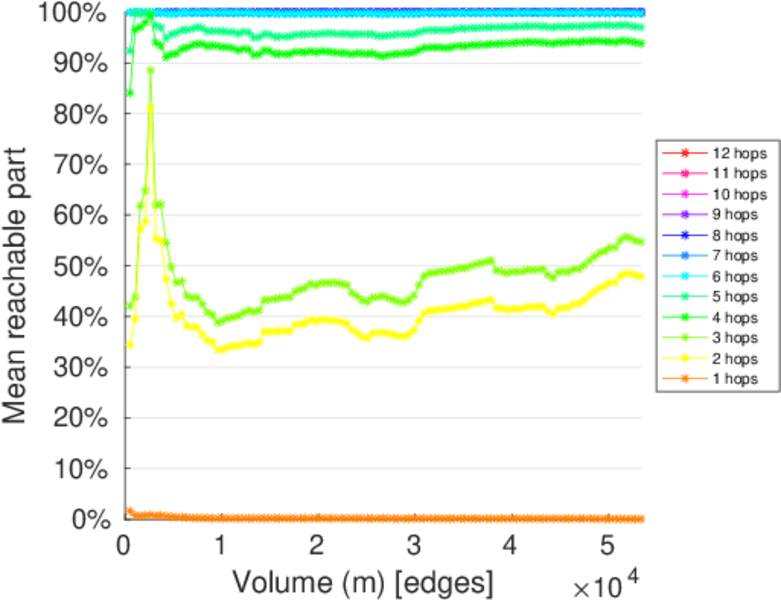
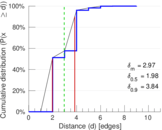
| Diameter | δ = | 12
|
| 50-Percentile effective diameter | δ0.5 = | 1.975 61
|
| 90-Percentile effective diameter | δ0.9 = | 3.842 94
|
| Median distance | δM = | 2
|
| Mean distance | δm = | 2.968 40
|
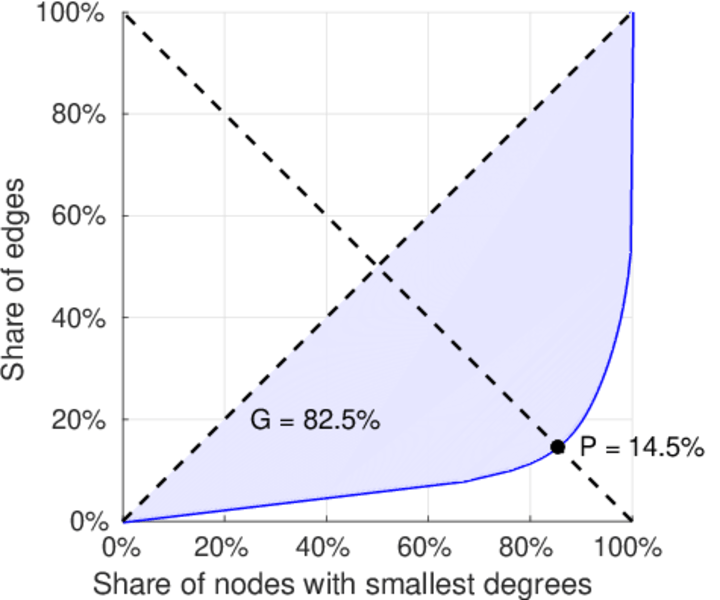
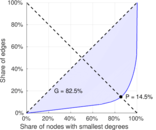
| Gini coefficient | G = | 0.835 574
|
| Balanced inequality ratio | P = | 0.137 905
|
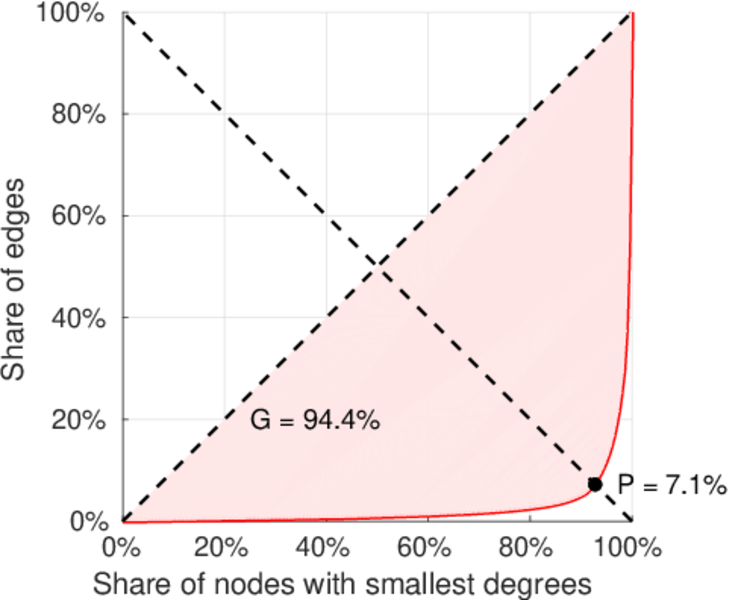
| Left balanced inequality ratio | P1 = | 0.070 673 2
|
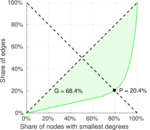
| Right balanced inequality ratio | P2 = | 0.203 694
|
| Relative edge distribution entropy | Her = | 0.730 768
|
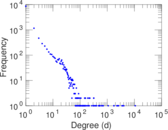
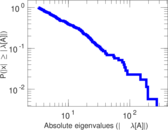
| Power law exponent | γ = | 3.080 92
|
| Tail power law exponent | γt = | 2.111 00
|
| Tail power law exponent with p | γ3 = | 2.111 00
|
| p-value | p = | 0.000 00
|
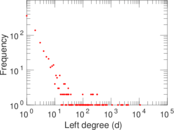
| Left tail power law exponent with p | γ3,1 = | 1.681 00
|
| Left p-value | p1 = | 0.000 00
|
| Right tail power law exponent with p | γ3,2 = | 5.151 00
|
| Right p-value | p2 = | 0.000 00
|
| Degree assortativity | ρ = | −0.497 948
|
| Degree assortativity p-value | pρ = | 0.000 00
|
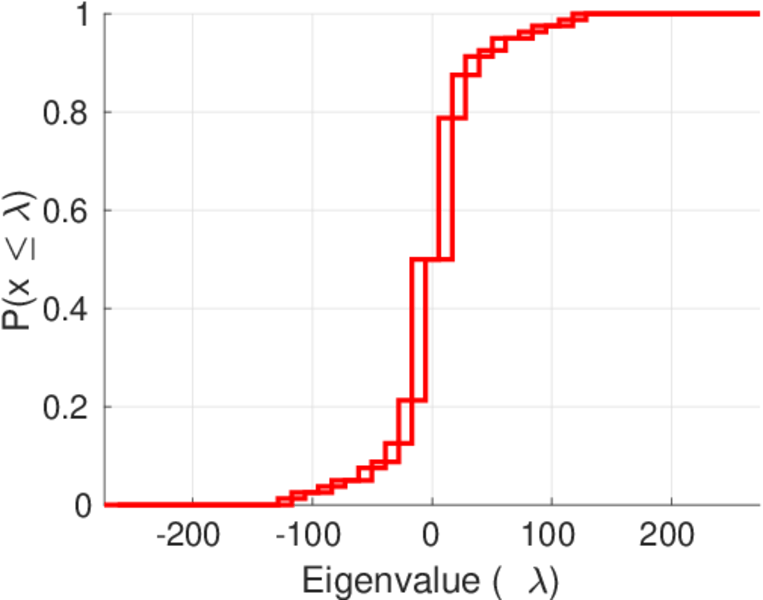
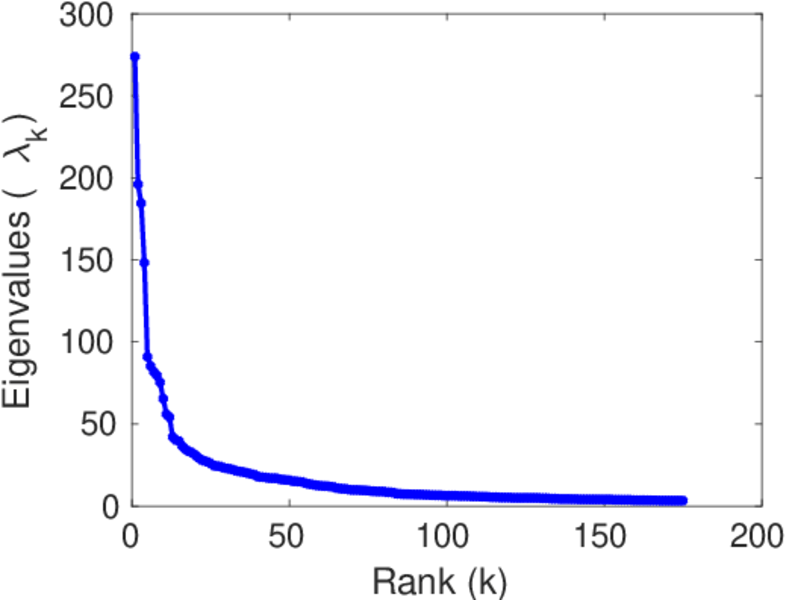
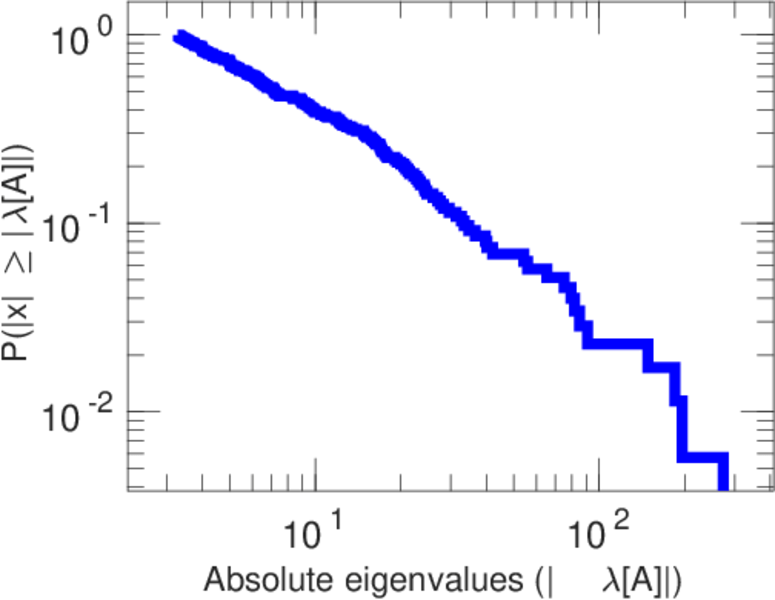
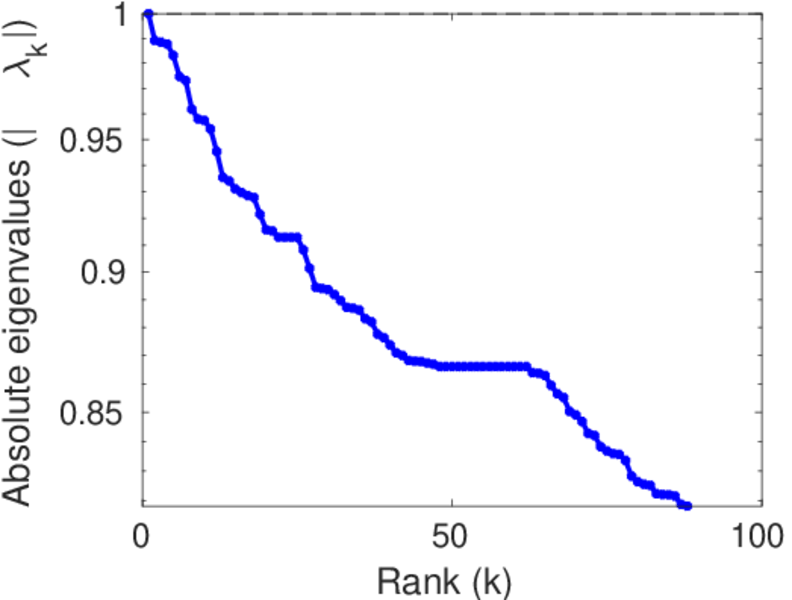
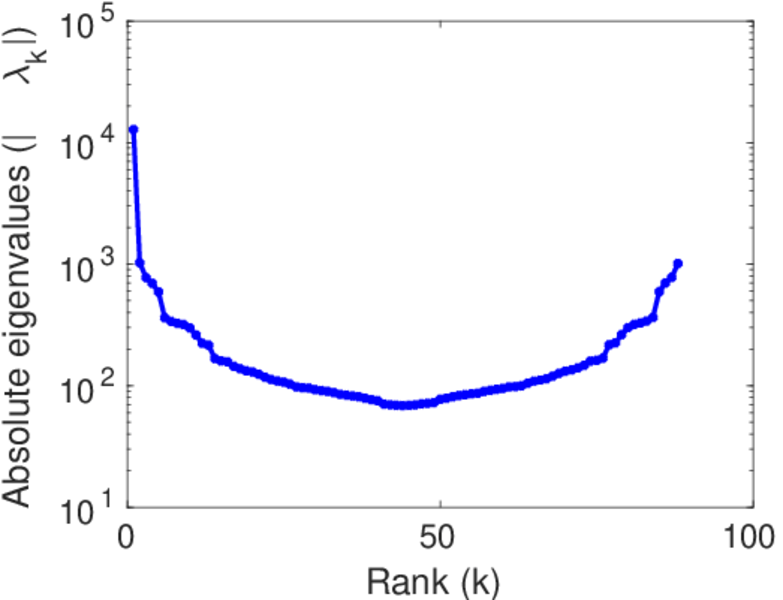
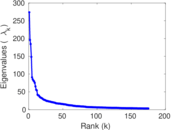
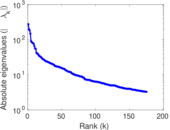
| Spectral norm | α = | 273.831
|
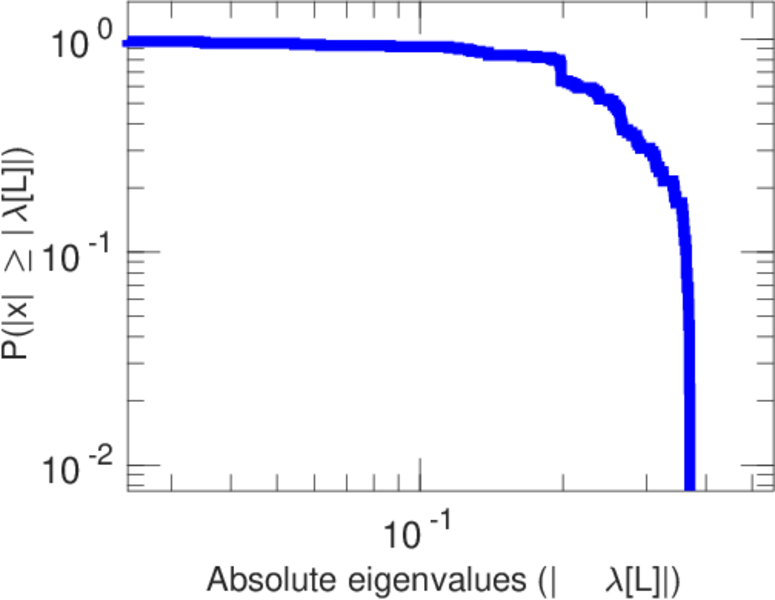
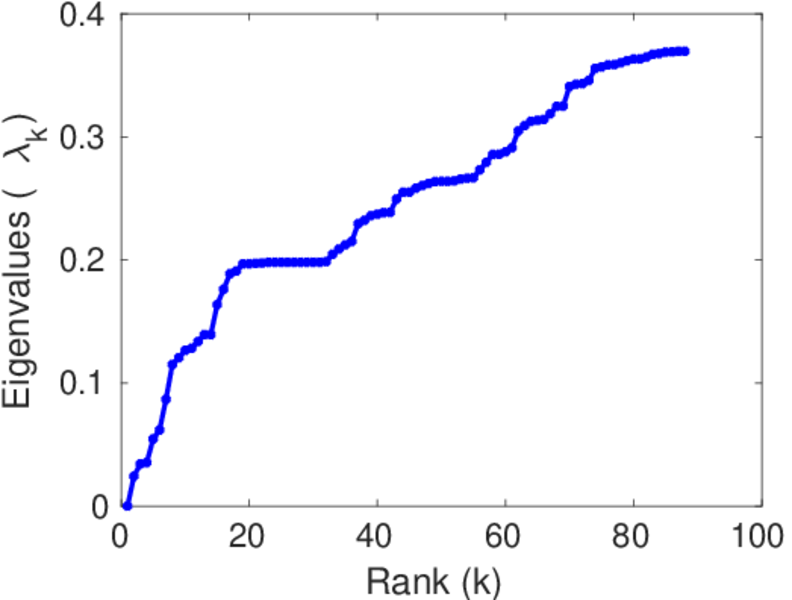
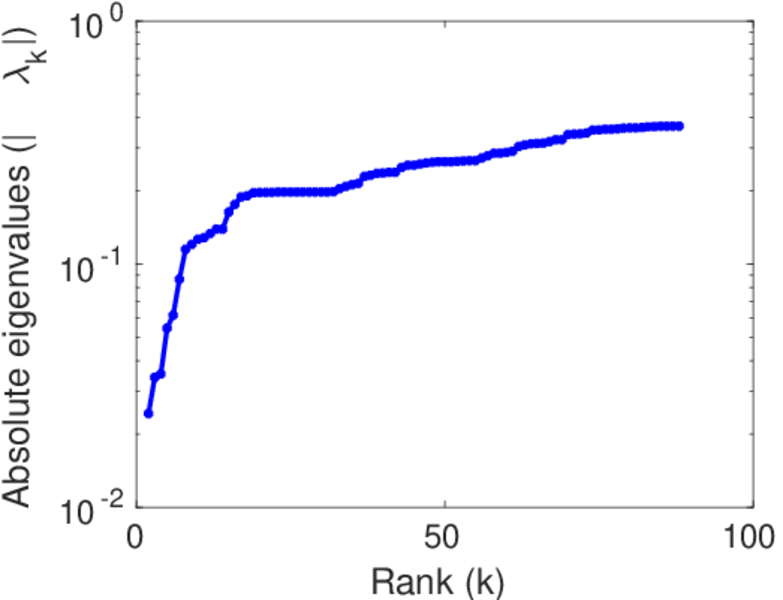
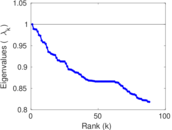
| Algebraic connectivity | a = | 0.024 248 7
|
| Spectral separation | |λ1[A] / λ2[A]| = | 1.396 74
|
| Controllability | C = | 11,260
|
| Relative controllability | Cr = | 0.882 722
|
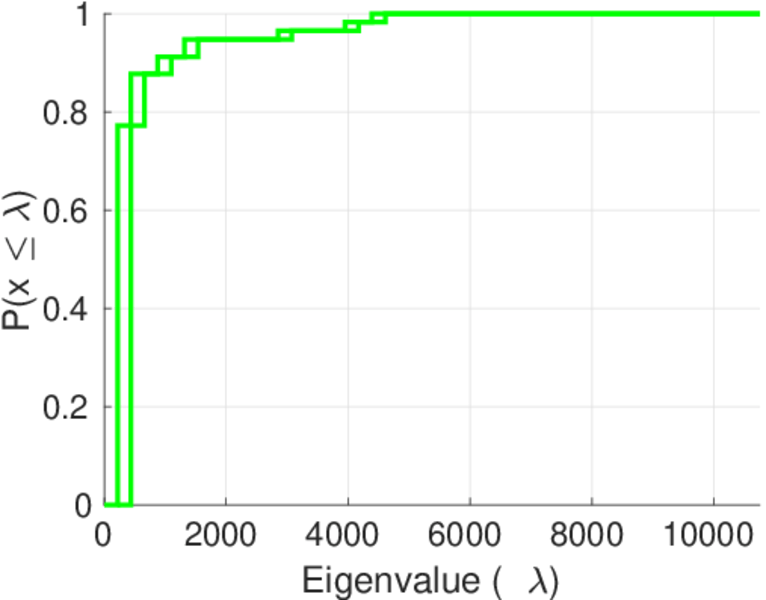
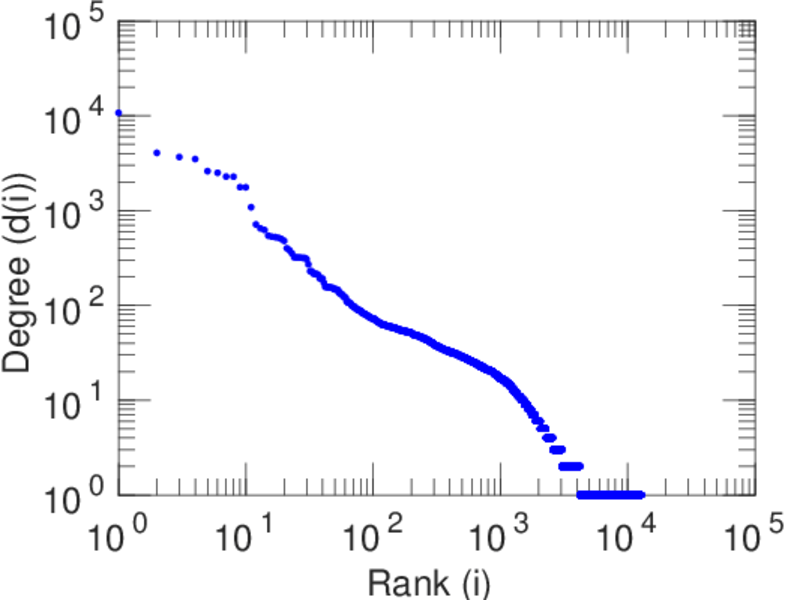
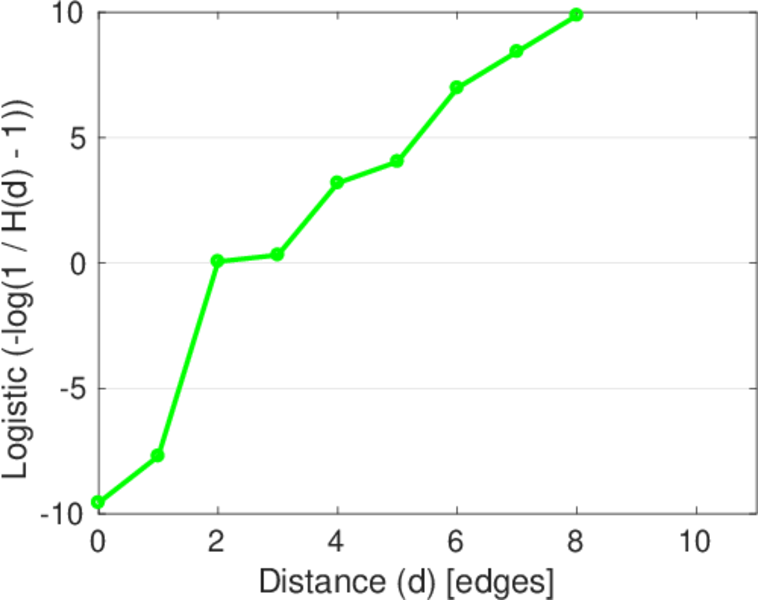
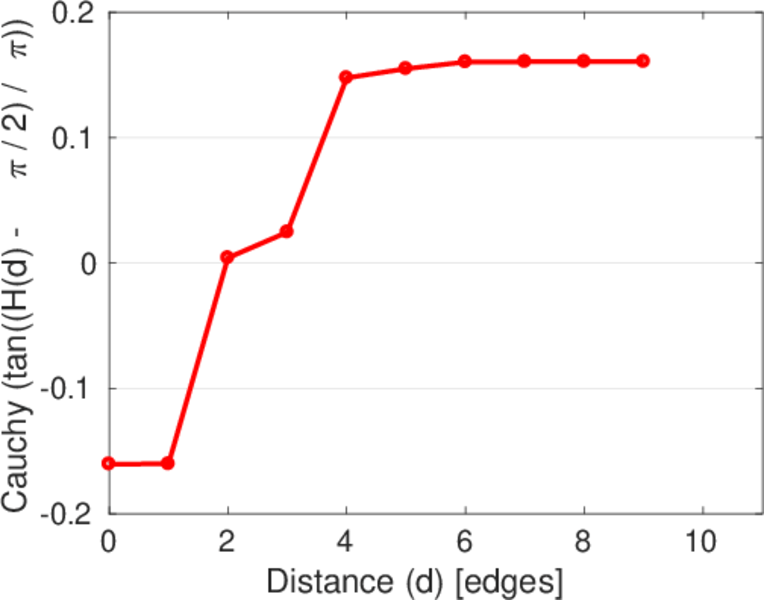
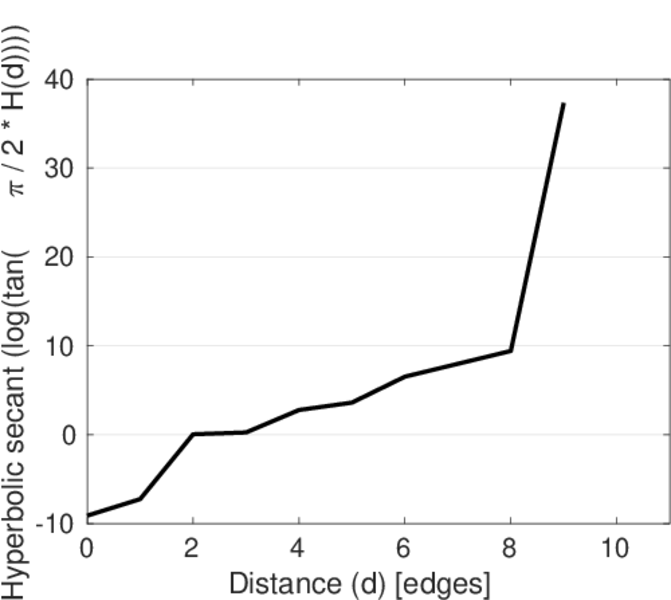
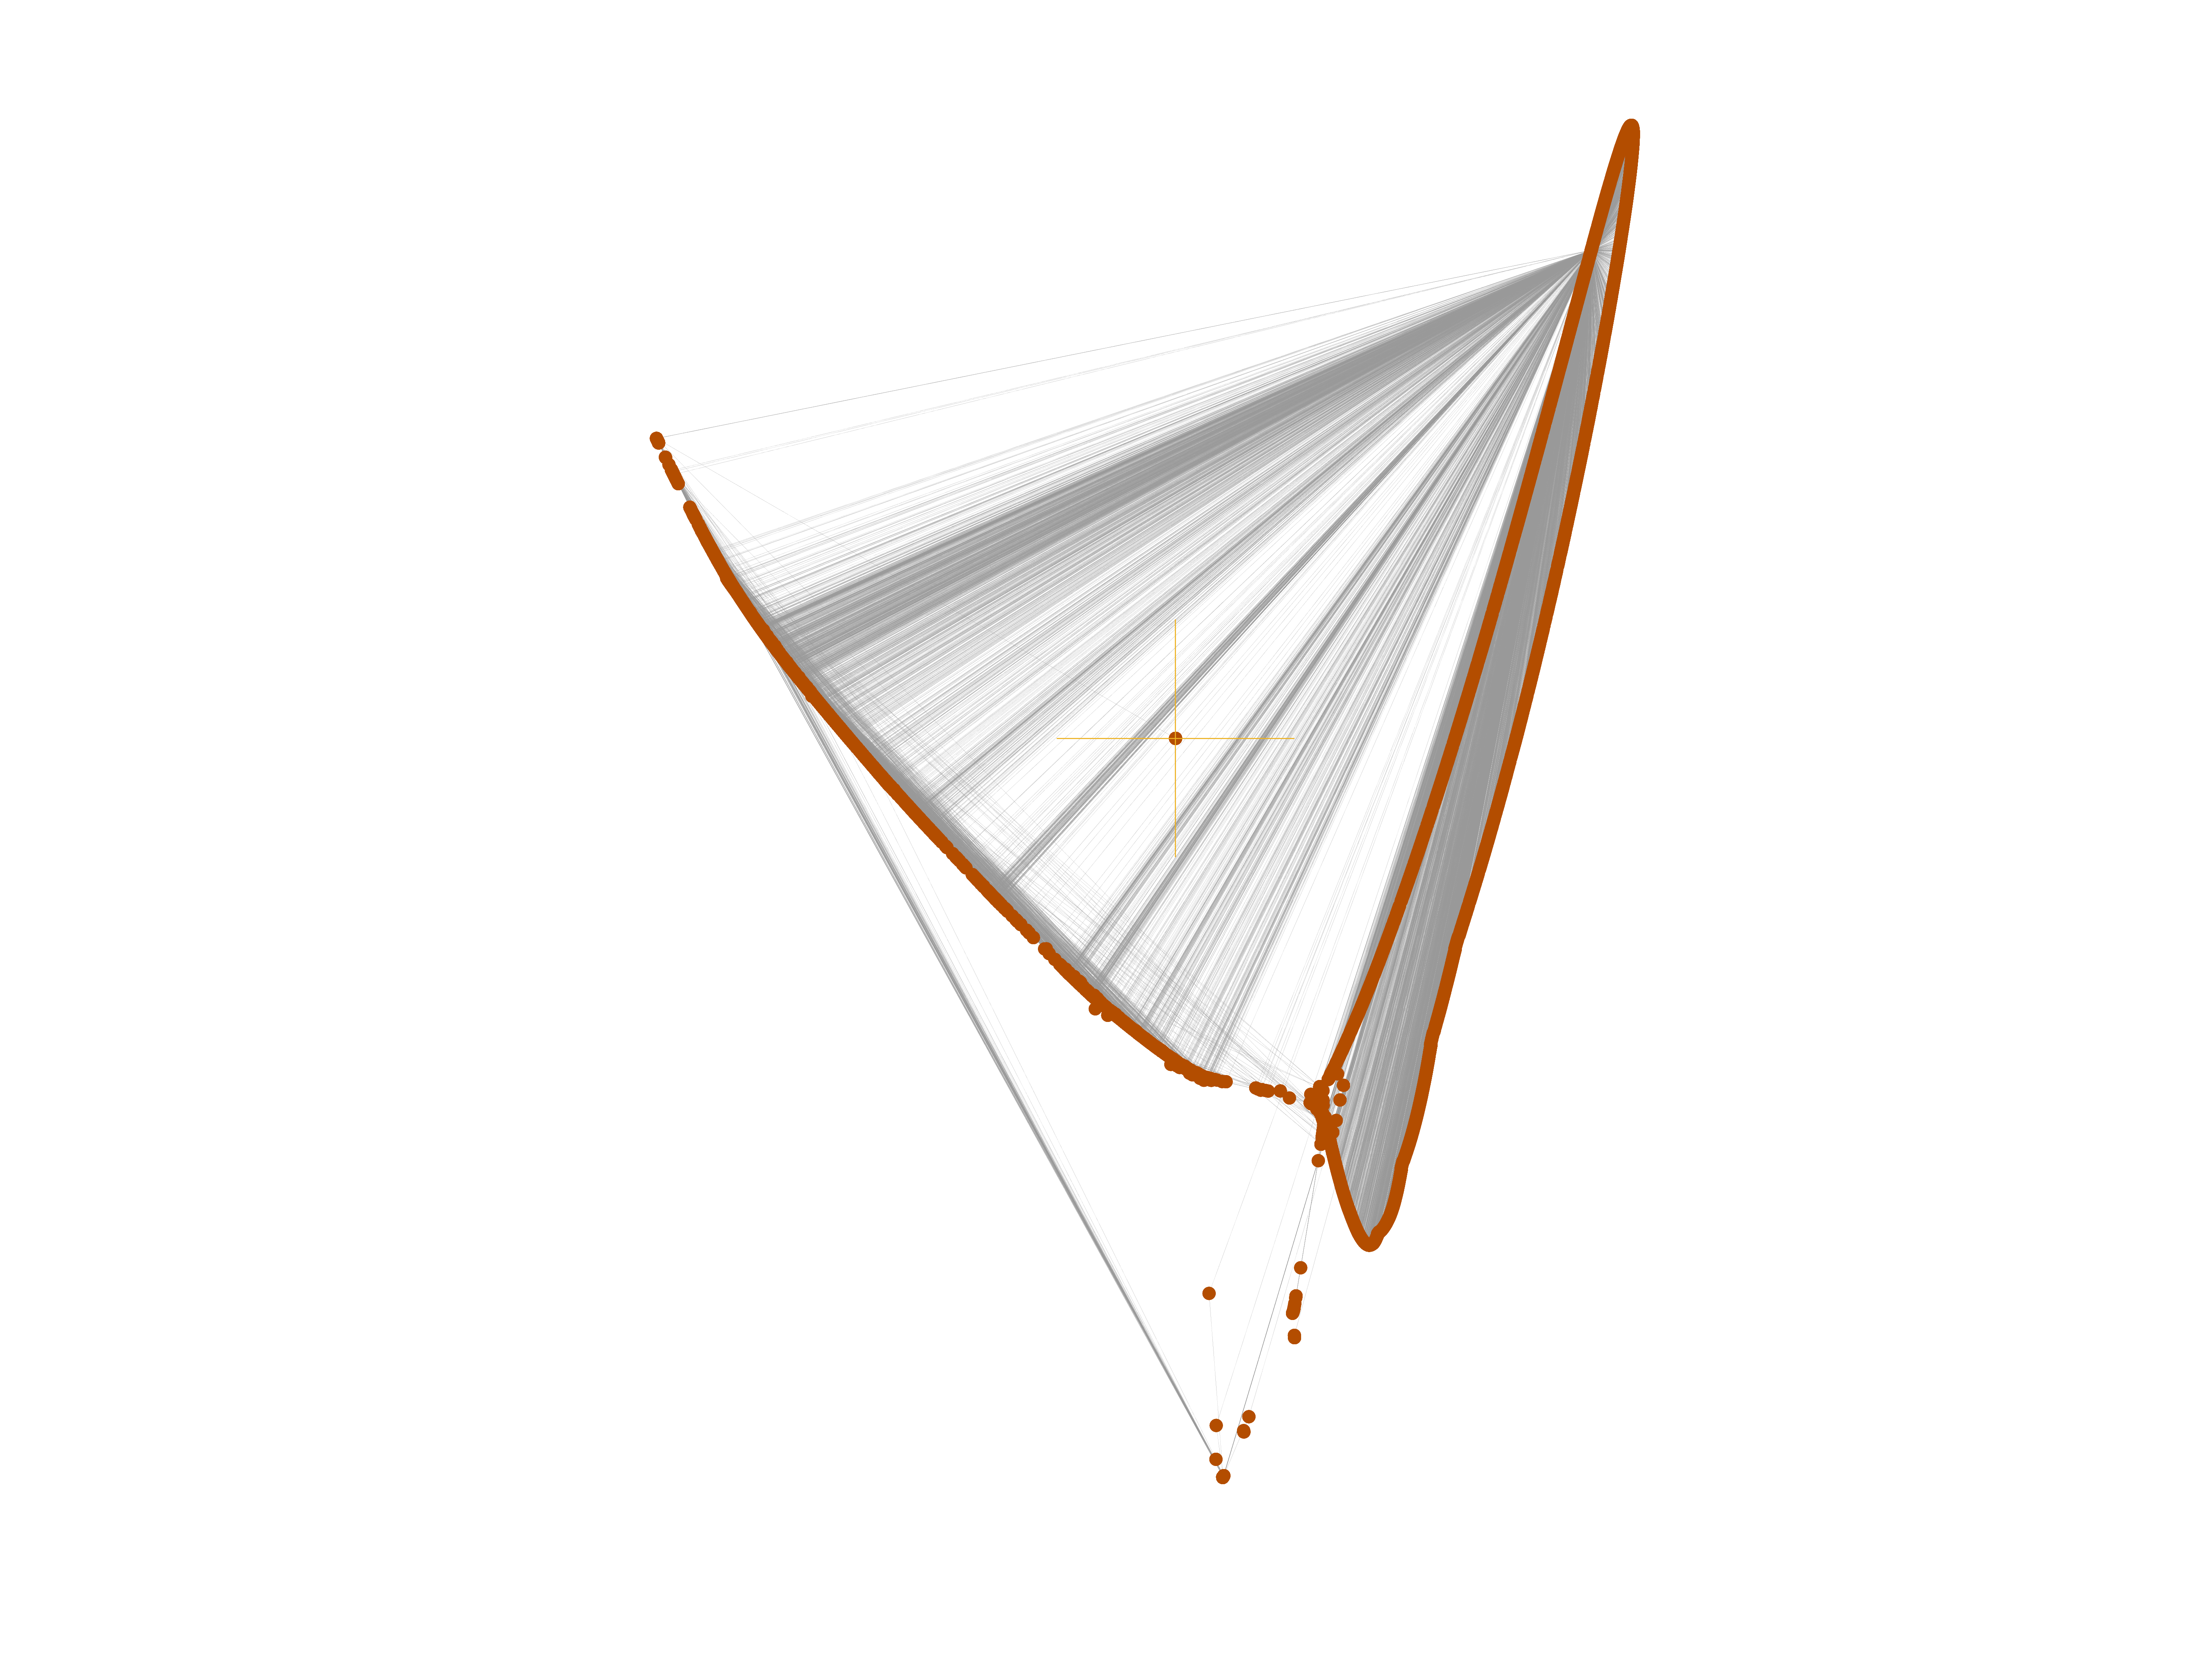
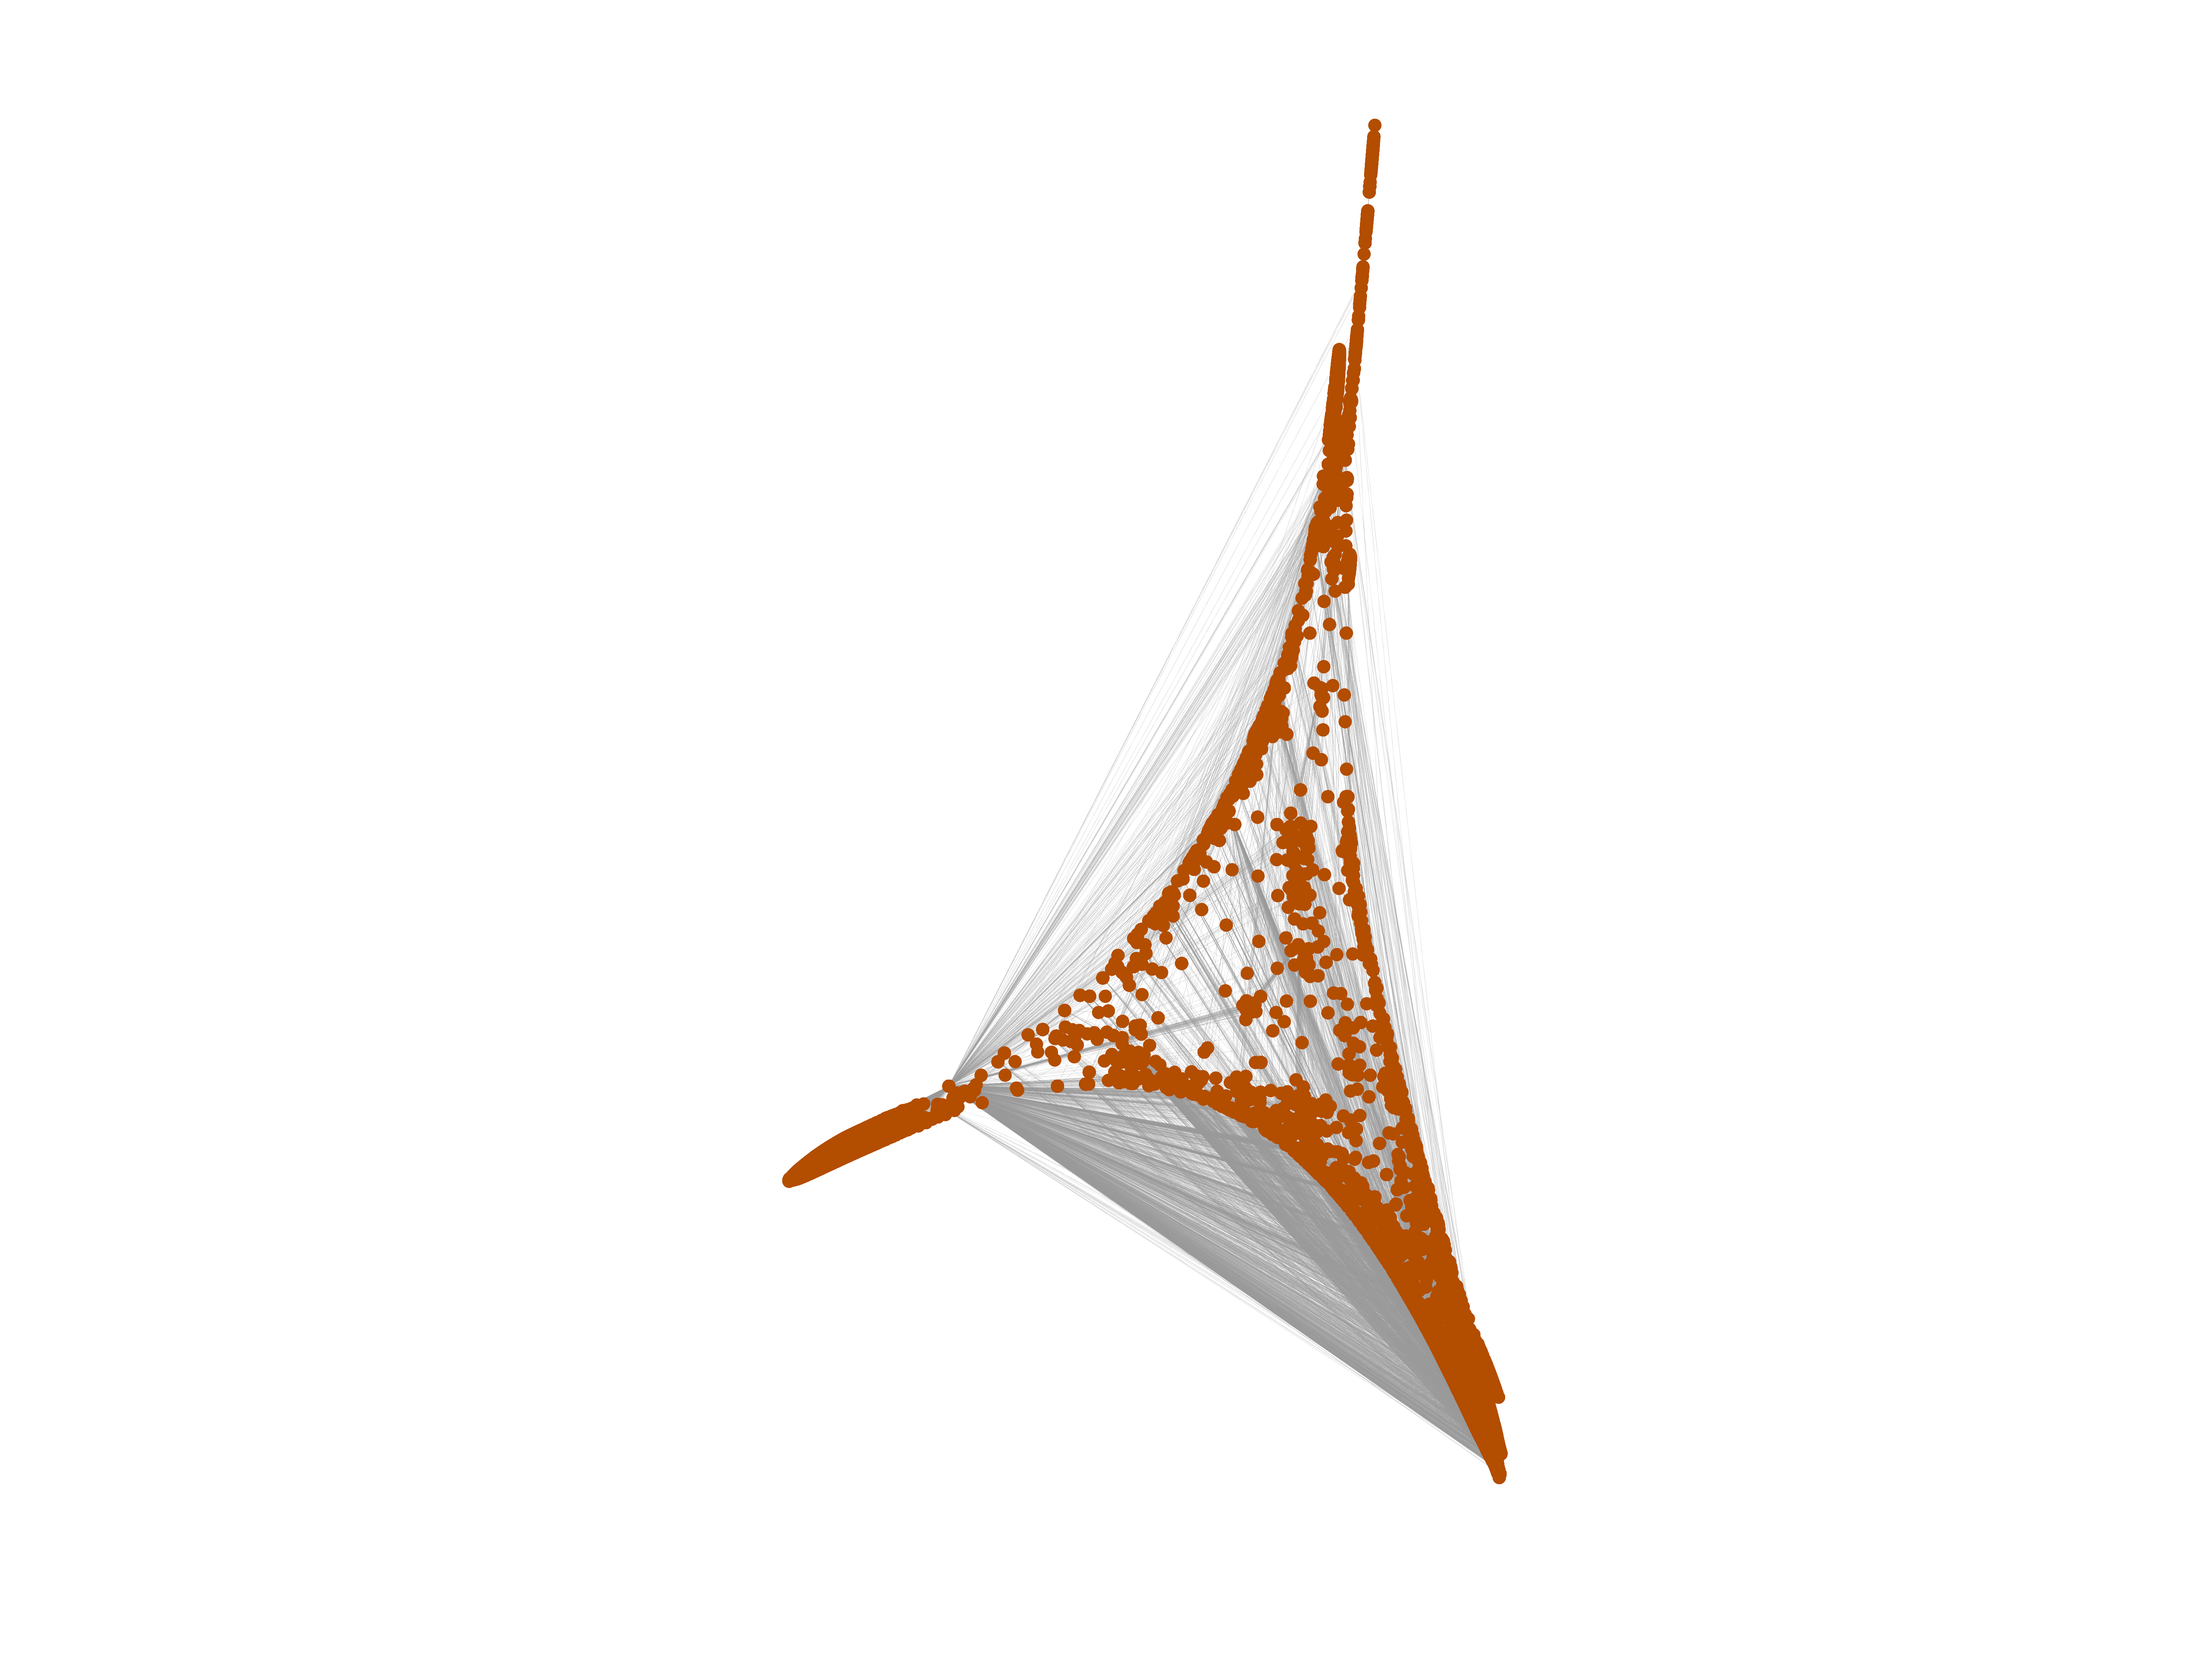
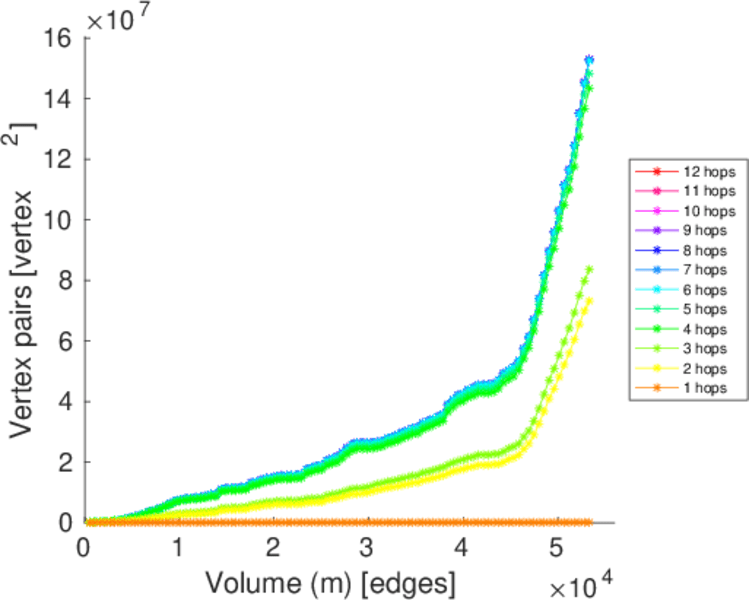
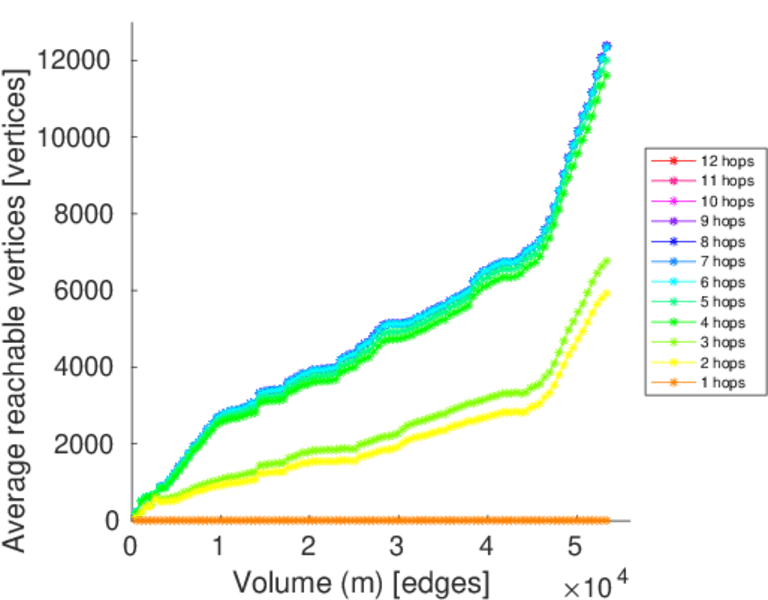
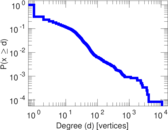
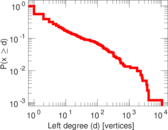
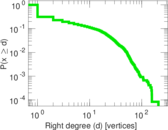
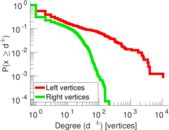
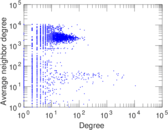
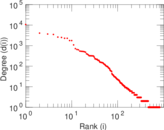
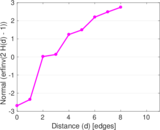
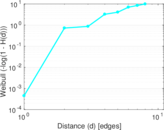
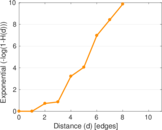
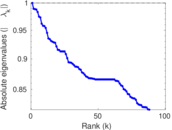
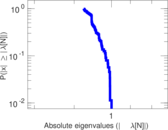
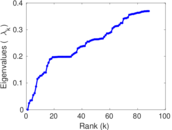
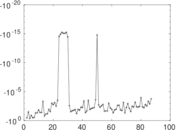
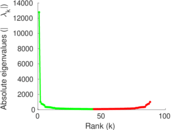
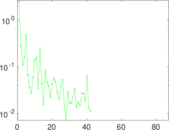
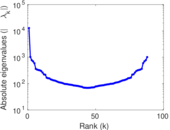
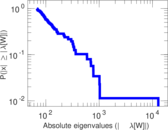
Plots


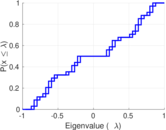

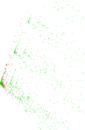


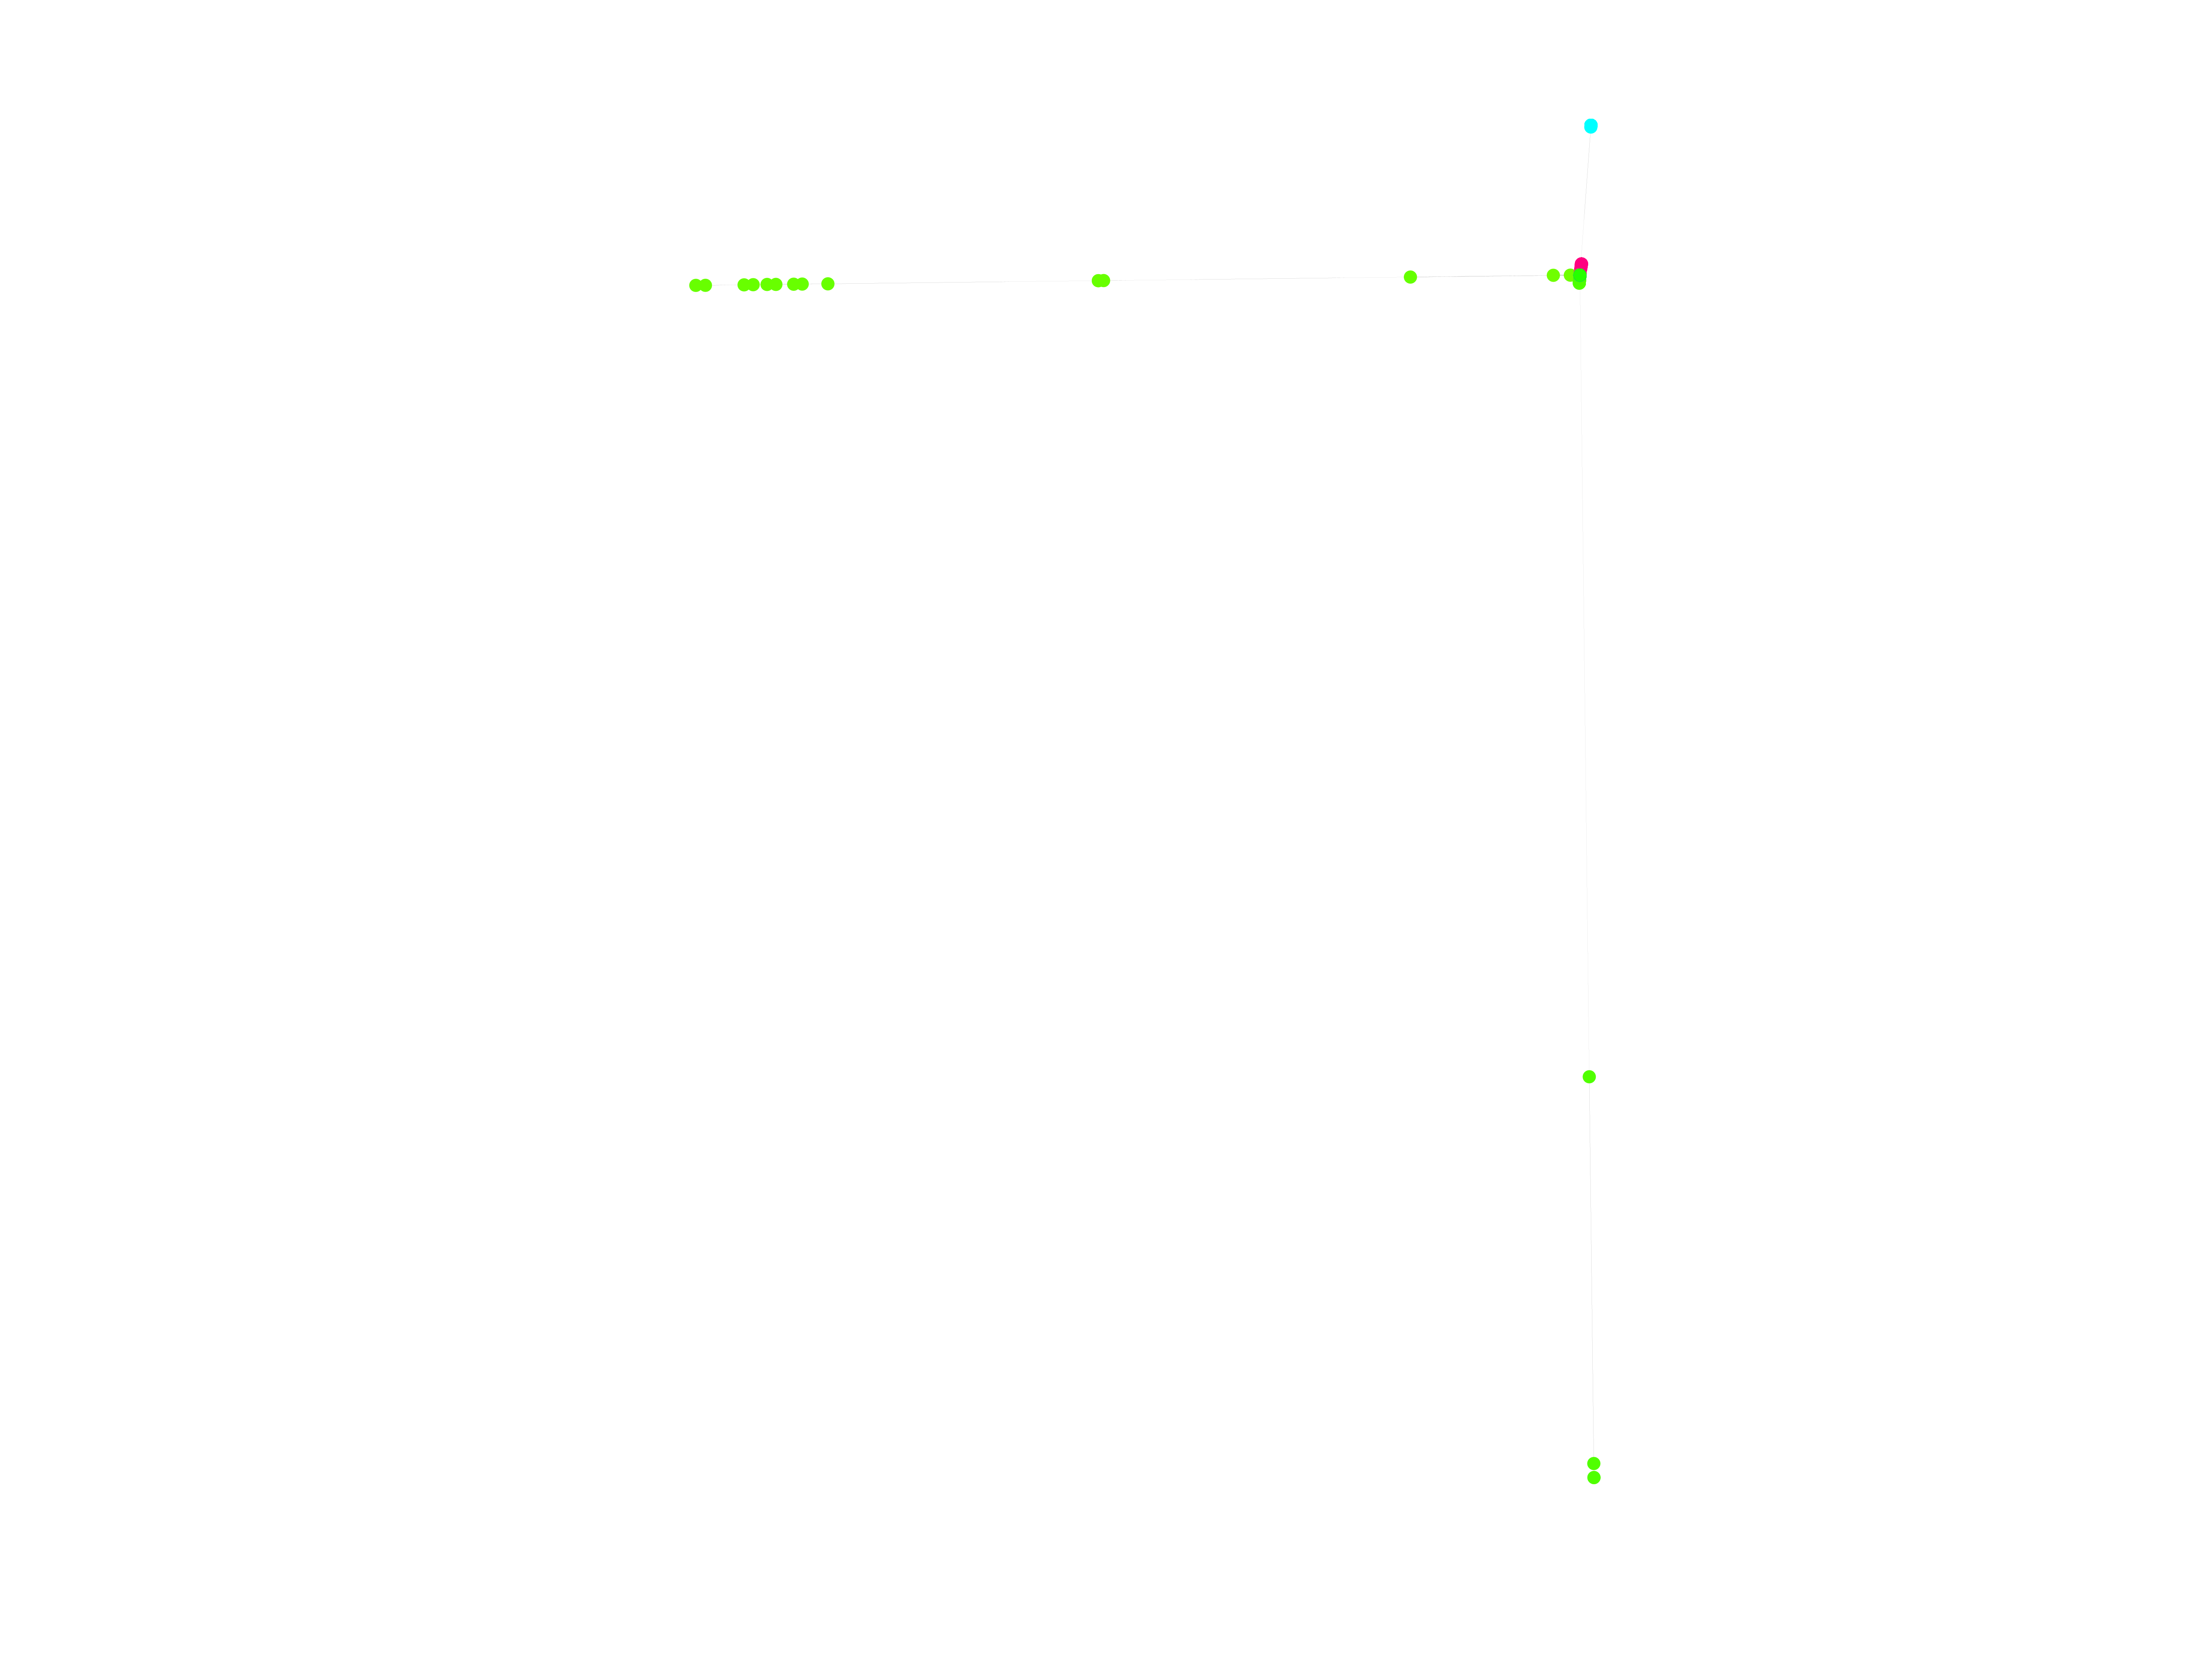
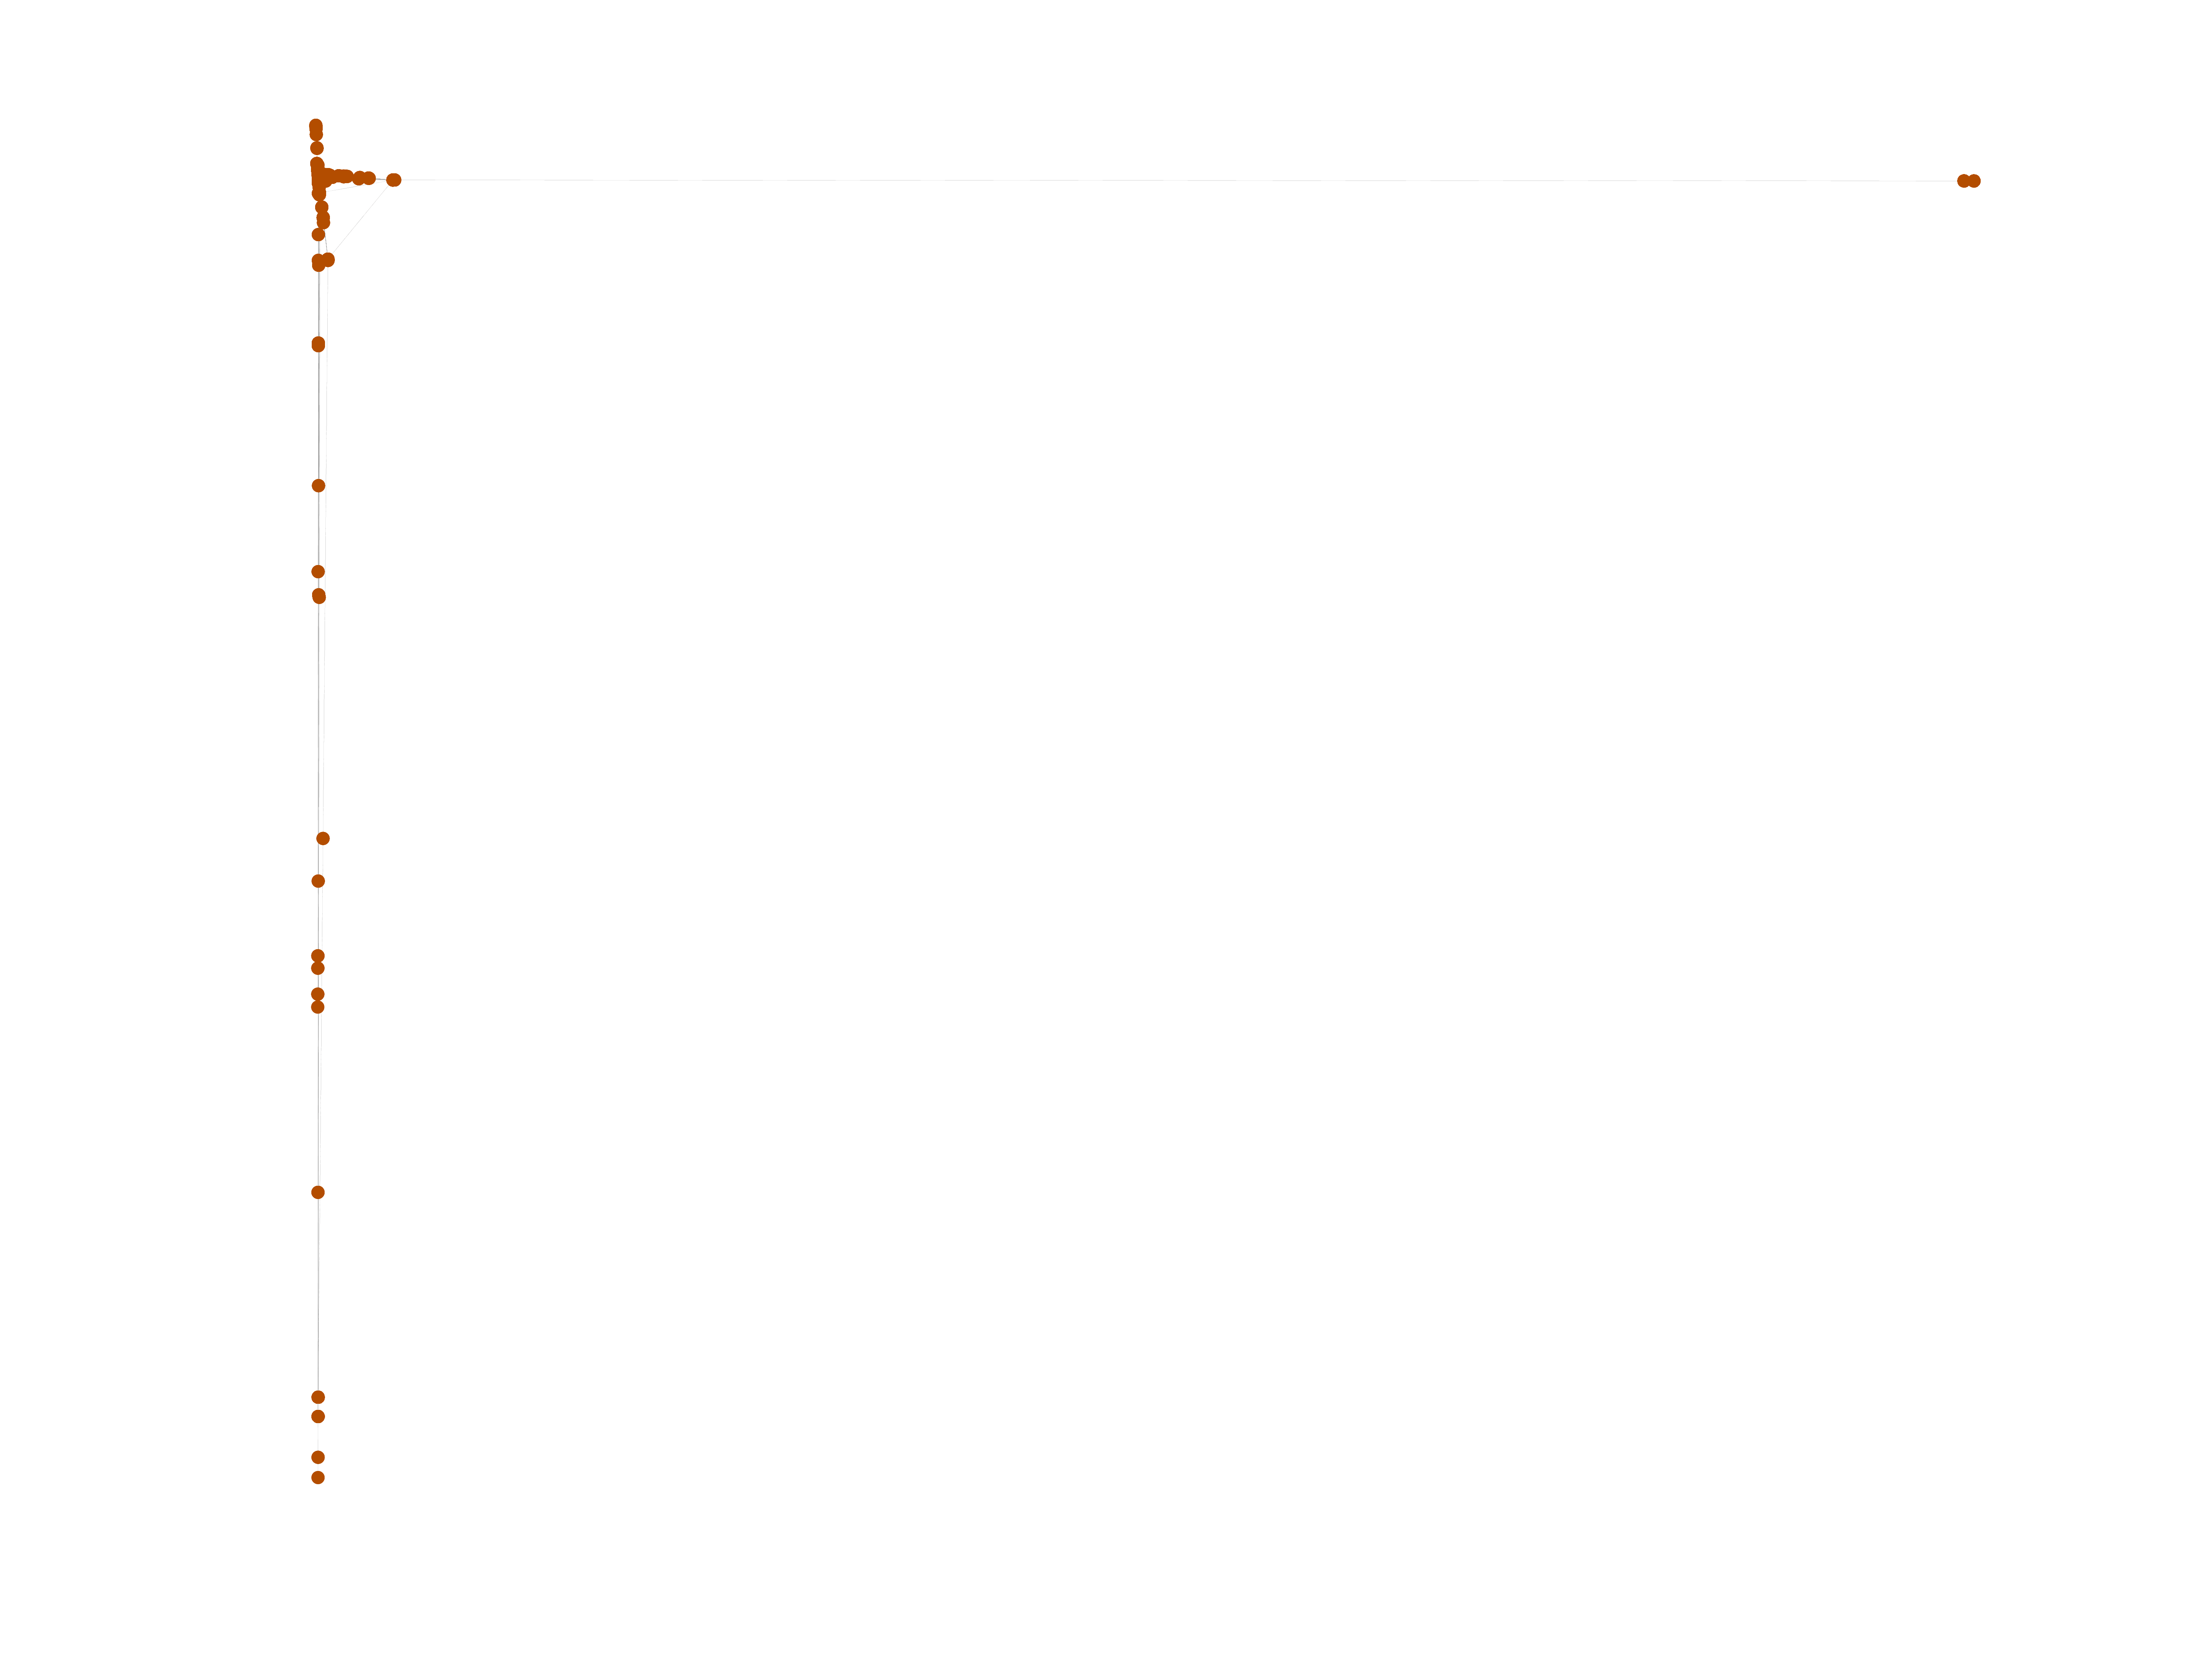
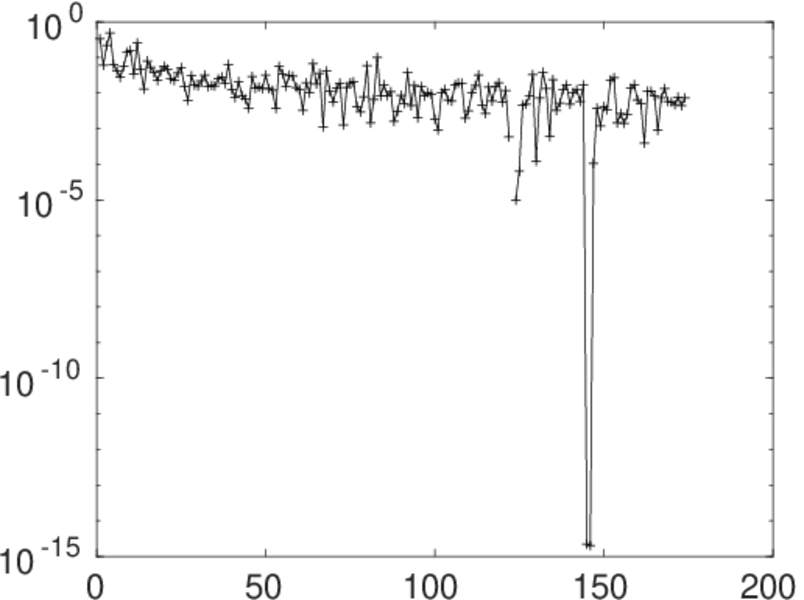
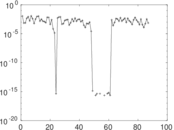
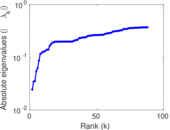
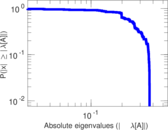
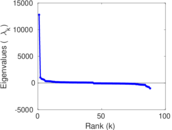
Matrix decompositions plots


Downloads
References
|
[1]
|
Jérôme Kunegis.
KONECT – The Koblenz Network Collection.
In Proc. Int. Conf. on World Wide Web Companion, pages
1343–1350, 2013.
[ http ]
|
|
[2]
|
Wikimedia Foundation.
Wikimedia downloads.
http://dumps.wikimedia.org/, January 2010.
|
 KONECT ‣ Networks ‣
Buy Me a Coffee
KONECT ‣ Networks ‣
Buy Me a Coffee