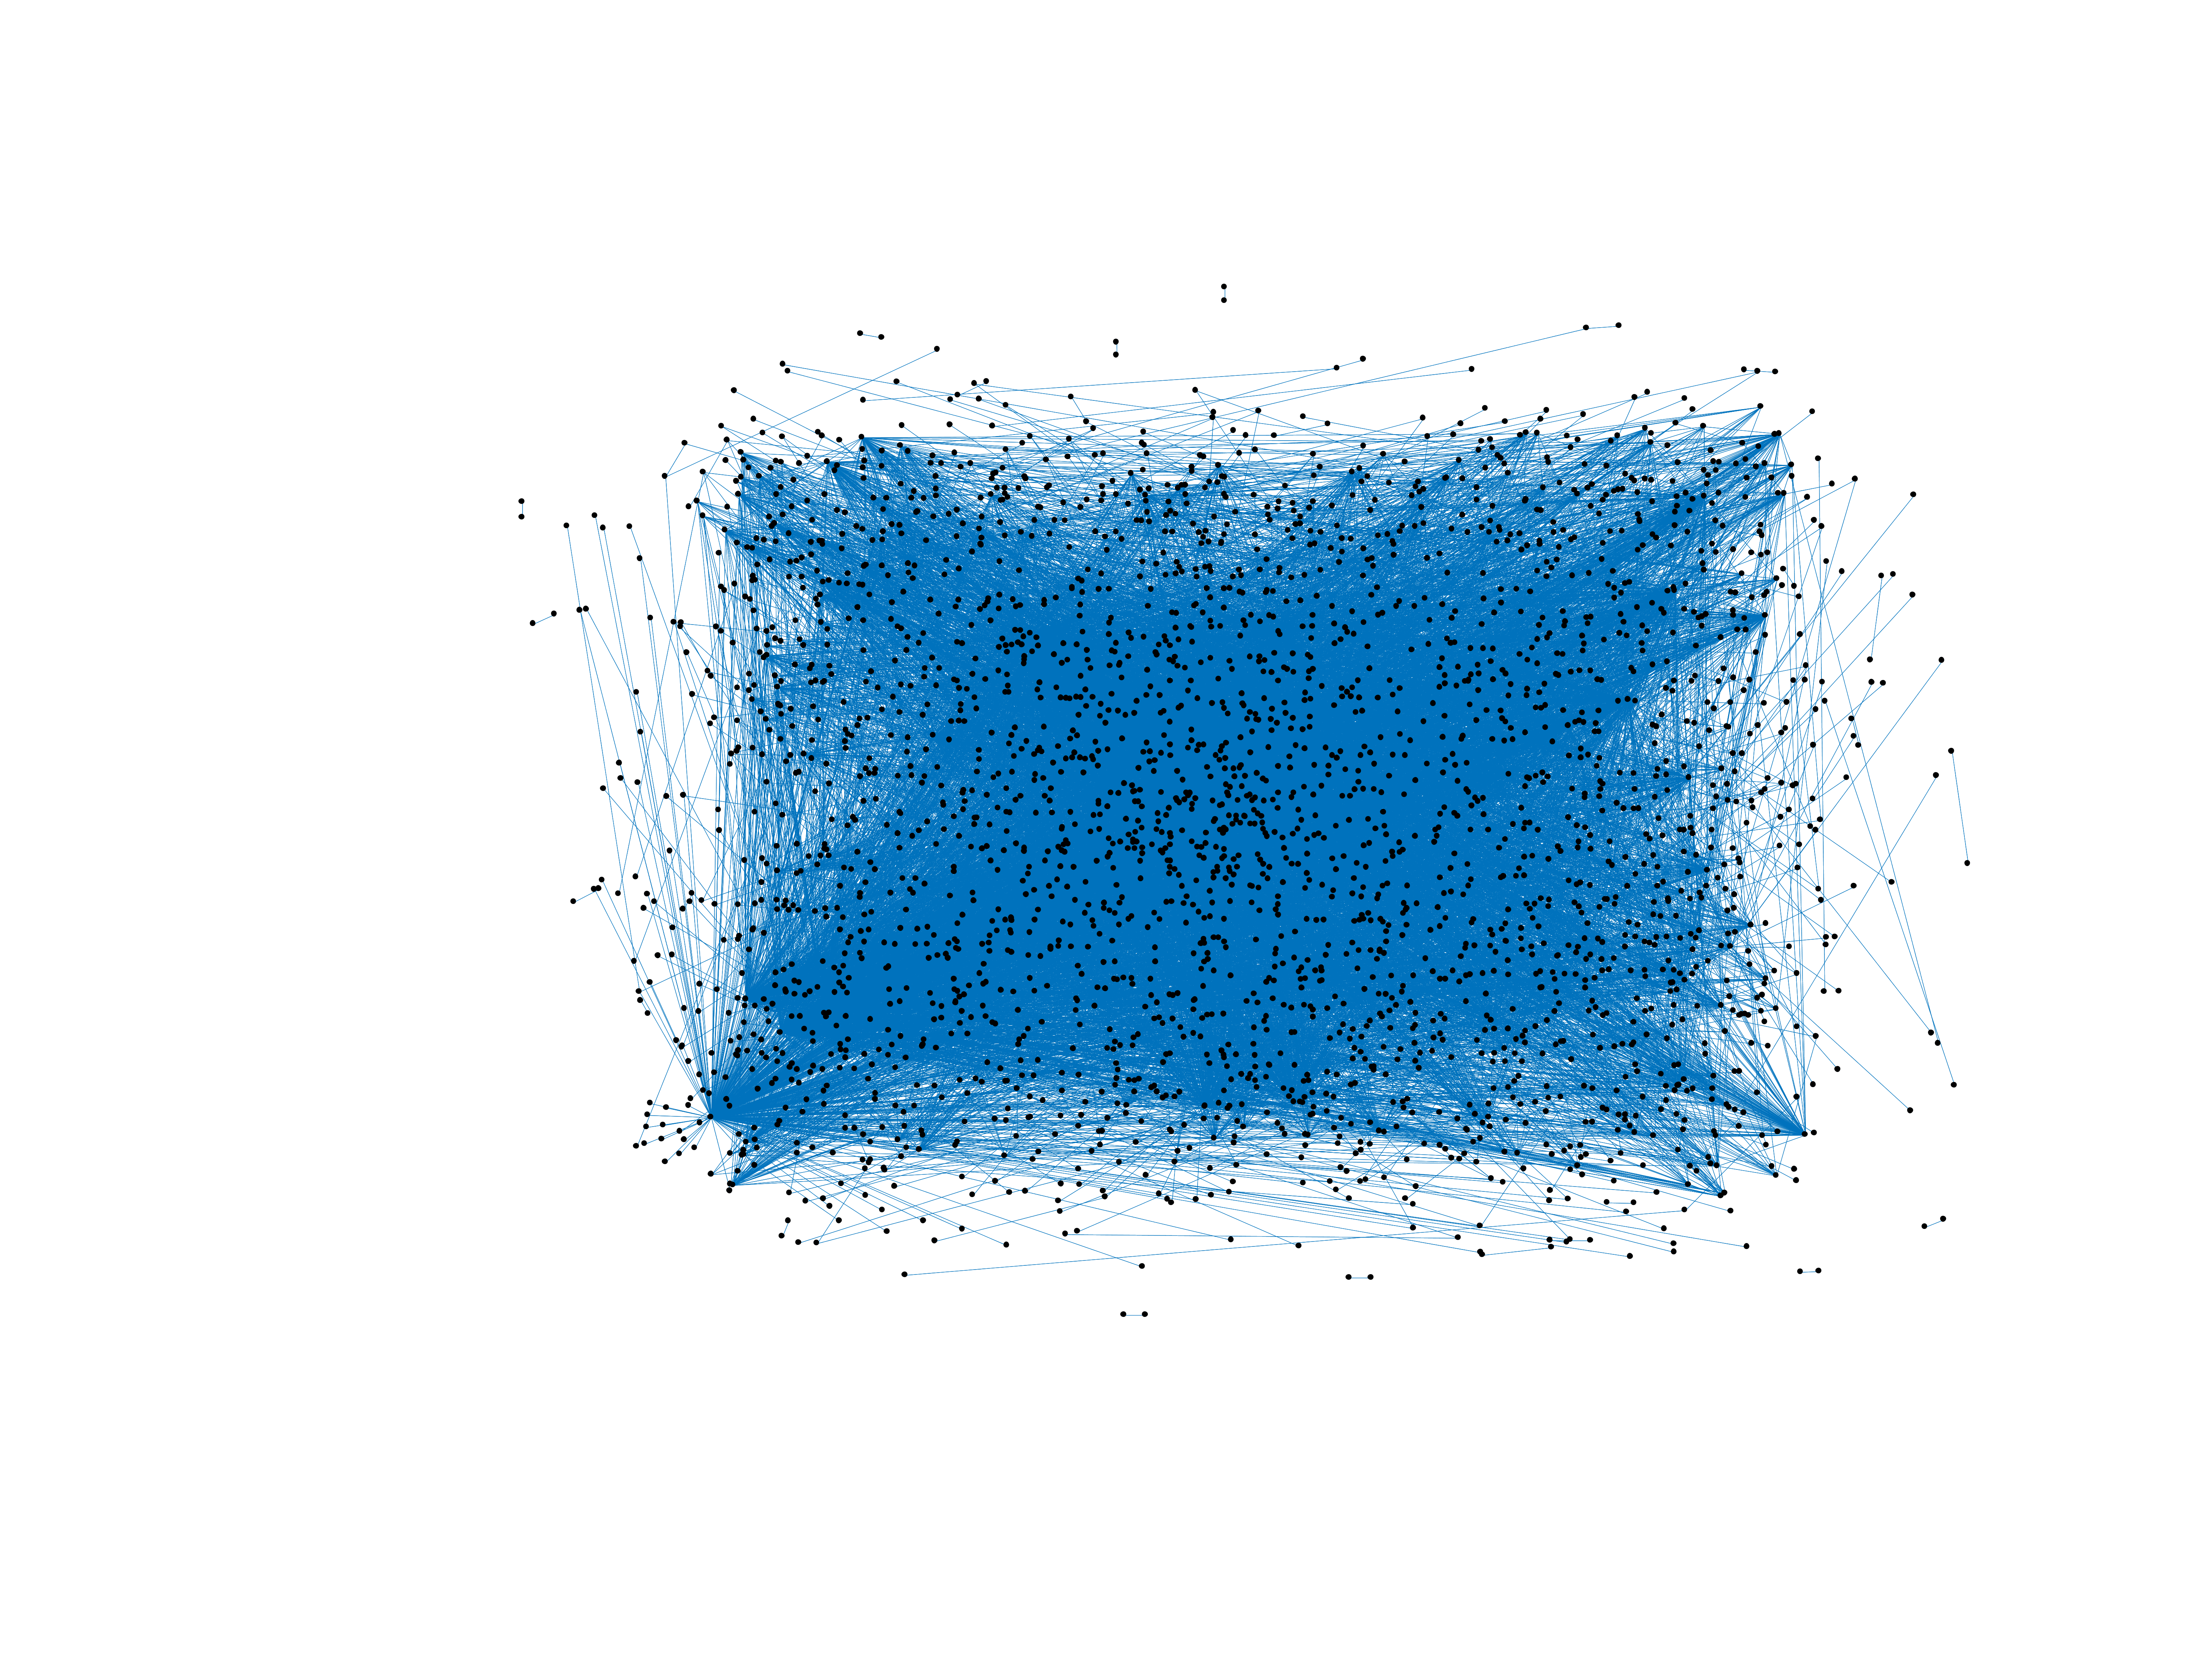
Wikipedia edits (bm)
This is the bipartite edit network of the Bambara Wikipedia. It contains users
and pages from the Bambara Wikipedia, connected by edit events. Each edge
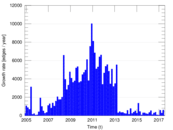
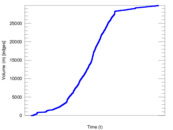
represents an edit. The dataset includes the timestamp of each edit.
Metadata
Statistics
| Size | n = | 3,040
|
| Left size | n1 = | 783
|
| Right size | n2 = | 2,257
|
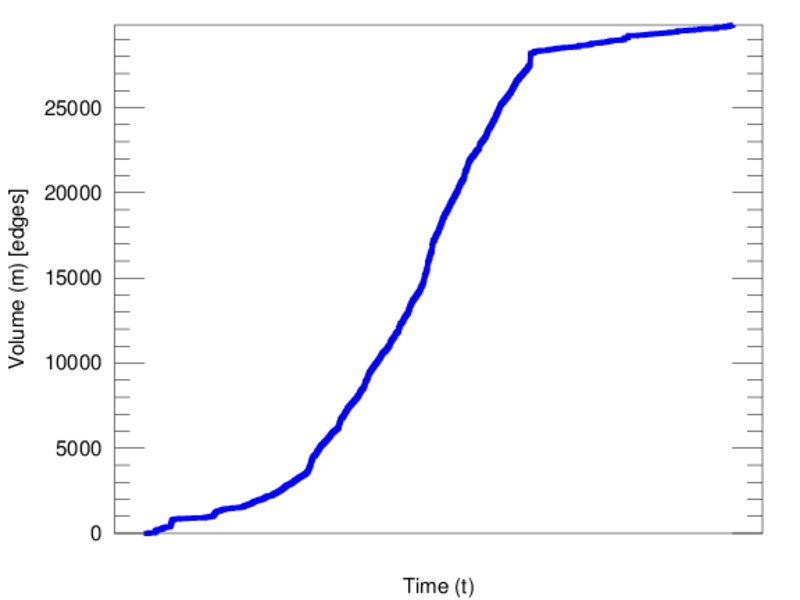
| Volume | m = | 29,856
|
| Unique edge count | m̿ = | 12,136
|
| Wedge count | s = | 1,215,536
|
| Claw count | z = | 108,016,821
|
| Cross count | x = | 9,402,985,233
|
| Square count | q = | 4,984,198
|
| 4-Tour count | T4 = | 44,768,272
|
| Maximum degree | dmax = | 2,562
|
| Maximum left degree | d1max = | 2,562
|
| Maximum right degree | d2max = | 242
|
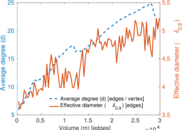
| Average degree | d = | 19.642 1
|
| Average left degree | d1 = | 38.130 3
|
| Average right degree | d2 = | 13.228 2
|
| Fill | p = | 0.006 867 24
|
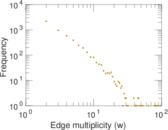
| Average edge multiplicity | m̃ = | 2.460 12
|
| Size of LCC | N = | 2,295
|
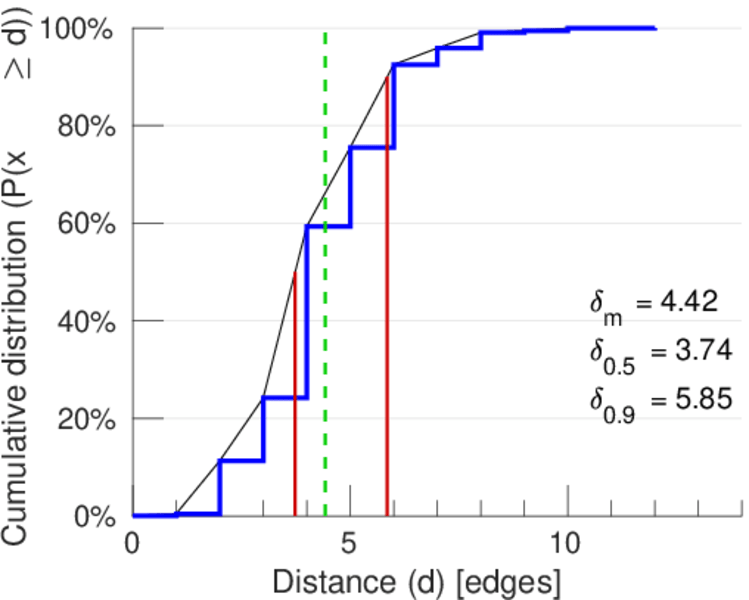
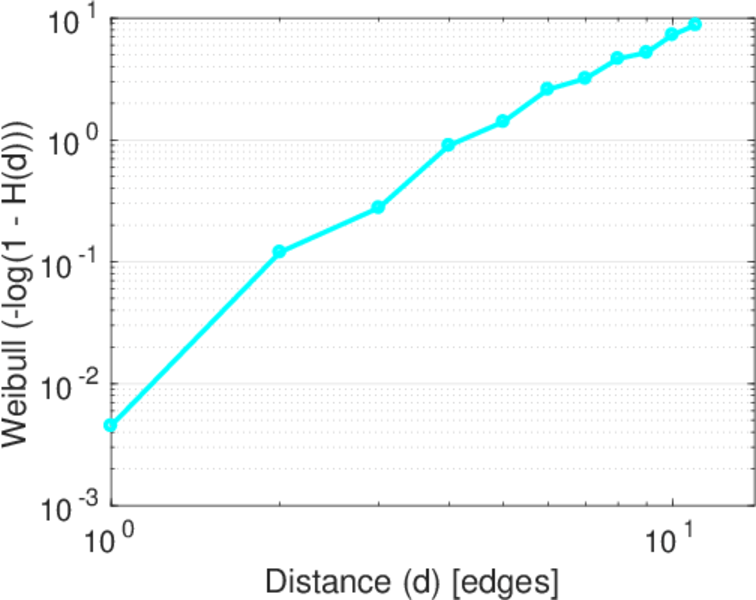
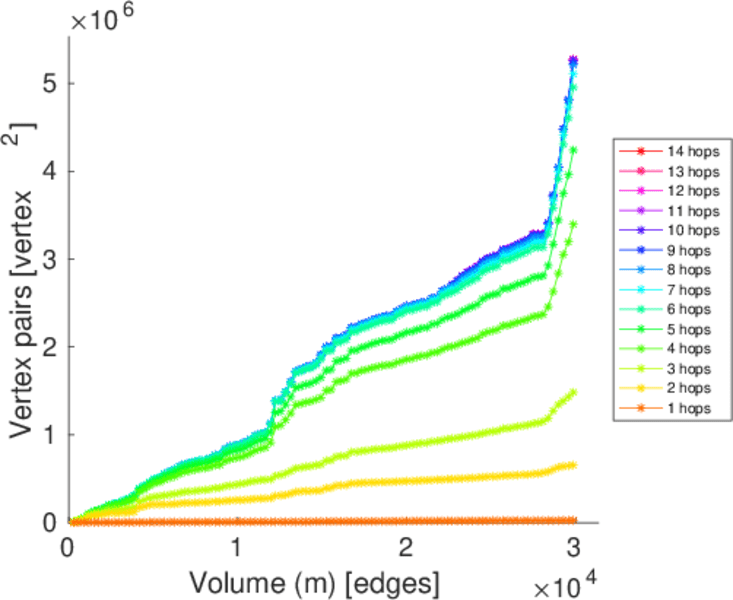
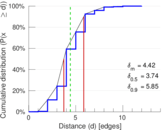
| Diameter | δ = | 14
|
| 50-Percentile effective diameter | δ0.5 = | 3.735 34
|
| 90-Percentile effective diameter | δ0.9 = | 5.852 74
|
| Median distance | δM = | 4
|
| Mean distance | δm = | 4.424 95
|
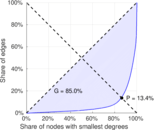
| Gini coefficient | G = | 0.839 249
|
| Balanced inequality ratio | P = | 0.151 410
|
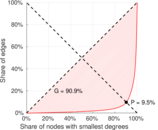
| Left balanced inequality ratio | P1 = | 0.095 324 2
|
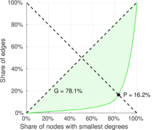
| Right balanced inequality ratio | P2 = | 0.162 346
|
| Relative edge distribution entropy | Her = | 0.811 431
|
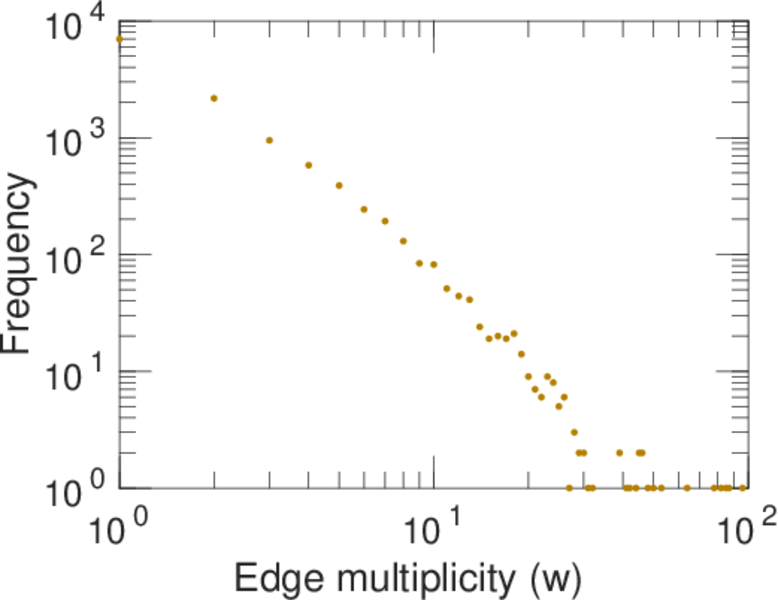
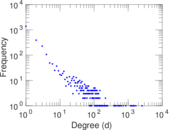
| Power law exponent | γ = | 2.193 96
|
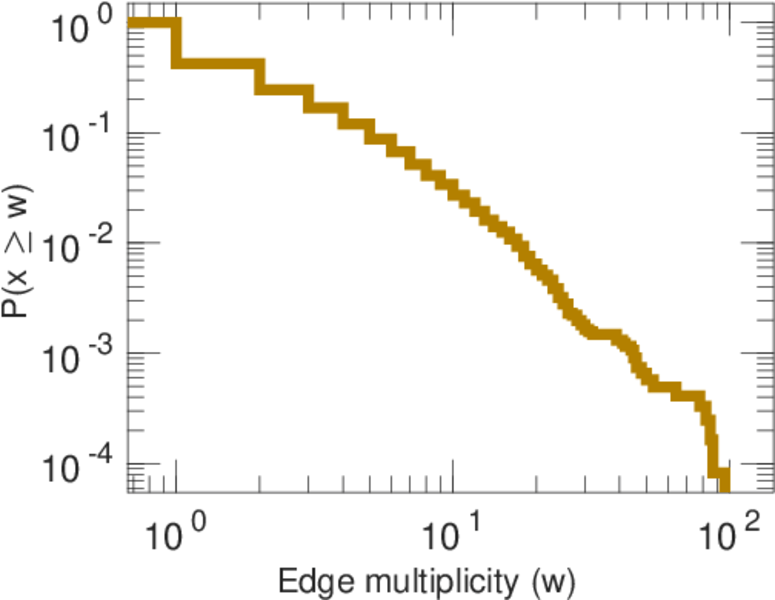
| Tail power law exponent | γt = | 1.771 00
|
| Tail power law exponent with p | γ3 = | 1.771 00
|
| p-value | p = | 0.000 00
|
| Left tail power law exponent with p | γ3,1 = | 1.691 00
|
| Left p-value | p1 = | 0.000 00
|
| Right tail power law exponent with p | γ3,2 = | 1.801 00
|
| Right p-value | p2 = | 0.000 00
|
| Degree assortativity | ρ = | −0.018 200 0
|
| Degree assortativity p-value | pρ = | 0.044 969 4
|
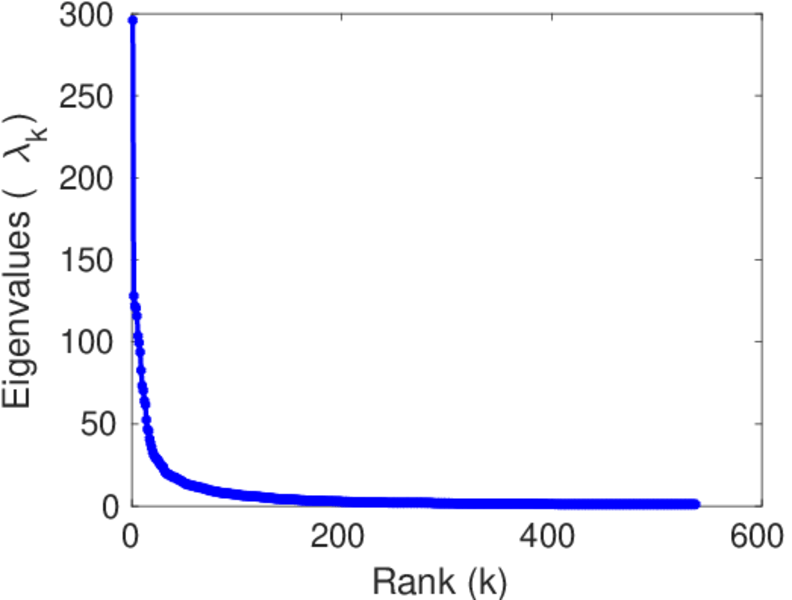
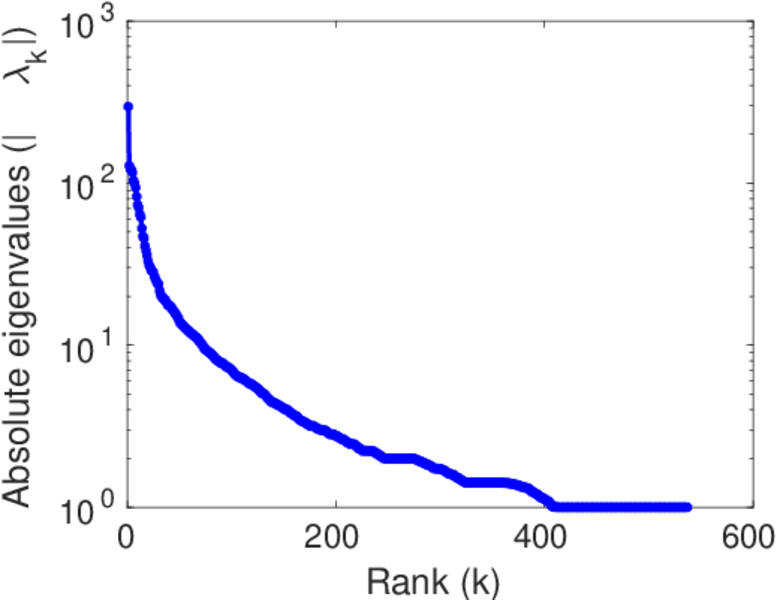
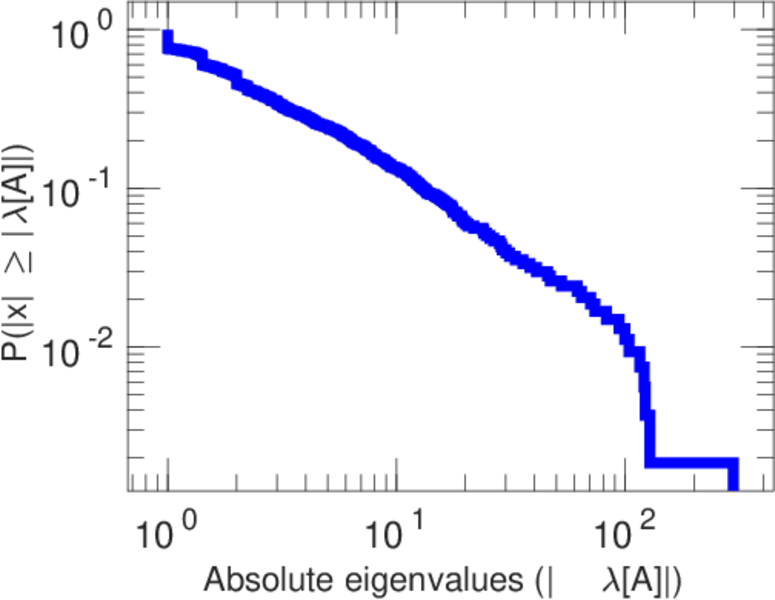
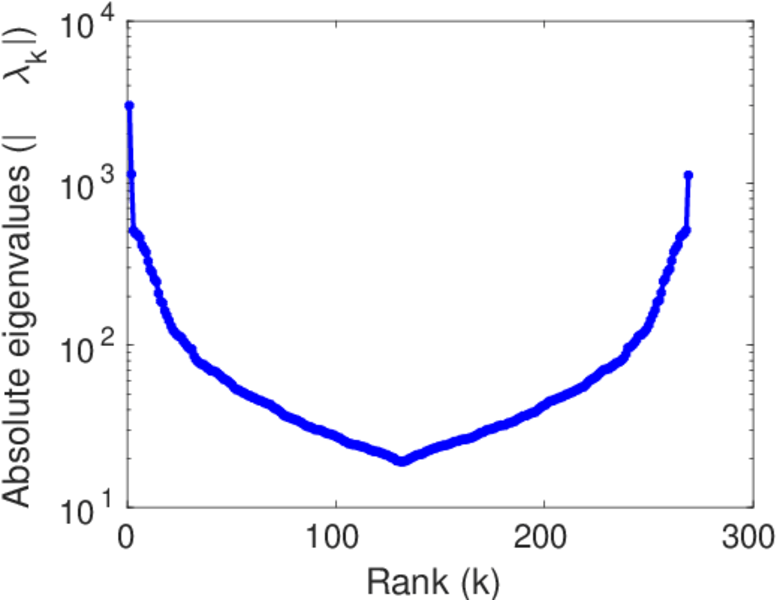
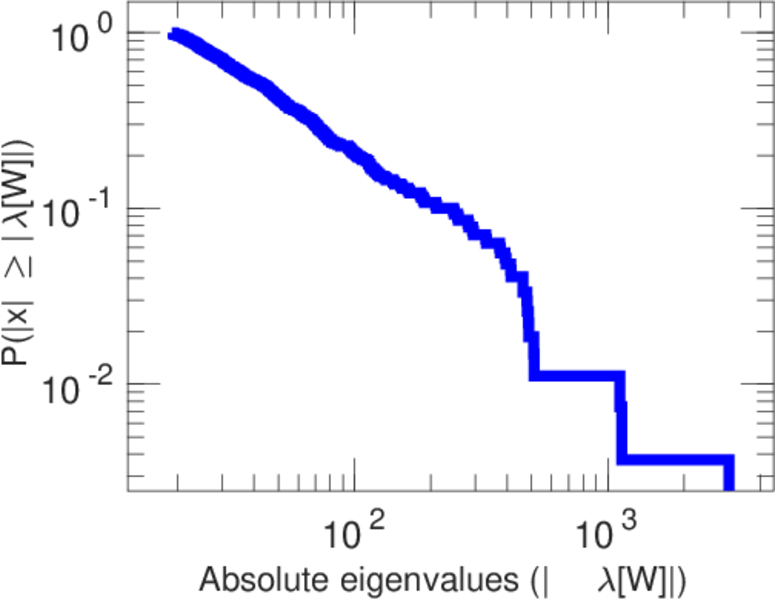
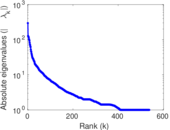
| Spectral norm | α = | 295.971
|
| Algebraic connectivity | a = | 0.022 239 7
|
| Spectral separation | |λ1[A] / λ2[A]| = | 2.311 66
|
| Controllability | C = | 1,489
|
| Relative controllability | Cr = | 0.509 932
|
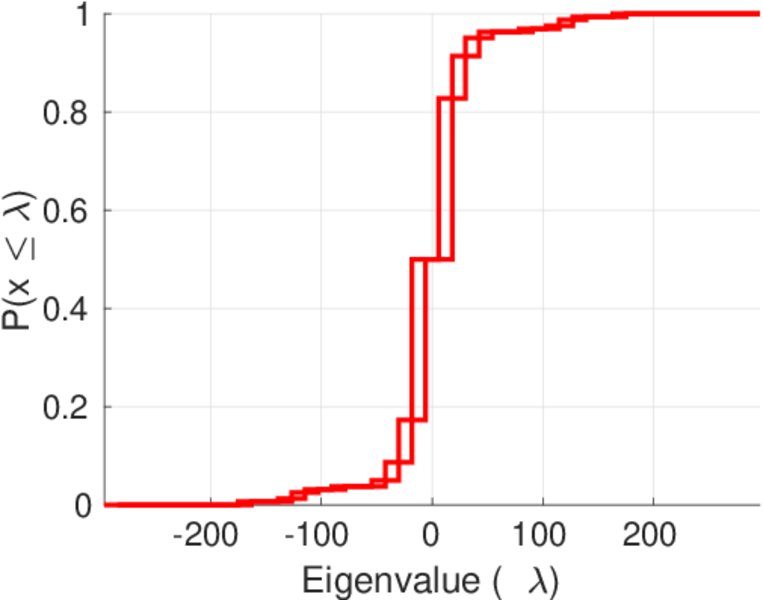
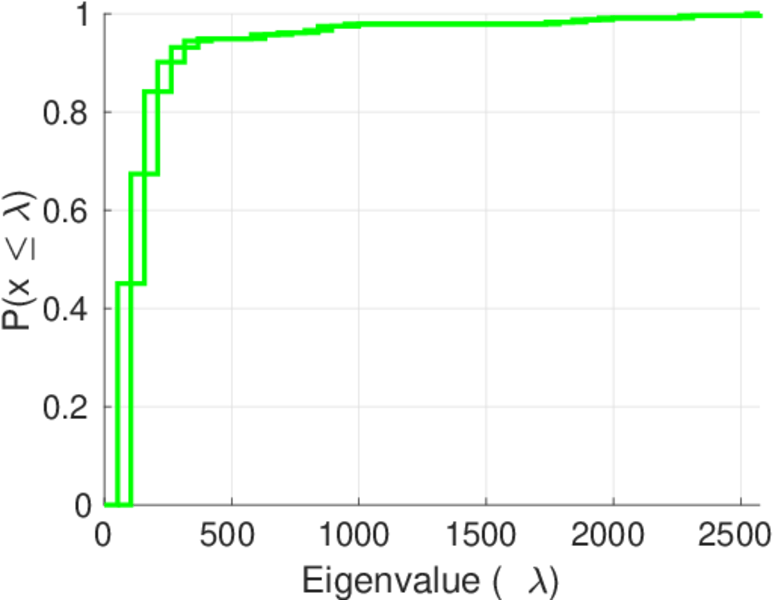
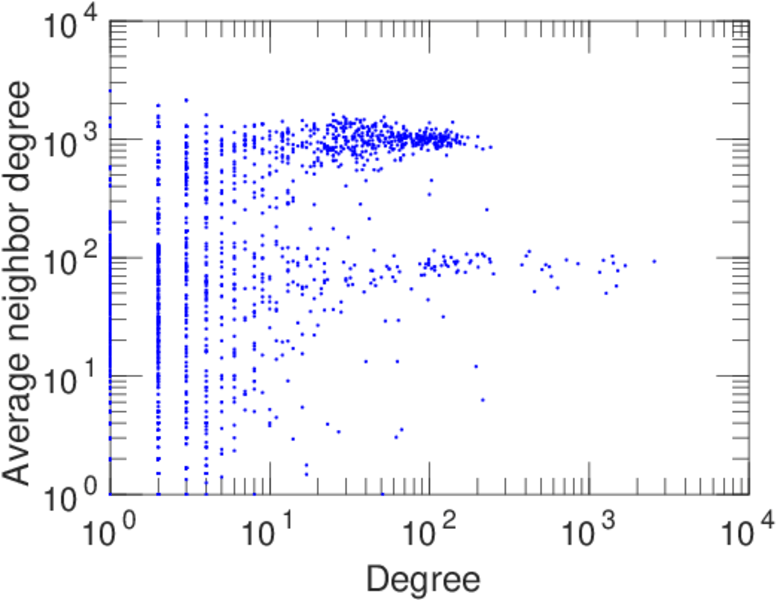
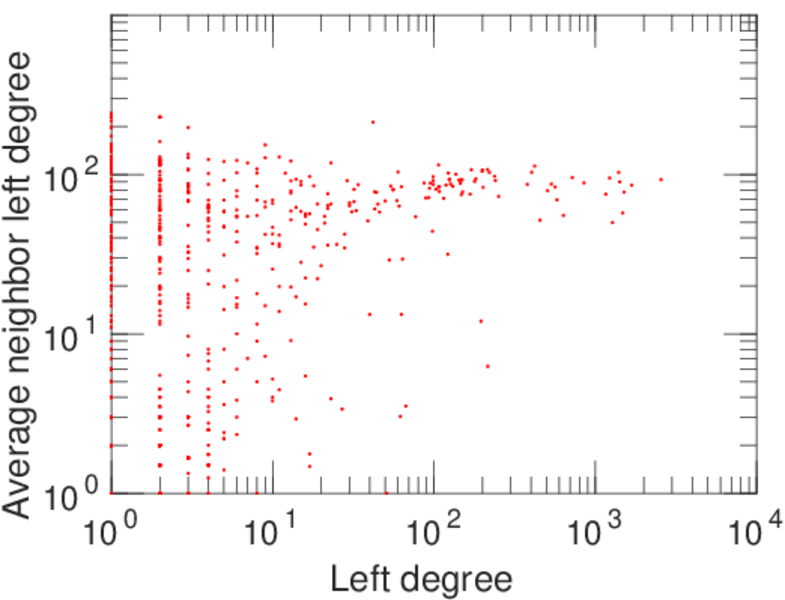
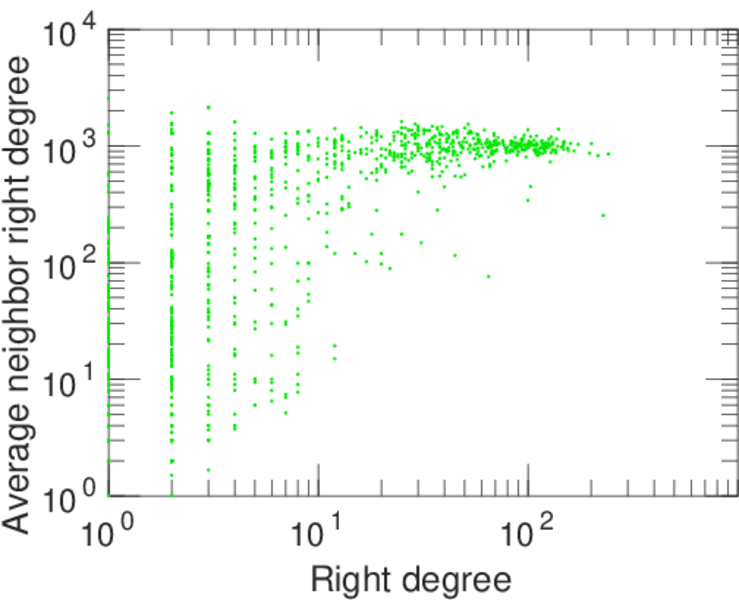
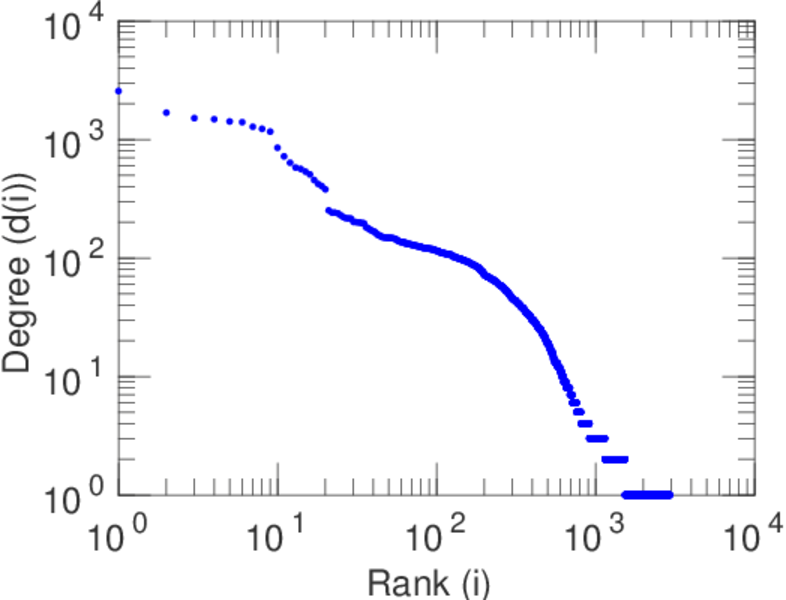
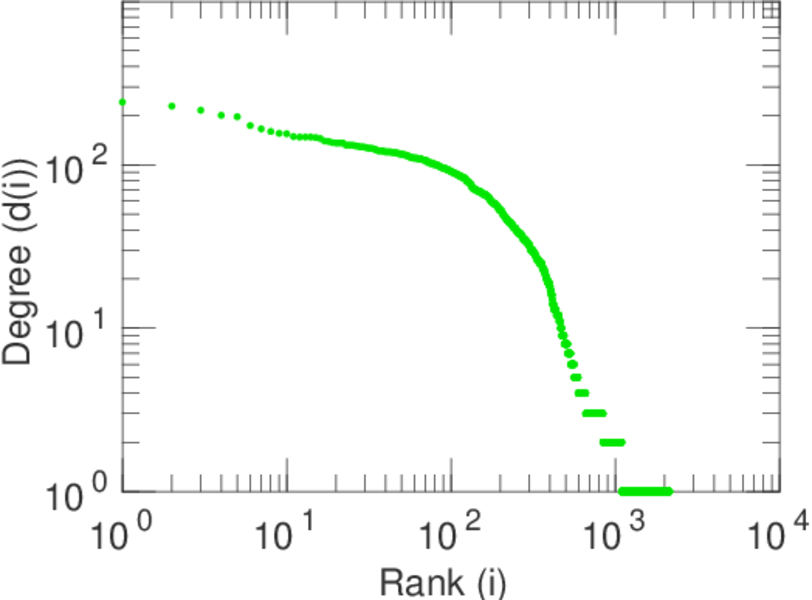
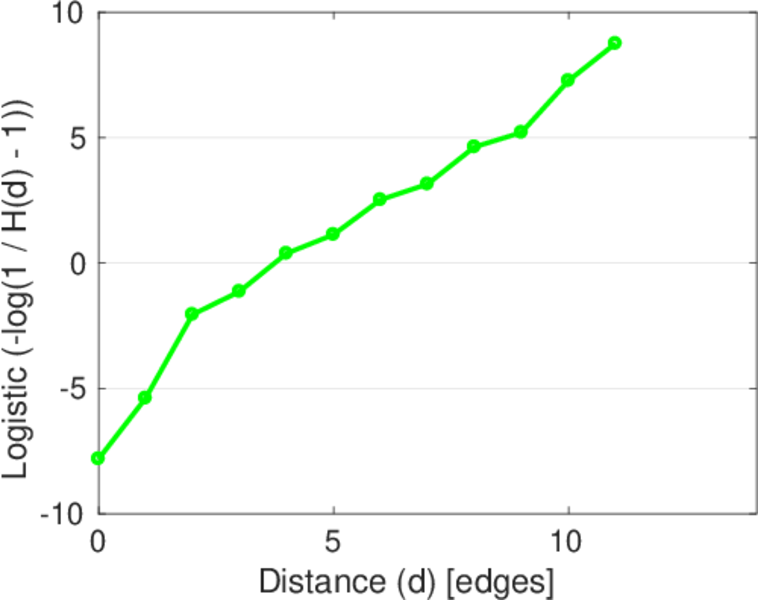
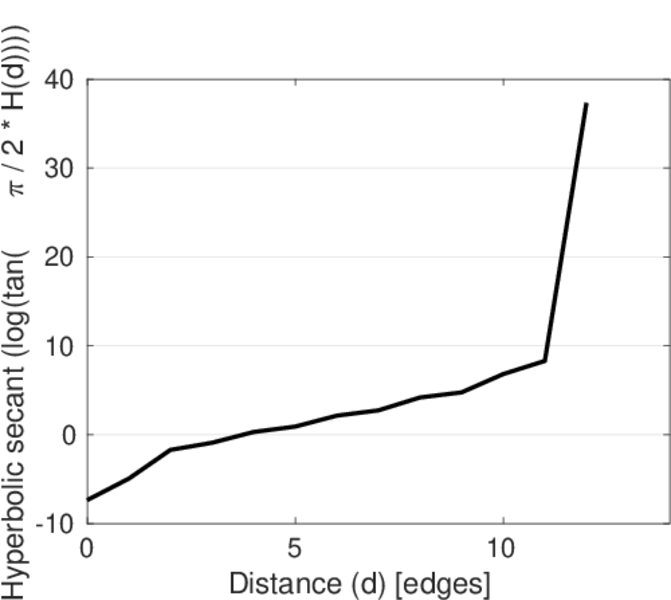
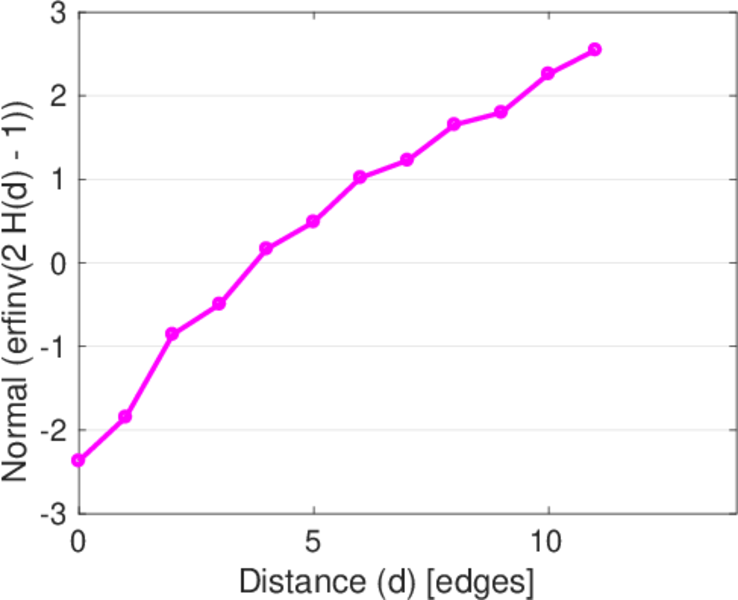
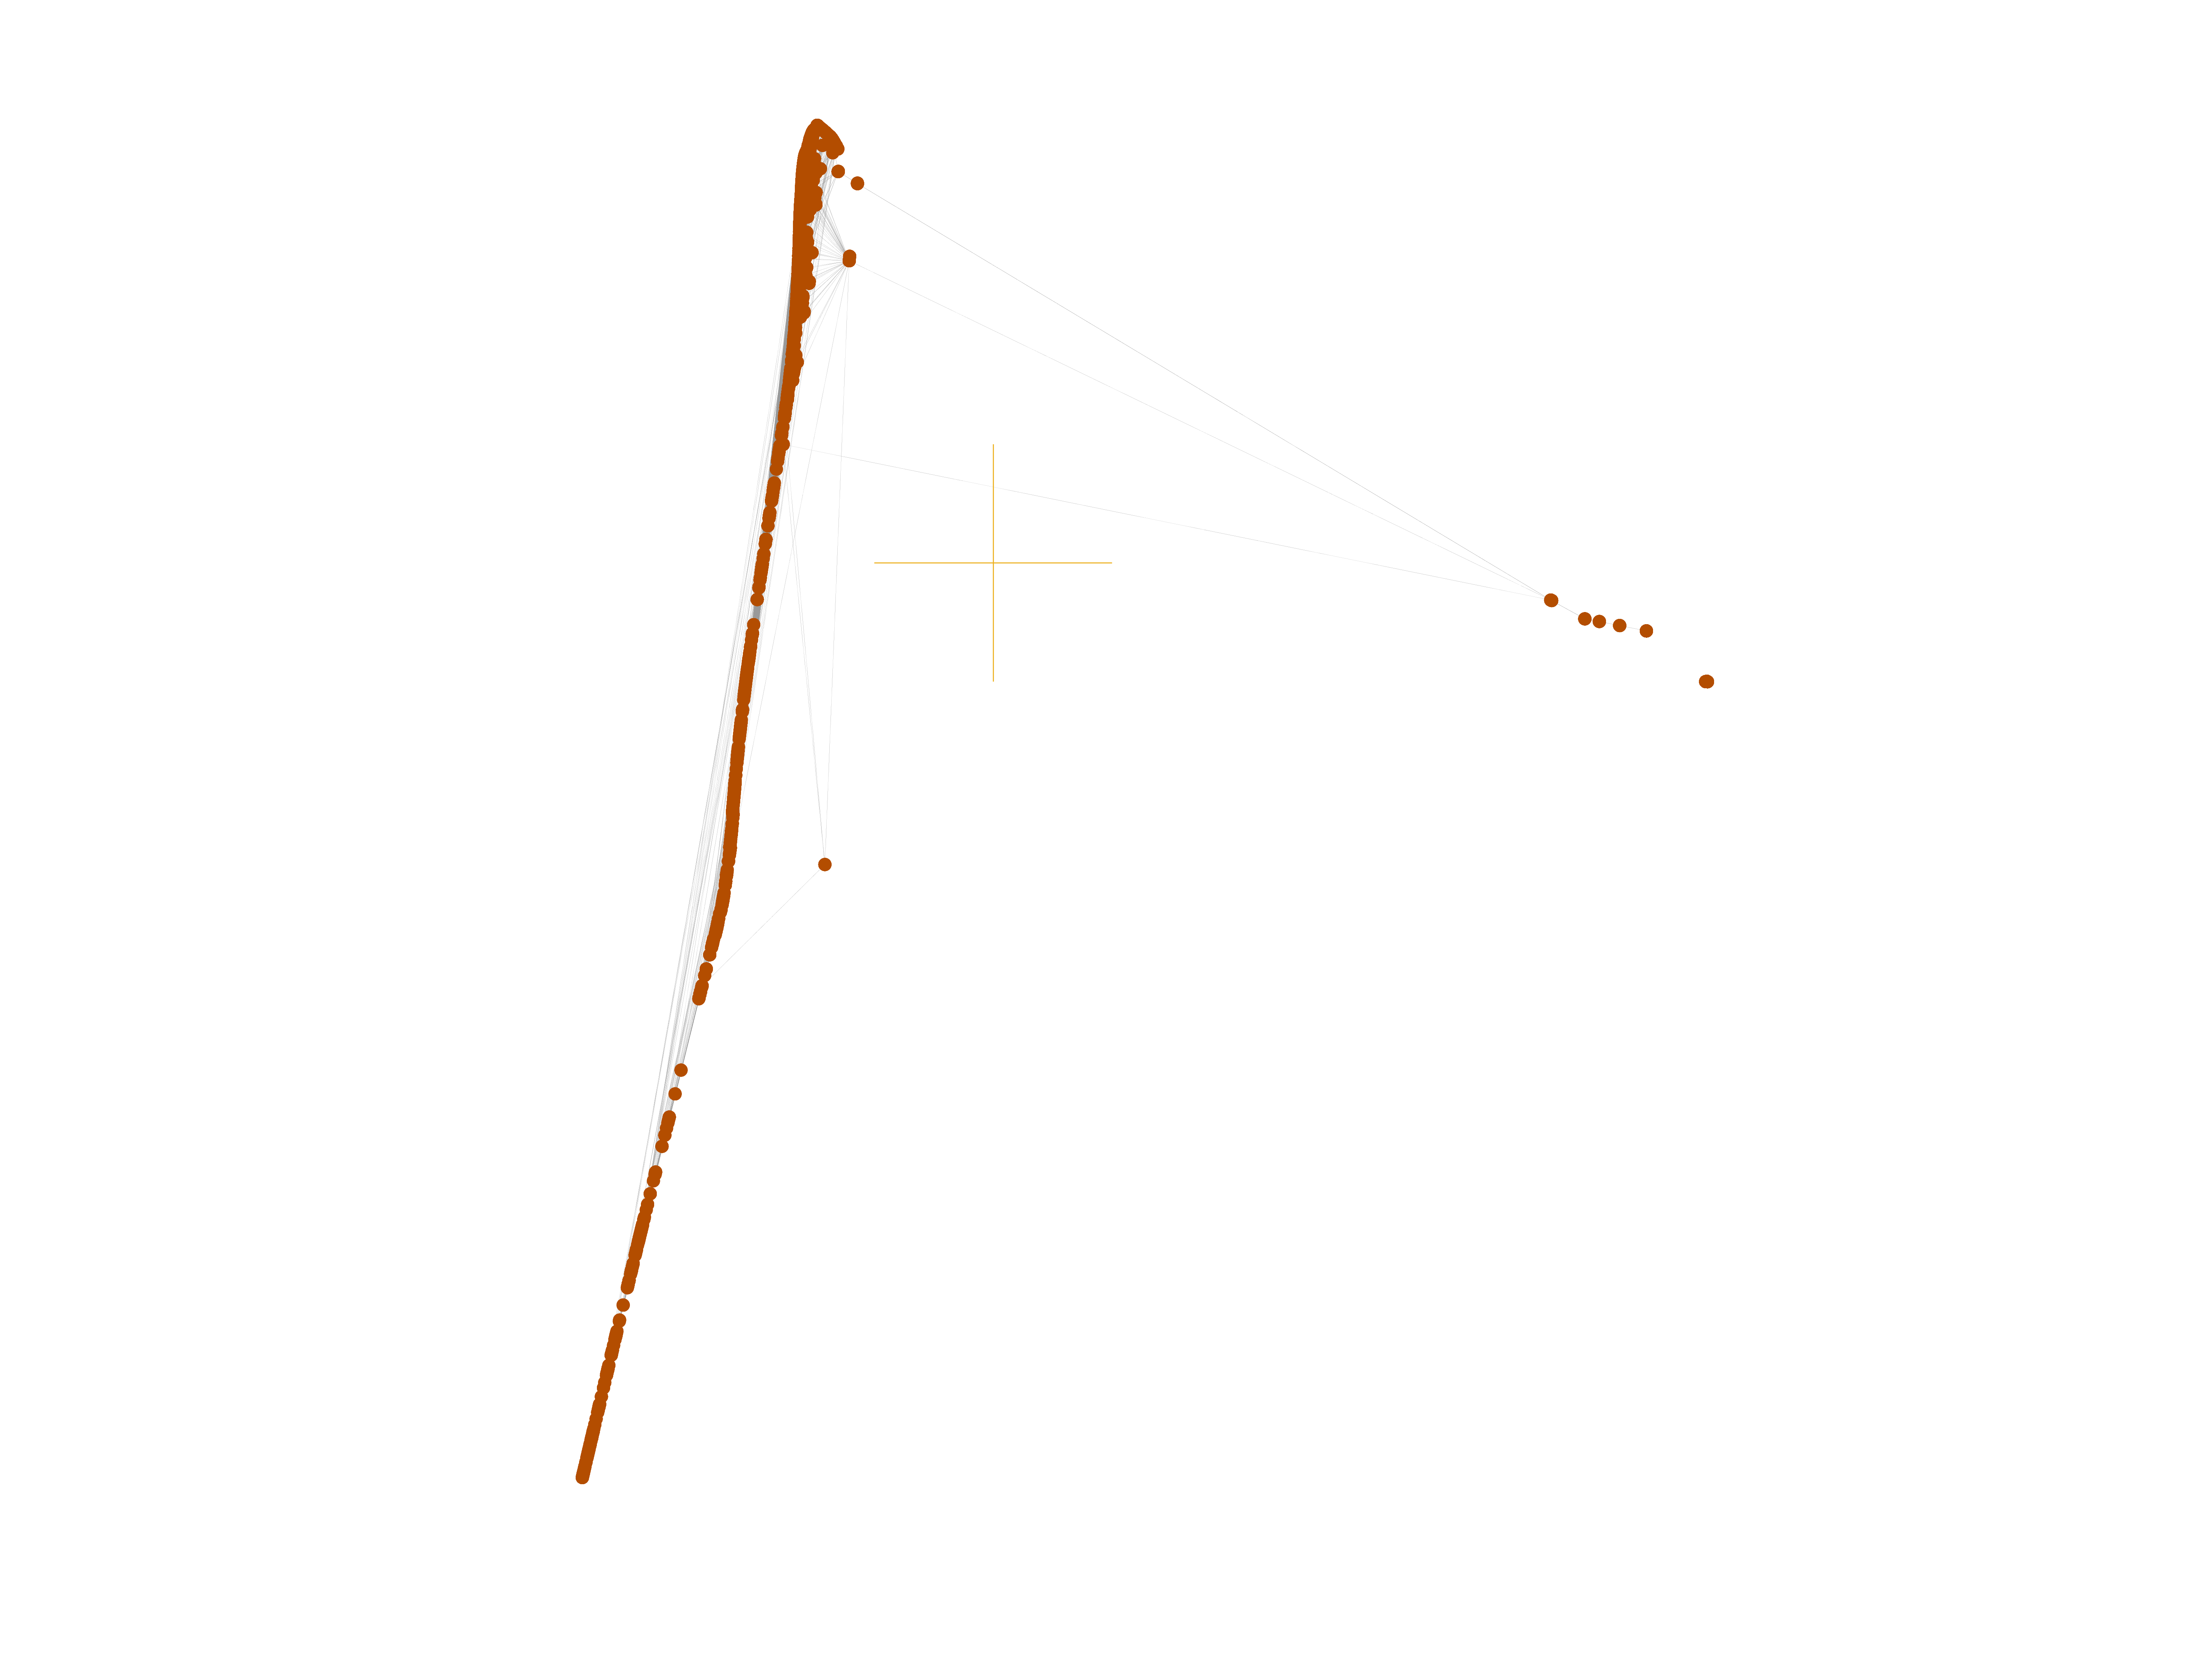
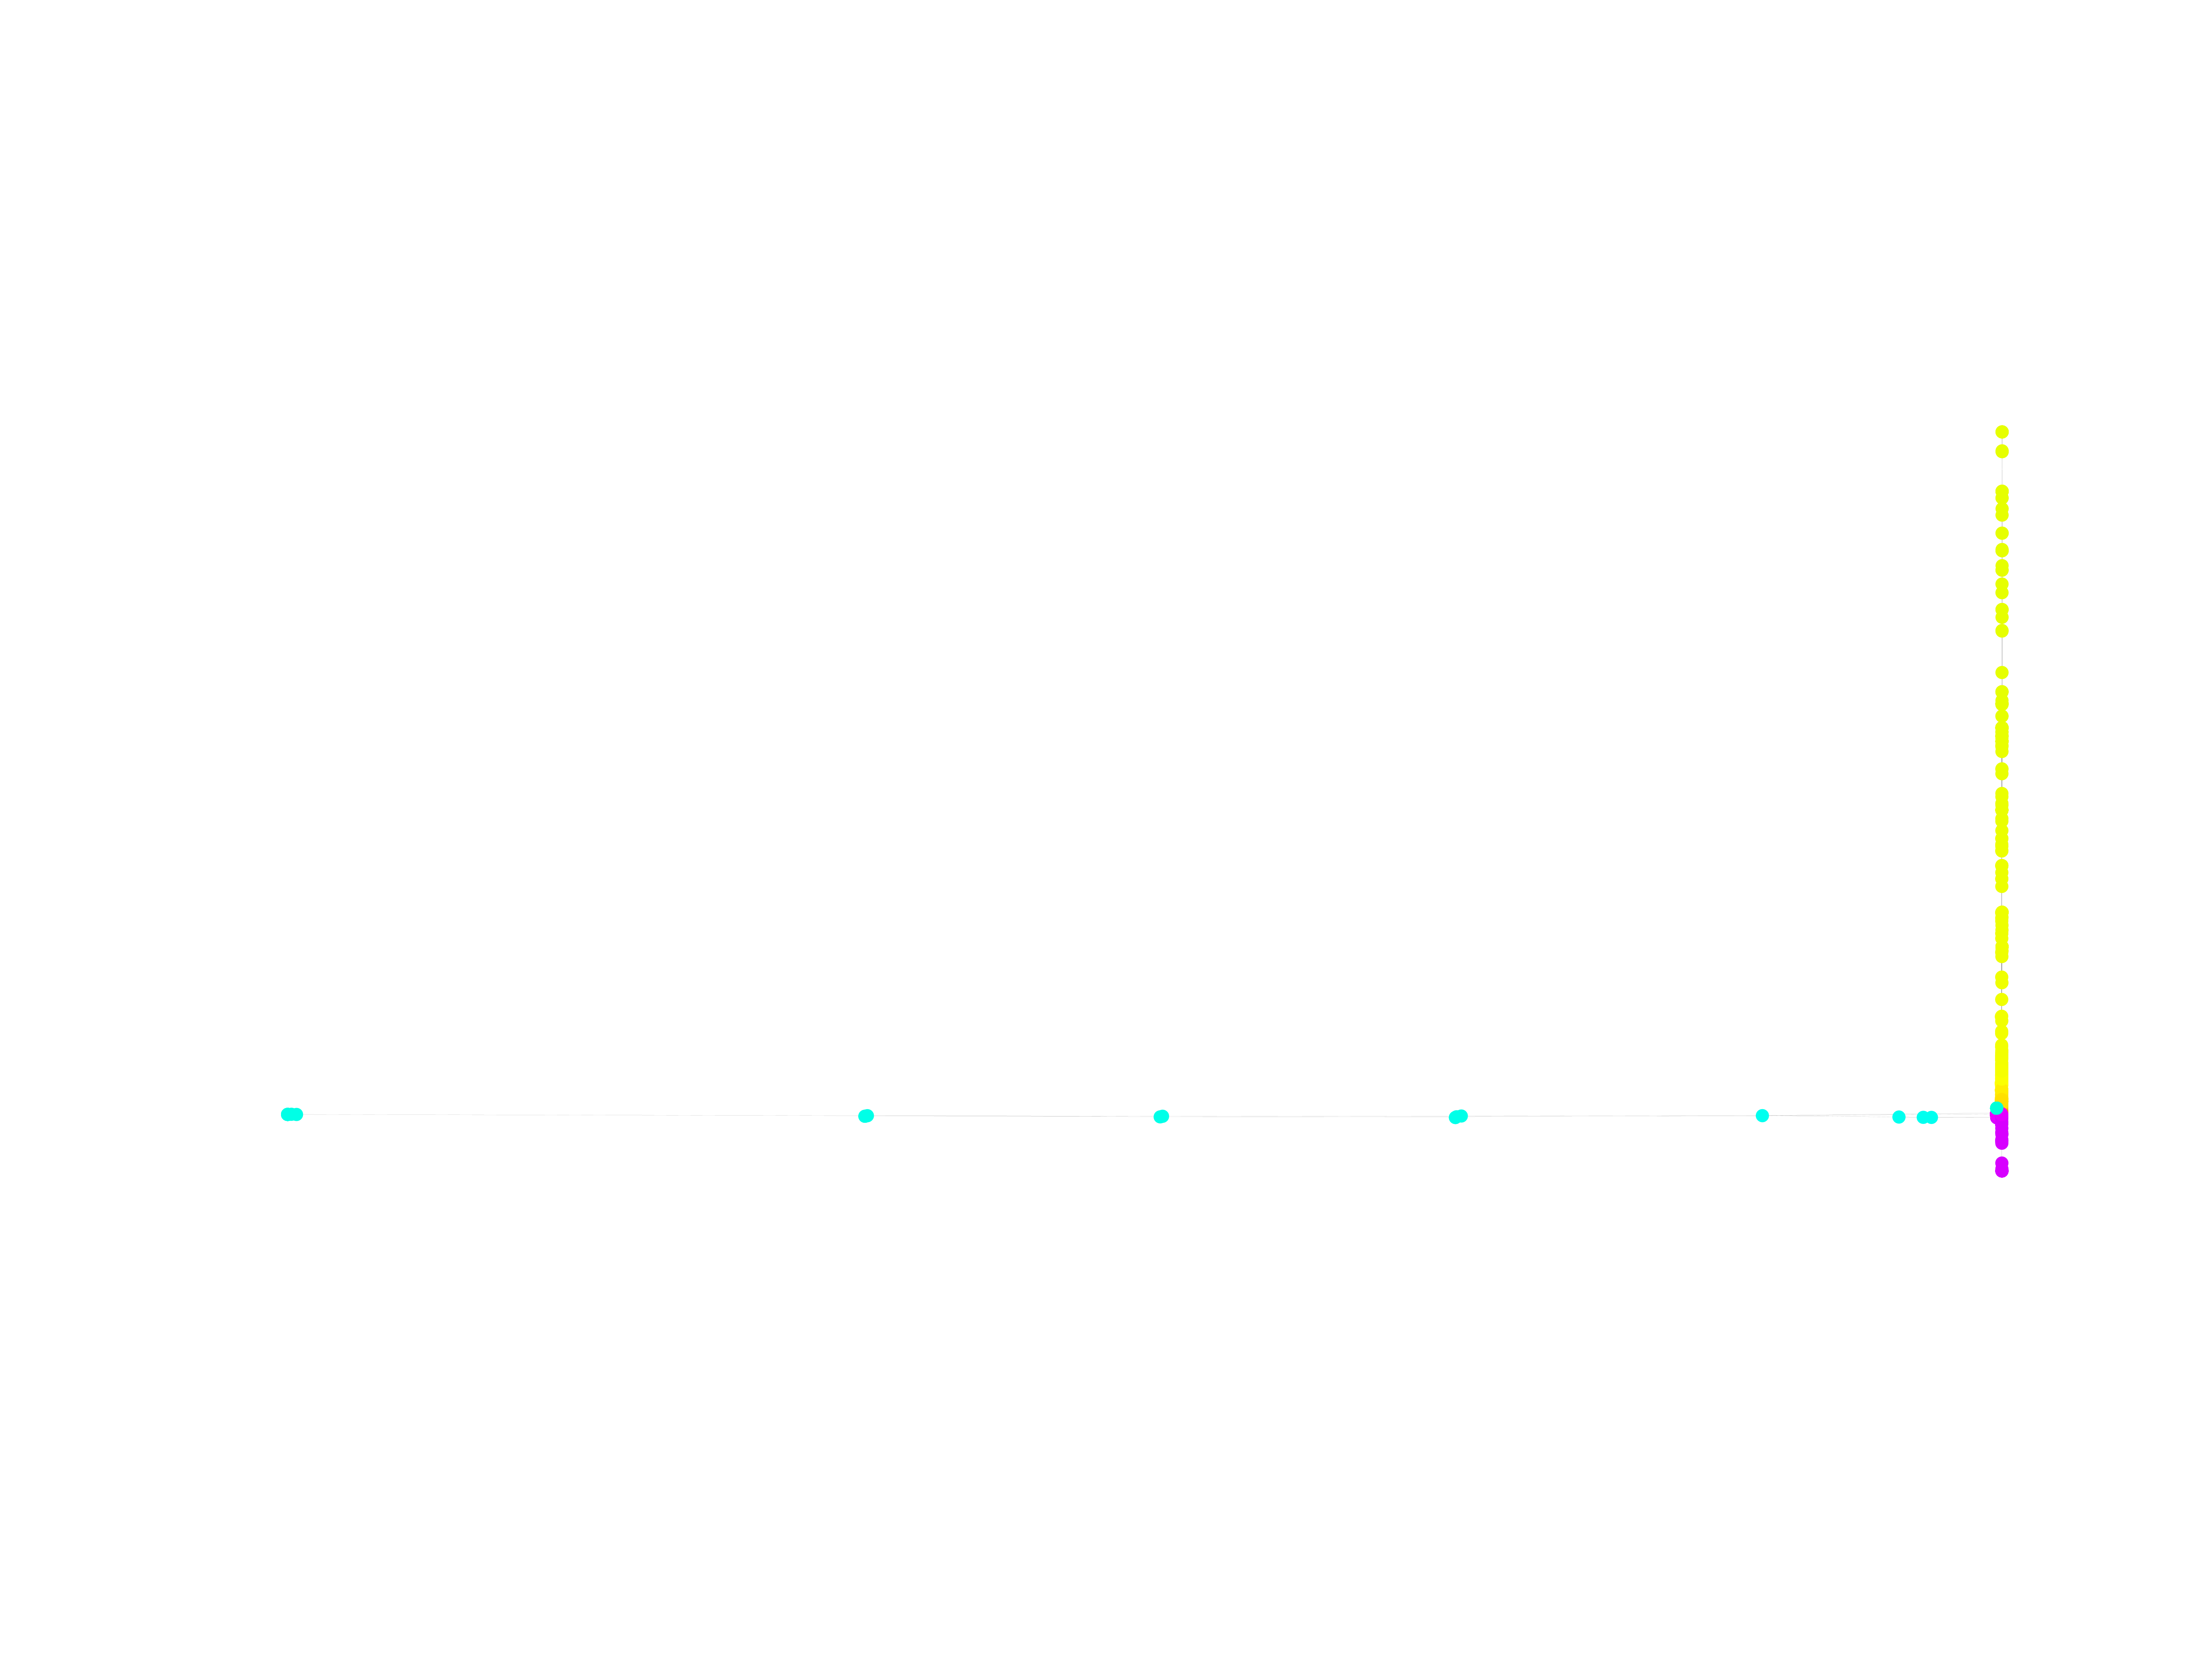
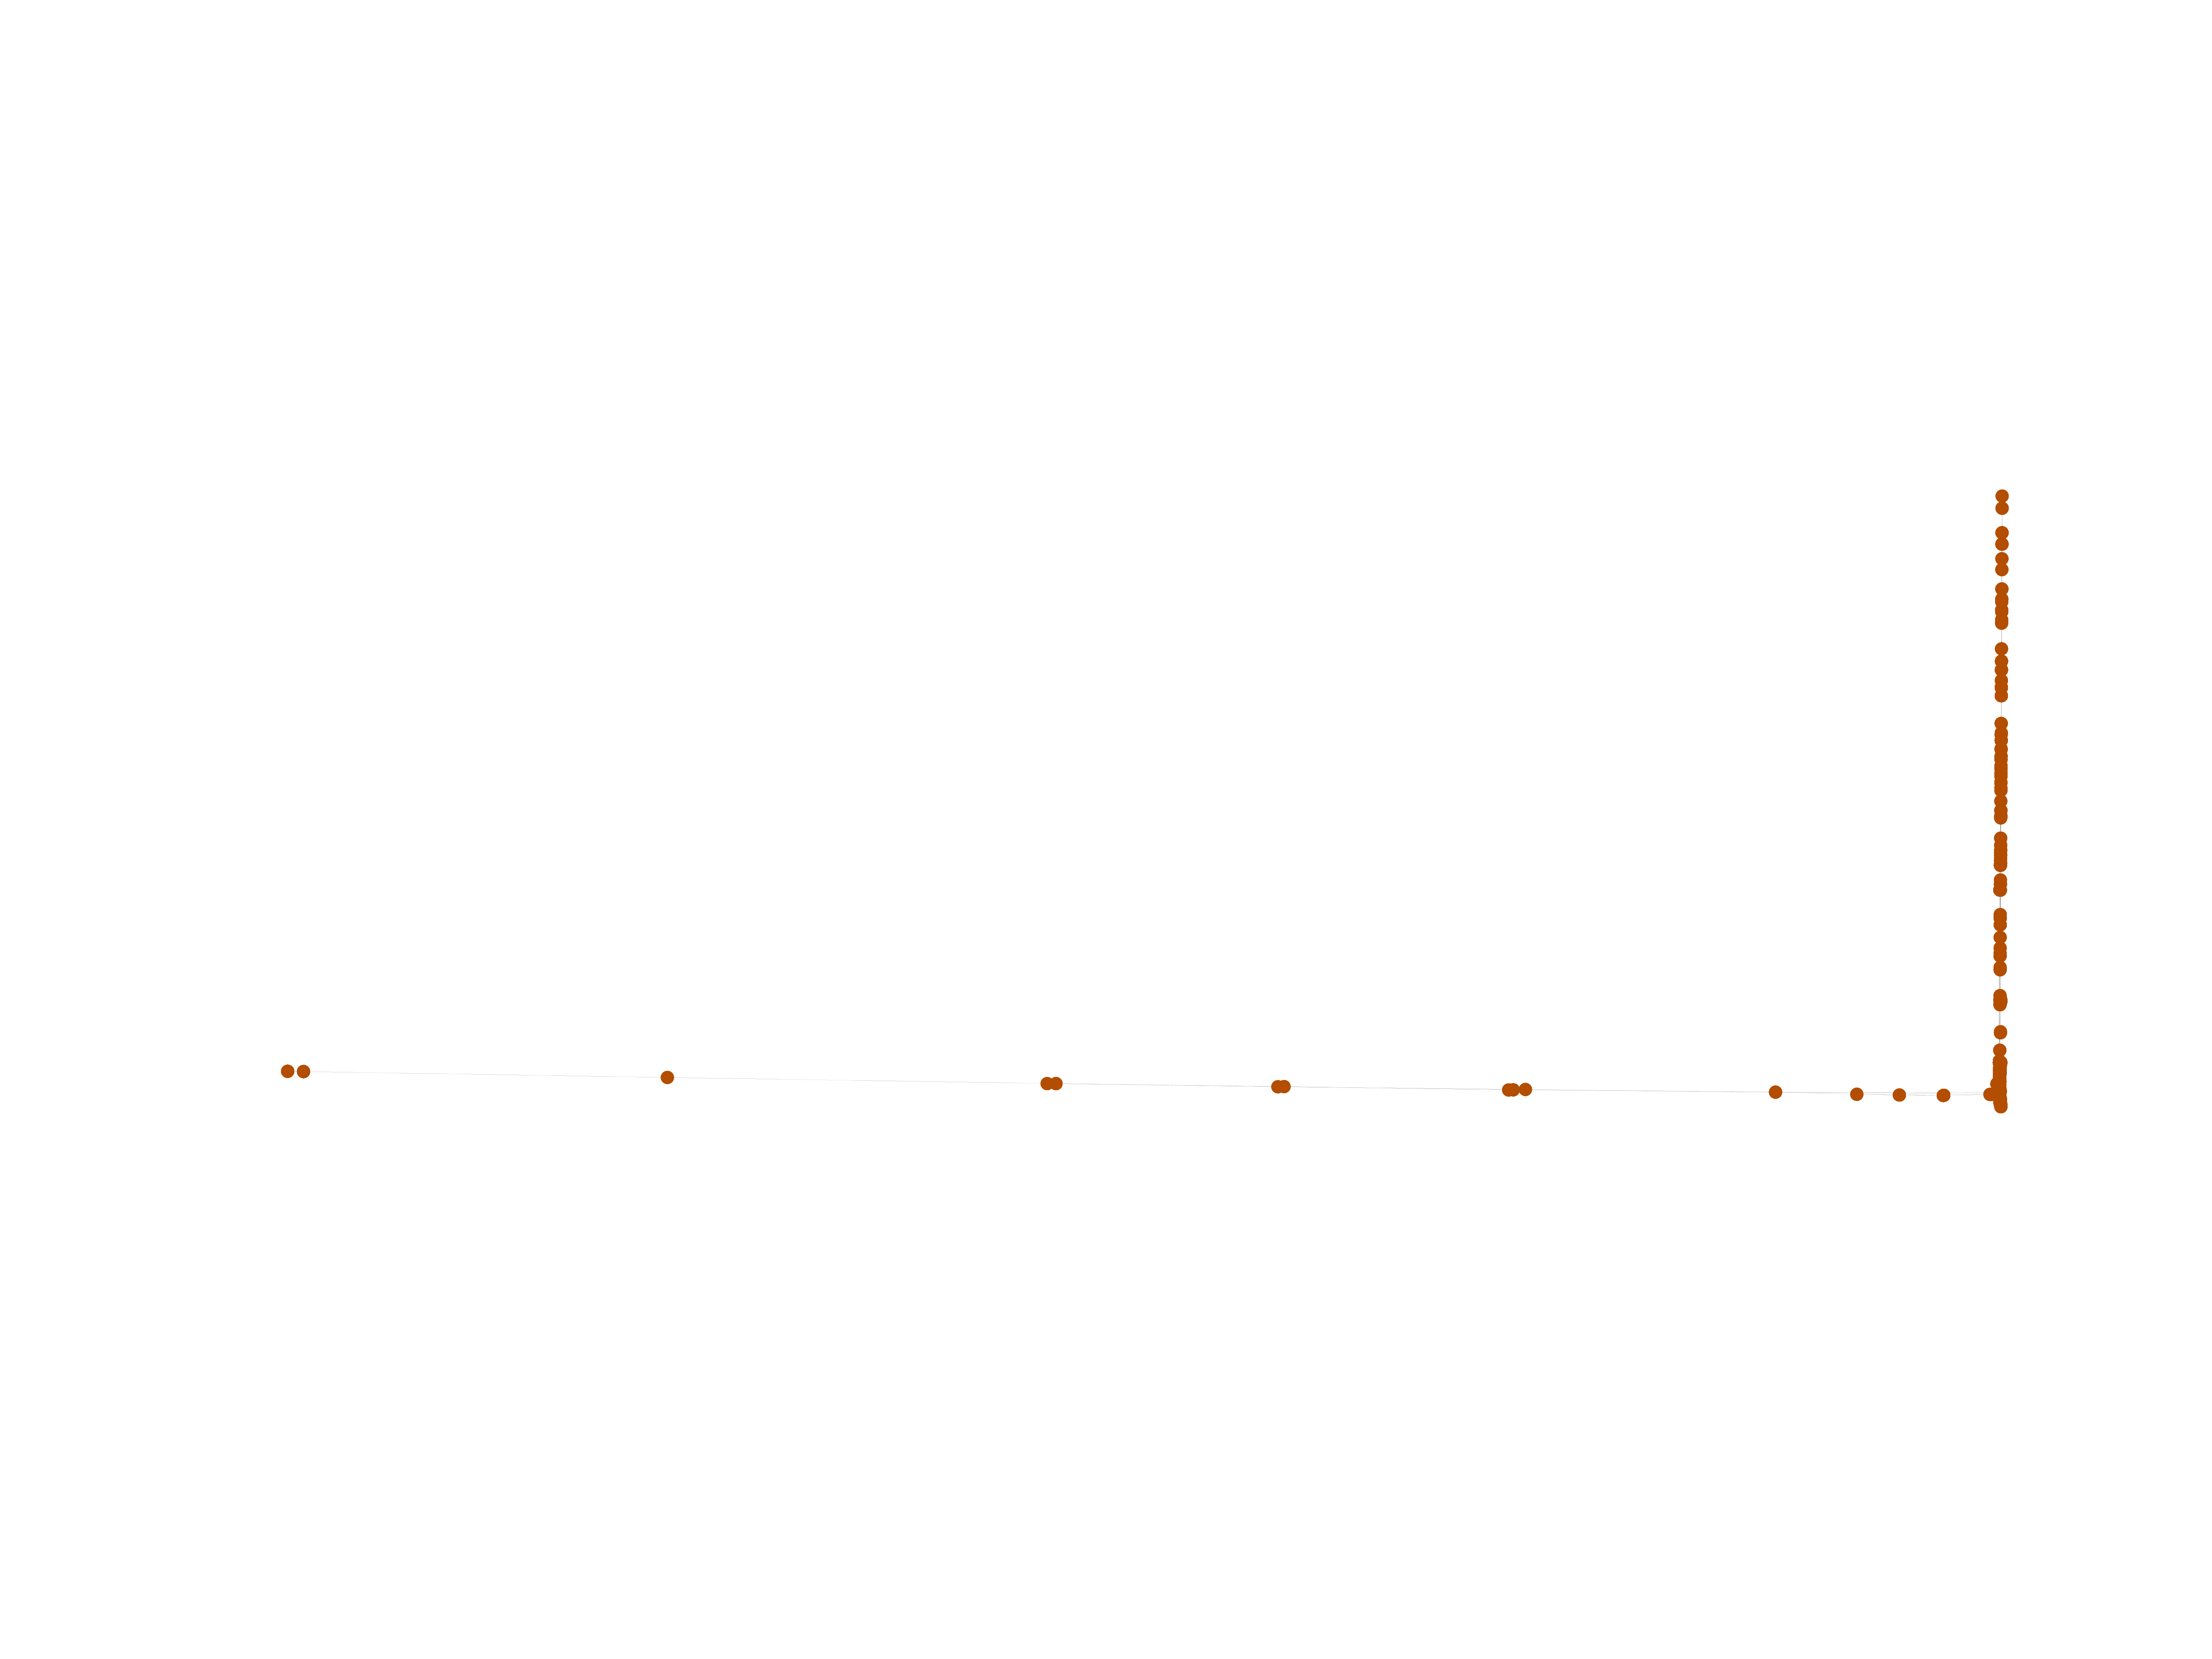
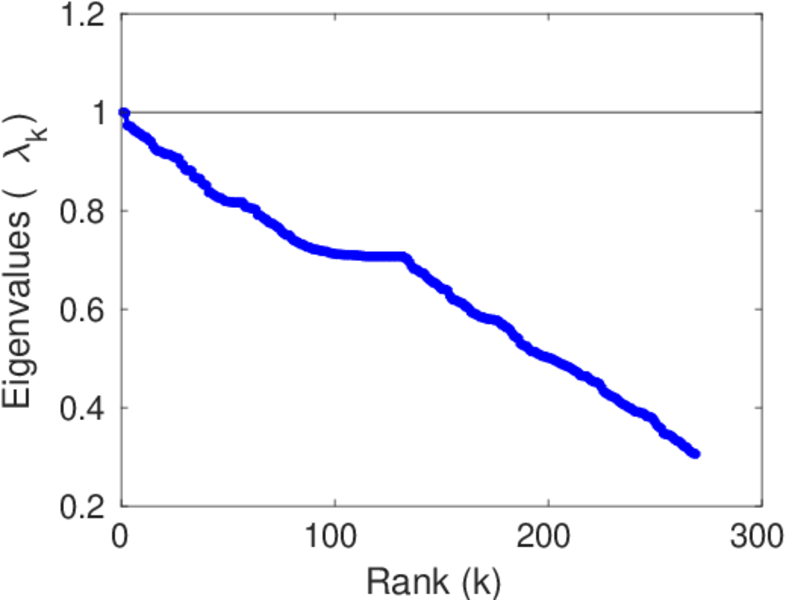
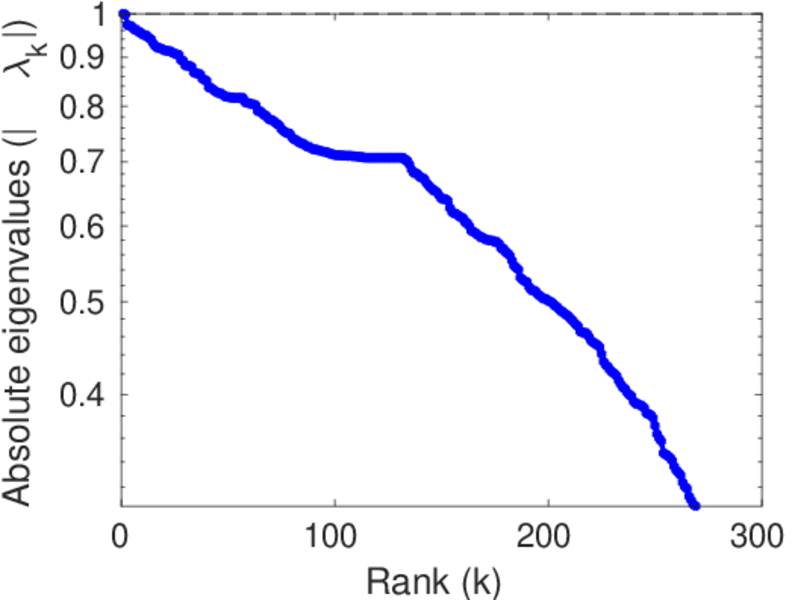
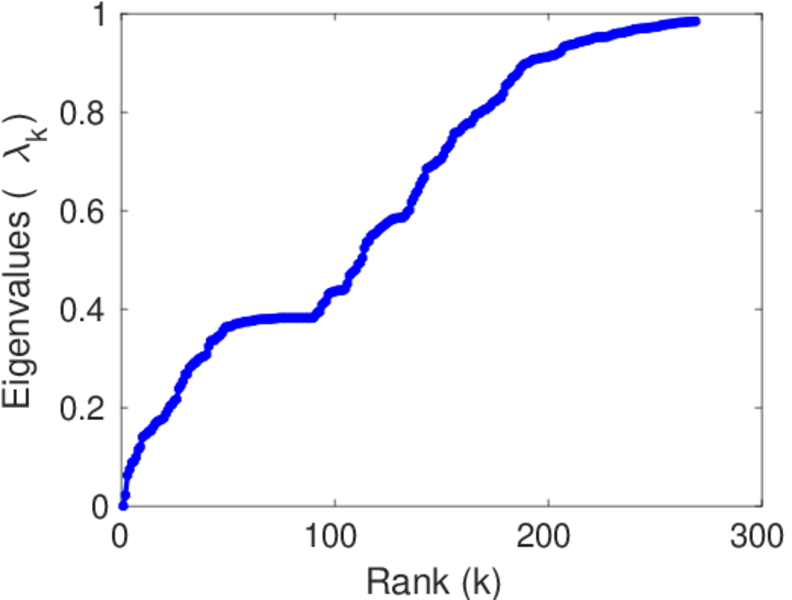
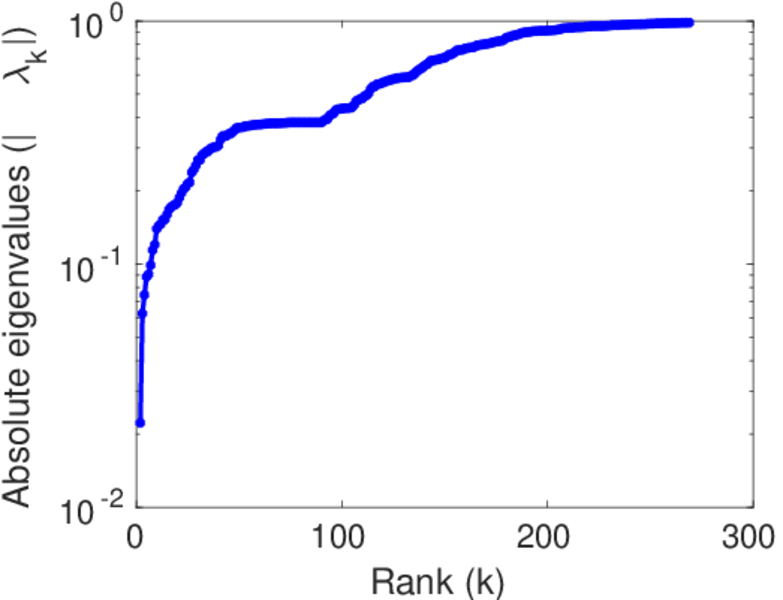
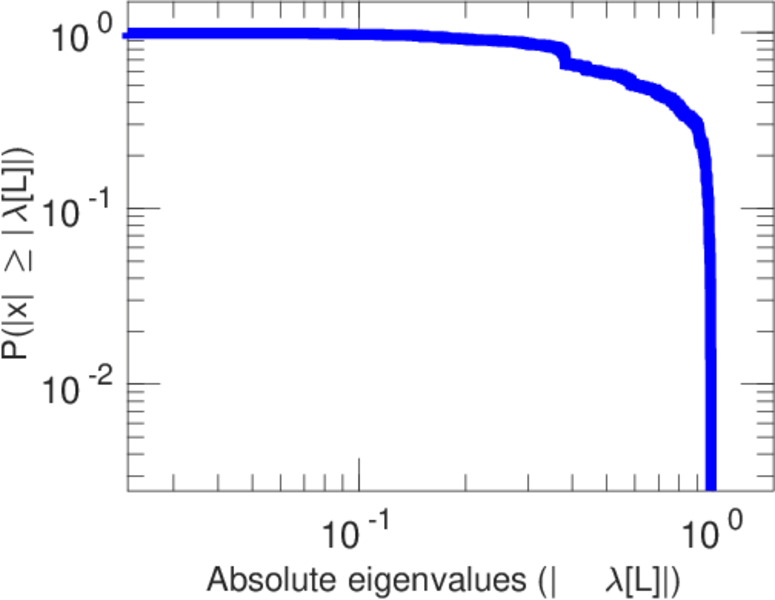
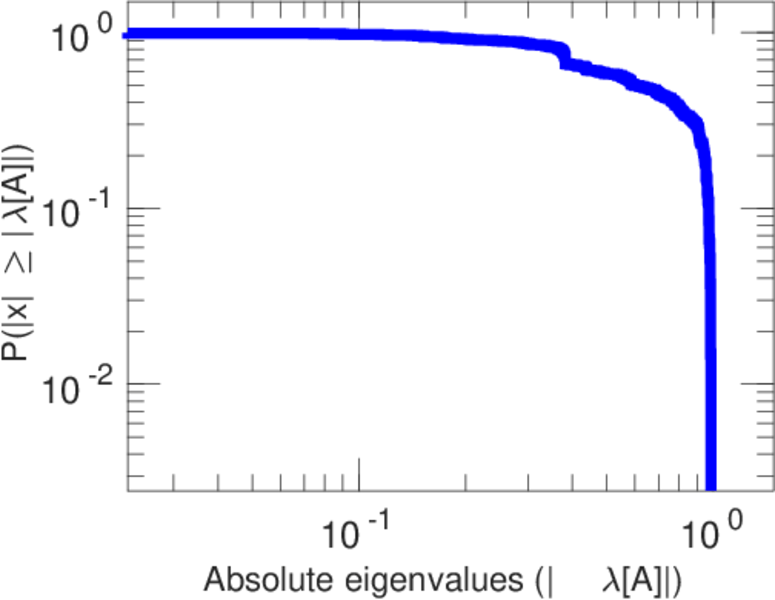
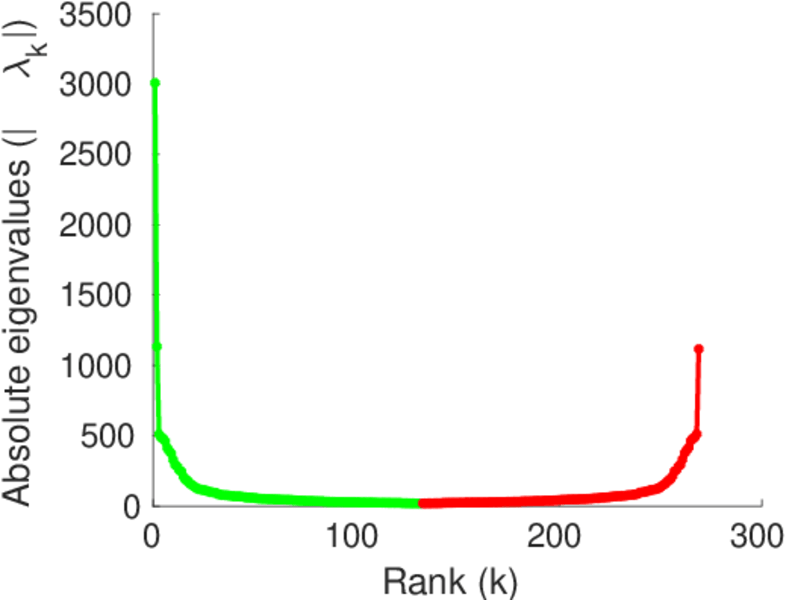
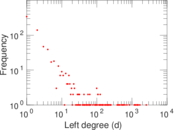
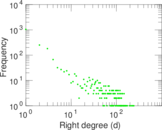
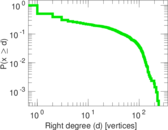
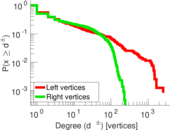
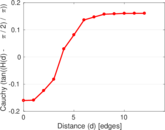
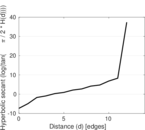
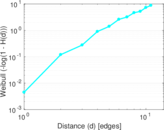
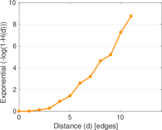
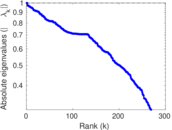
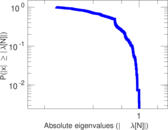
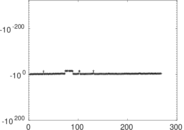
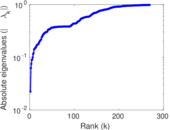
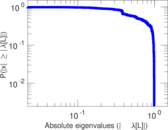
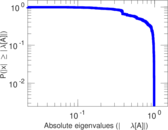
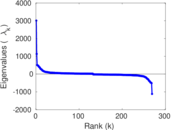
Plots


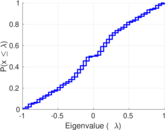


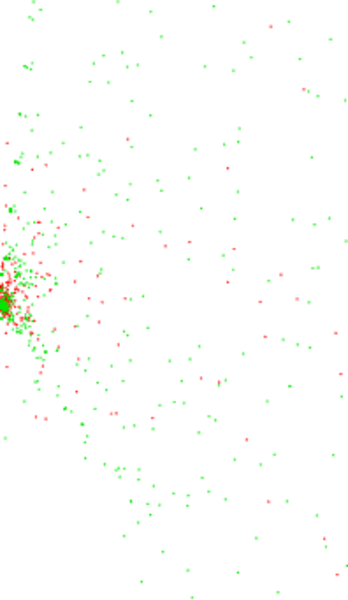
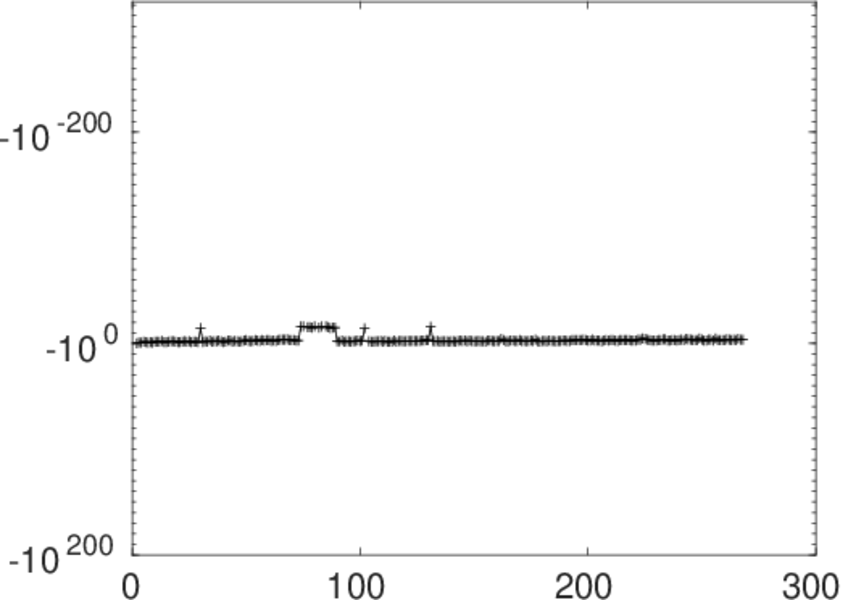
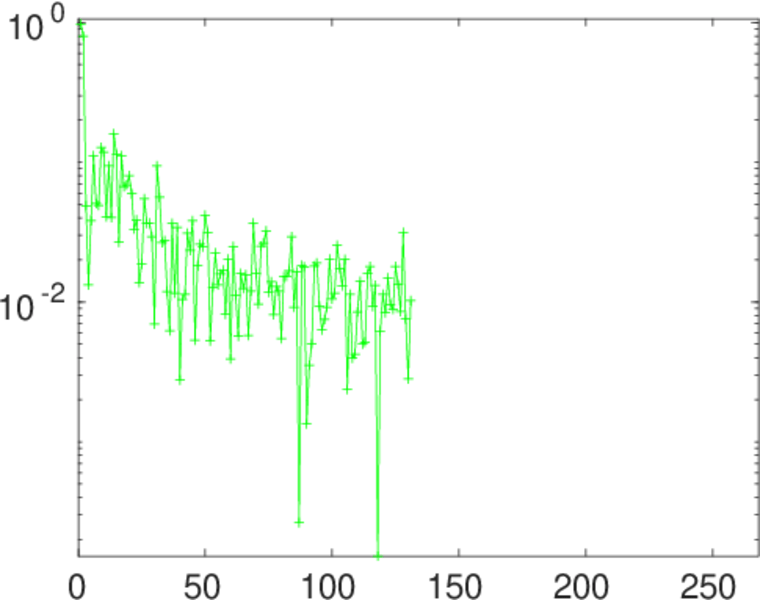
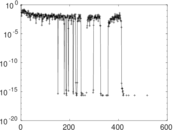
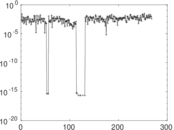
Matrix decompositions plots


Downloads
References
|
[1]
|
Jérôme Kunegis.
KONECT – The Koblenz Network Collection.
In Proc. Int. Conf. on World Wide Web Companion, pages
1343–1350, 2013.
[ http ]
|
|
[2]
|
Wikimedia Foundation.
Wikimedia downloads.
http://dumps.wikimedia.org/, January 2010.
|
 KONECT ‣ Networks ‣
Buy Me a Coffee
KONECT ‣ Networks ‣
Buy Me a Coffee