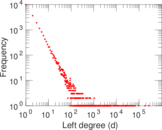
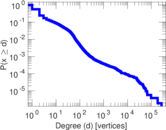
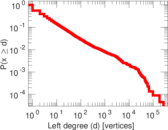
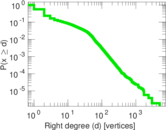
Wikipedia edits (bn)
This is the bipartite edit network of the Bangla Wikipedia. It contains users
and pages from the Bangla Wikipedia, connected by edit events. Each edge
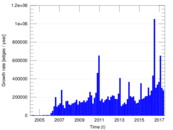
represents an edit. The dataset includes the timestamp of each edit.
Metadata
Statistics
| Size | n = | 545,404
|
| Left size | n1 = | 22,343
|
| Right size | n2 = | 523,061
|
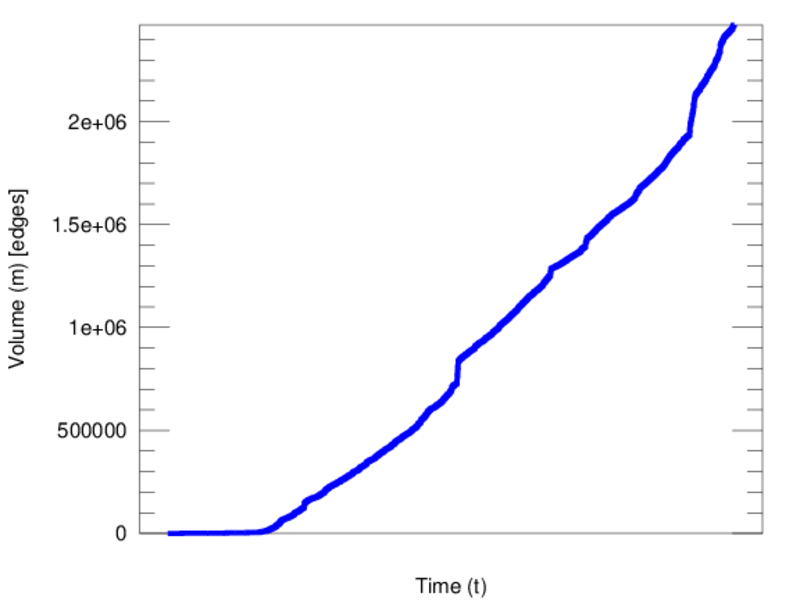
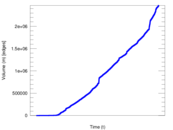
| Volume | m = | 2,469,893
|
| Unique edge count | m̿ = | 1,399,600
|
| Wedge count | s = | 48,646,969,946
|
| Claw count | z = | 2,862,769,306,239,449
|
| Square count | q = | 20,300,587,904
|
| 4-Tour count | T4 = | 356,995,573,188
|
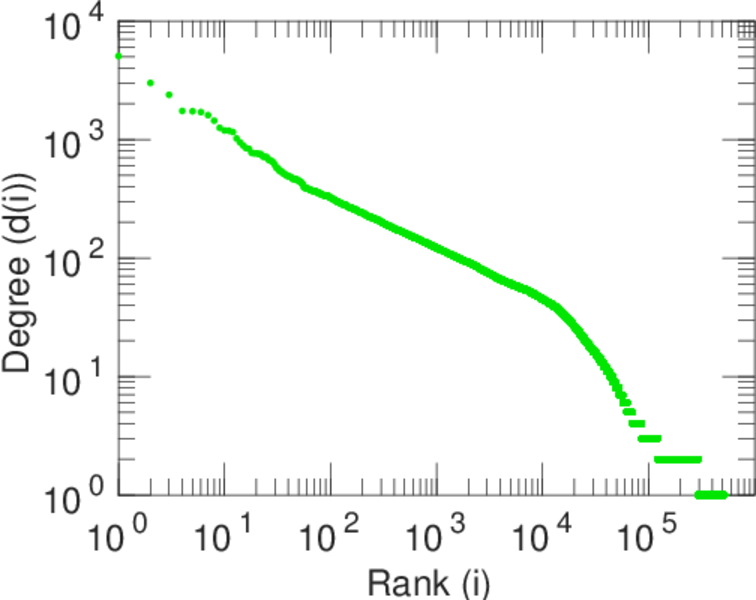
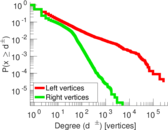
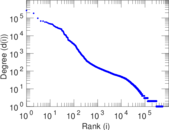
| Maximum degree | dmax = | 267,552
|
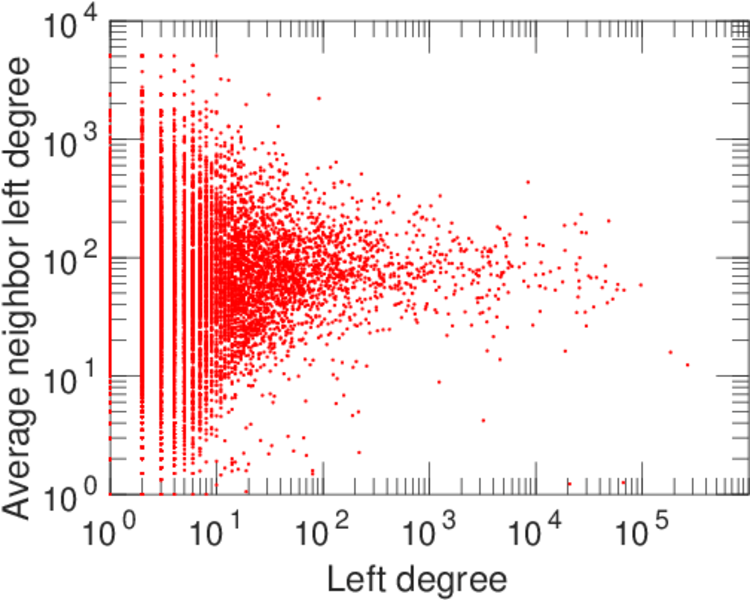
| Maximum left degree | d1max = | 267,552
|
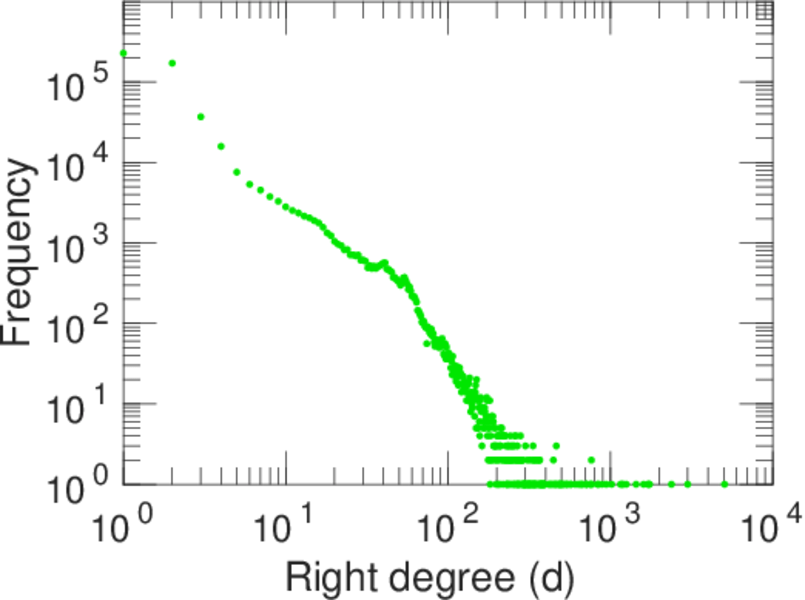
| Maximum right degree | d2max = | 5,061
|
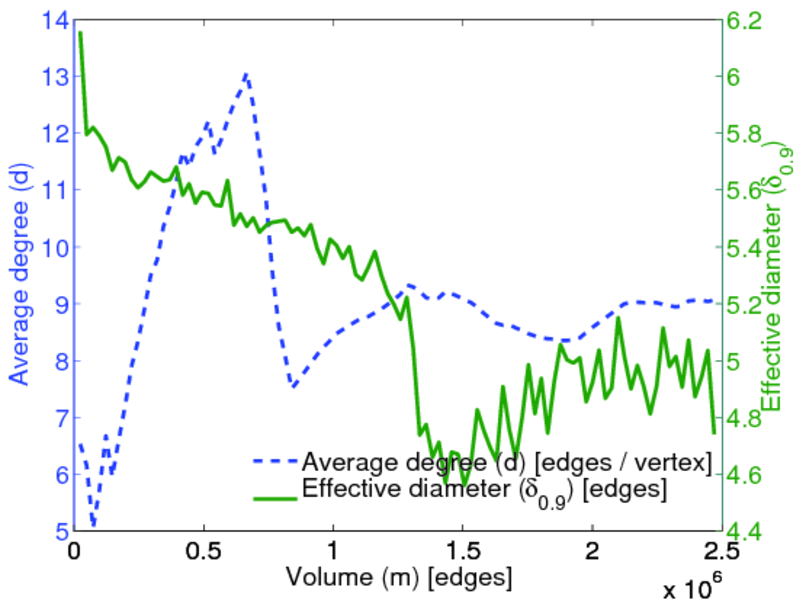
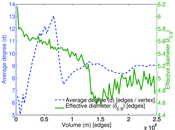
| Average degree | d = | 9.057 11
|
| Average left degree | d1 = | 110.544
|
| Average right degree | d2 = | 4.722 00
|
| Fill | p = | 0.000 119 760
|
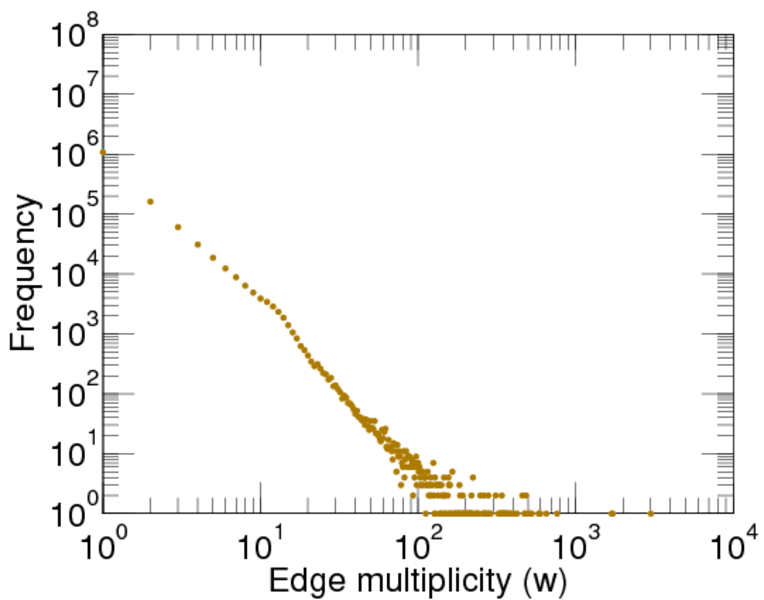
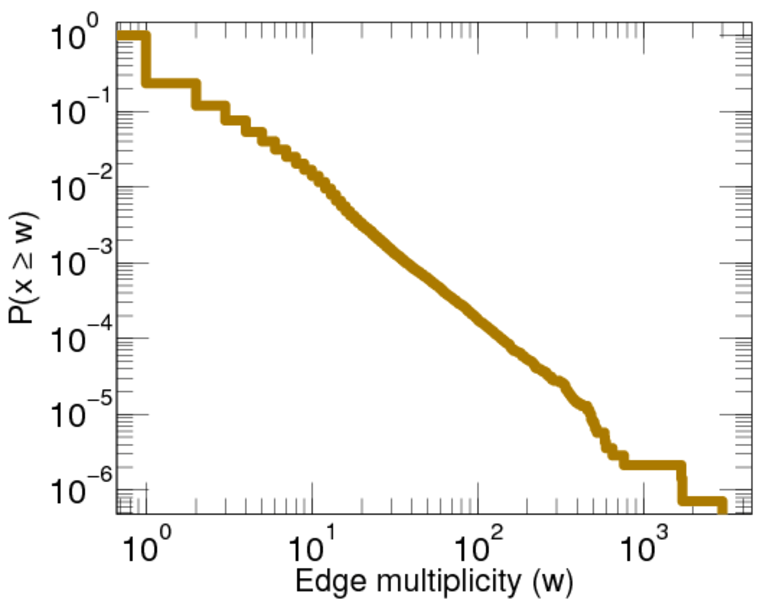
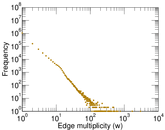
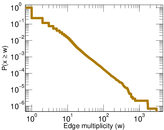
| Average edge multiplicity | m̃ = | 1.764 71
|
| Size of LCC | N = | 536,944
|
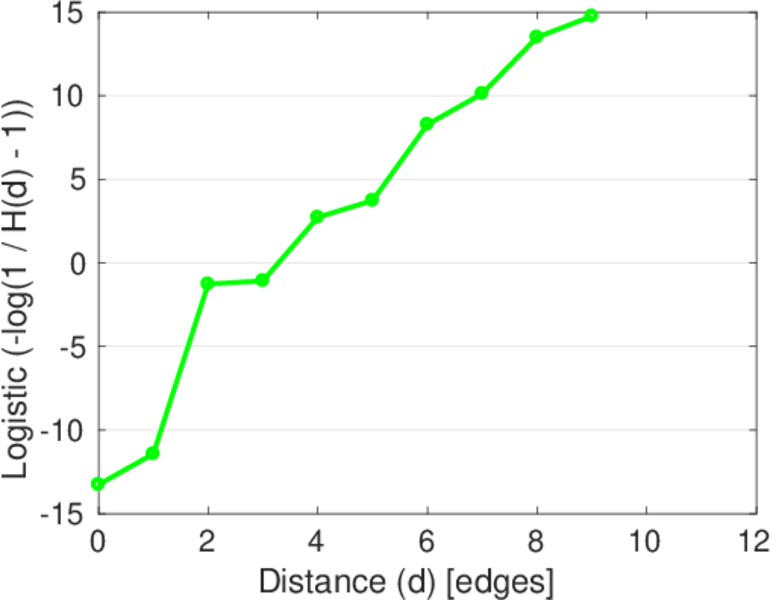
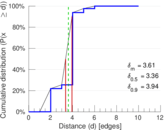
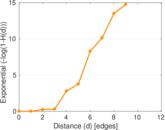
| Diameter | δ = | 13
|
| 50-Percentile effective diameter | δ0.5 = | 3.358 27
|
| 90-Percentile effective diameter | δ0.9 = | 3.943 49
|
| Median distance | δM = | 4
|
| Mean distance | δm = | 3.610 58
|
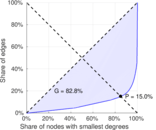
| Gini coefficient | G = | 0.833 749
|
| Balanced inequality ratio | P = | 0.145 846
|
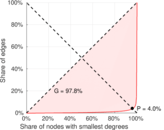
| Left balanced inequality ratio | P1 = | 0.039 787 6
|
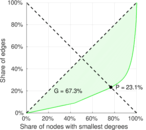
| Right balanced inequality ratio | P2 = | 0.231 414
|
| Power law exponent | γ = | 2.758 03
|
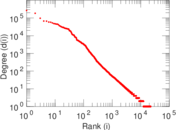
| Tail power law exponent | γt = | 3.121 00
|
| Tail power law exponent with p | γ3 = | 3.121 00
|
| p-value | p = | 0.000 00
|
| Left tail power law exponent with p | γ3,1 = | 1.971 00
|
| Left p-value | p1 = | 0.000 00
|
| Right tail power law exponent with p | γ3,2 = | 5.211 00
|
| Right p-value | p2 = | 0.008 000 00
|
| Degree assortativity | ρ = | −0.170 346
|
| Degree assortativity p-value | pρ = | 0.000 00
|
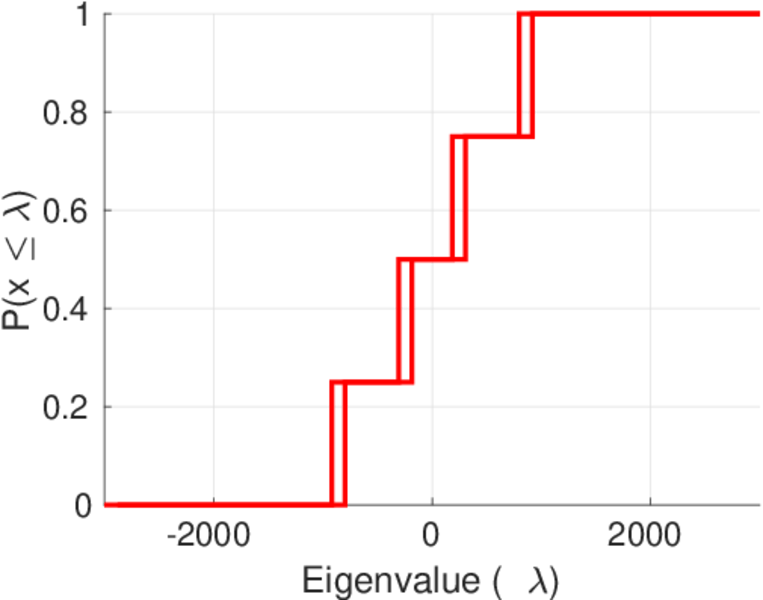
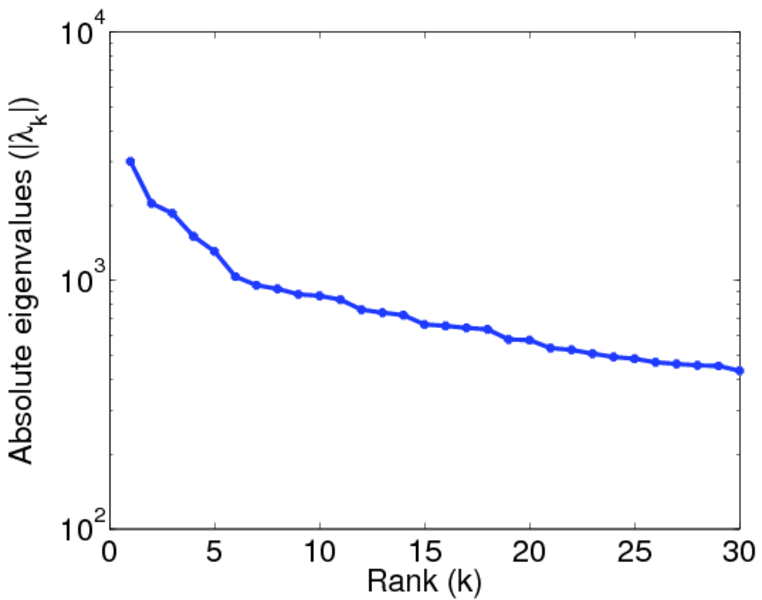
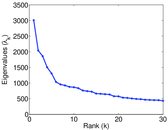
| Spectral norm | α = | 3,006.83
|
| Algebraic connectivity | a = | 0.025 352 6
|
| Spectral separation | |λ1[A] / λ2[A]| = | 1.472 85
|
| Controllability | C = | 510,457
|
| Relative controllability | Cr = | 0.936 660
|
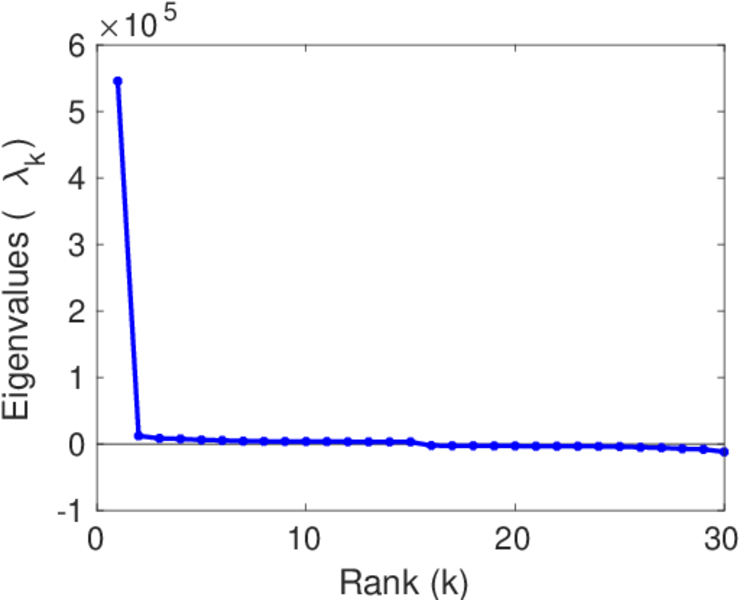
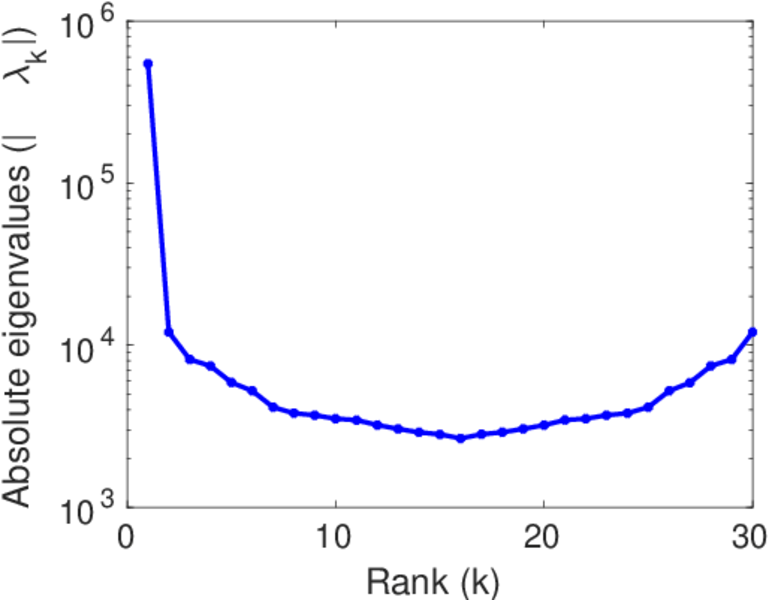
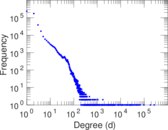
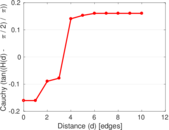
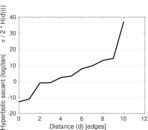
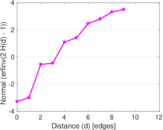
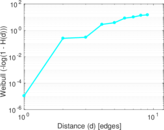
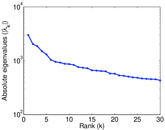
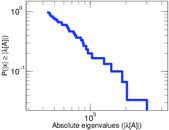
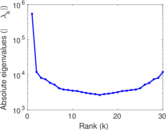
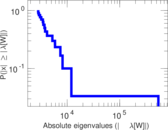
Plots


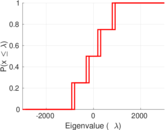
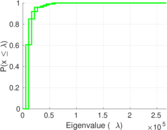
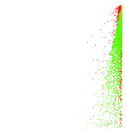


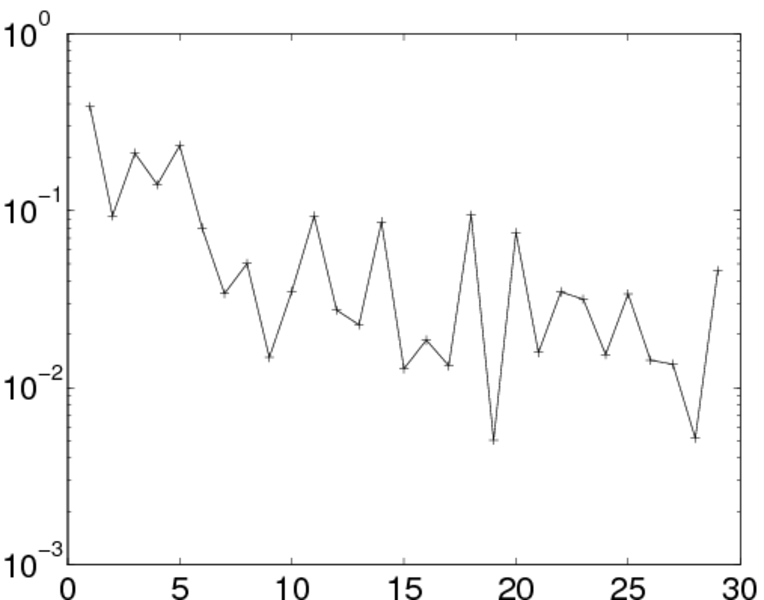
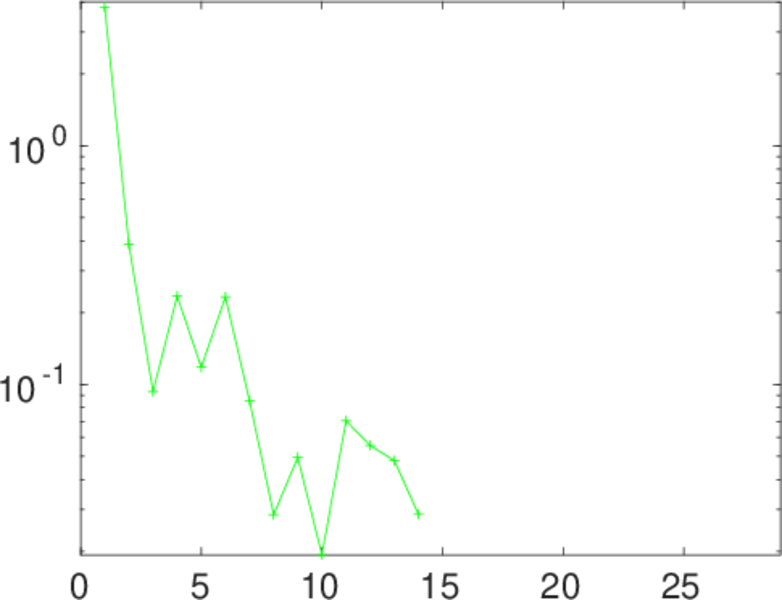
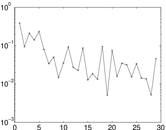
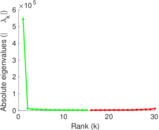
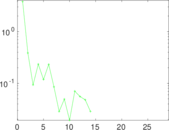
Matrix decompositions plots

Downloads
References
|
[1]
|
Jérôme Kunegis.
KONECT – The Koblenz Network Collection.
In Proc. Int. Conf. on World Wide Web Companion, pages
1343–1350, 2013.
[ http ]
|
|
[2]
|
Wikimedia Foundation.
Wikimedia downloads.
http://dumps.wikimedia.org/, January 2010.
|
 KONECT ‣ Networks ‣
Buy Me a Coffee
KONECT ‣ Networks ‣
Buy Me a Coffee