Wikibooks edits (bn)
This is the bipartite edit network of the Bangla Wikibooks. It contains users
and pages from the Bangla Wikibooks, connected by edit events. Each edge
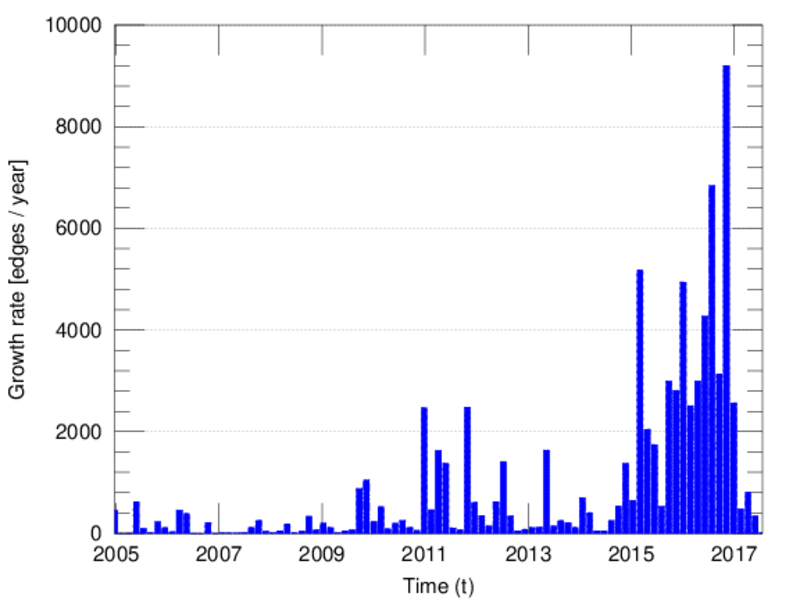
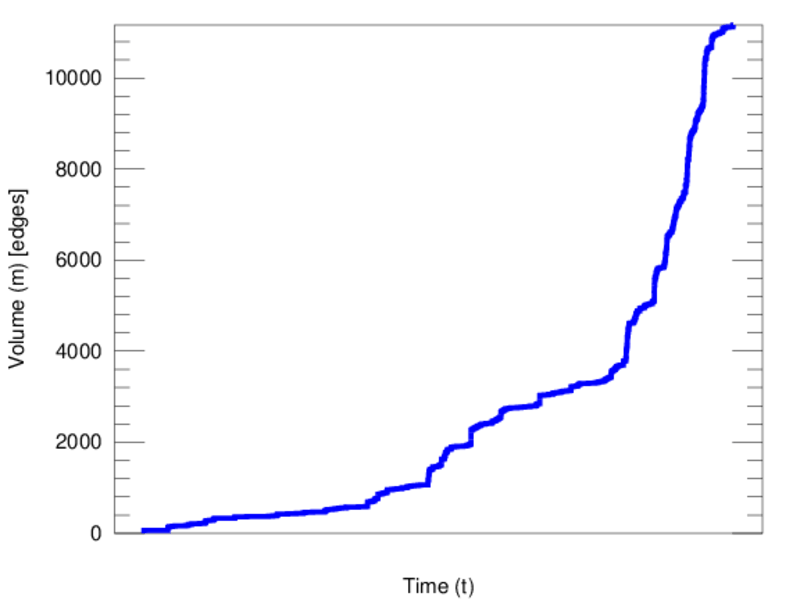
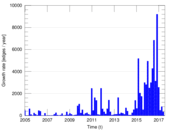
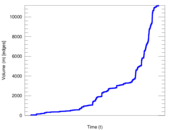
represents an edit. The dataset includes the timestamp of each edit.
Metadata
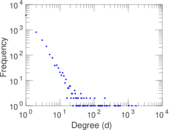
Statistics
| Size | n = | 5,688
|
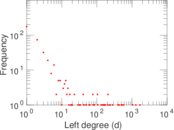
| Left size | n1 = | 400
|
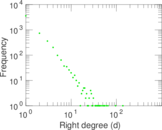
| Right size | n2 = | 5,288
|
| Volume | m = | 11,162
|
| Unique edge count | m̿ = | 6,715
|
| Wedge count | s = | 1,158,316
|
| Claw count | z = | 216,001,006
|
| Cross count | x = | 34,633,692,276
|
| Square count | q = | 22,476
|
| 4-Tour count | T4 = | 4,828,502
|
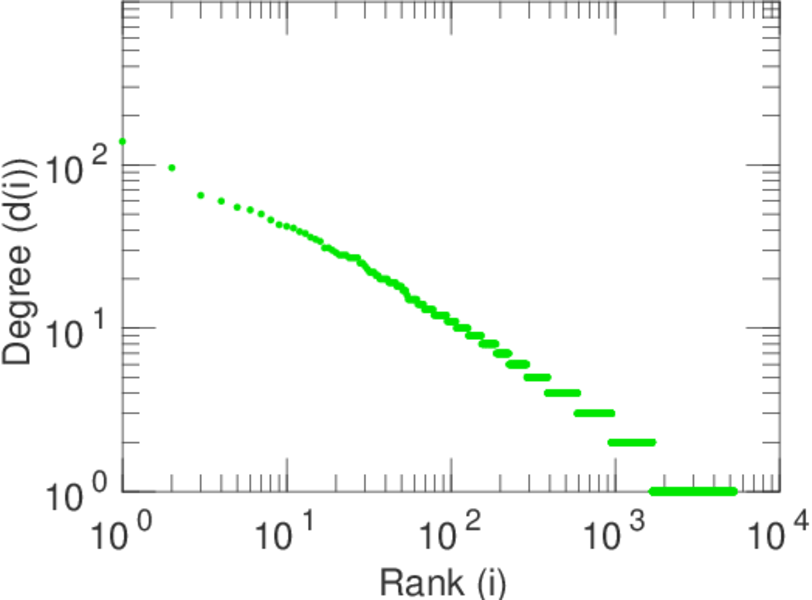
| Maximum degree | dmax = | 1,692
|
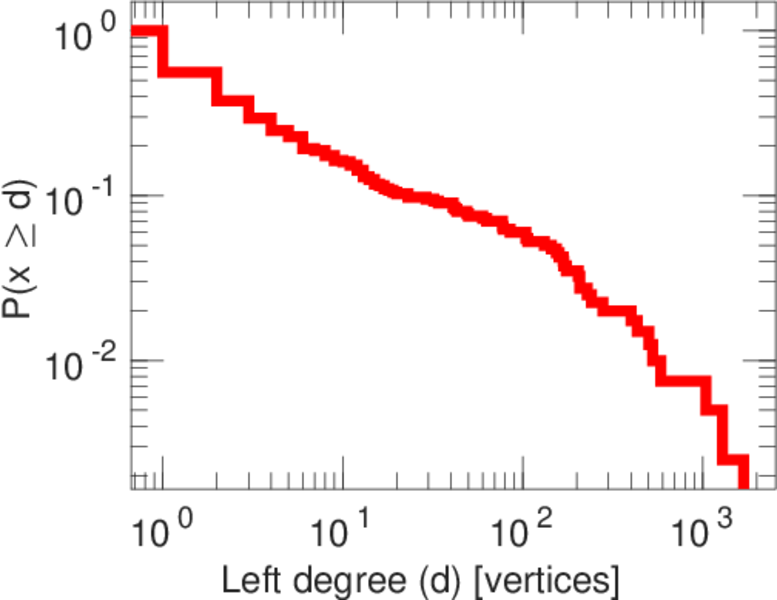
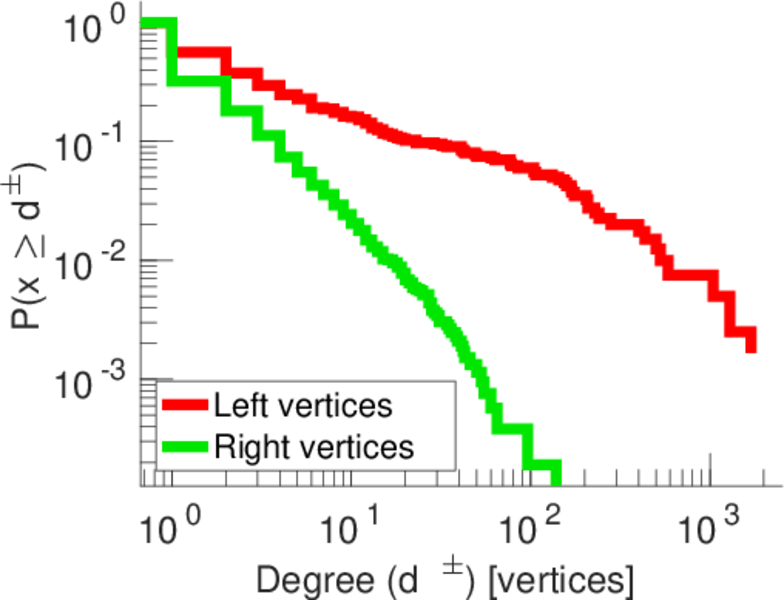
| Maximum left degree | d1max = | 1,692
|
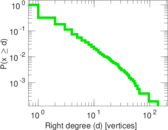
| Maximum right degree | d2max = | 139
|
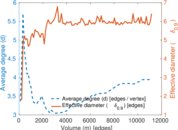
| Average degree | d = | 3.924 75
|
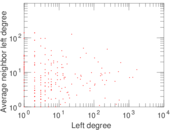
| Average left degree | d1 = | 27.905 0
|
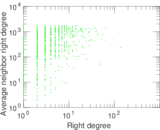
| Average right degree | d2 = | 2.110 82
|
| Fill | p = | 0.003 174 64
|
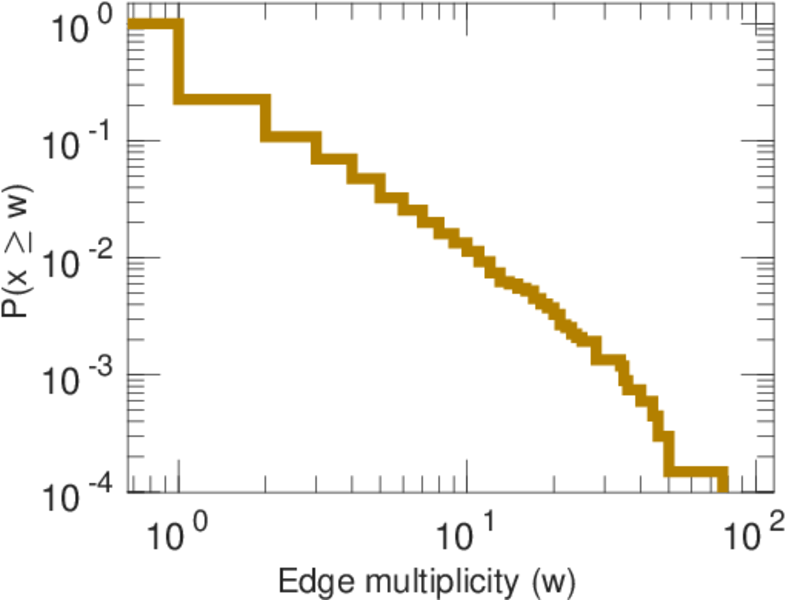
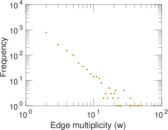
| Average edge multiplicity | m̃ = | 1.662 25
|
| Size of LCC | N = | 5,328
|
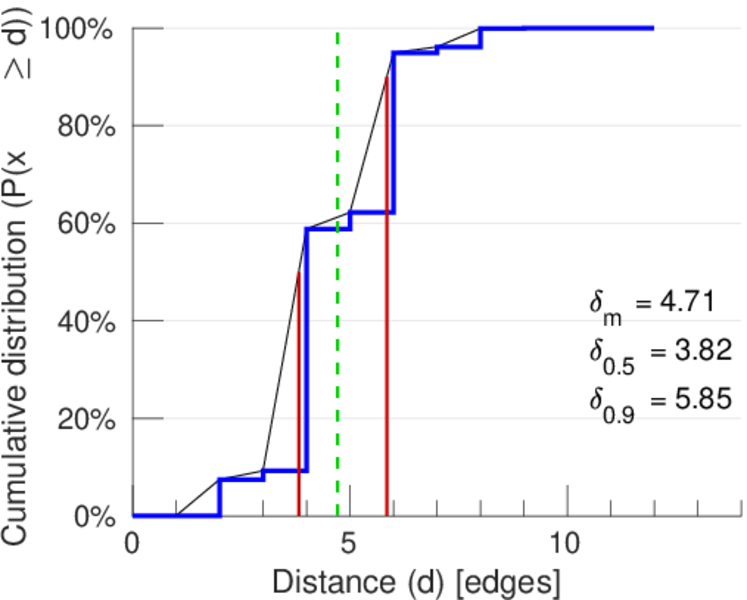
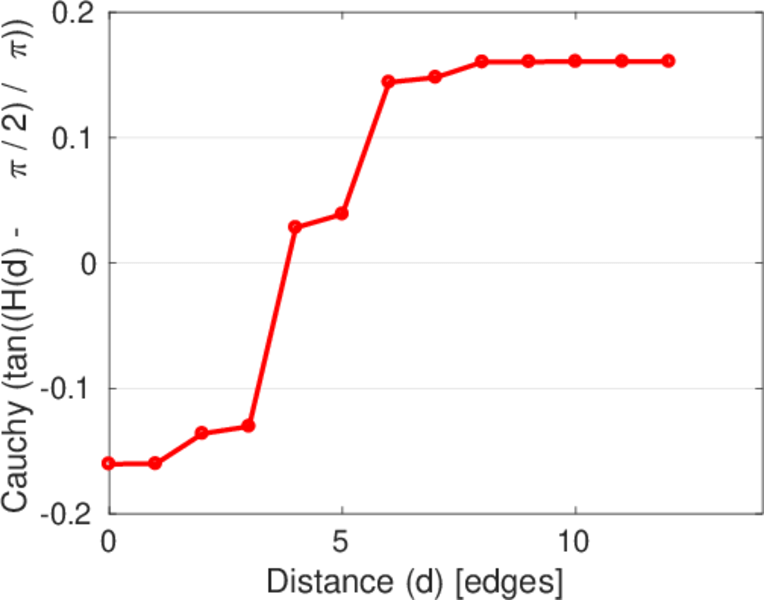
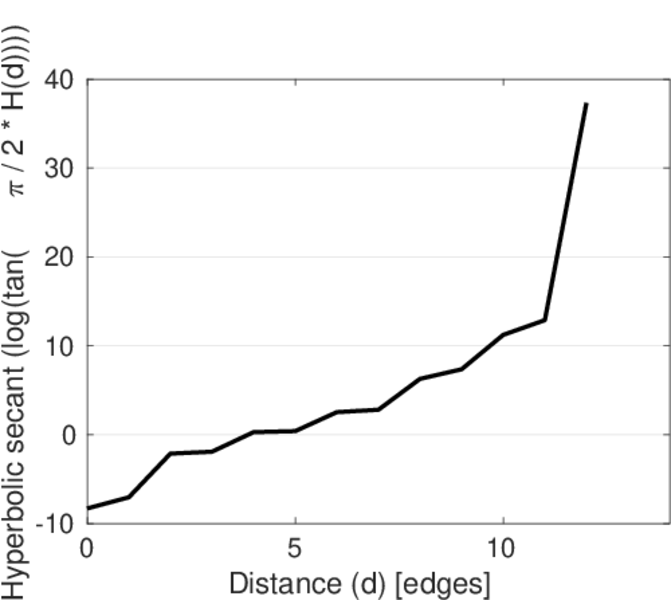
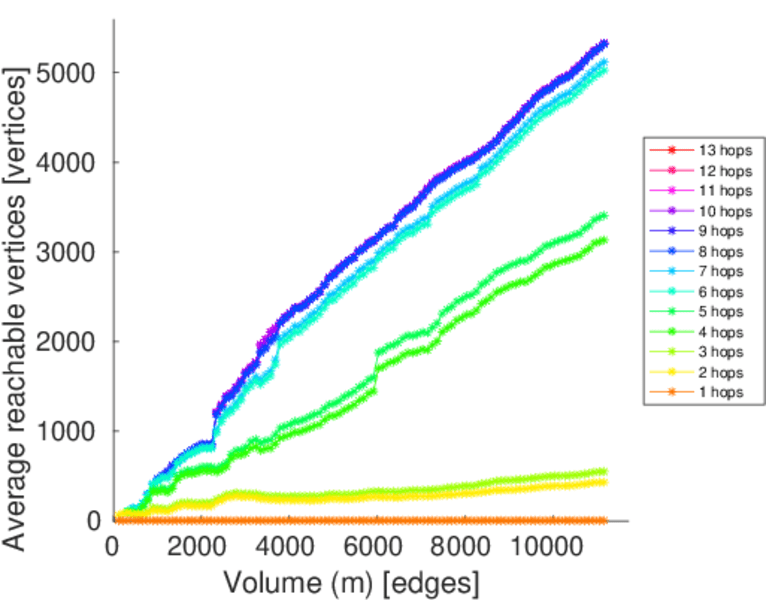
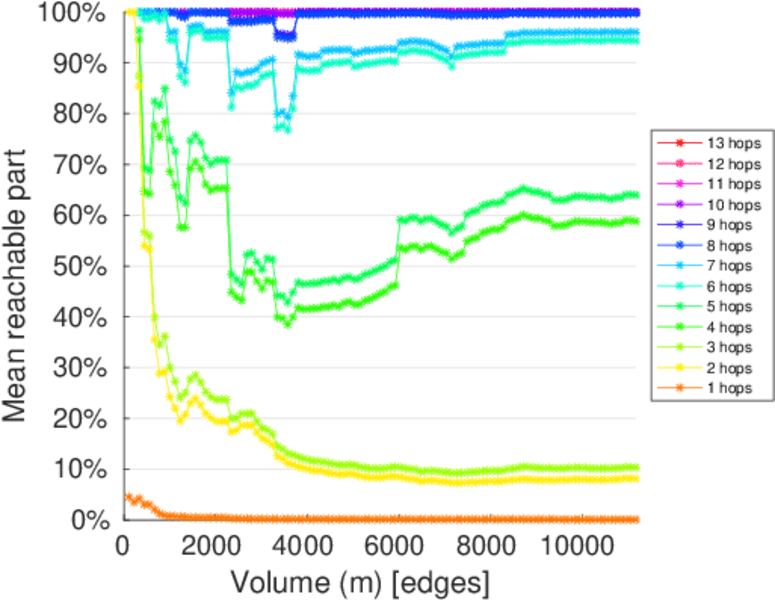
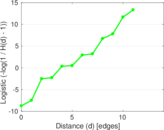
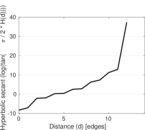
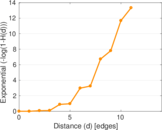
| Diameter | δ = | 12
|
| 50-Percentile effective diameter | δ0.5 = | 3.822 03
|
| 90-Percentile effective diameter | δ0.9 = | 5.849 36
|
| Median distance | δM = | 4
|
| Mean distance | δm = | 4.713 09
|
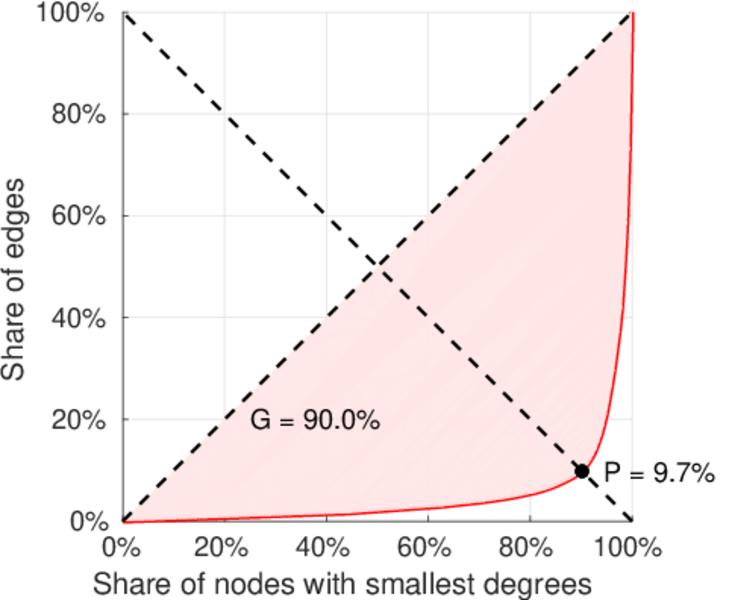
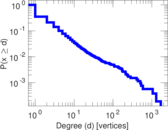
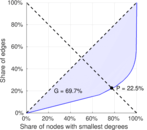
| Gini coefficient | G = | 0.710 939
|
| Balanced inequality ratio | P = | 0.214 657
|
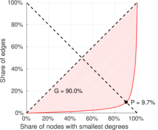
| Left balanced inequality ratio | P1 = | 0.096 577 7
|
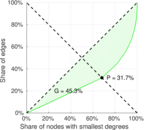
| Right balanced inequality ratio | P2 = | 0.317 416
|
| Relative edge distribution entropy | Her = | 0.783 804
|
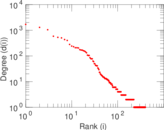
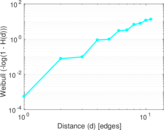
| Power law exponent | γ = | 5.826 70
|
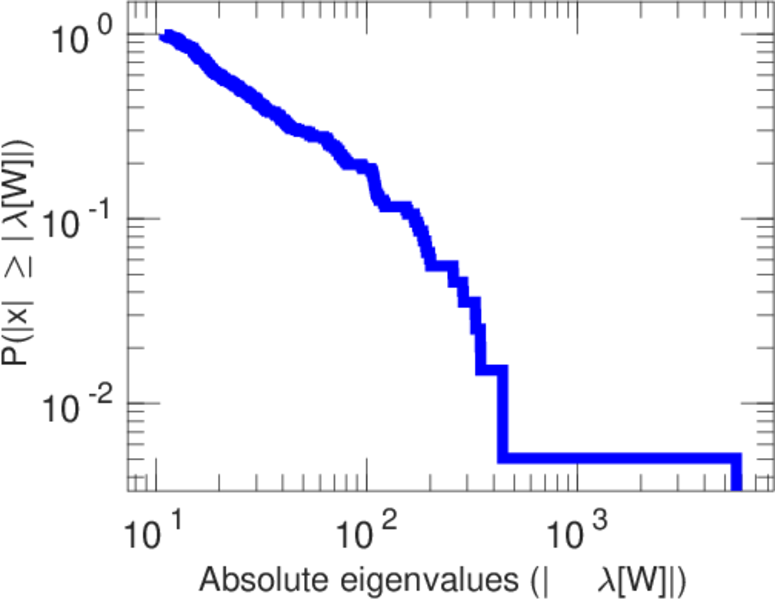
| Tail power law exponent | γt = | 2.791 00
|
| Tail power law exponent with p | γ3 = | 2.791 00
|
| p-value | p = | 0.000 00
|
| Left tail power law exponent with p | γ3,1 = | 1.771 00
|
| Left p-value | p1 = | 0.003 000 00
|
| Right tail power law exponent with p | γ3,2 = | 4.121 00
|
| Right p-value | p2 = | 0.003 000 00
|
| Degree assortativity | ρ = | −0.161 492
|
| Degree assortativity p-value | pρ = | 1.807 01 × 10−40
|
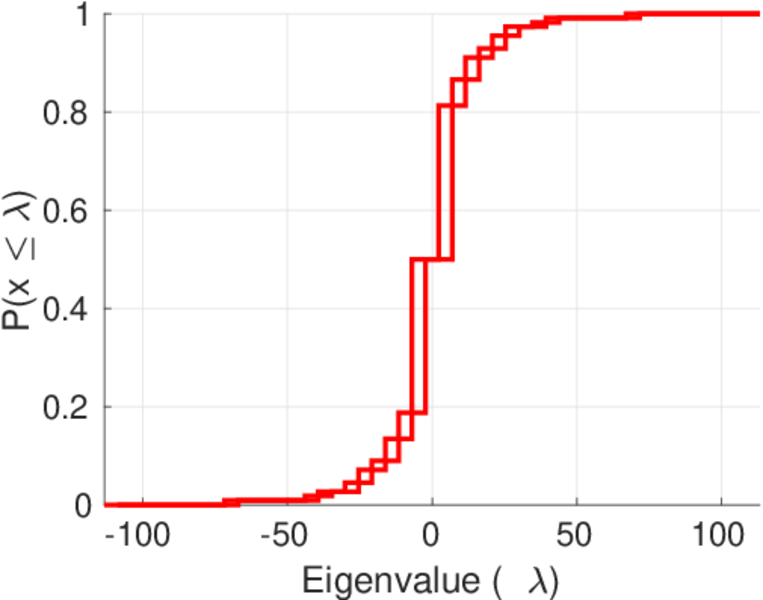
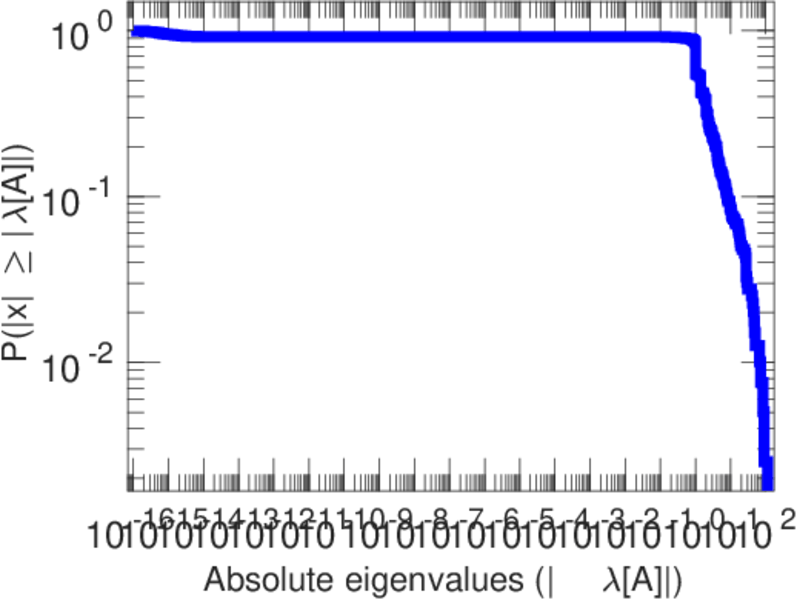
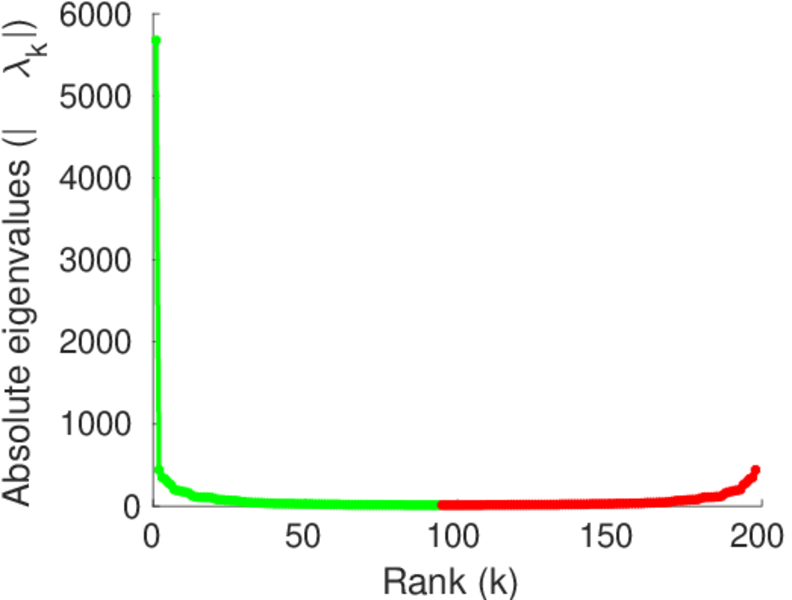
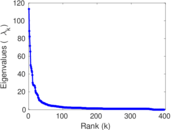
| Spectral norm | α = | 113.232
|
| Algebraic connectivity | a = | 0.020 918 6
|
| Spectral separation | |λ1[A] / λ2[A]| = | 1.280 50
|
| Controllability | C = | 4,921
|
| Relative controllability | Cr = | 0.871 128
|
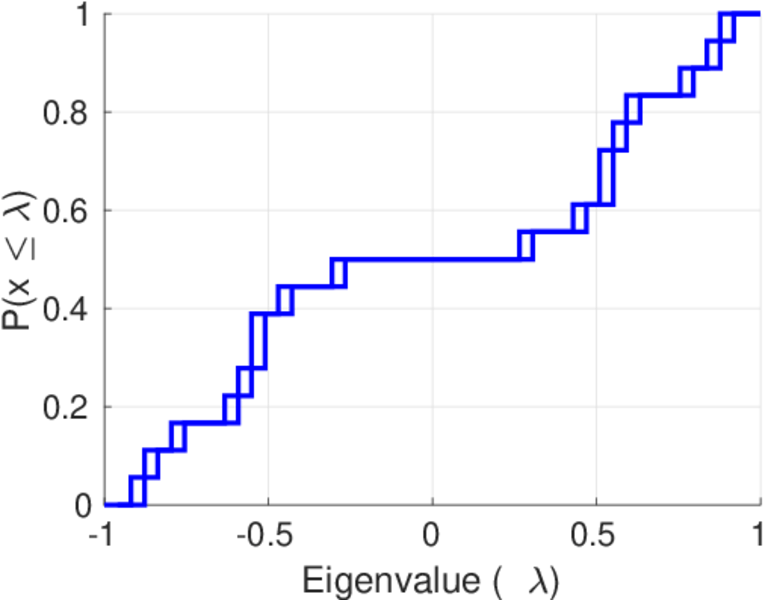
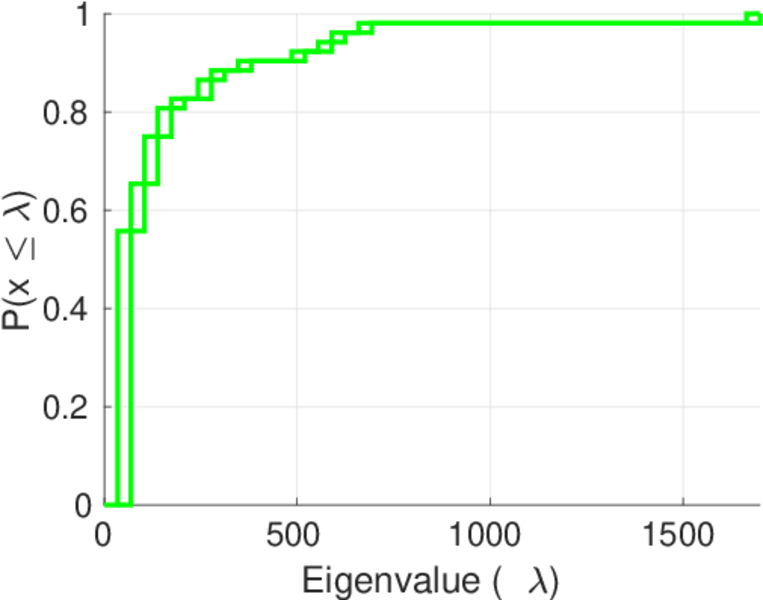
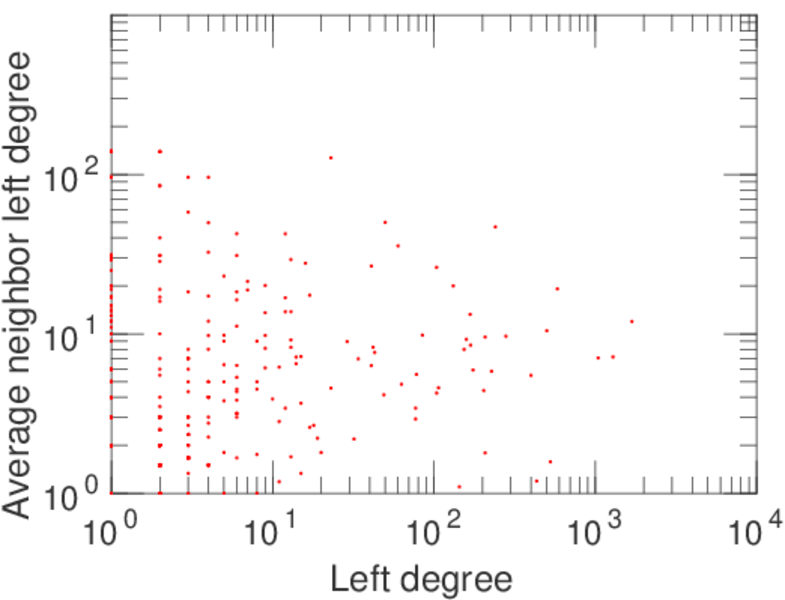
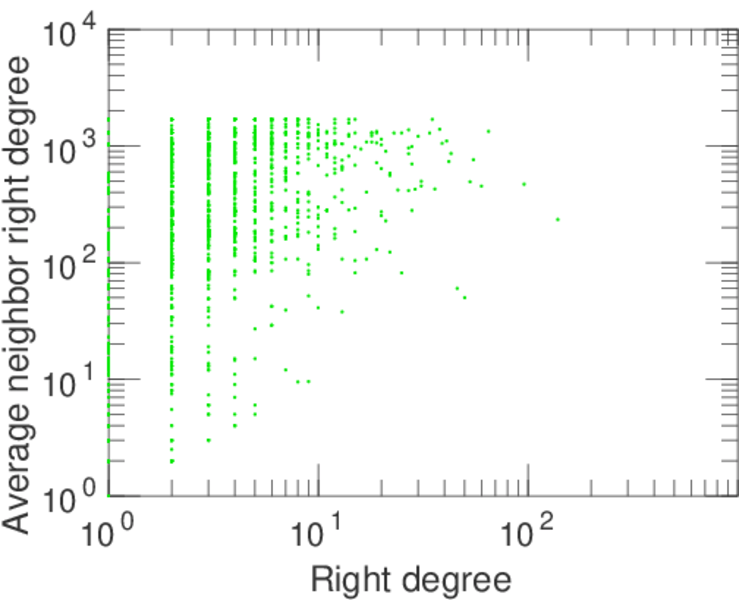
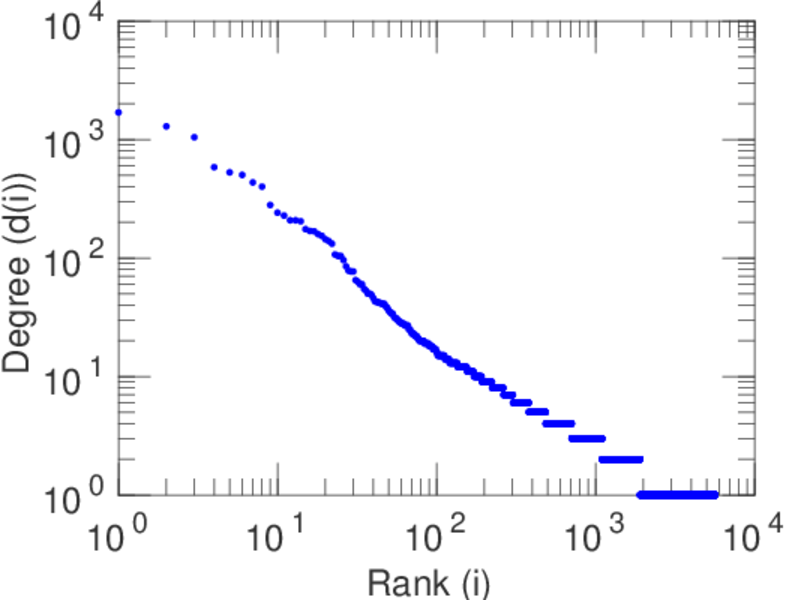
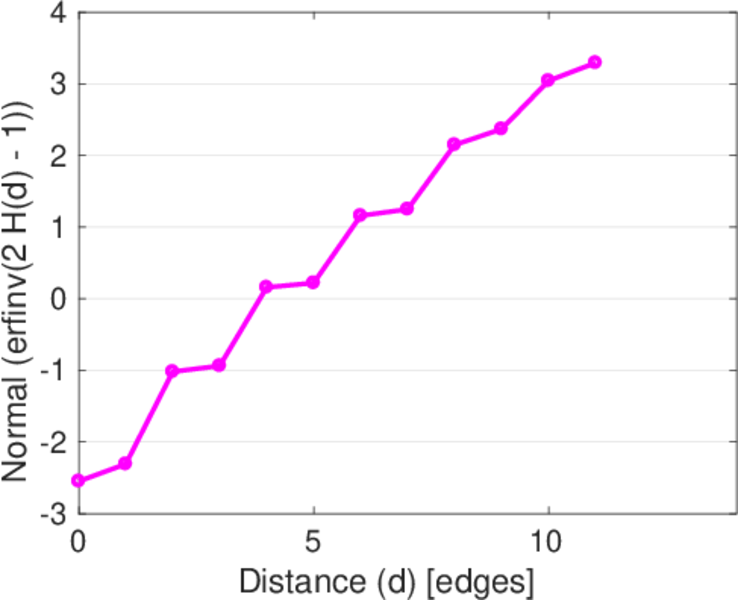
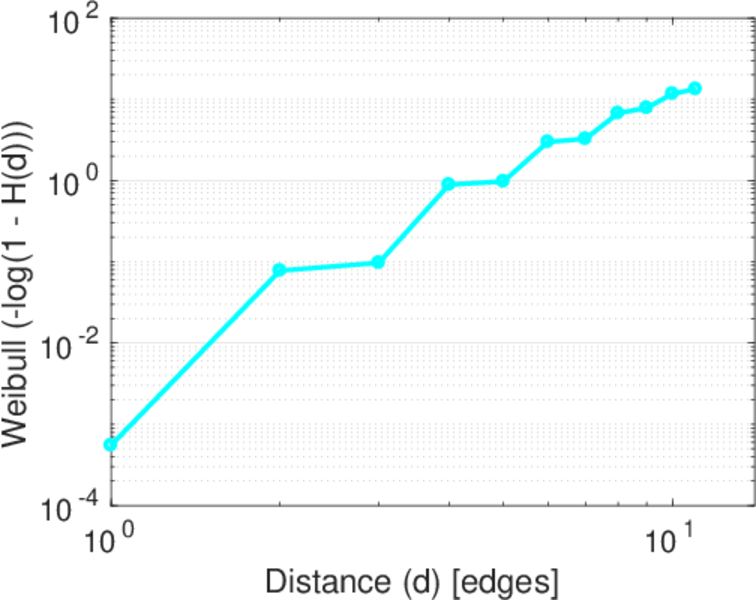
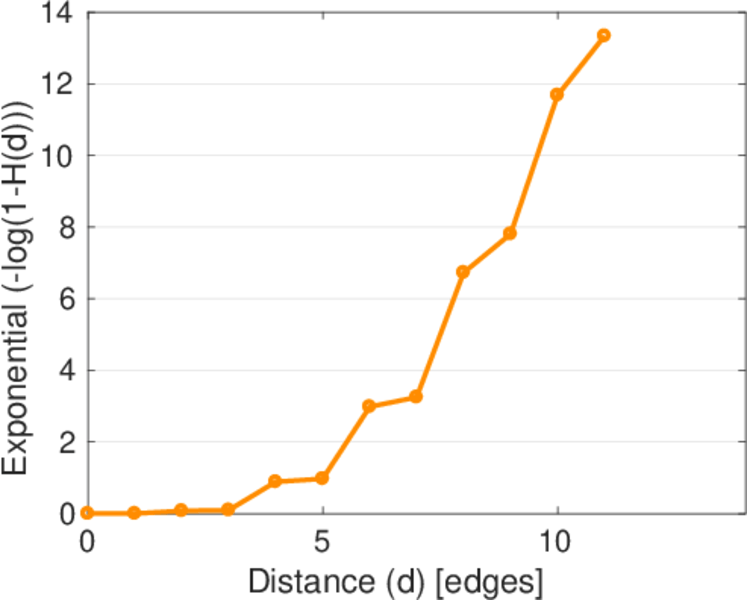
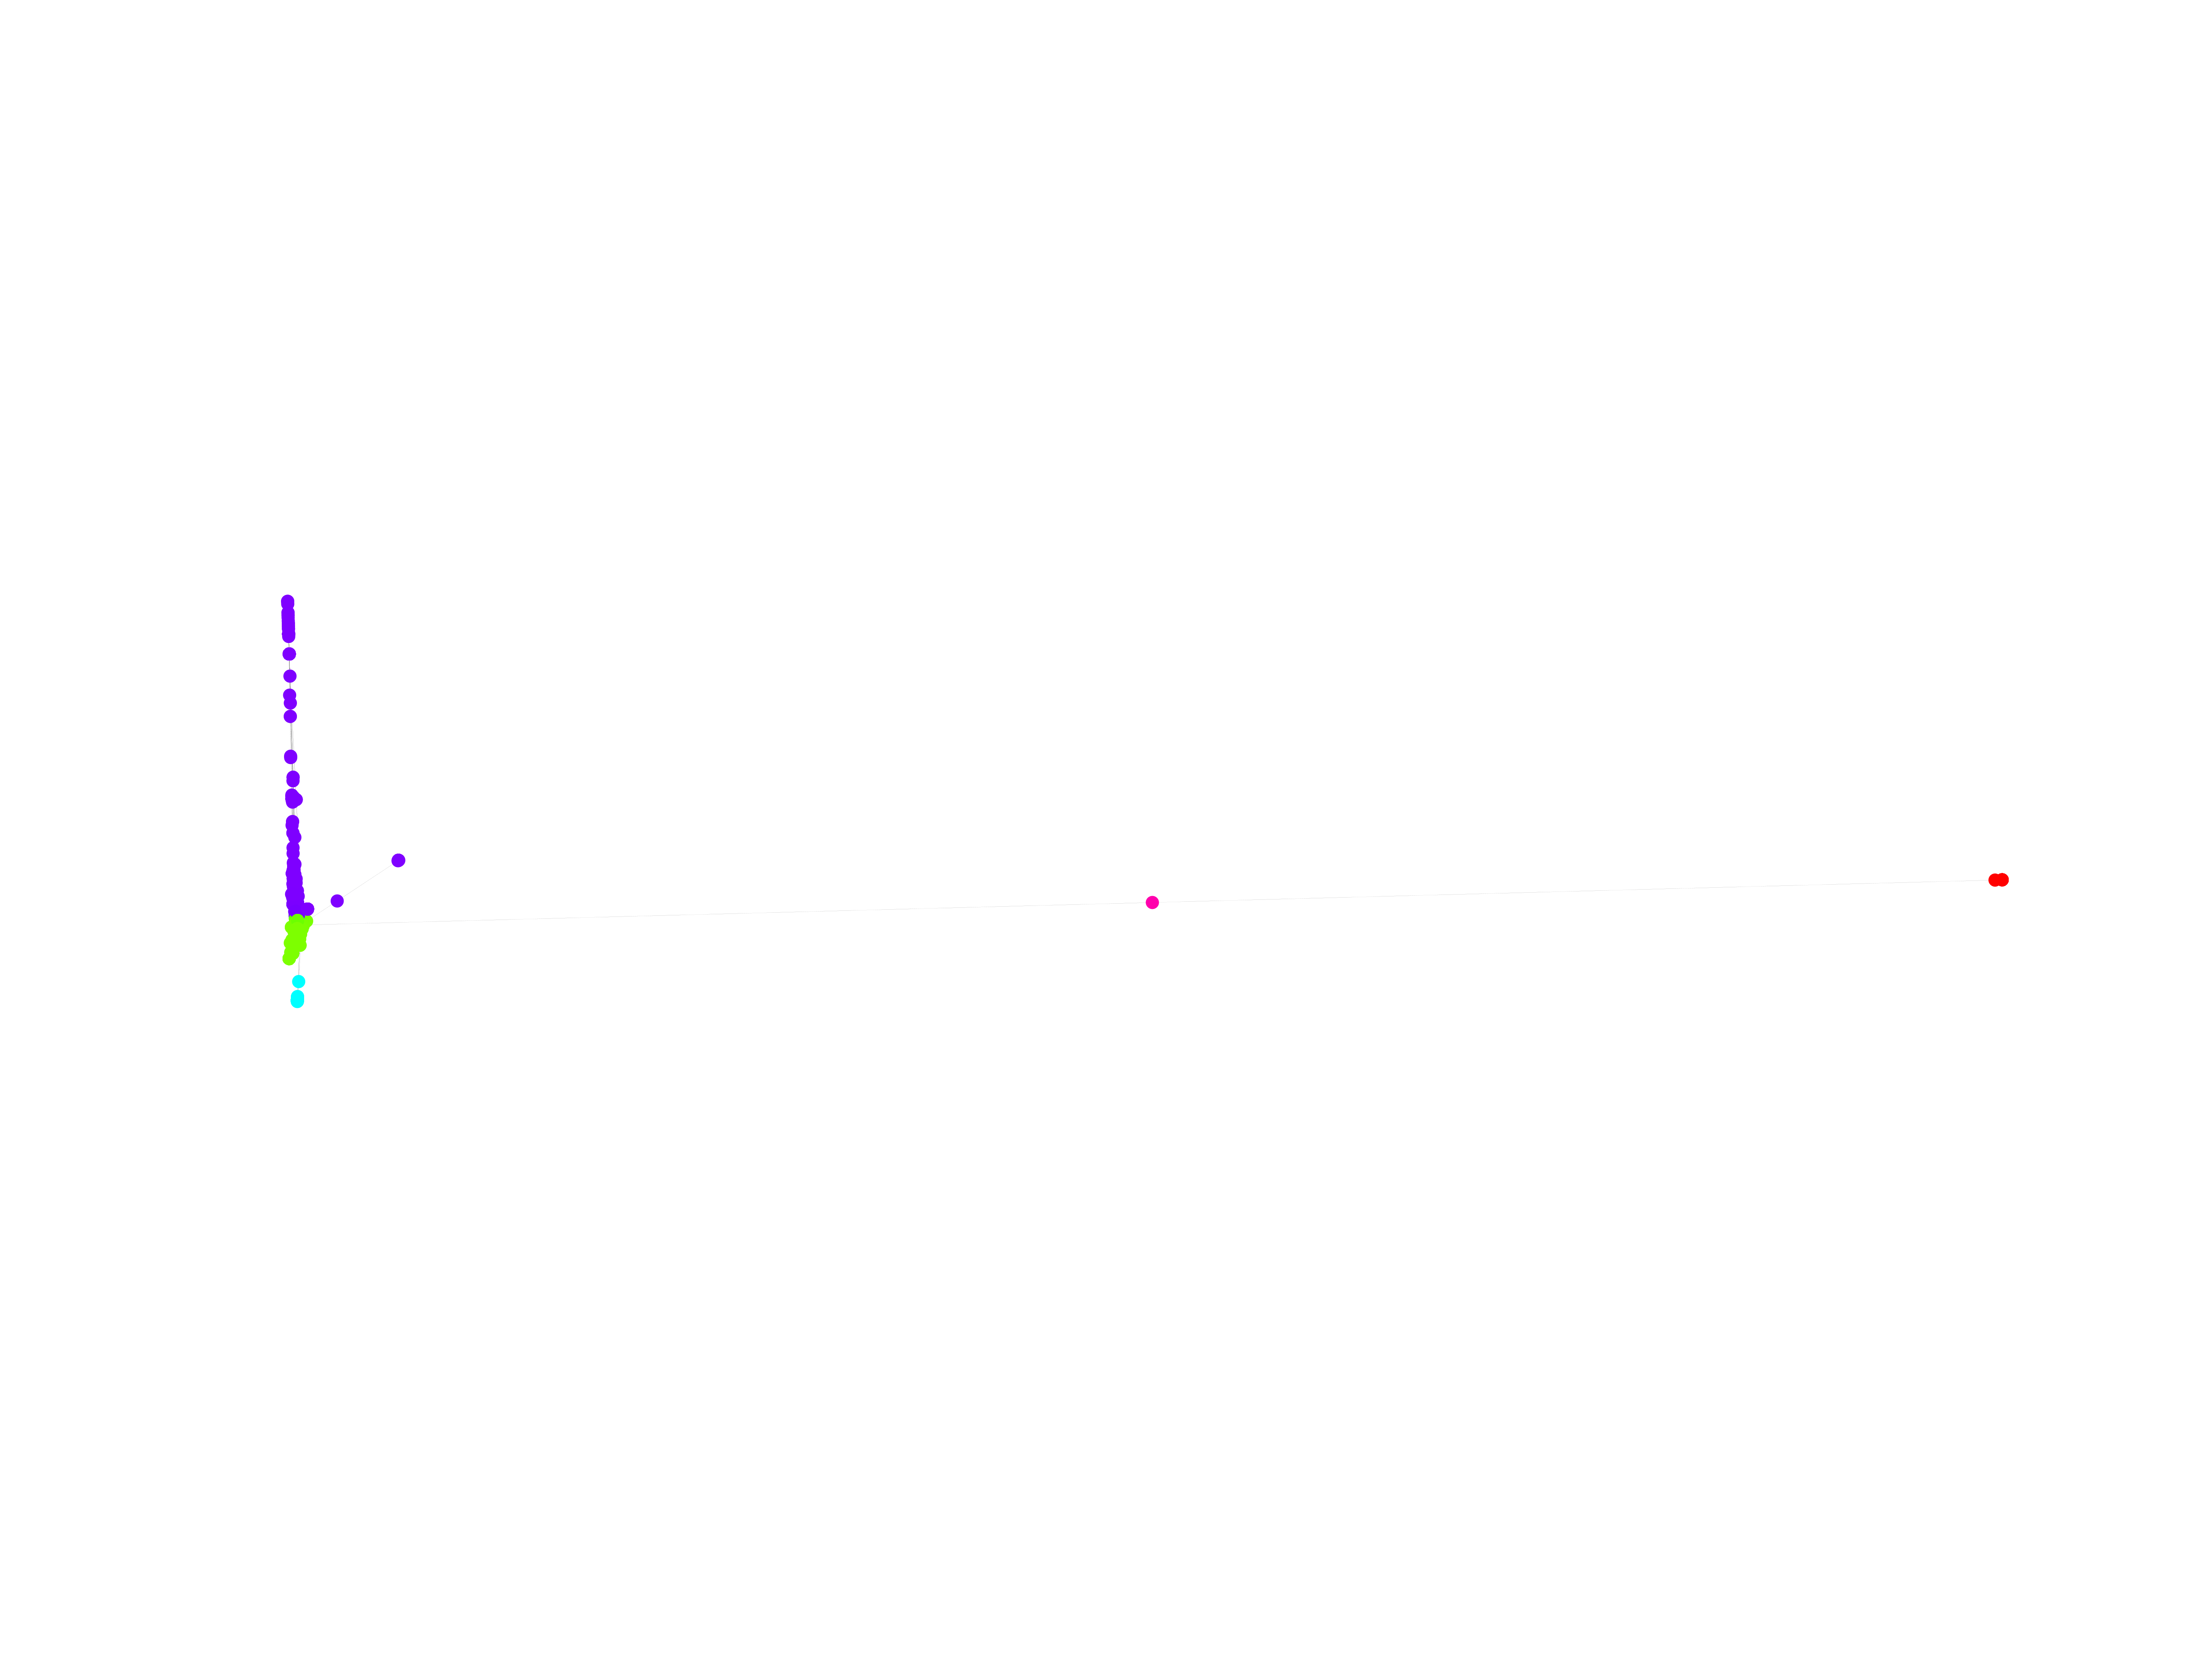
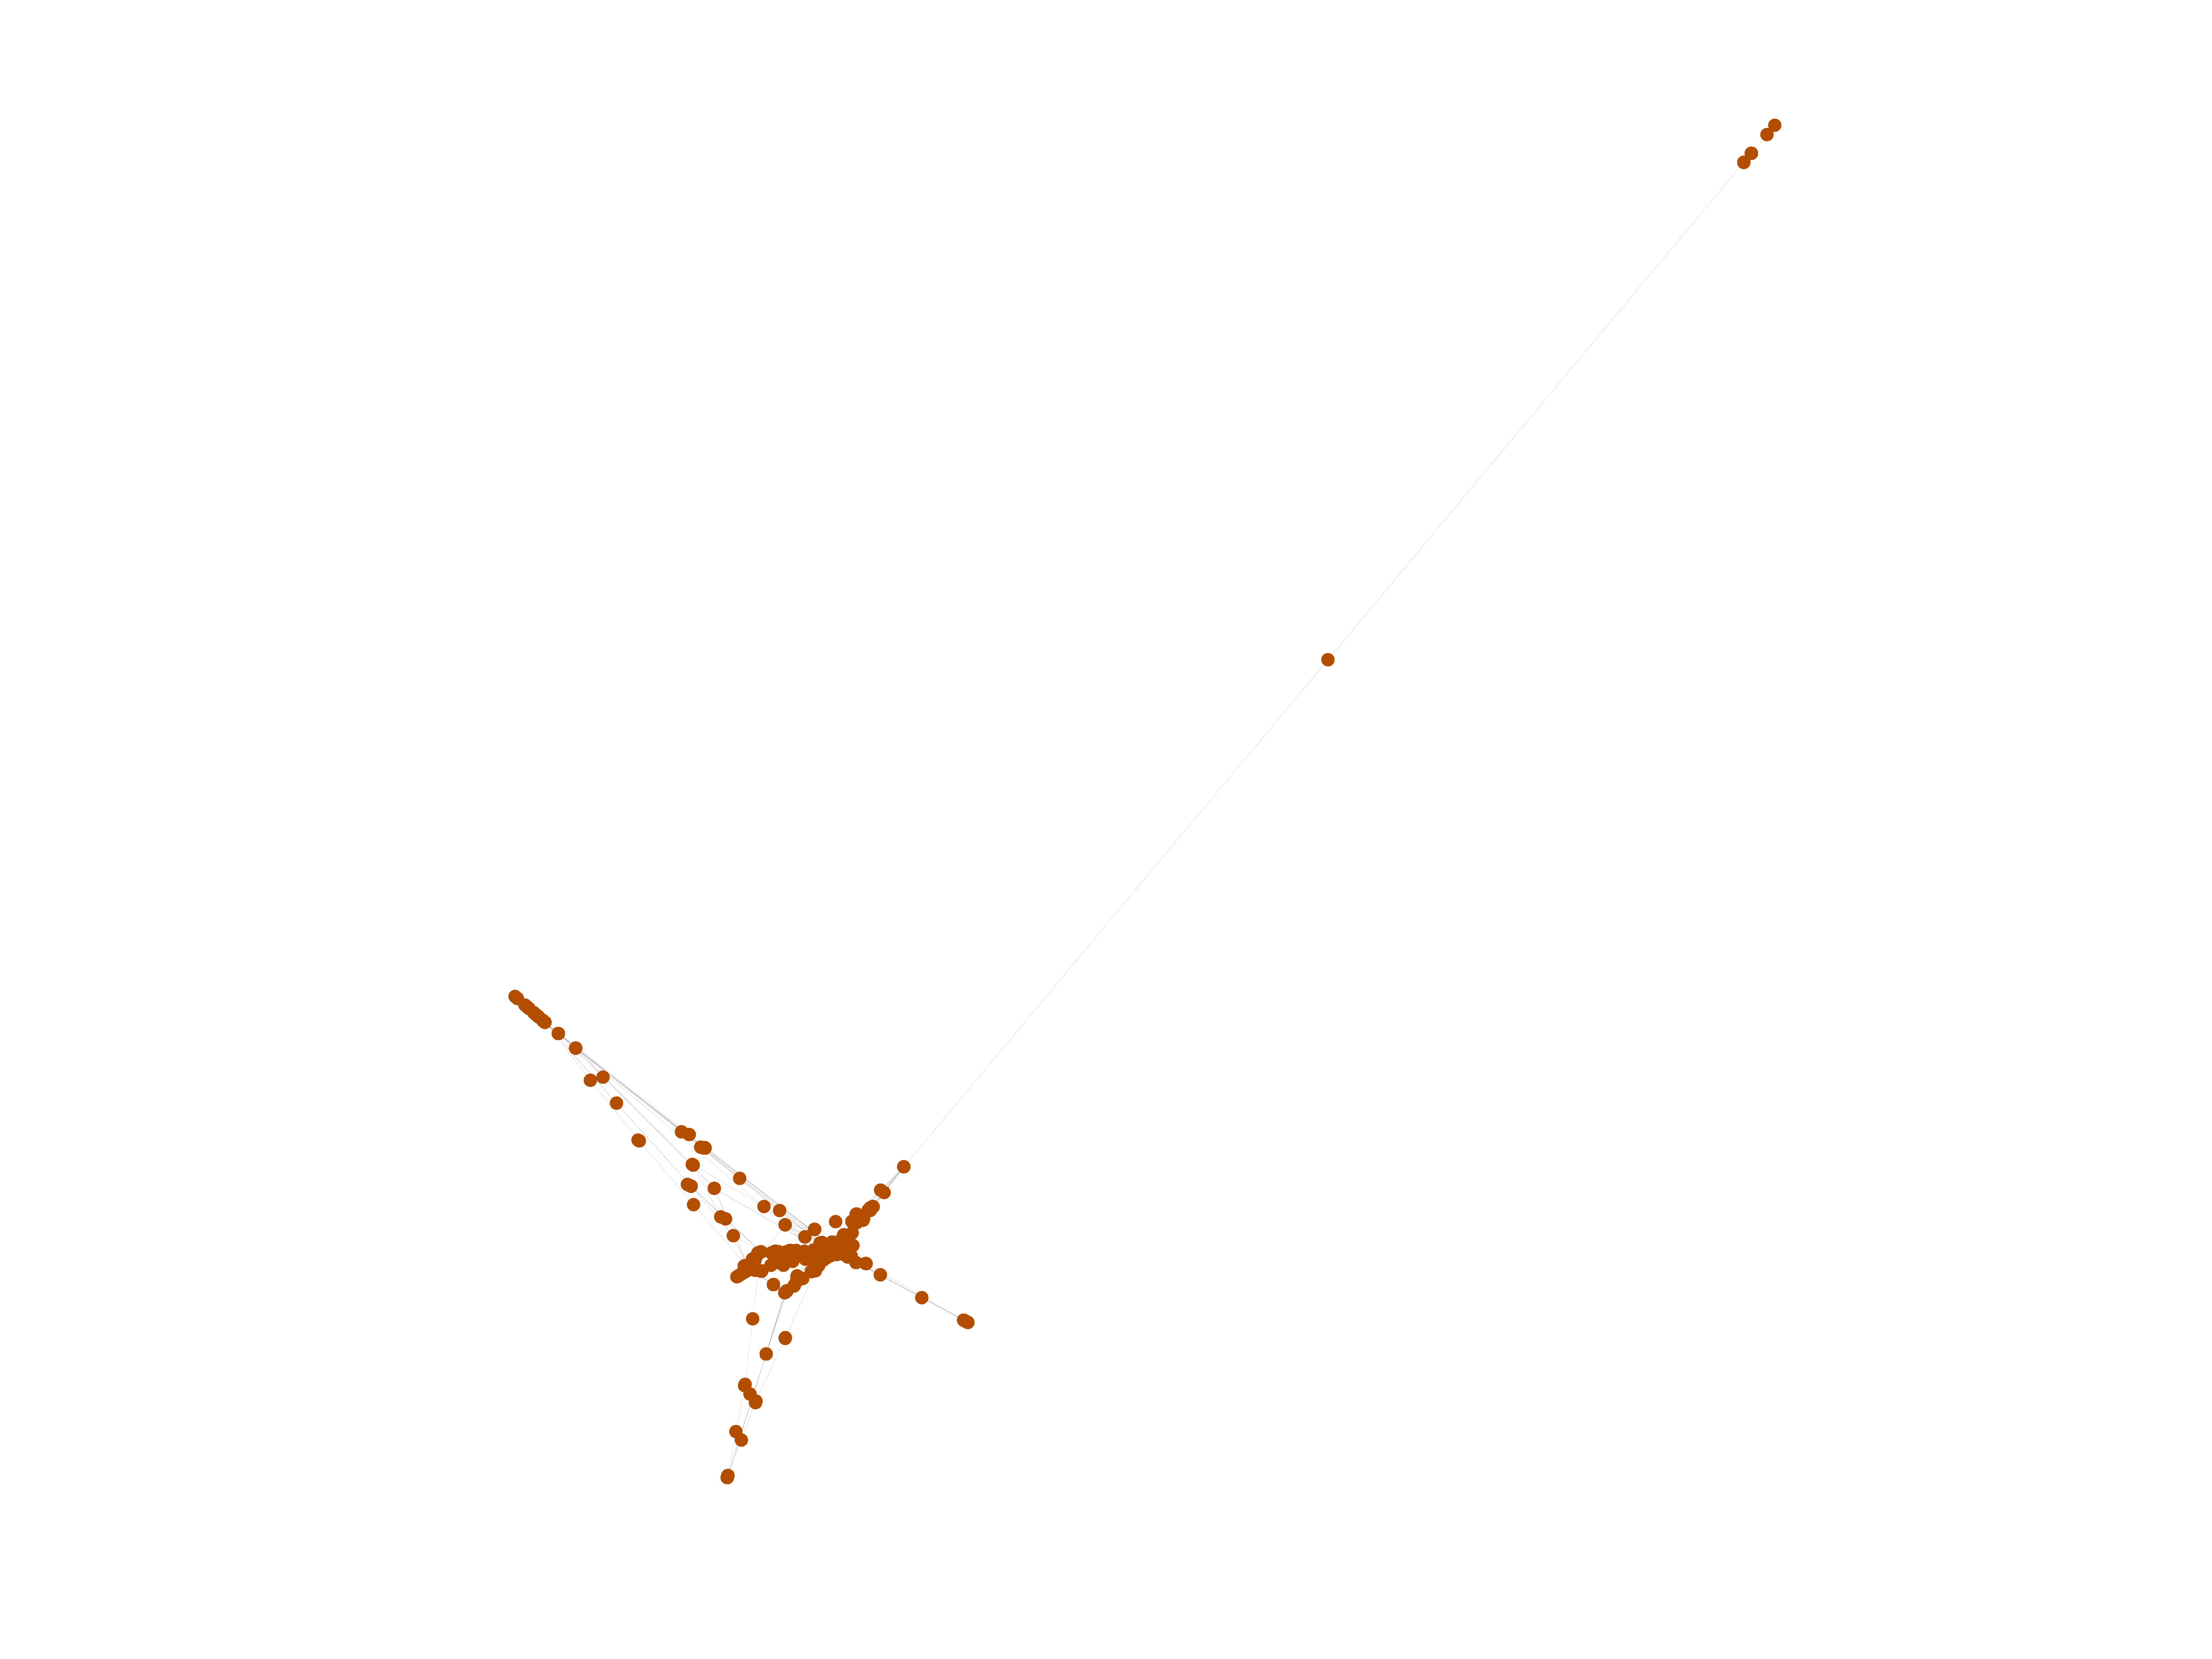
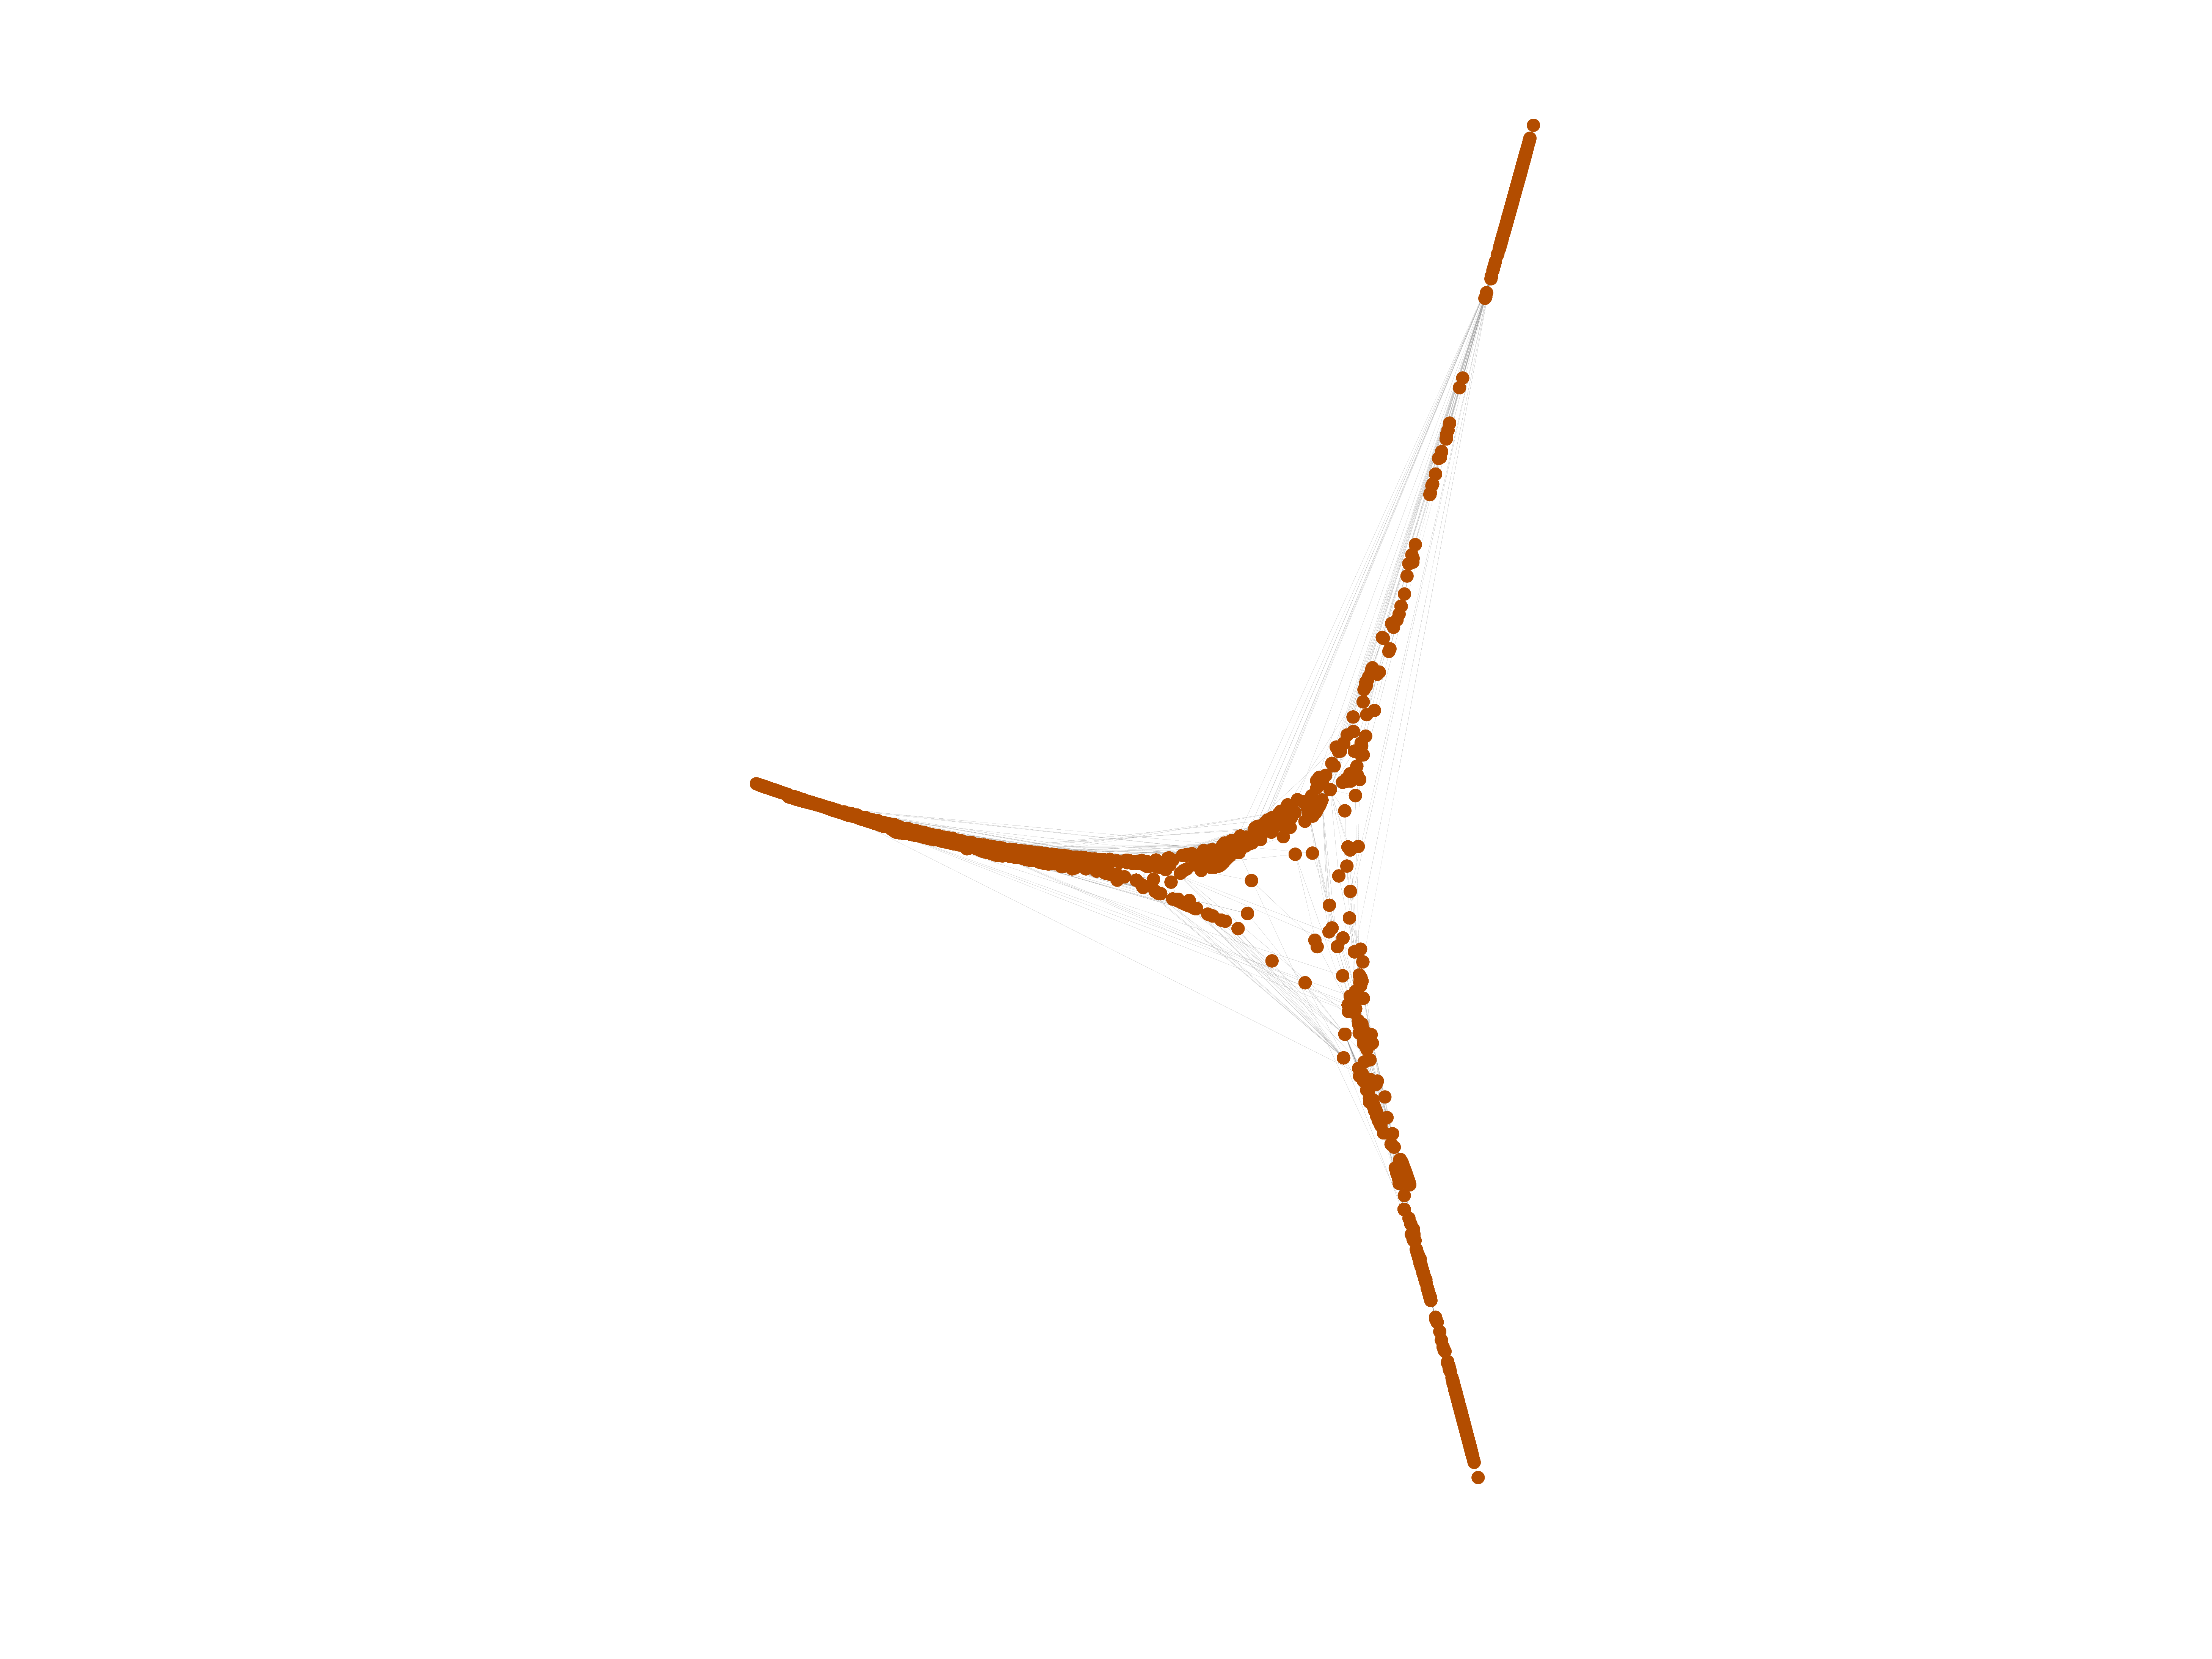
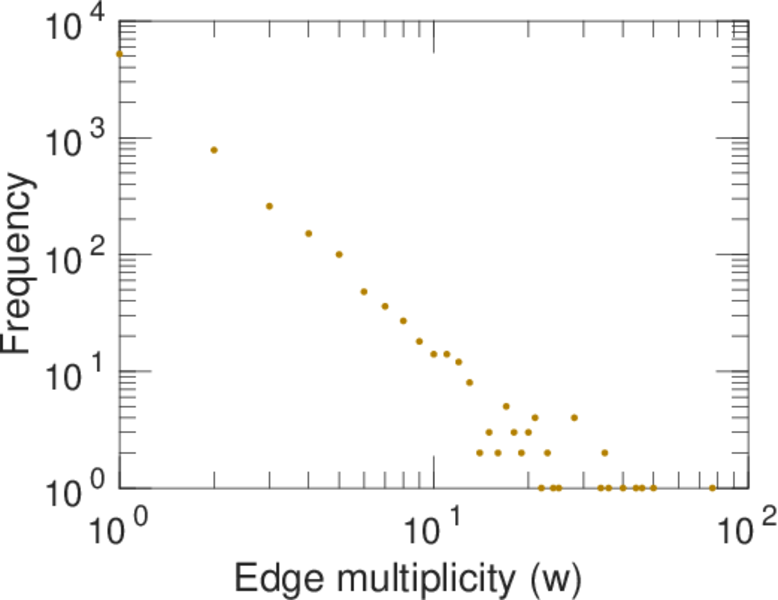
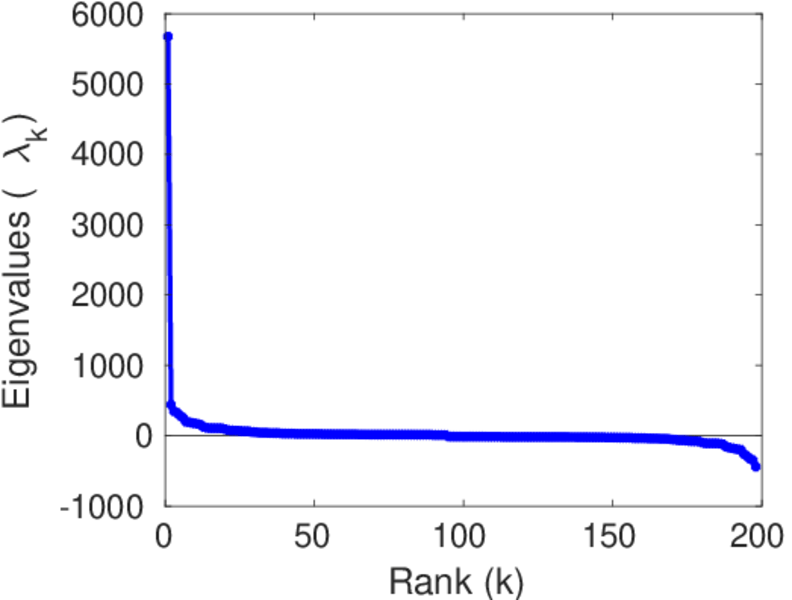
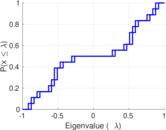
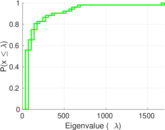
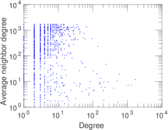
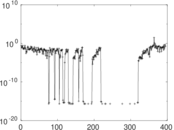
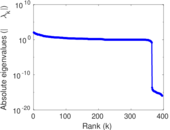
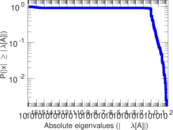
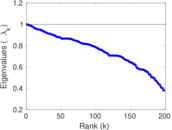
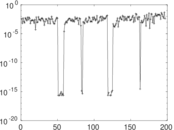
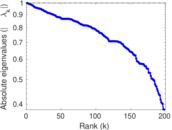
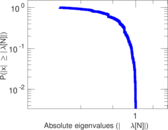
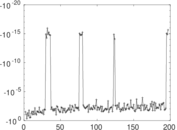
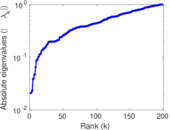
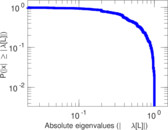
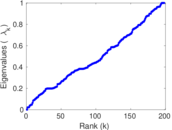
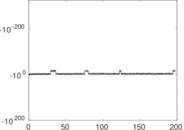
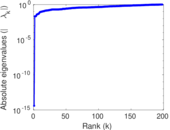
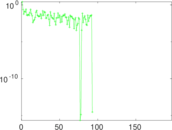
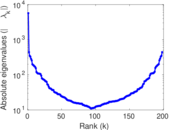
Plots


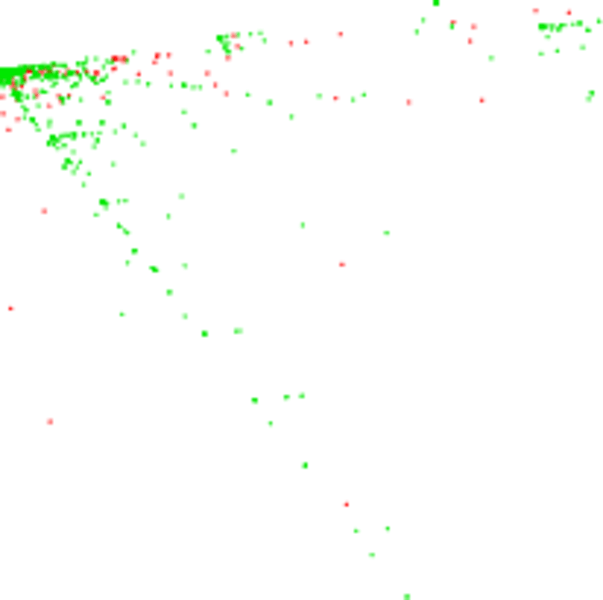
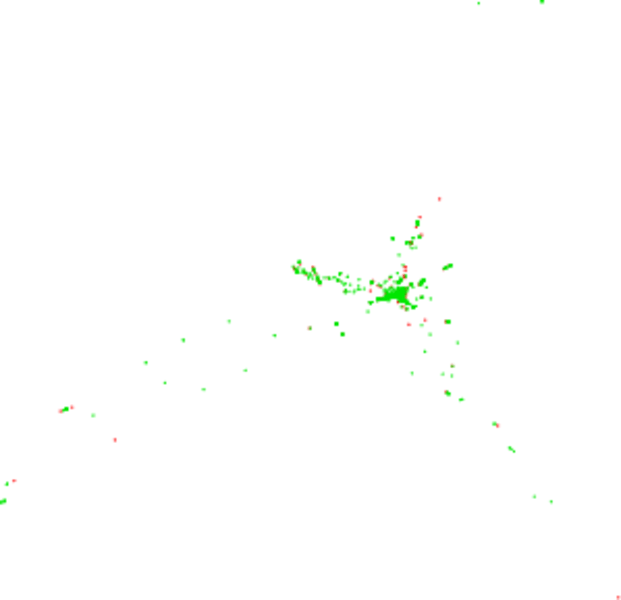
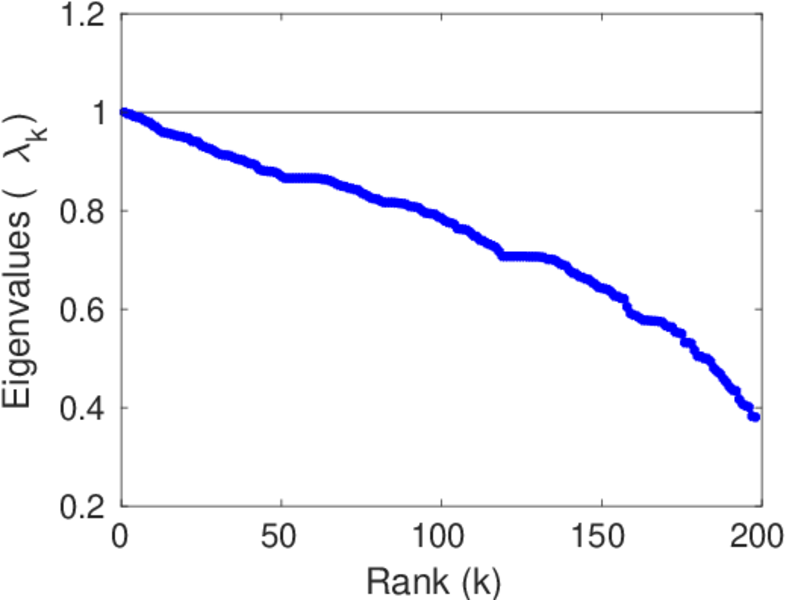
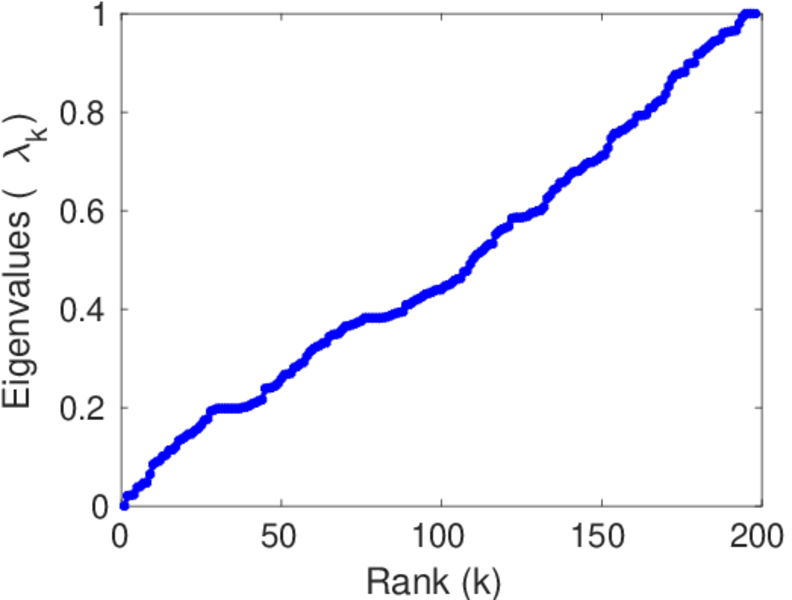
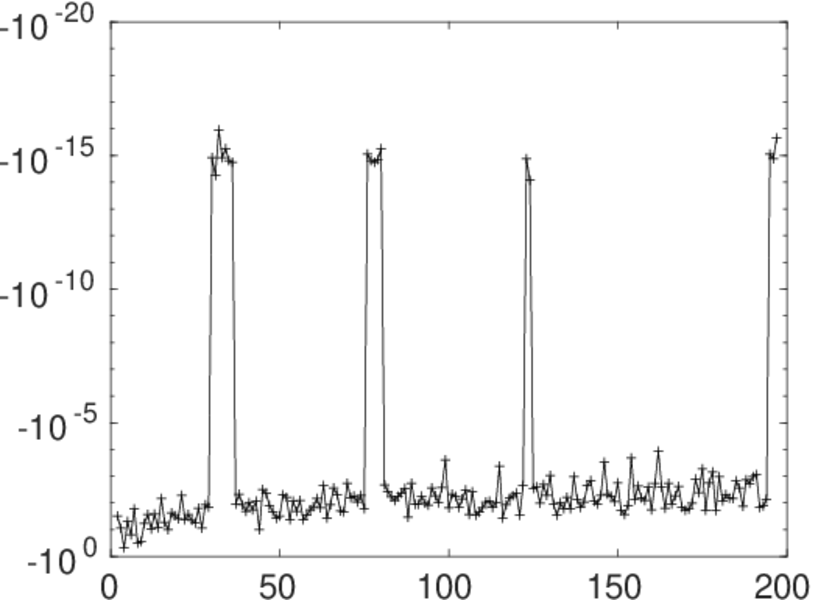
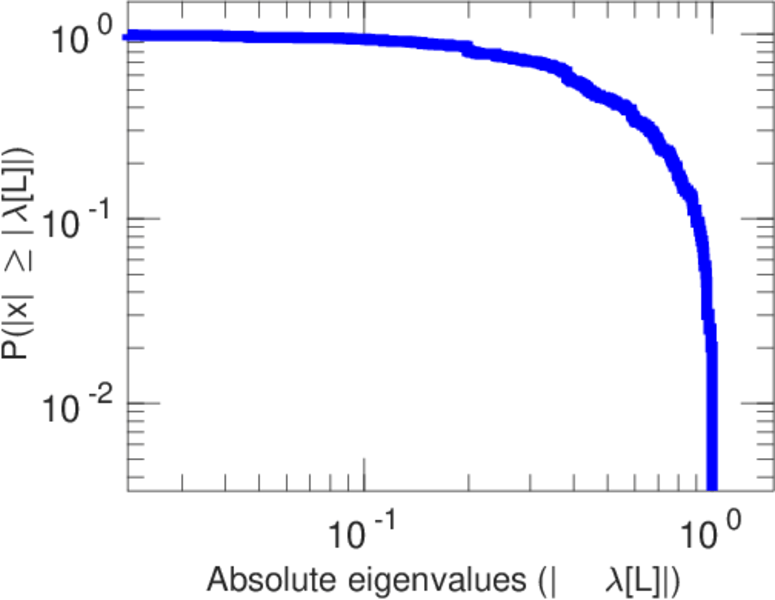
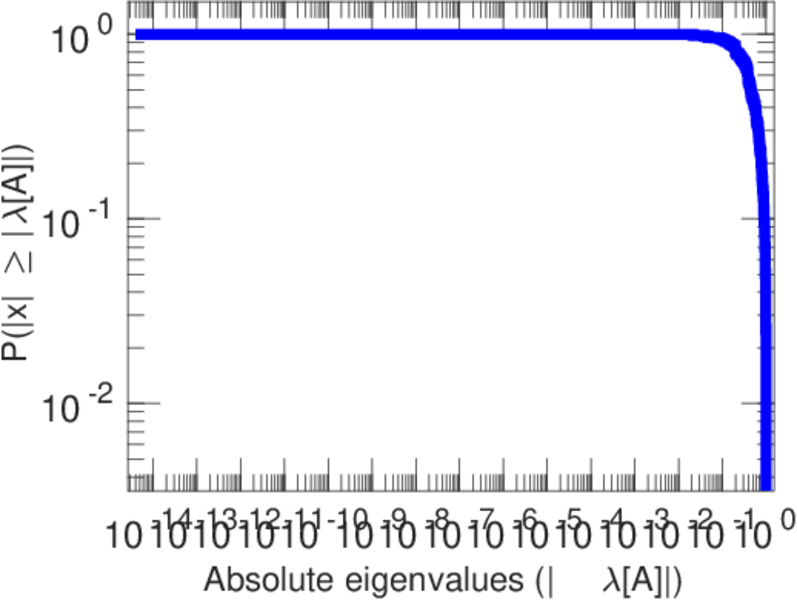
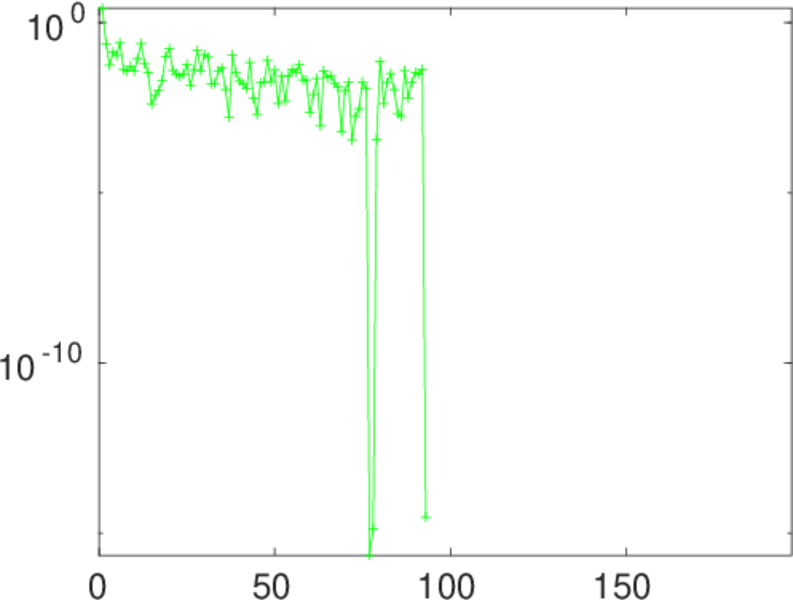
Matrix decompositions plots


Downloads
References
|
[1]
|
Jérôme Kunegis.
KONECT – The Koblenz Network Collection.
In Proc. Int. Conf. on World Wide Web Companion, pages
1343–1350, 2013.
[ http ]
|
|
[2]
|
Wikimedia Foundation.
Wikimedia downloads.
http://dumps.wikimedia.org/, January 2010.
|
 KONECT ‣ Networks ‣
Buy Me a Coffee
KONECT ‣ Networks ‣
Buy Me a Coffee