Wikipedia edits (bpy)
This is the bipartite edit network of the Bishnupriya Wikipedia. It contains
users and pages from the Bishnupriya Wikipedia, connected by edit events. Each
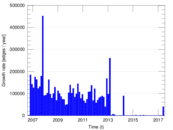
edge represents an edit. The dataset includes the timestamp of each edit.
Metadata
Statistics
| Size | n = | 59,218
|
| Left size | n1 = | 1,320
|
| Right size | n2 = | 57,898
|
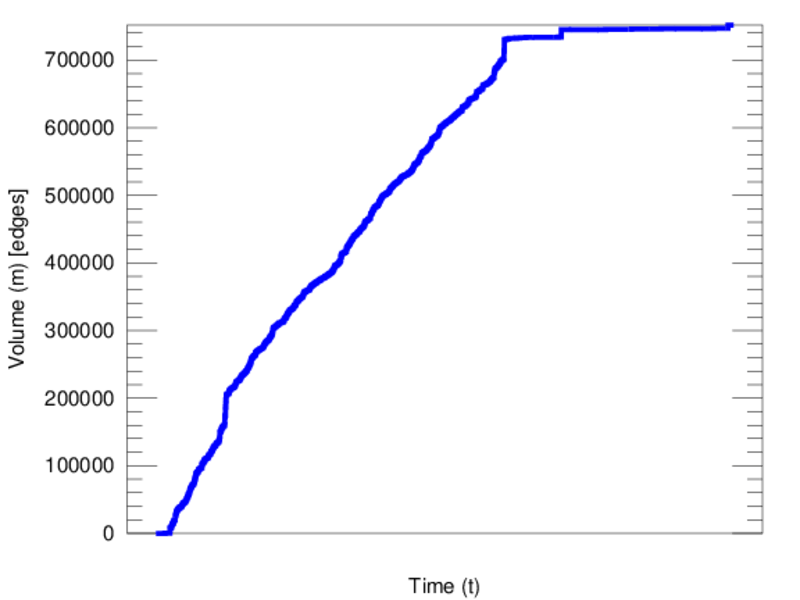
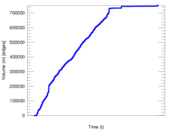
| Volume | m = | 751,880
|
| Unique edge count | m̿ = | 399,738
|
| Wedge count | s = | 3,036,538,714
|
| Claw count | z = | 30,671,398,549,132
|
| Cross count | x = | 324,559,374,630,734,912
|
| Square count | q = | 6,334,365,685
|
| 4-Tour count | T4 = | 62,821,967,140
|
| Maximum degree | dmax = | 111,146
|
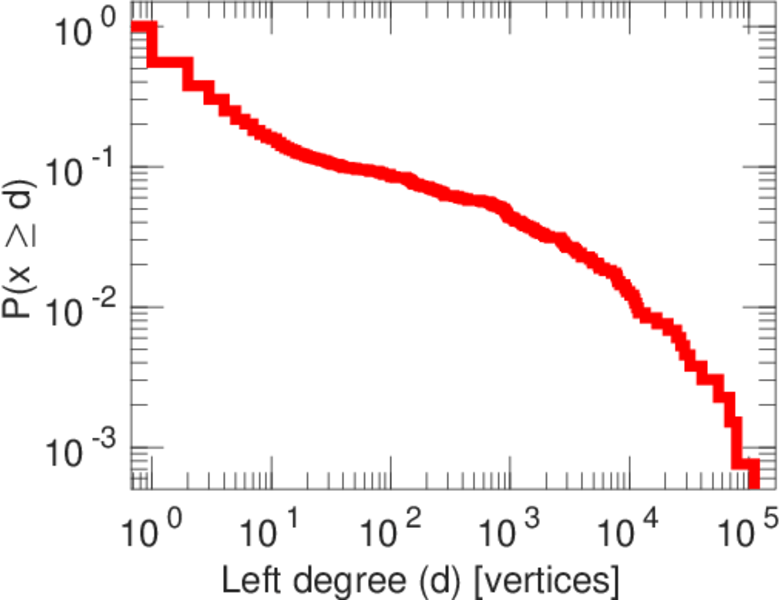
| Maximum left degree | d1max = | 111,146
|
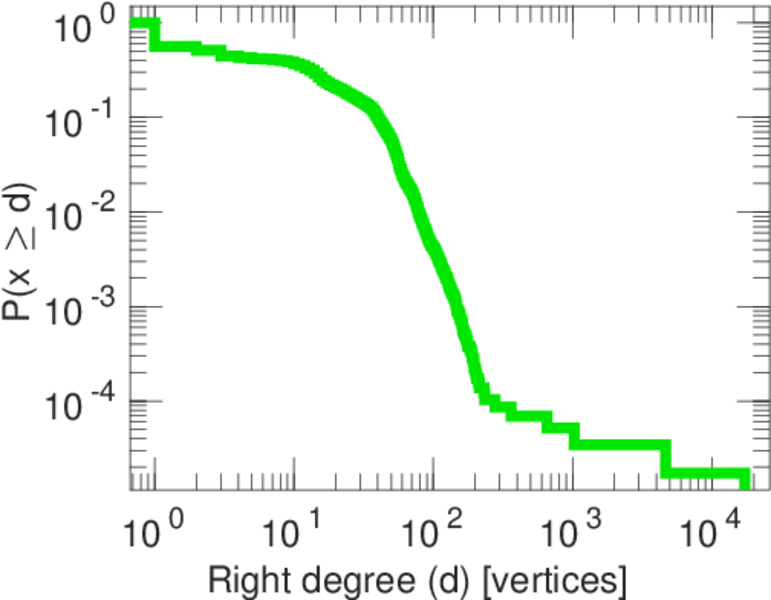
| Maximum right degree | d2max = | 17,272
|
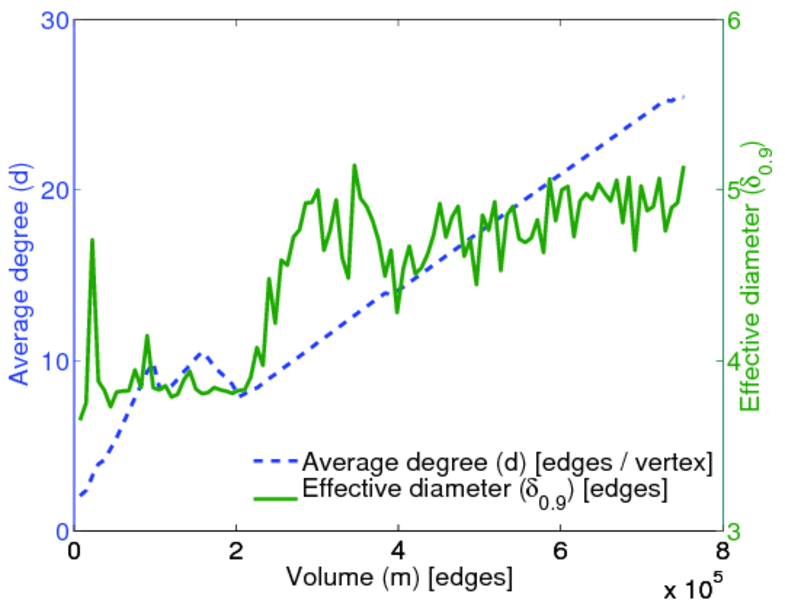
| Average degree | d = | 25.393 6
|
| Average left degree | d1 = | 569.606
|
| Average right degree | d2 = | 12.986 3
|
| Fill | p = | 0.005 230 44
|
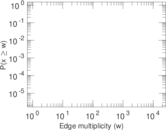
| Average edge multiplicity | m̃ = | 1.880 93
|
| Size of LCC | N = | 58,395
|
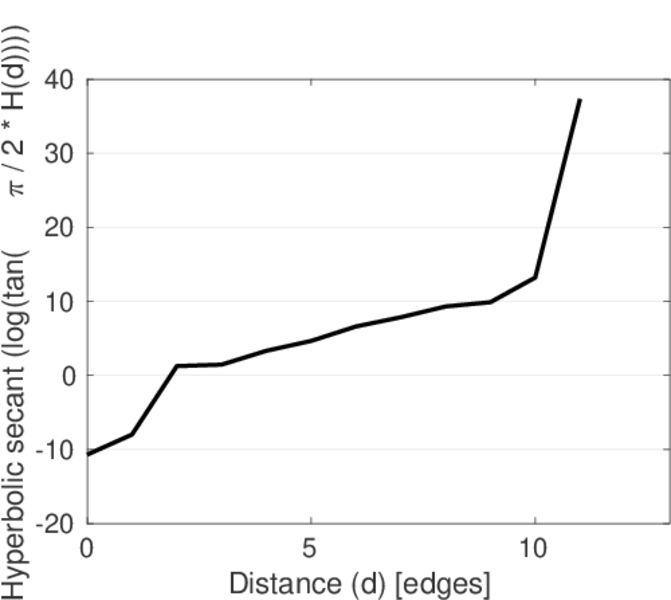
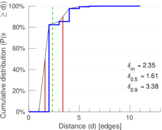
| Diameter | δ = | 14
|
| 50-Percentile effective diameter | δ0.5 = | 1.607 56
|
| 90-Percentile effective diameter | δ0.9 = | 3.375 50
|
| Median distance | δM = | 2
|
| Mean distance | δm = | 2.353 48
|
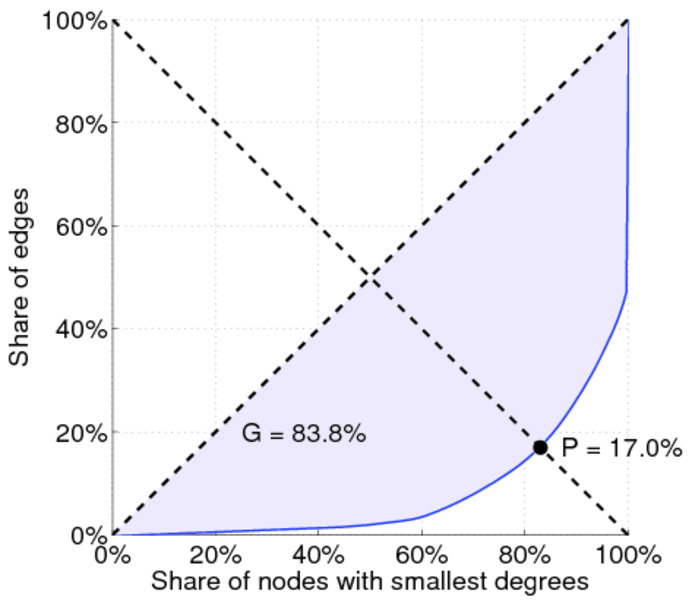
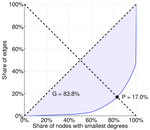
| Balanced inequality ratio | P = | 0.171 738
|
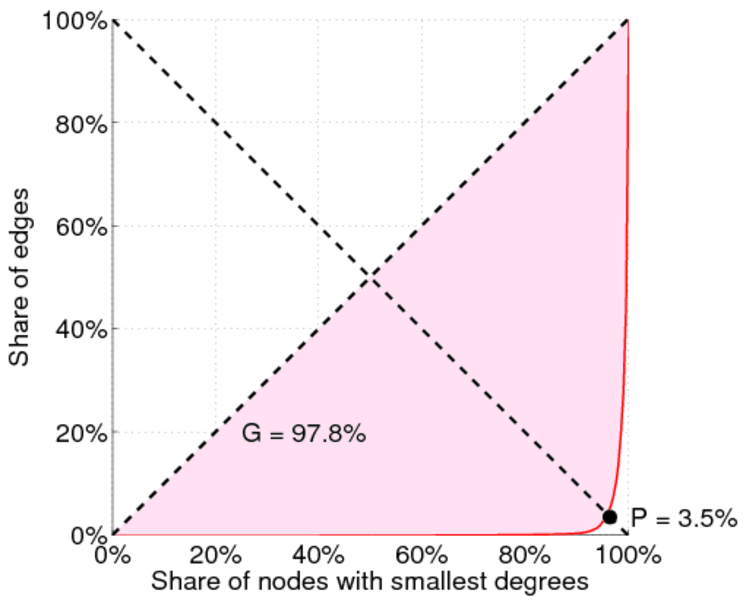
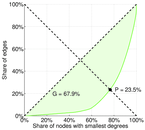
| Left balanced inequality ratio | P1 = | 0.034 589 3
|
| Right balanced inequality ratio | P2 = | 0.234 813
|
| Relative edge distribution entropy | Her = | 0.712 135
|
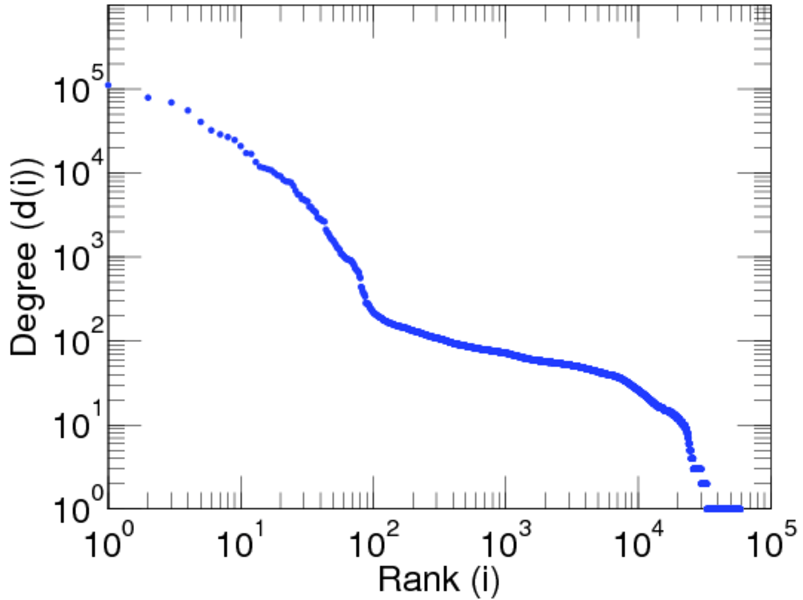
| Power law exponent | γ = | 1.824 33
|
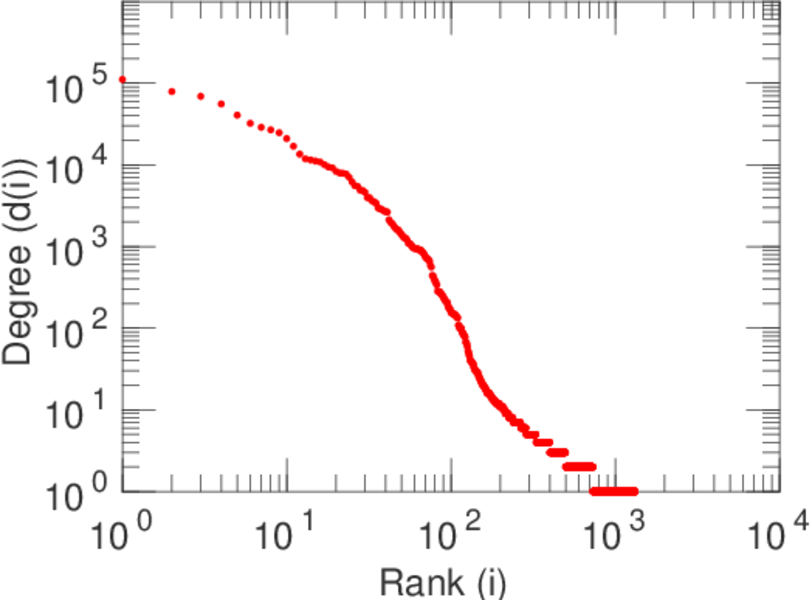
| Tail power law exponent | γt = | 4.091 00
|
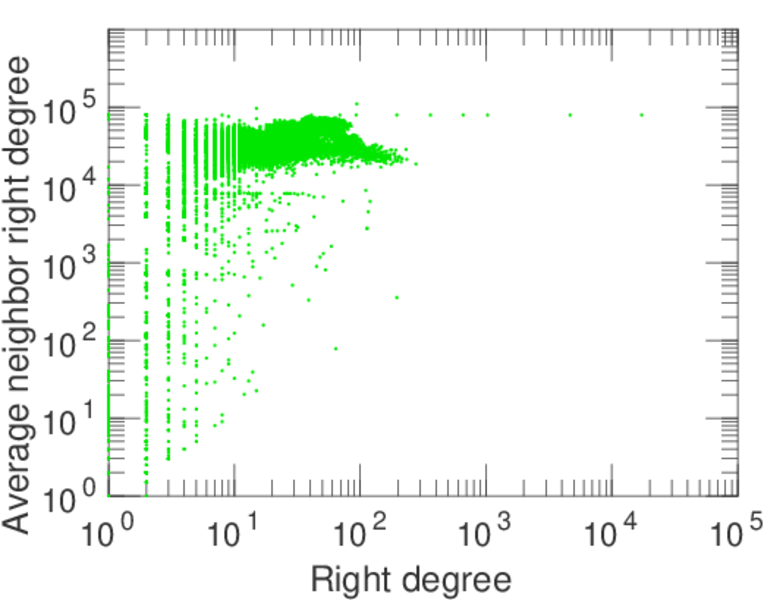
| Degree assortativity | ρ = | −0.384 710
|
| Degree assortativity p-value | pρ = | 0.000 00
|
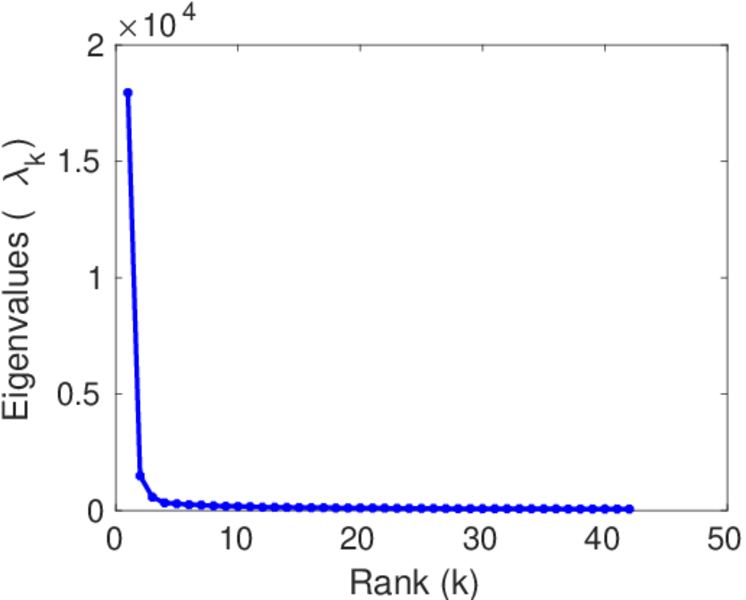
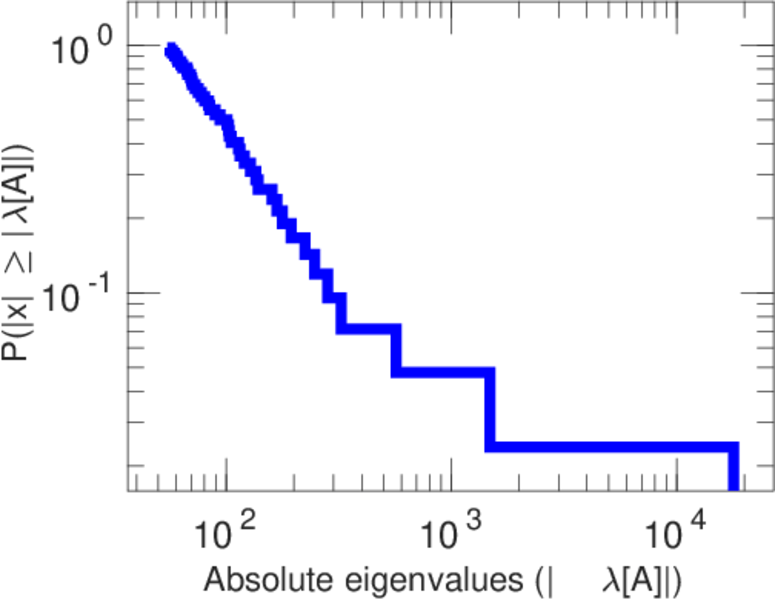
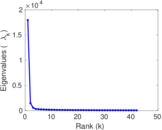
| Spectral norm | α = | 17,938.7
|
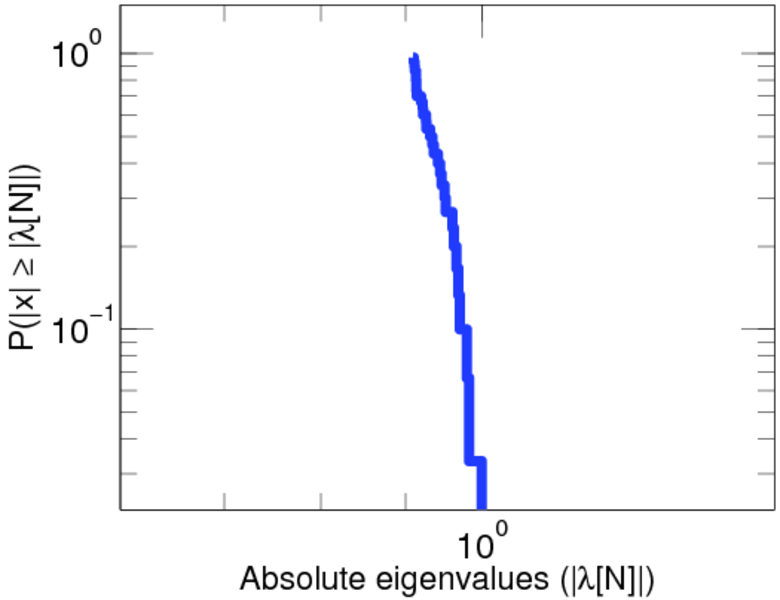
| Algebraic connectivity | a = | 0.044 343 2
|
| Spectral separation | |λ1[A] / λ2[A]| = | 12.104 6
|
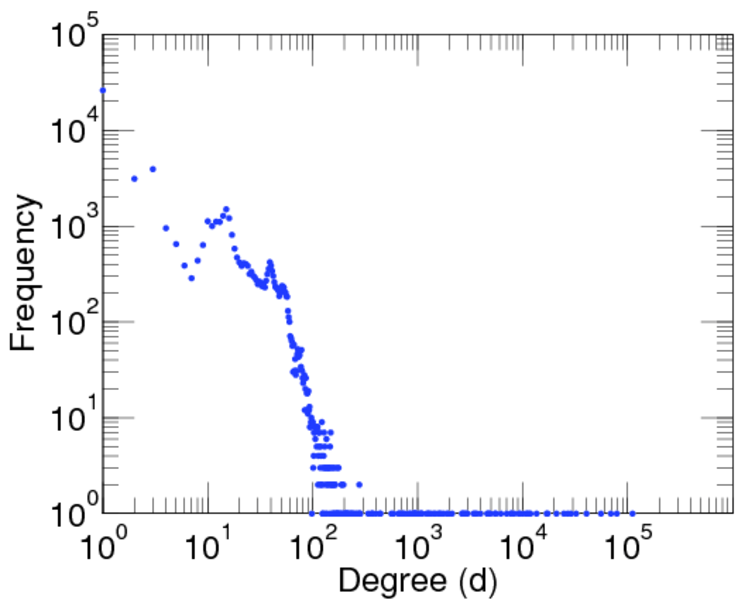
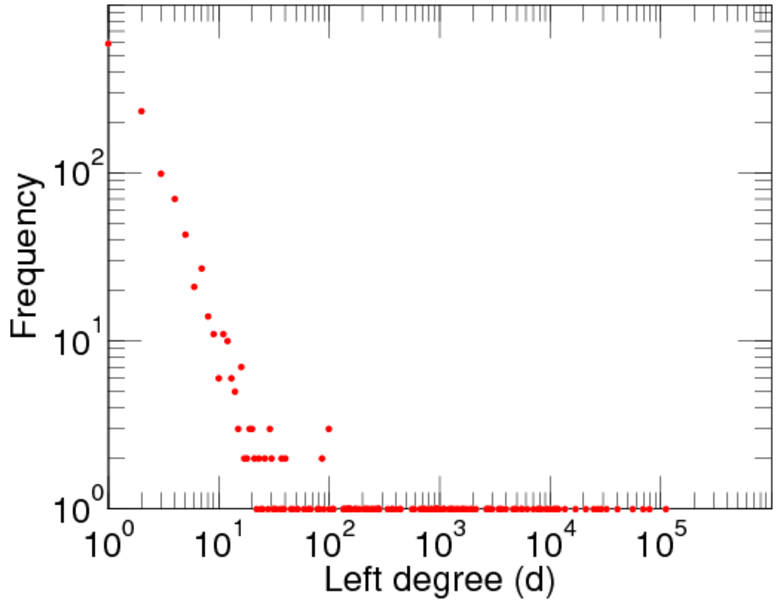
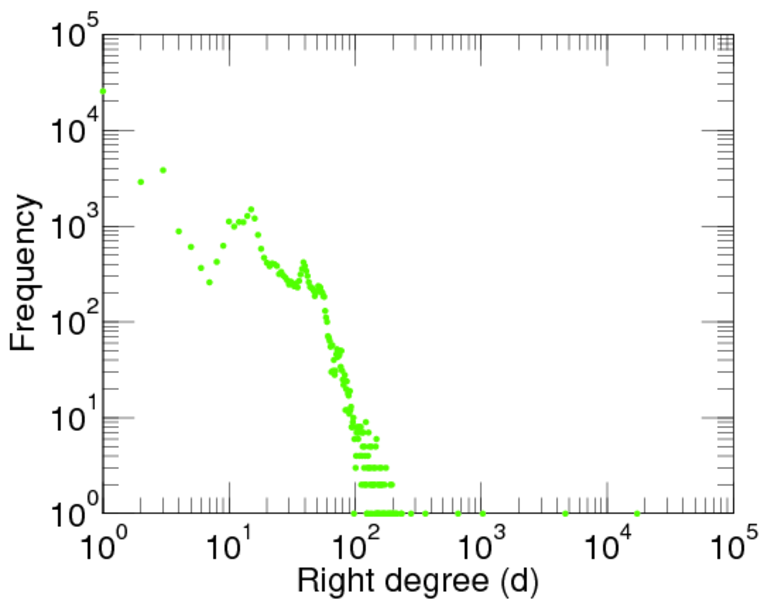
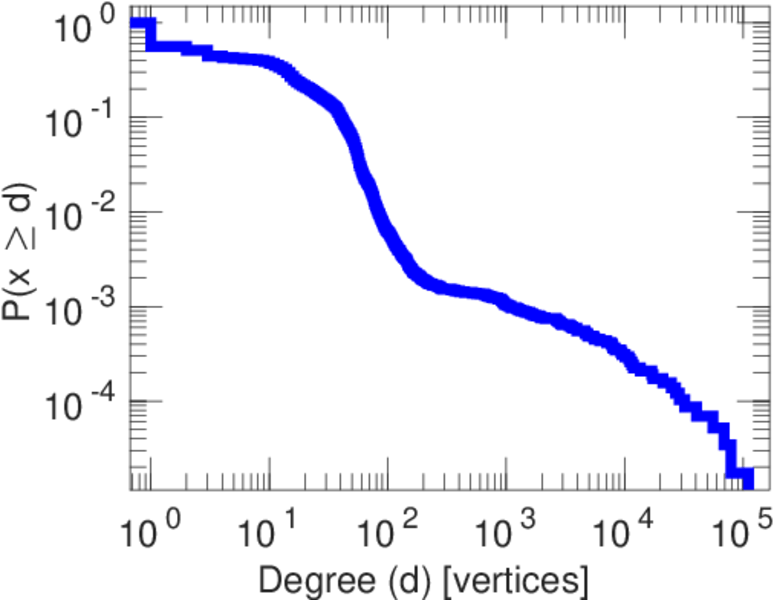
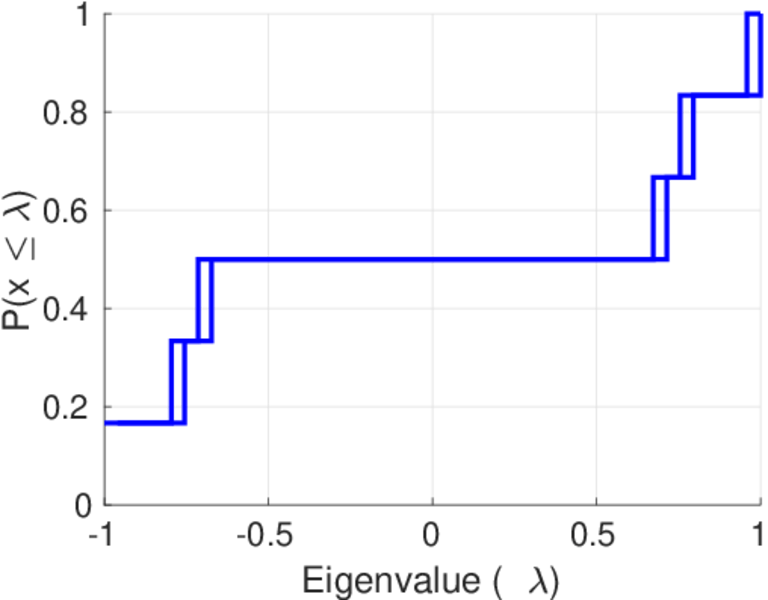
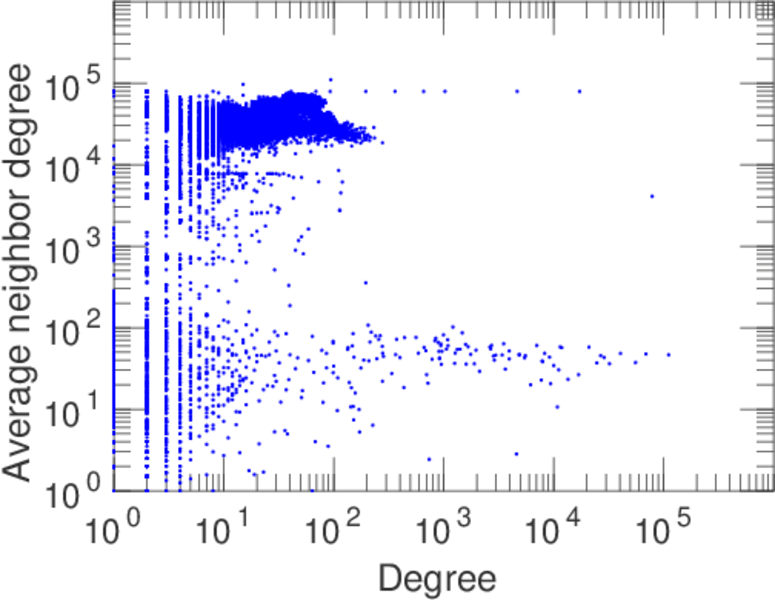
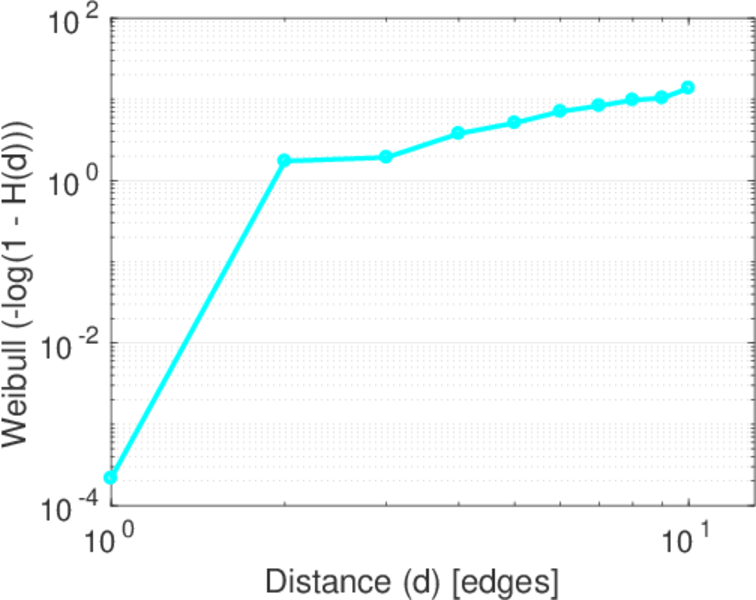
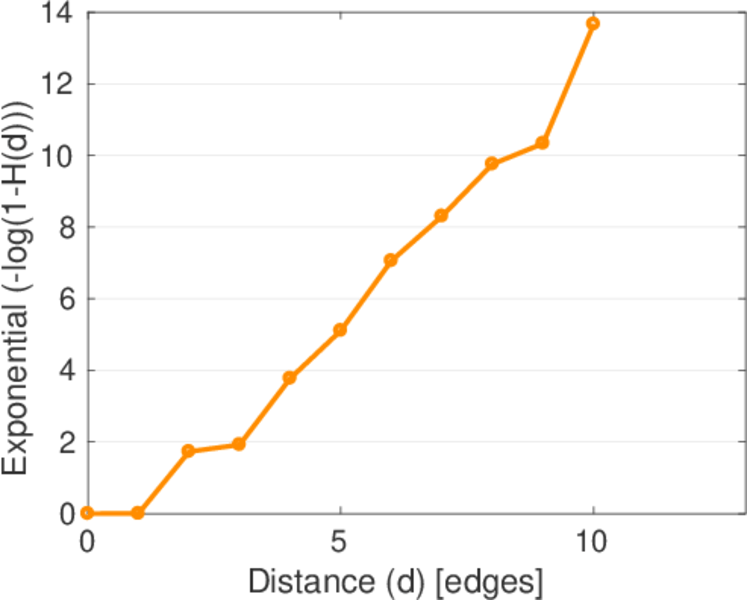
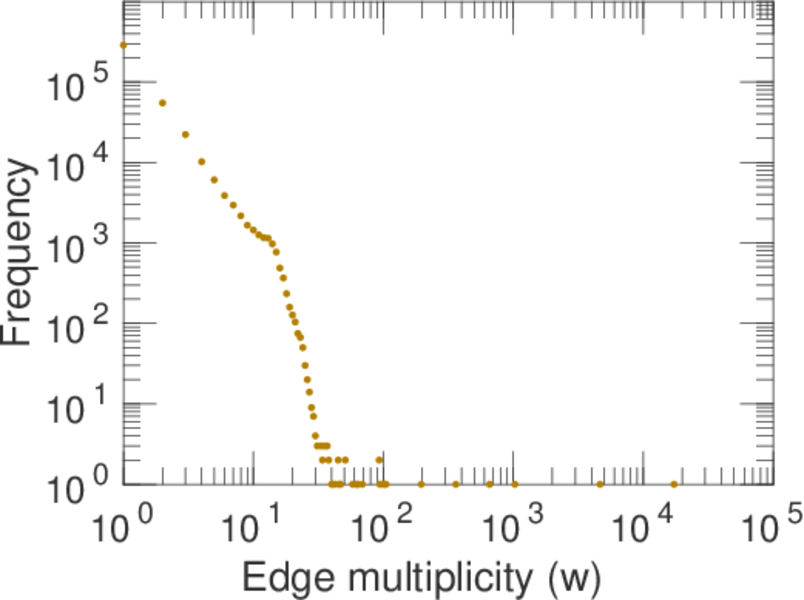
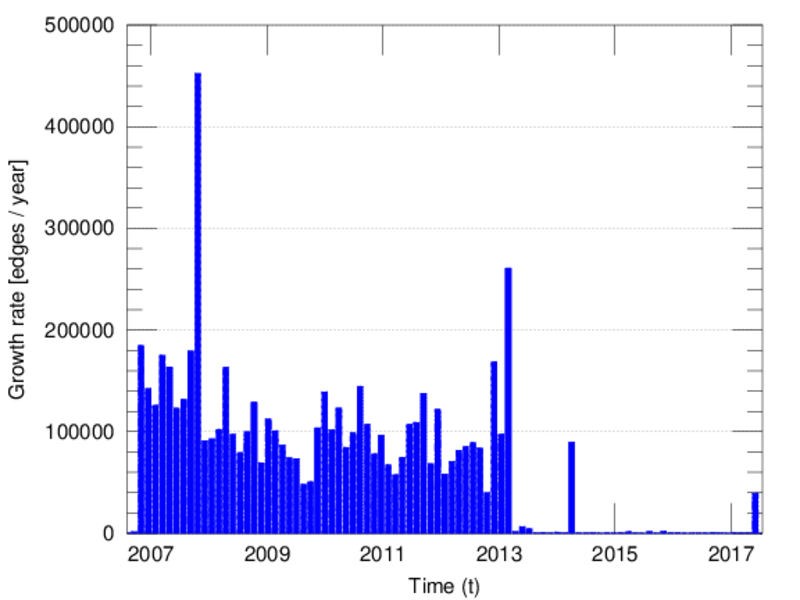
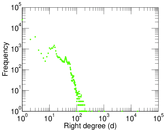
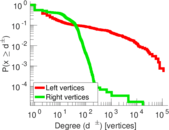
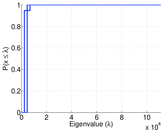
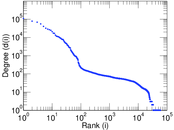
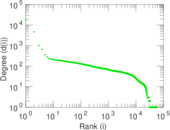
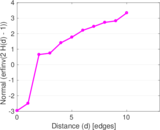
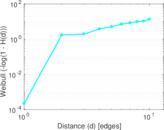
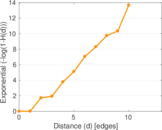
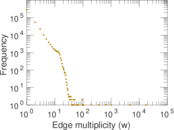
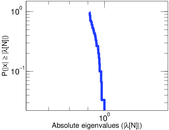
Plots


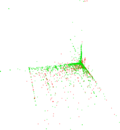


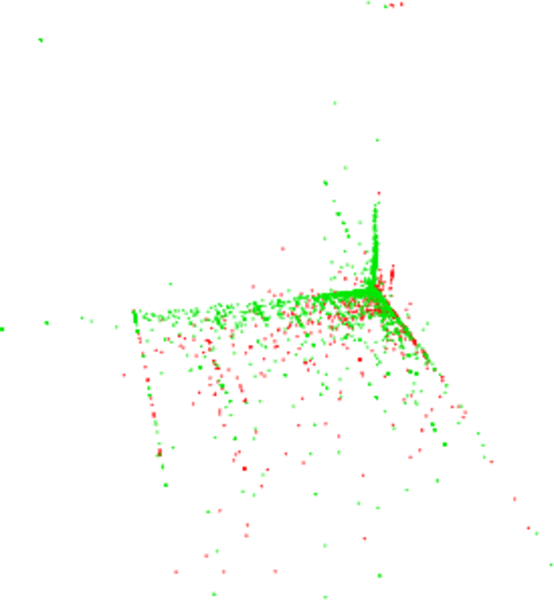
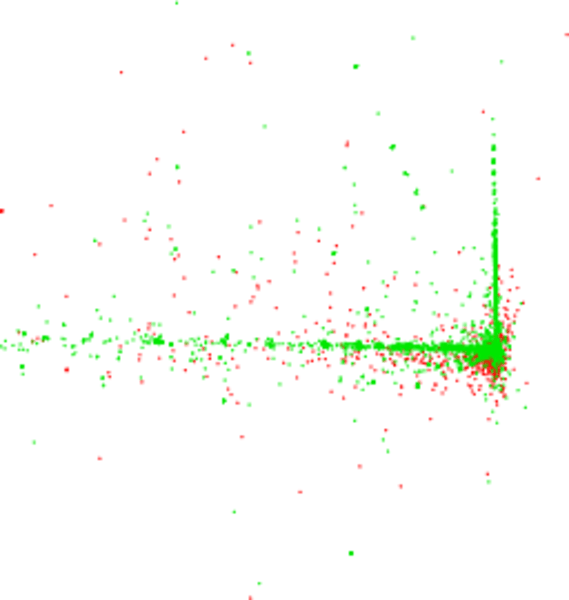
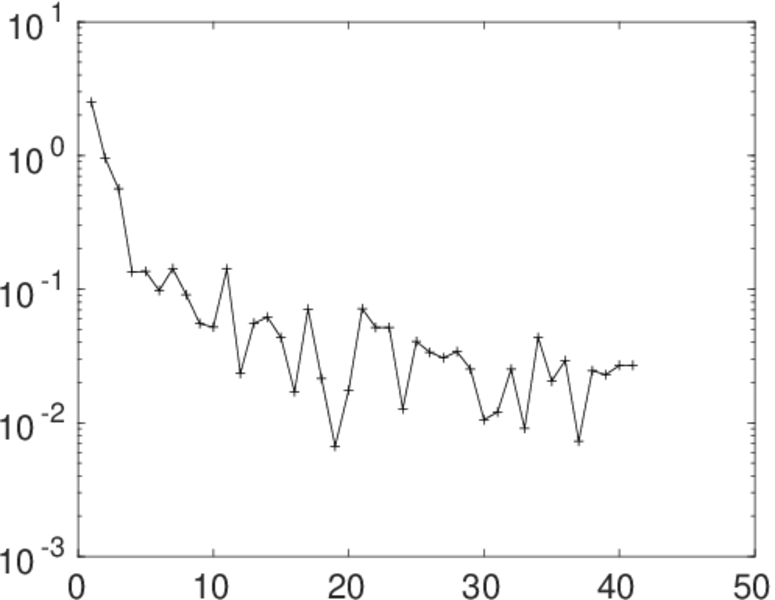
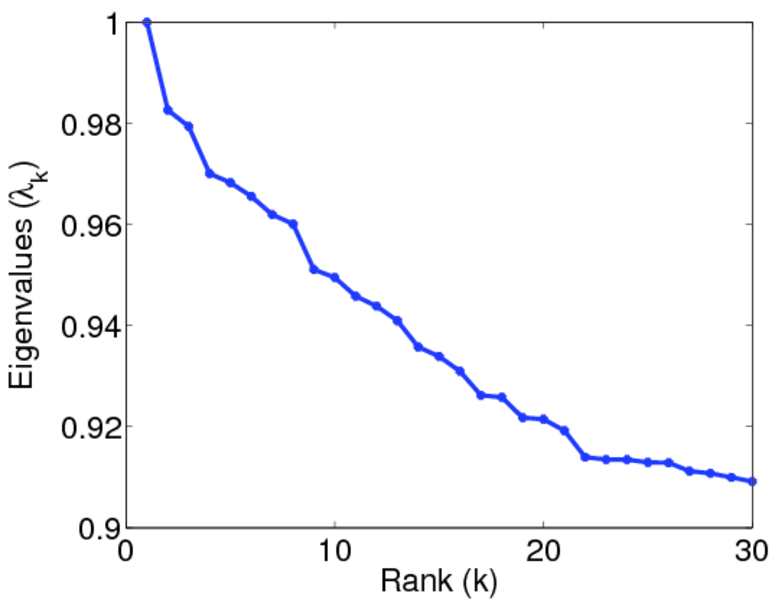
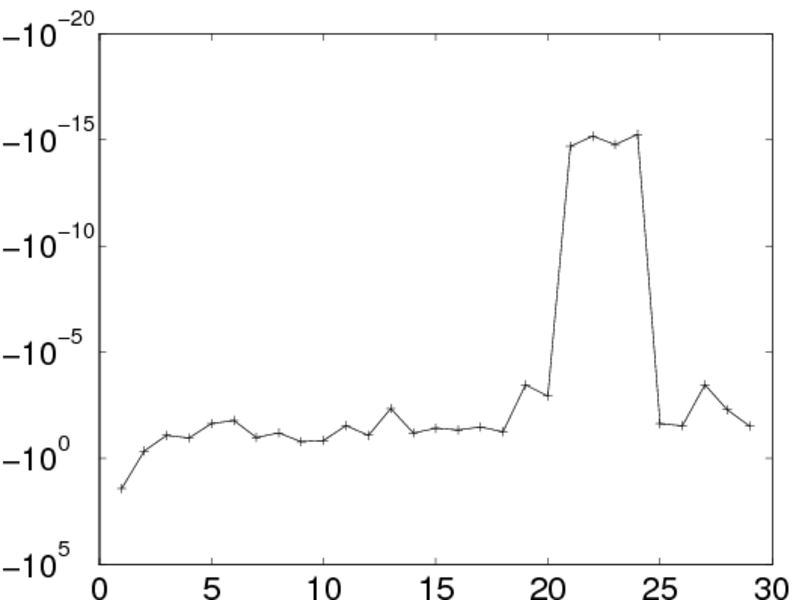
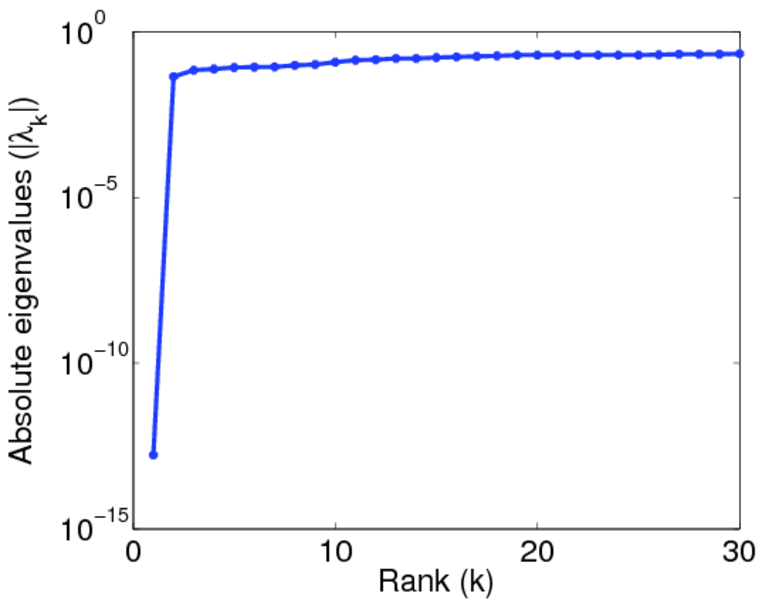
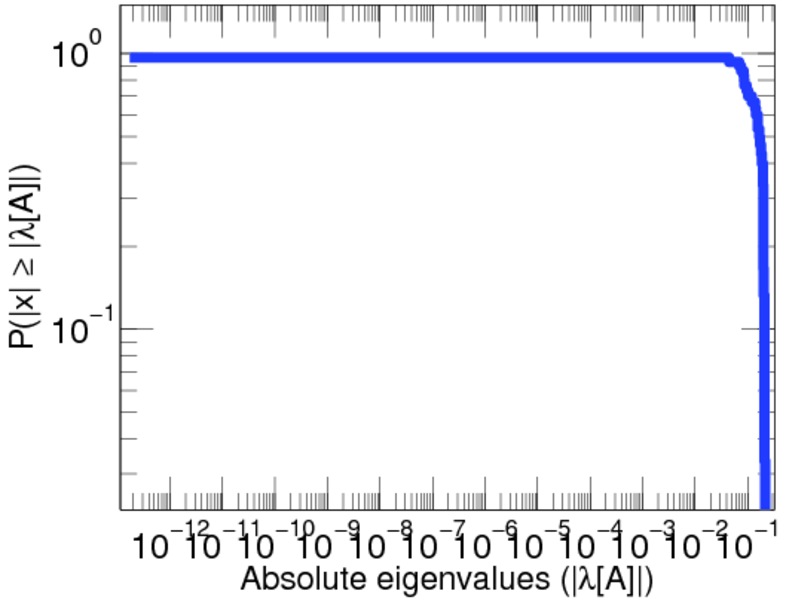
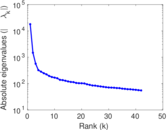
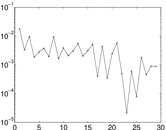
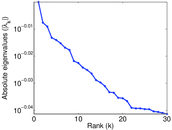
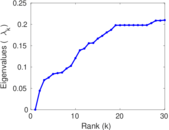
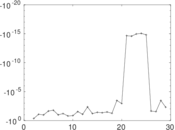
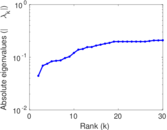
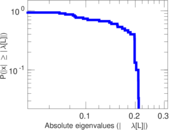
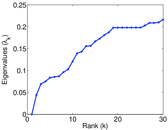
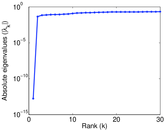
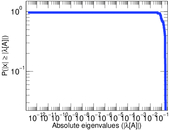
Matrix decompositions plots


Downloads
References
|
[1]
|
Jérôme Kunegis.
KONECT – The Koblenz Network Collection.
In Proc. Int. Conf. on World Wide Web Companion, pages
1343–1350, 2013.
[ http ]
|
|
[2]
|
Wikimedia Foundation.
Wikimedia downloads.
http://dumps.wikimedia.org/, January 2010.
|
 KONECT ‣ Networks ‣
Buy Me a Coffee
KONECT ‣ Networks ‣
Buy Me a Coffee