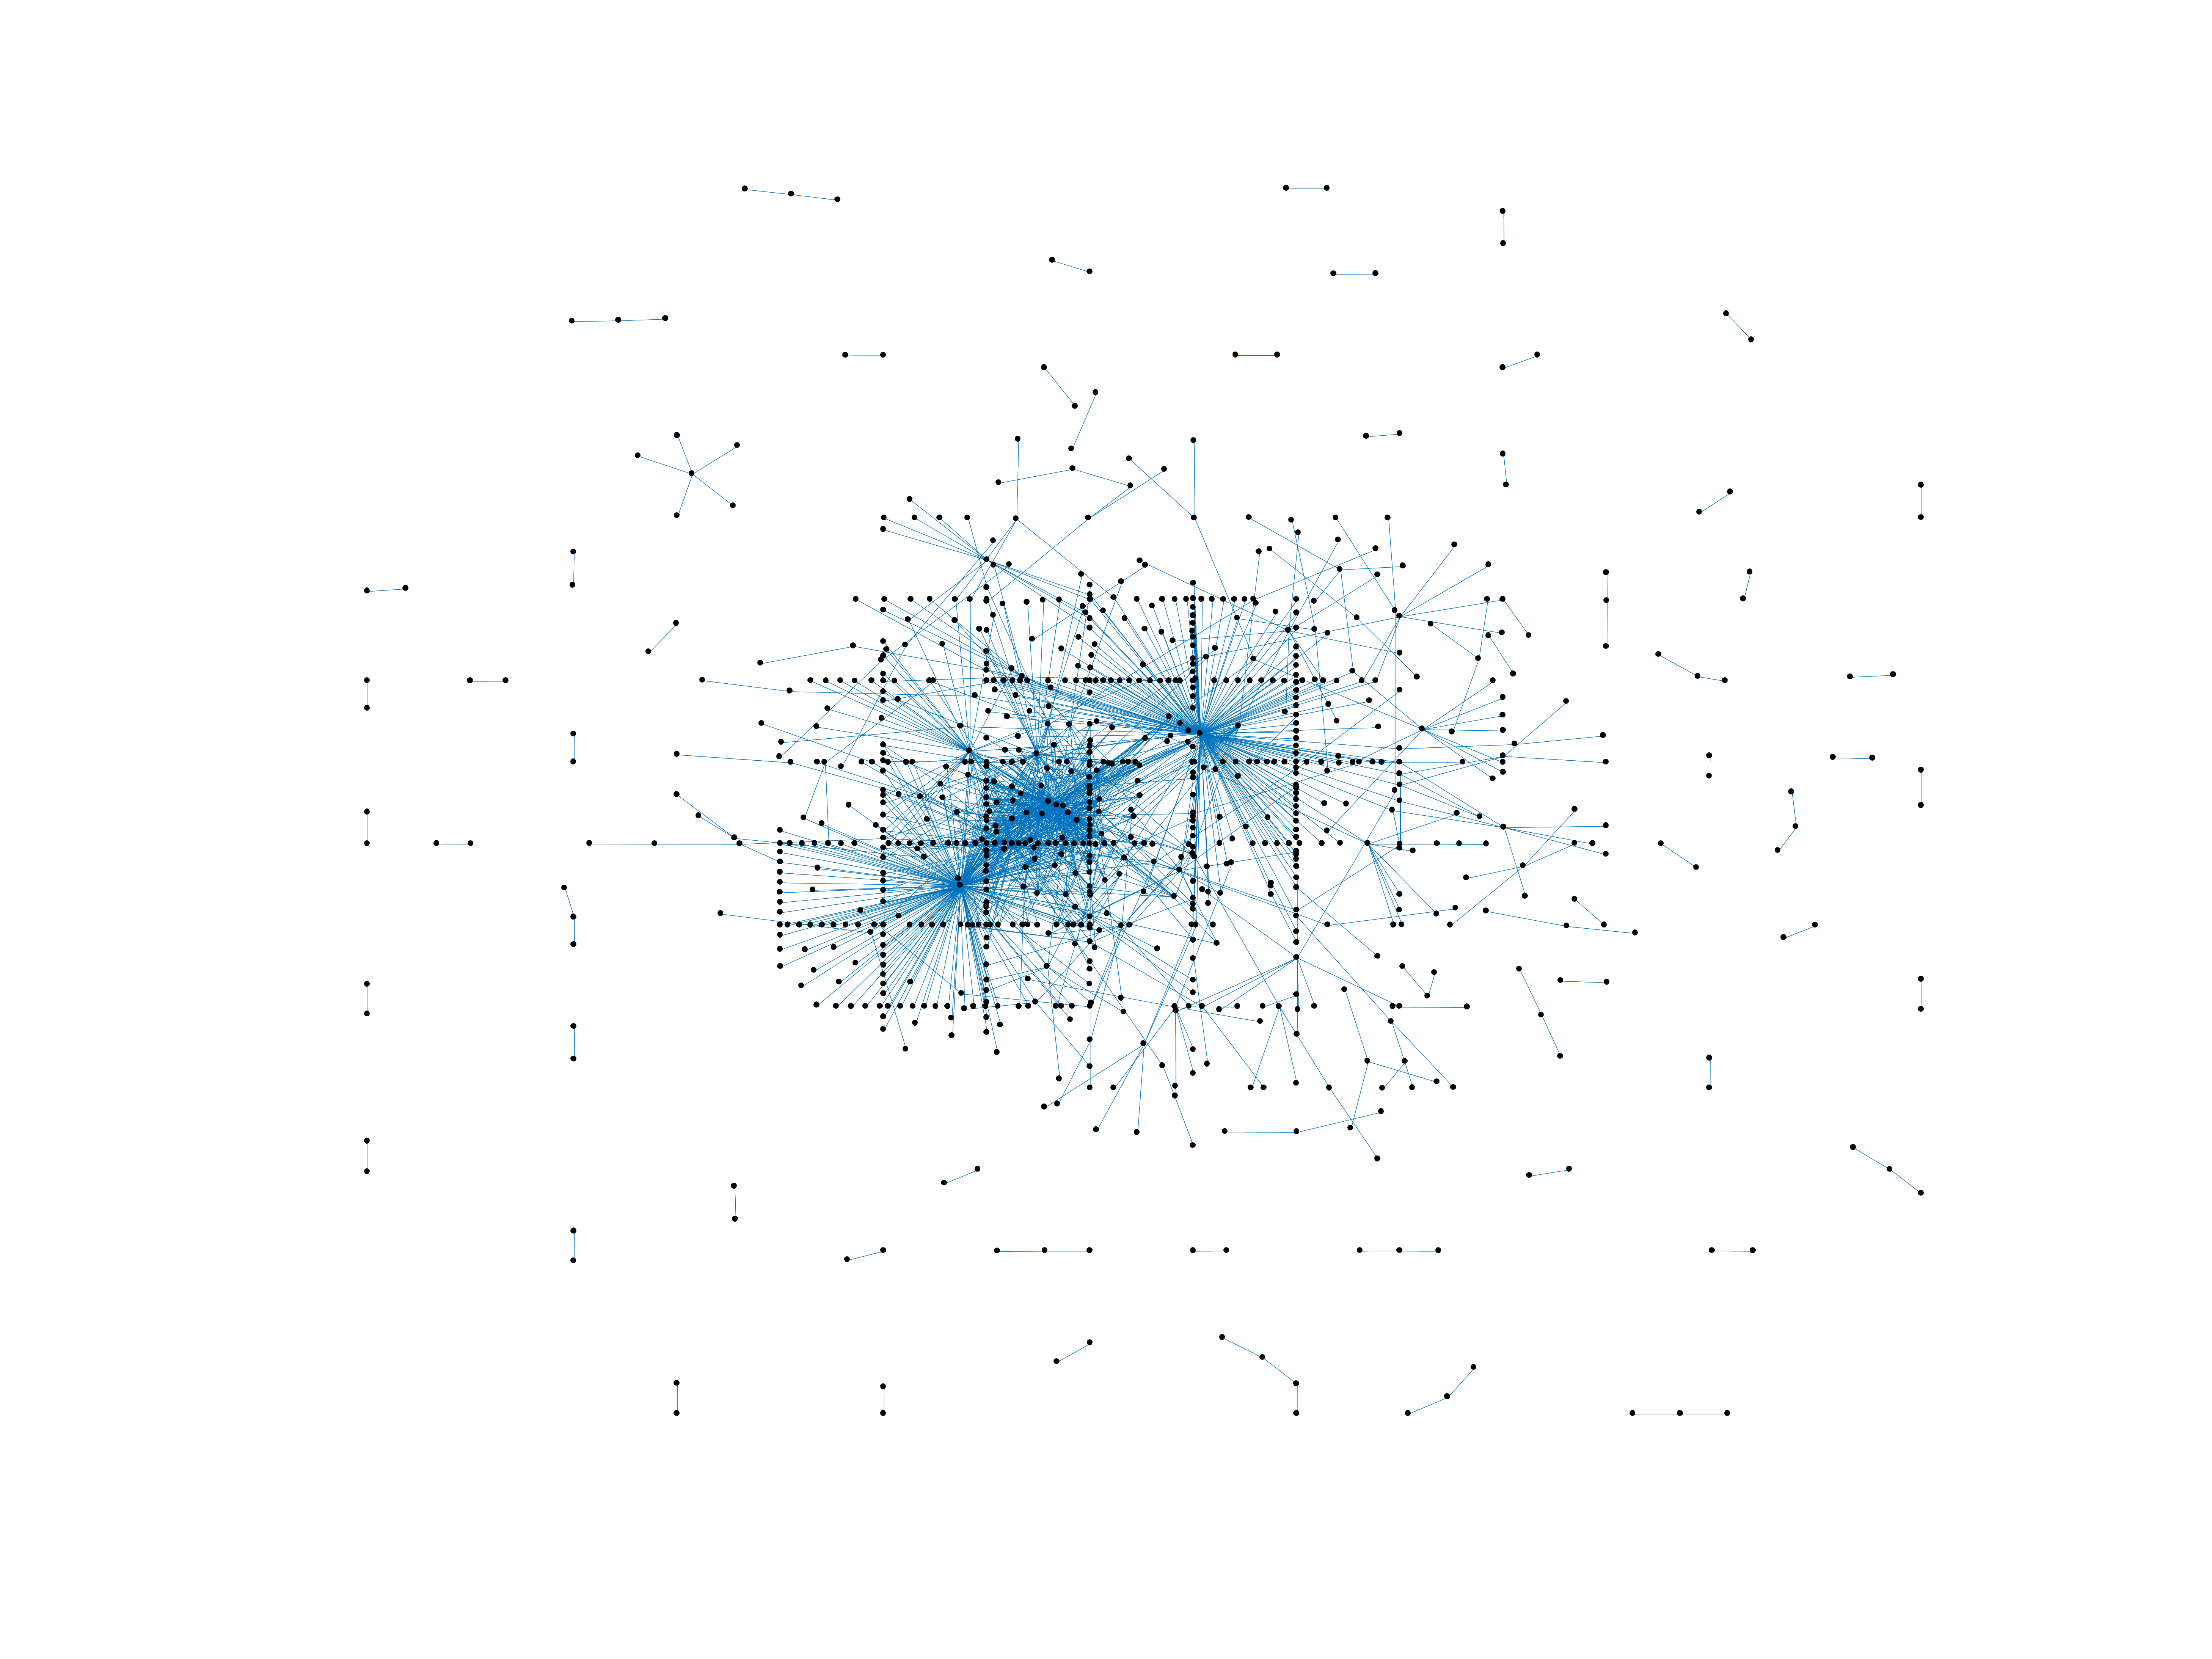
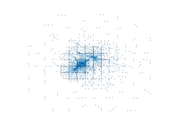
Wikiquote edits (br)
This is the bipartite edit network of the Breton Wikiquote. It contains users
and pages from the Breton Wikiquote, connected by edit events. Each edge
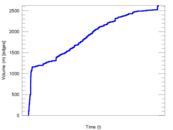
represents an edit. The dataset includes the timestamp of each edit.
Metadata
Statistics
| Size | n = | 906
|
| Left size | n1 = | 189
|
| Right size | n2 = | 717
|
| Volume | m = | 2,625
|
| Unique edge count | m̿ = | 1,440
|
| Wedge count | s = | 56,506
|
| Claw count | z = | 2,808,087
|
| Cross count | x = | 126,564,947
|
| Square count | q = | 23,761
|
| 4-Tour count | T4 = | 420,864
|
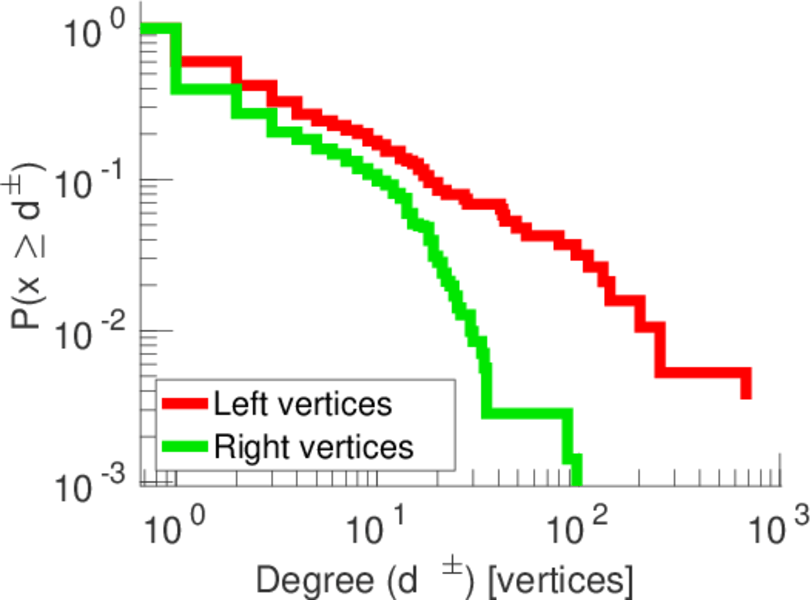
| Maximum degree | dmax = | 679
|
| Maximum left degree | d1max = | 679
|
| Maximum right degree | d2max = | 98
|
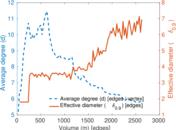
| Average degree | d = | 5.794 70
|
| Average left degree | d1 = | 13.888 9
|
| Average right degree | d2 = | 3.661 09
|
| Fill | p = | 0.010 626 3
|
| Average edge multiplicity | m̃ = | 1.822 92
|
| Size of LCC | N = | 677
|
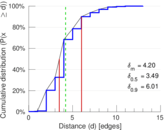
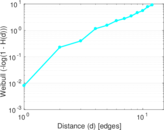
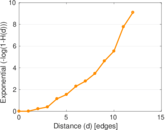
| Diameter | δ = | 14
|
| 50-Percentile effective diameter | δ0.5 = | 3.486 08
|
| 90-Percentile effective diameter | δ0.9 = | 6.010 96
|
| Median distance | δM = | 4
|
| Mean distance | δm = | 4.199 08
|
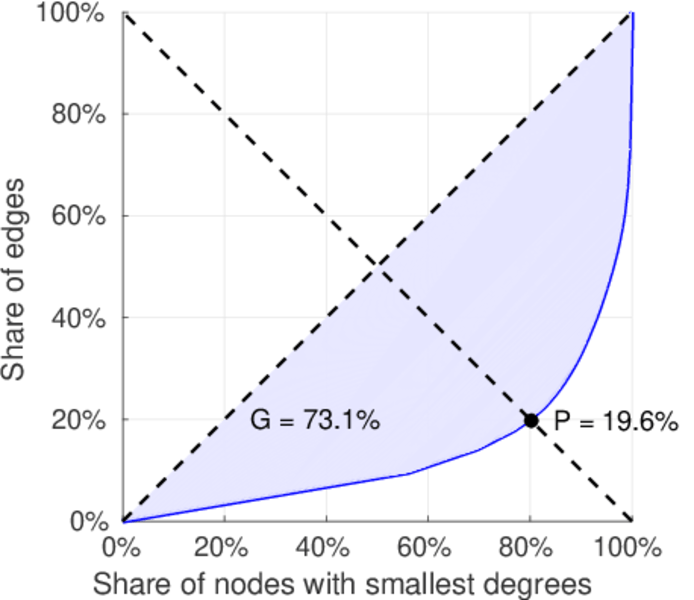
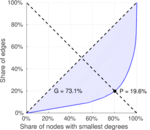
| Gini coefficient | G = | 0.754 747
|
| Balanced inequality ratio | P = | 0.186 095
|
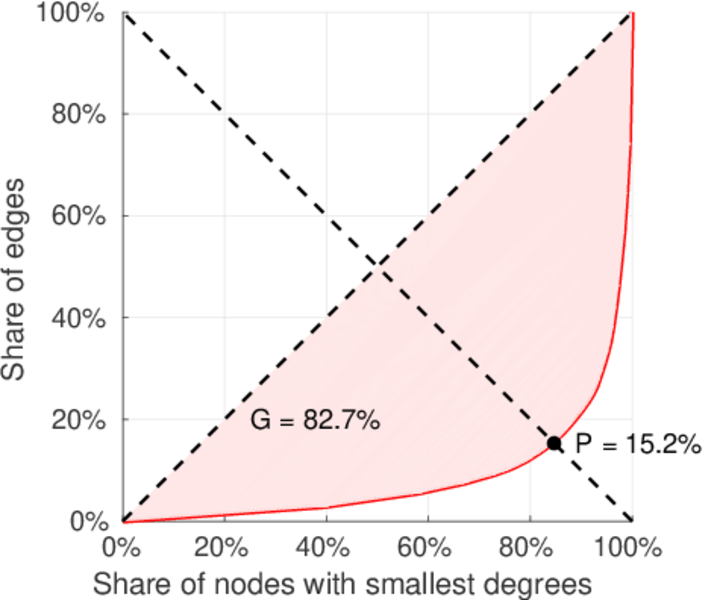
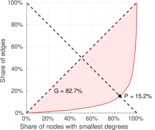
| Left balanced inequality ratio | P1 = | 0.151 619
|
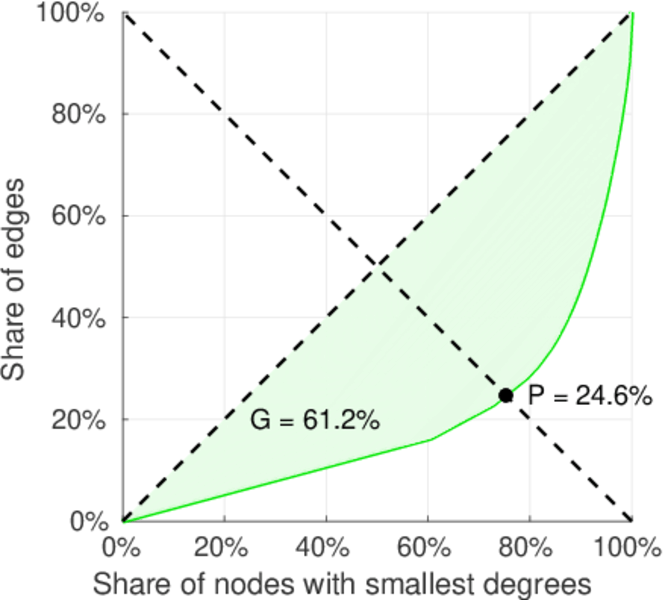
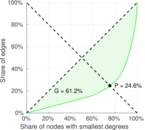
| Right balanced inequality ratio | P2 = | 0.245 714
|
| Relative edge distribution entropy | Her = | 0.836 625
|
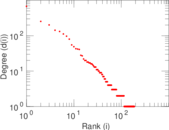
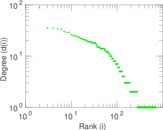
| Power law exponent | γ = | 3.020 51
|
| Tail power law exponent | γt = | 2.091 00
|
| Tail power law exponent with p | γ3 = | 2.091 00
|
| p-value | p = | 0.010 000 0
|
| Left tail power law exponent with p | γ3,1 = | 1.741 00
|
| Left p-value | p1 = | 0.344 000
|
| Right tail power law exponent with p | γ3,2 = | 2.271 00
|
| Right p-value | p2 = | 0.000 00
|
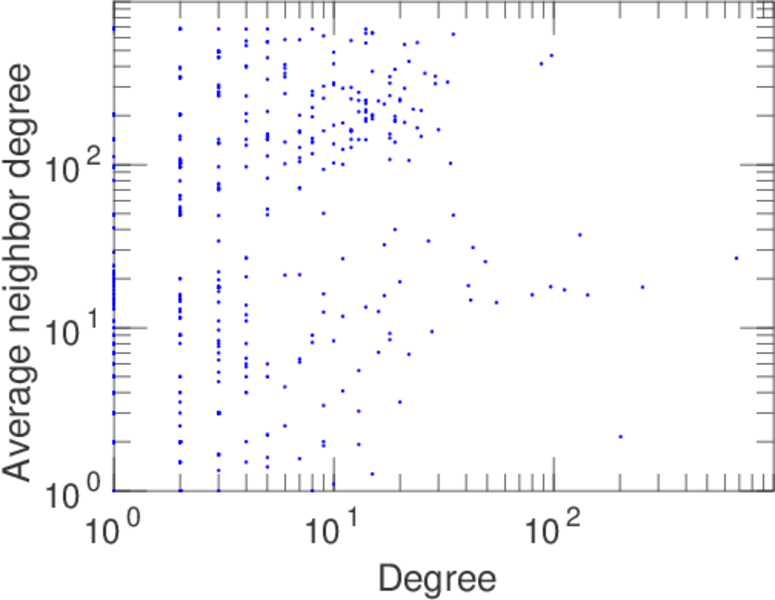
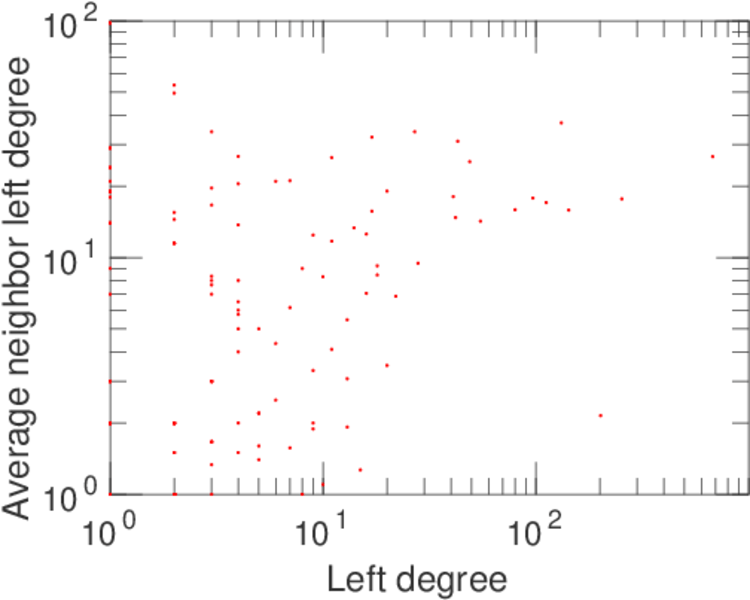
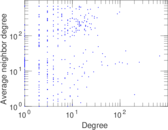
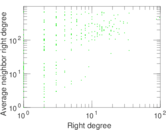
| Degree assortativity | ρ = | −0.203 619
|
| Degree assortativity p-value | pρ = | 6.095 76 × 10−15
|
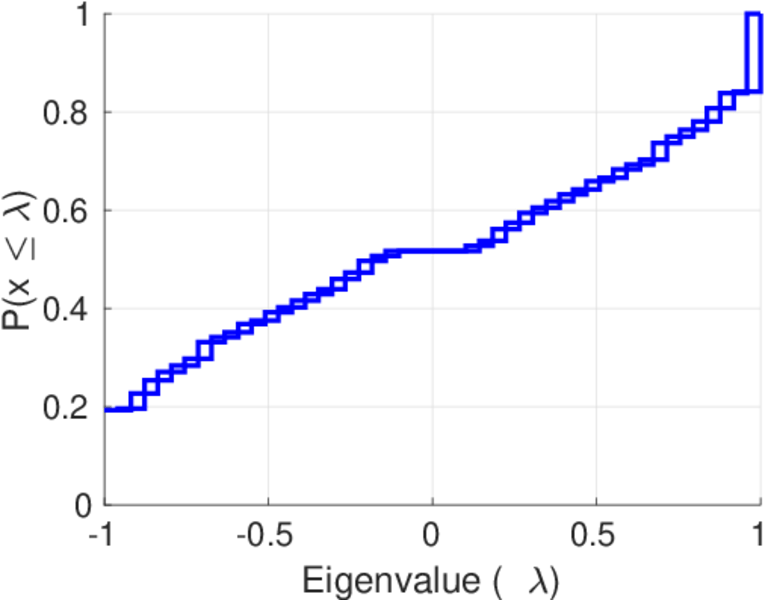
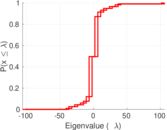
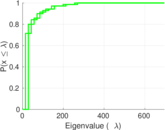
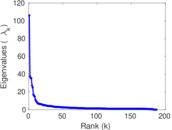
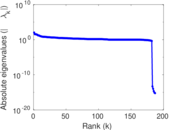
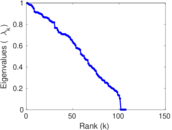
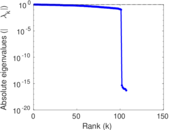
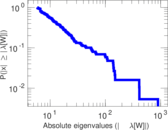
| Spectral norm | α = | 106.011
|
| Algebraic connectivity | a = | 0.022 540 9
|
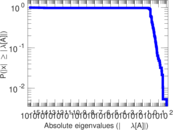
| Spectral separation | |λ1[A] / λ2[A]| = | 2.839 11
|
| Controllability | C = | 531
|
| Relative controllability | Cr = | 0.593 296
|
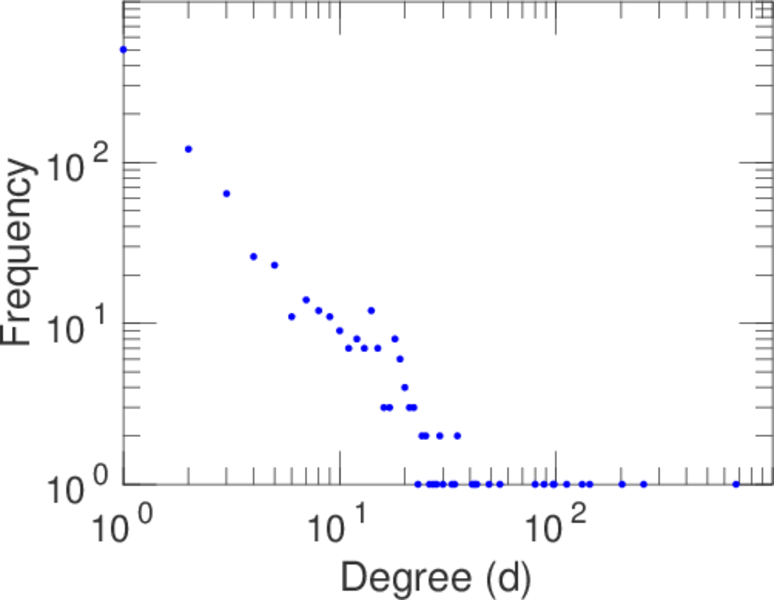
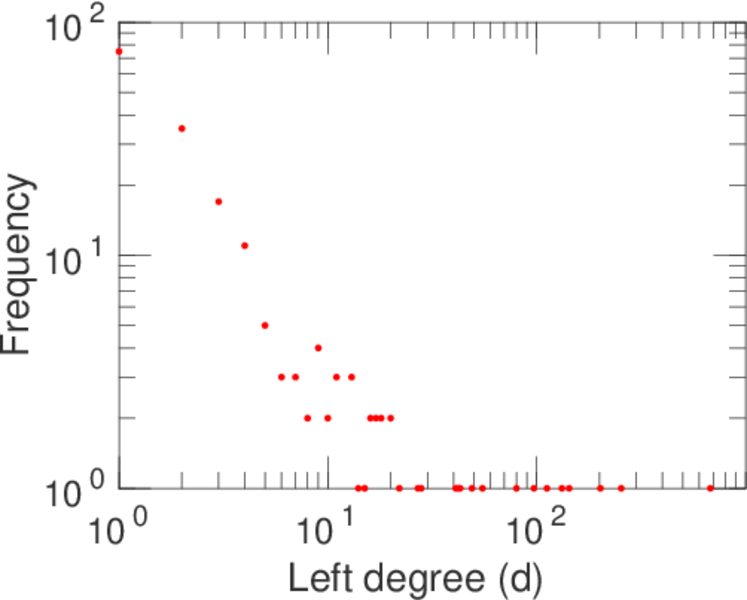
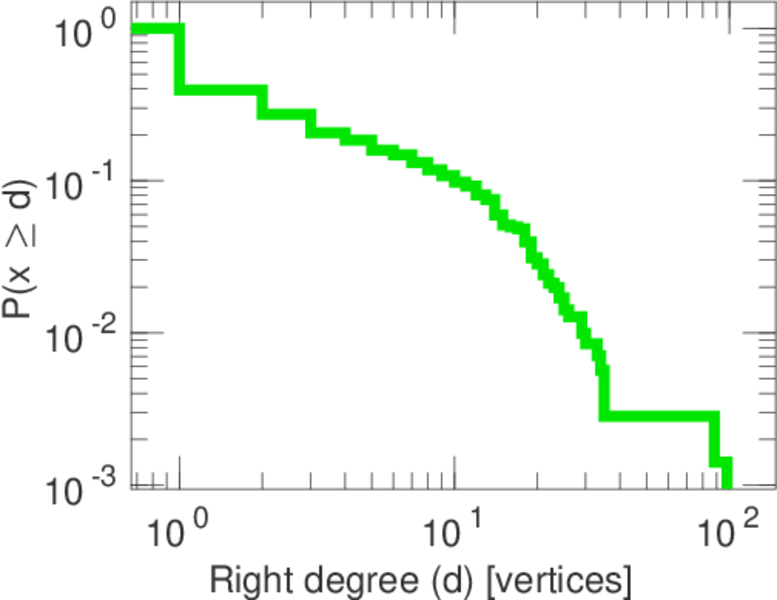
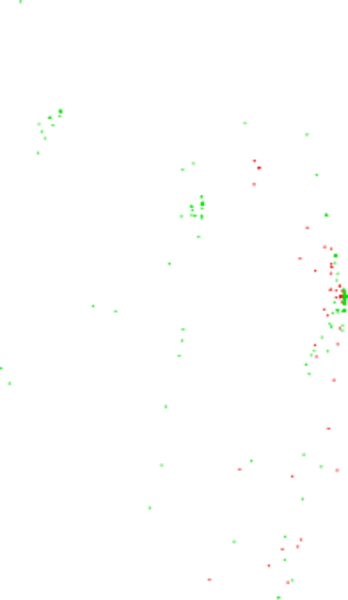
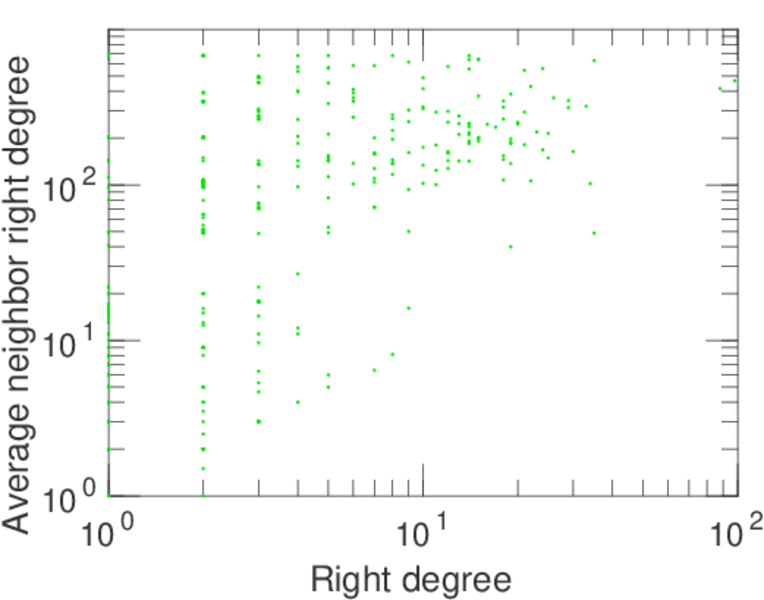
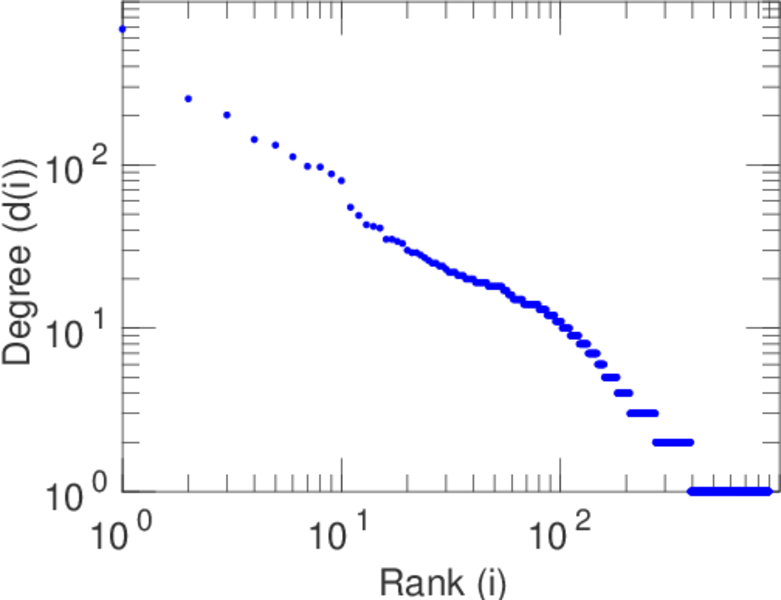
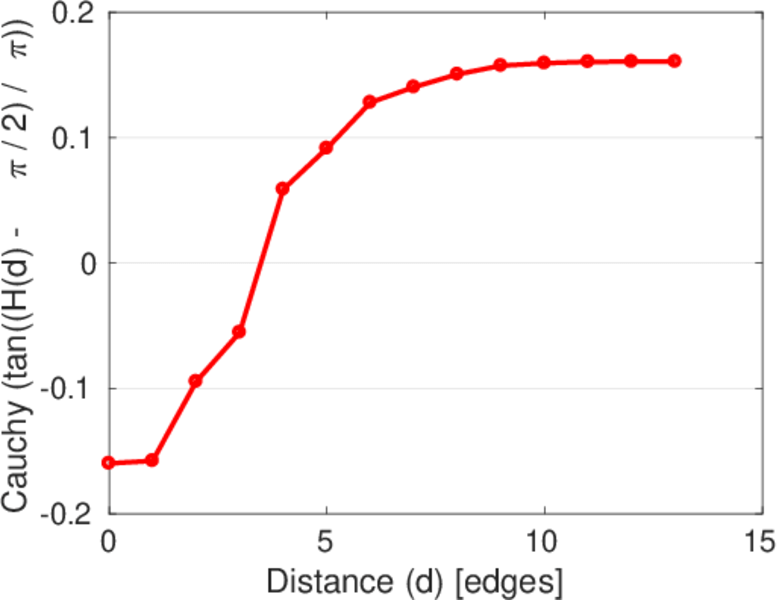
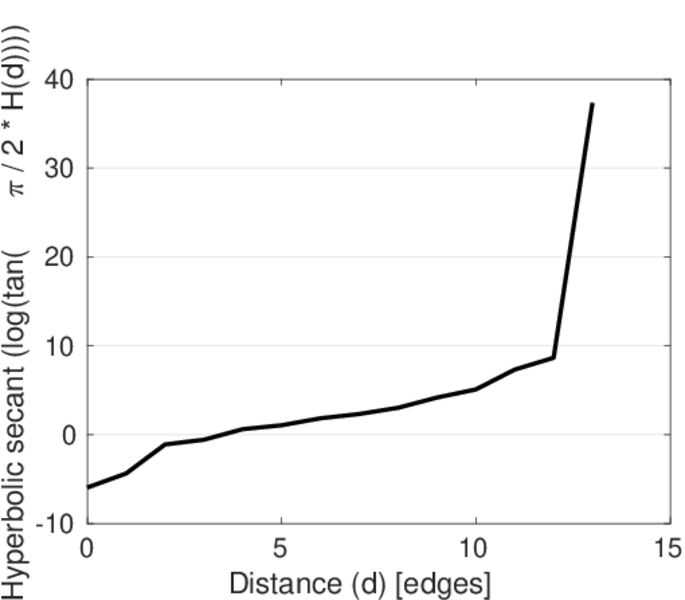
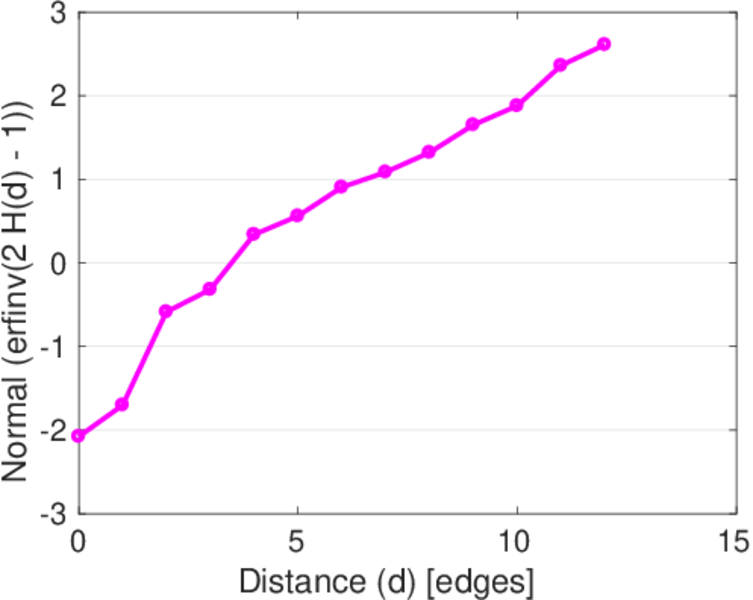
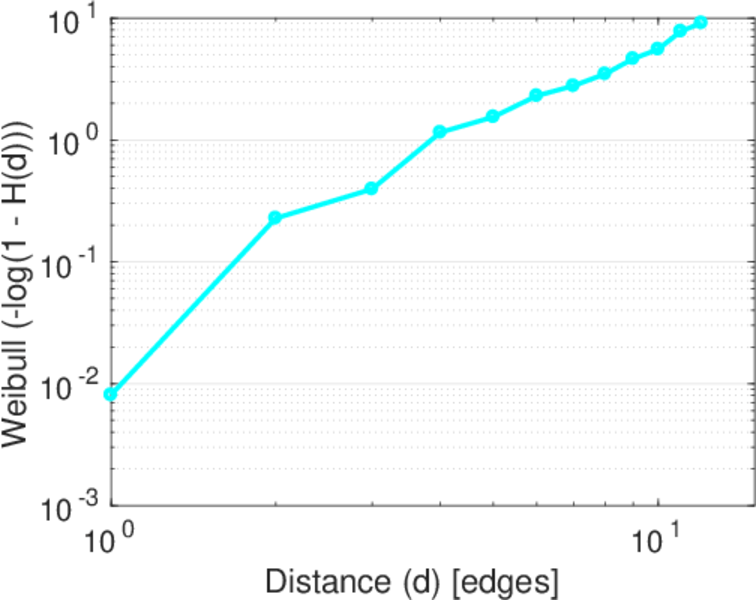
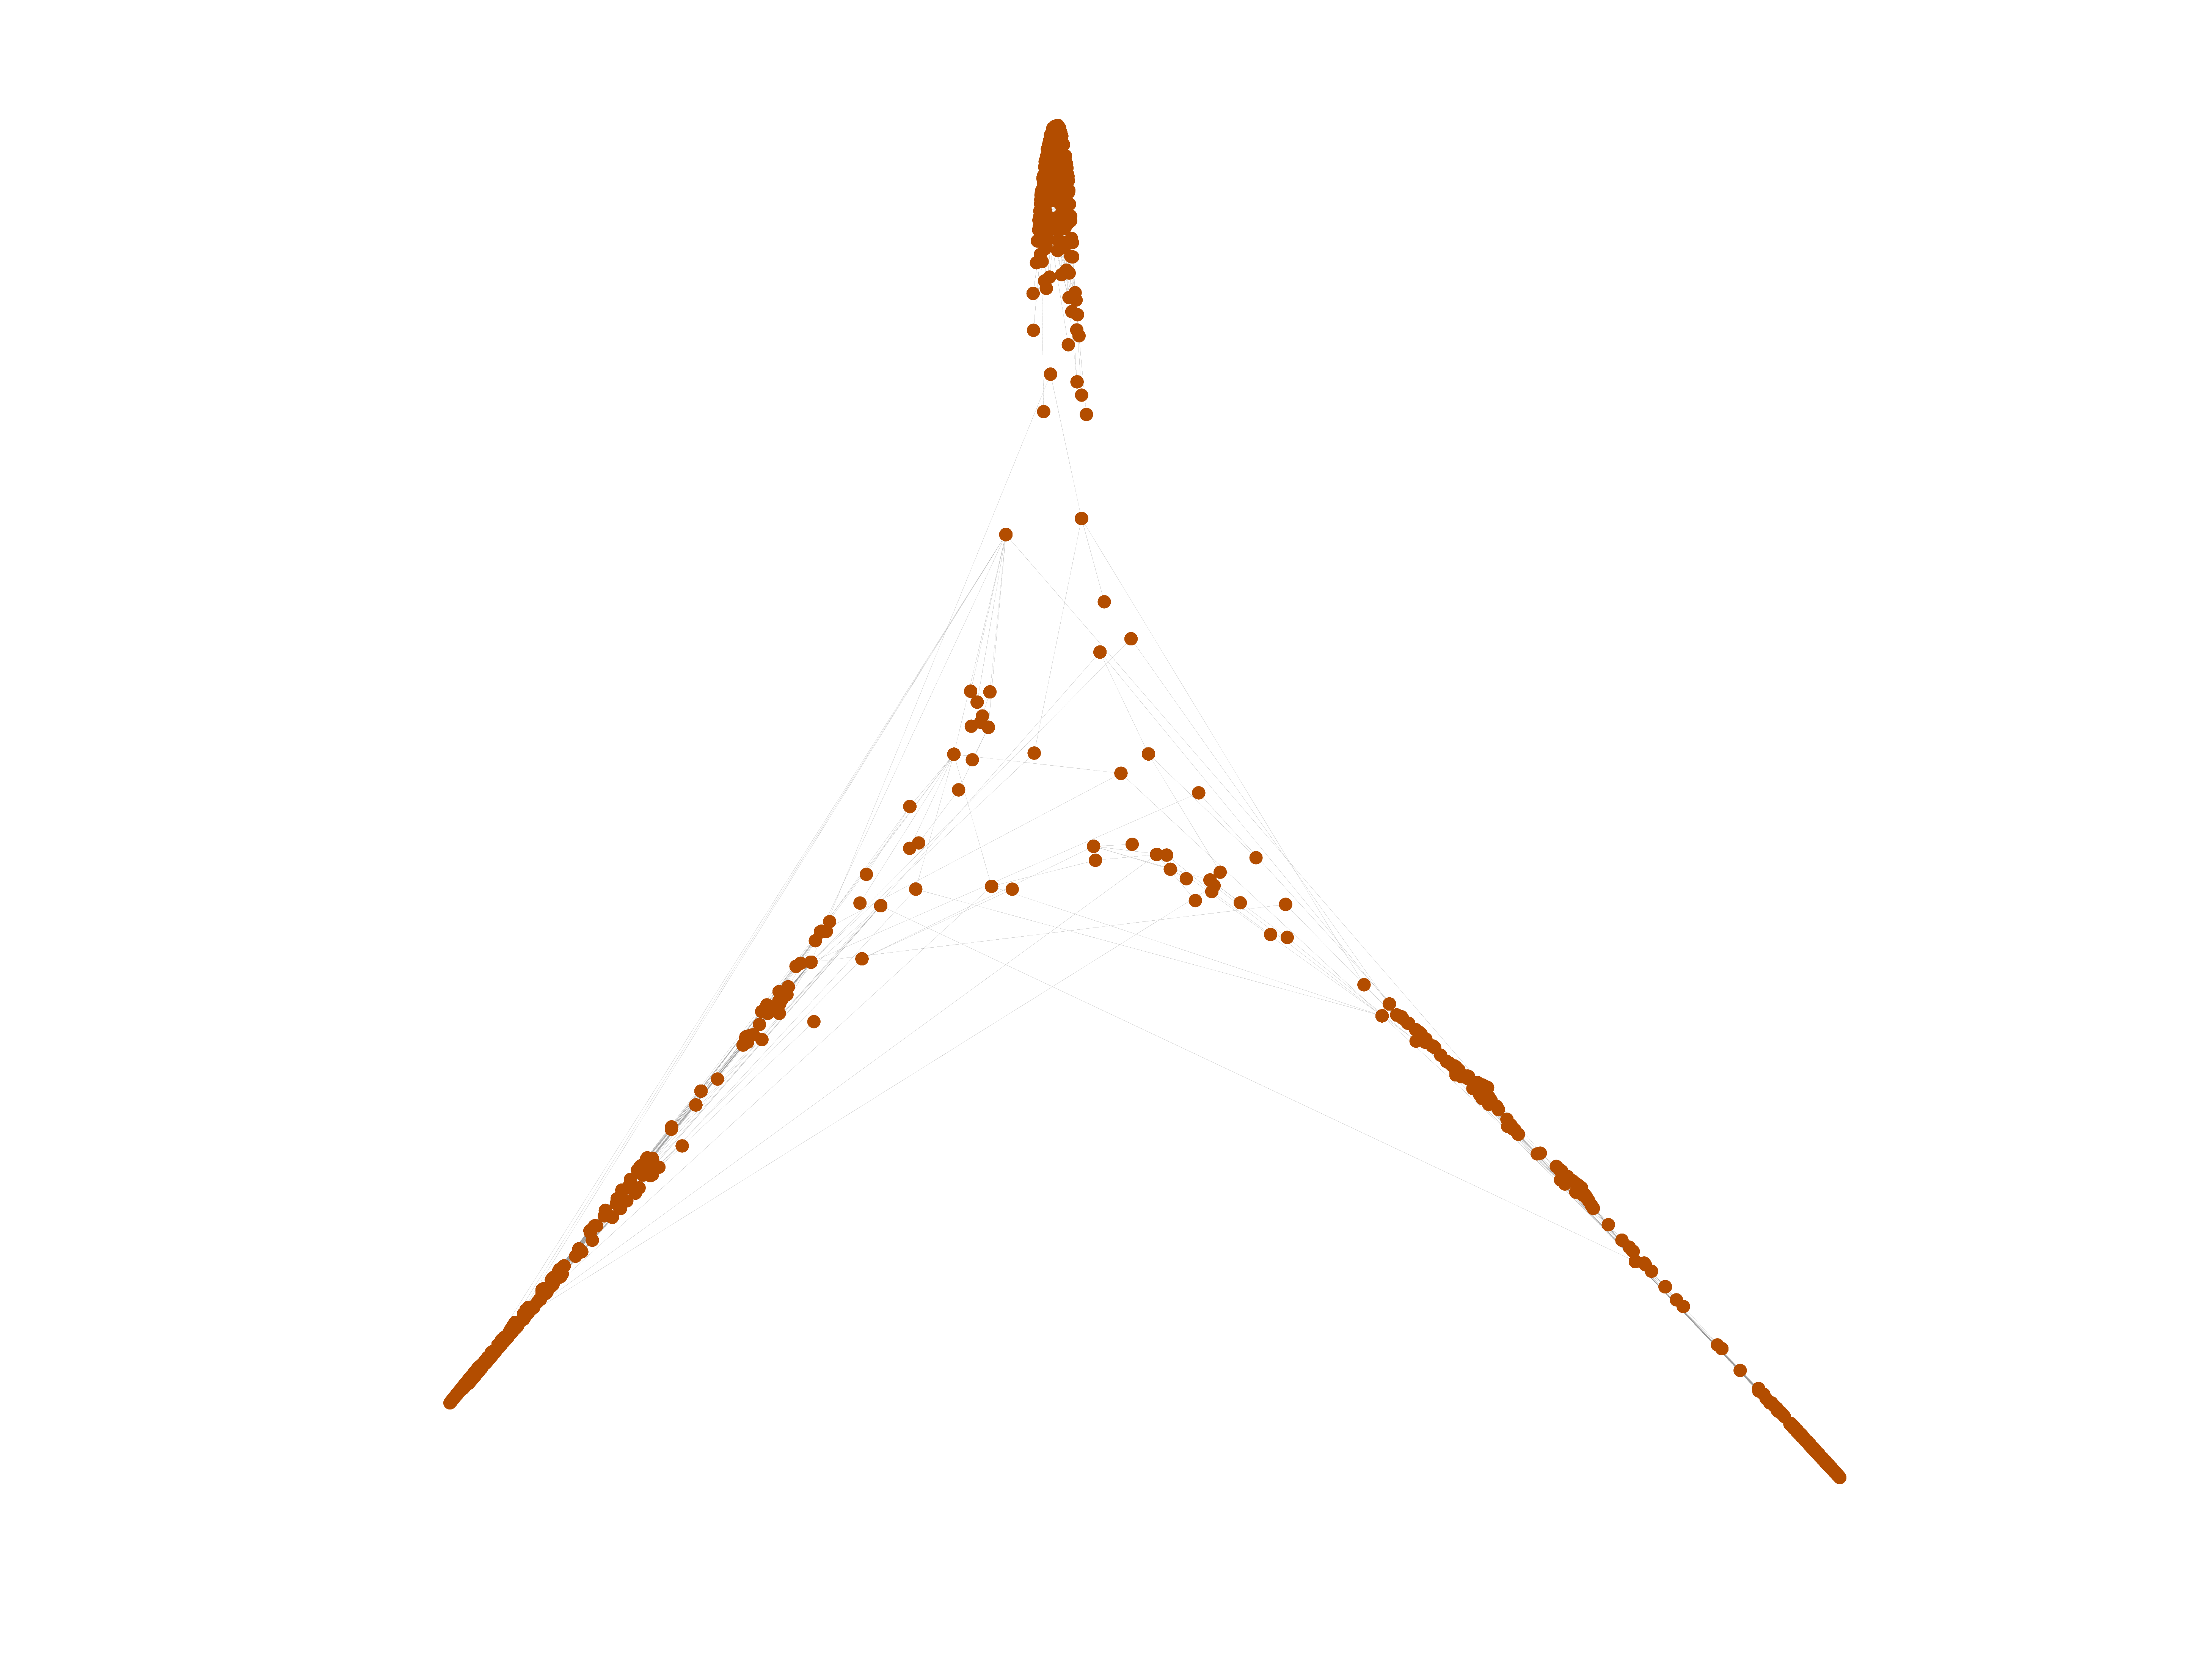
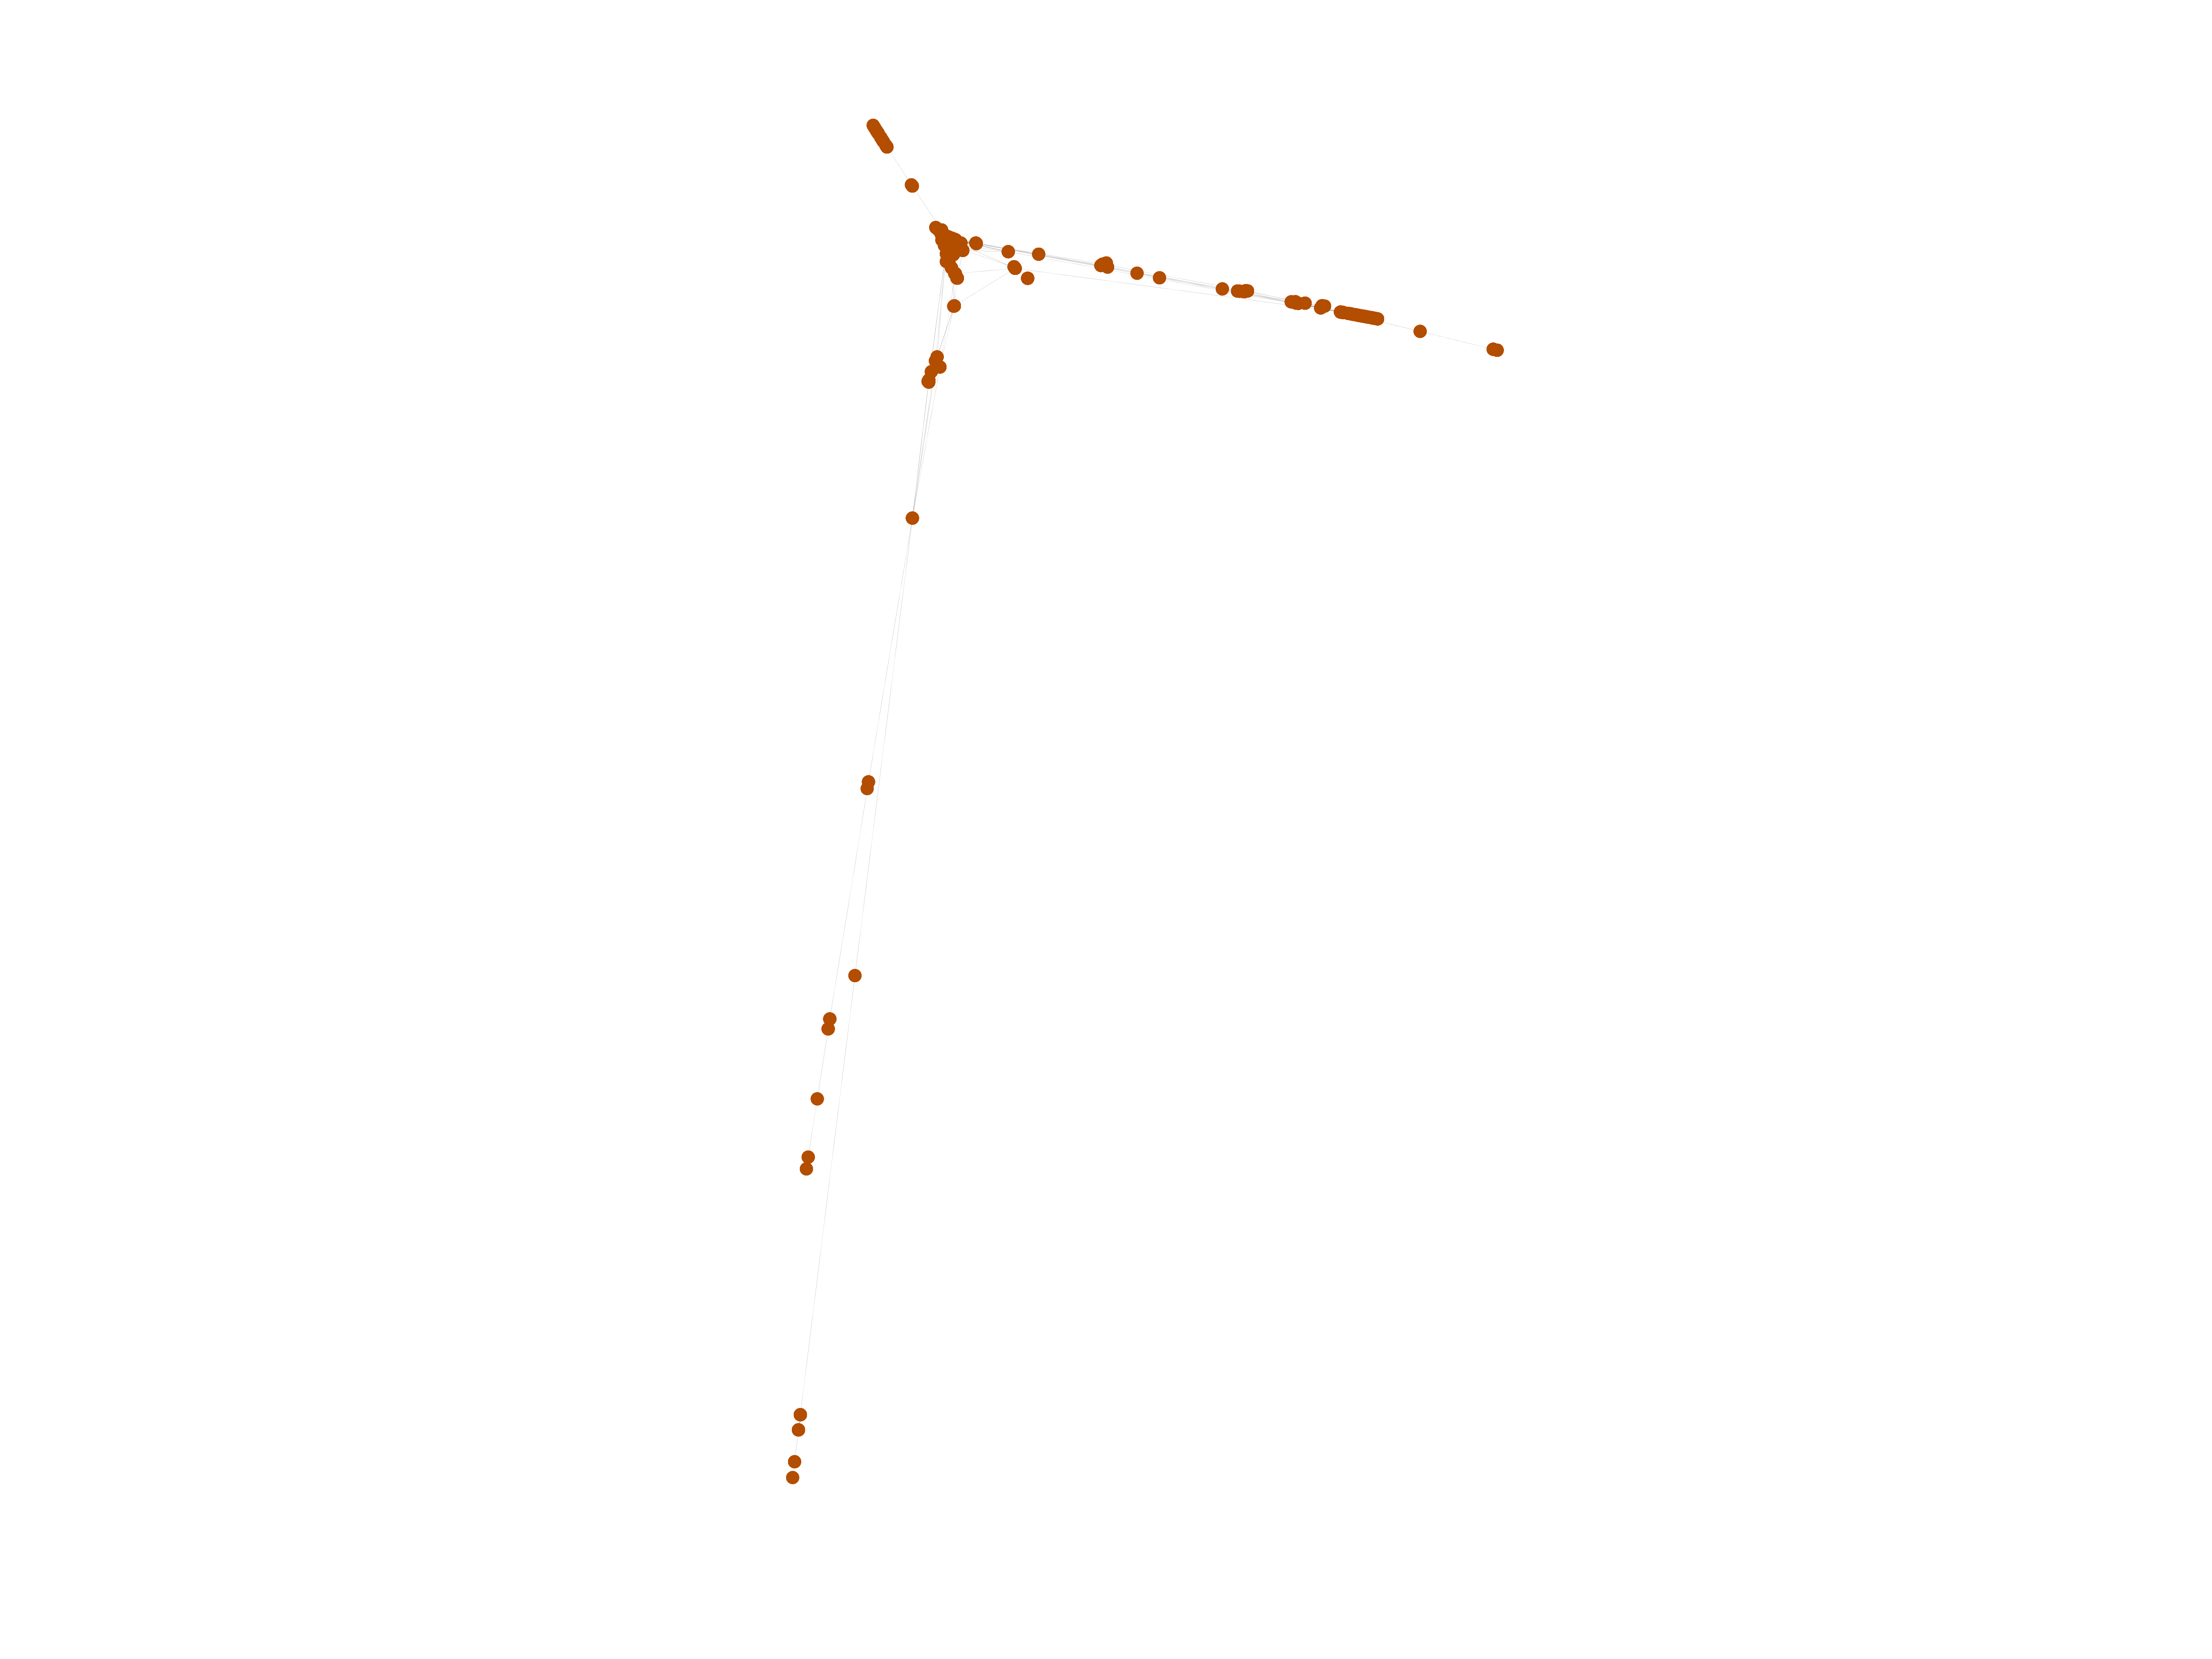
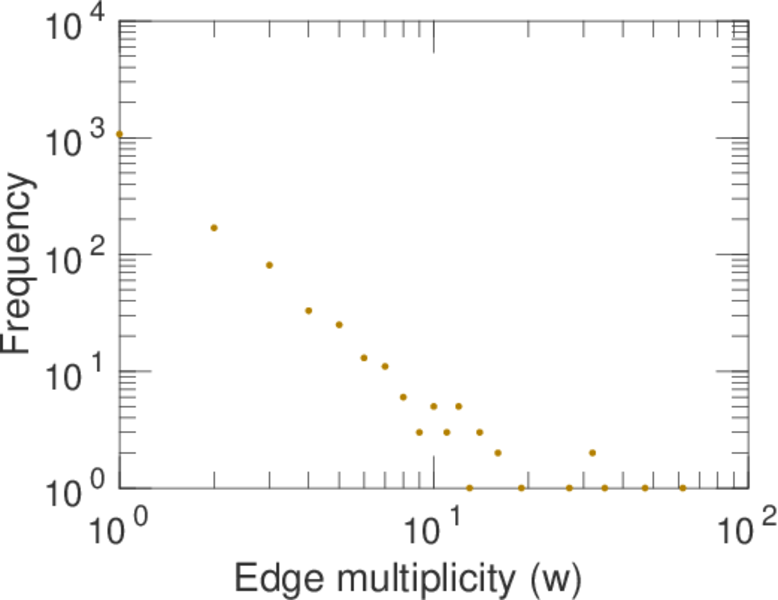
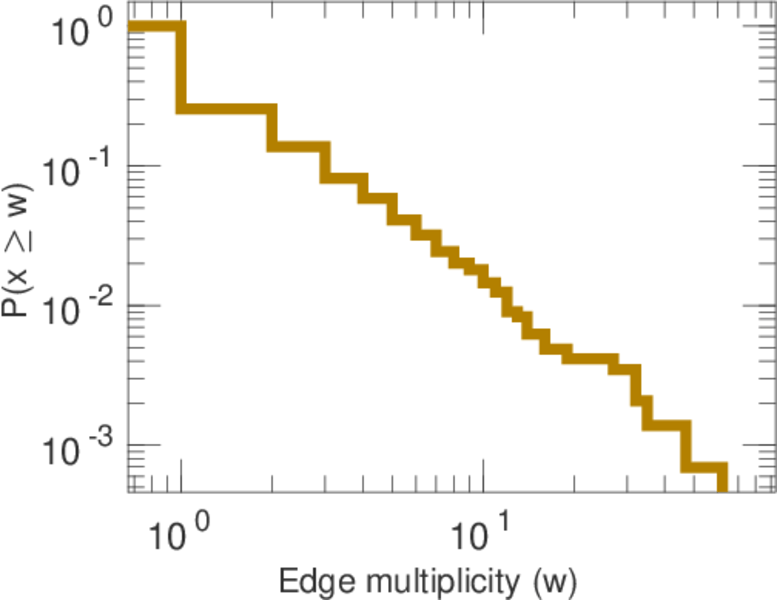
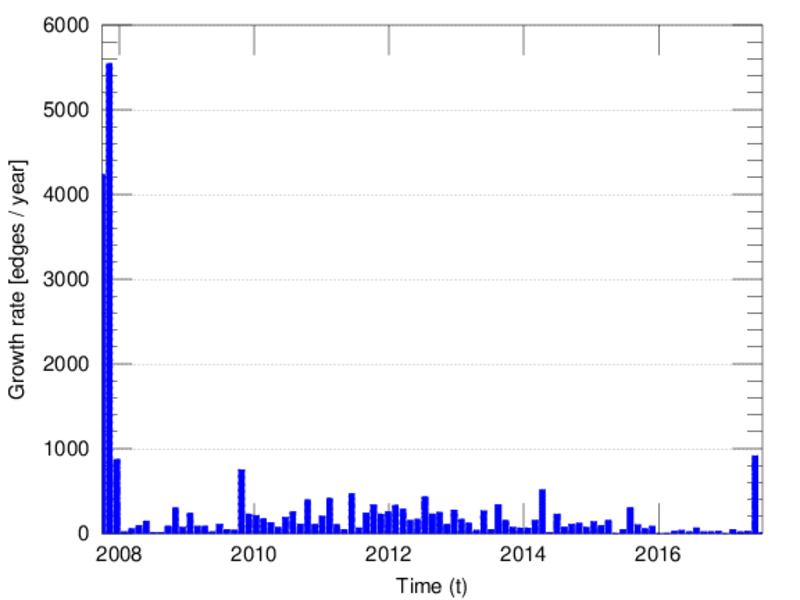
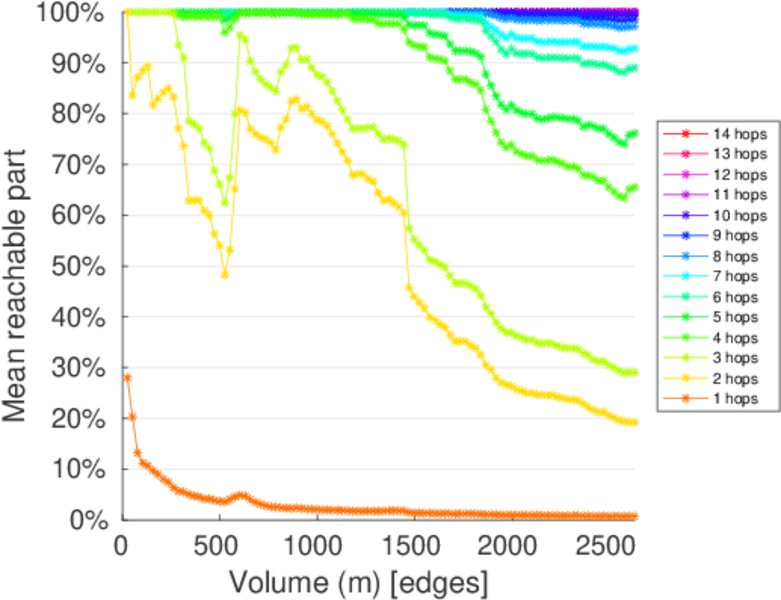
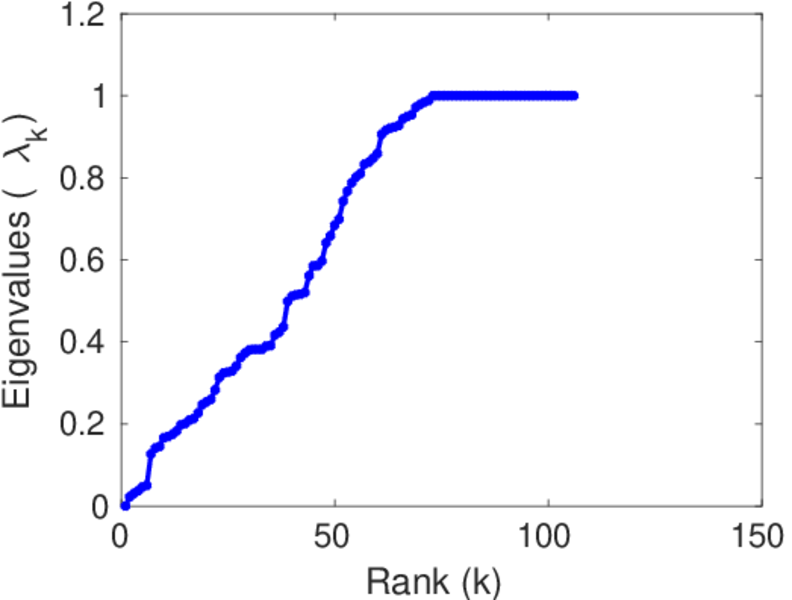
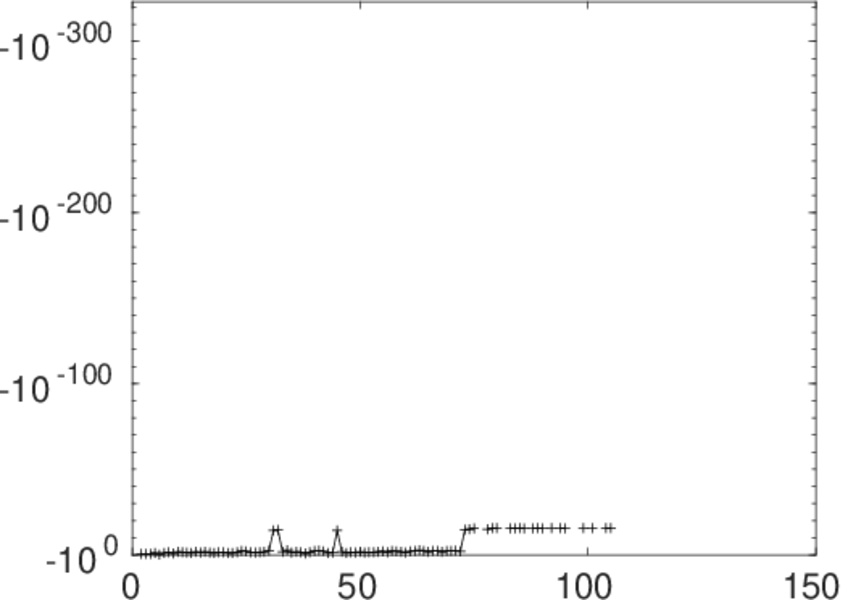
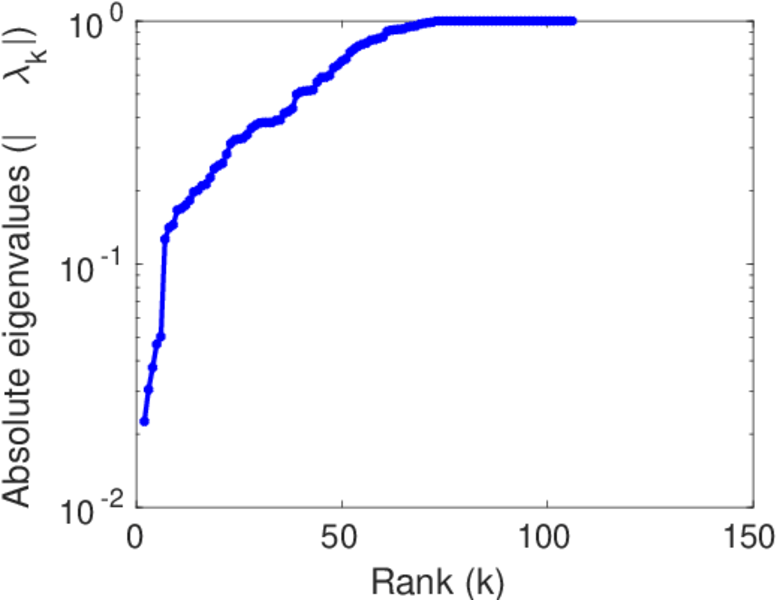
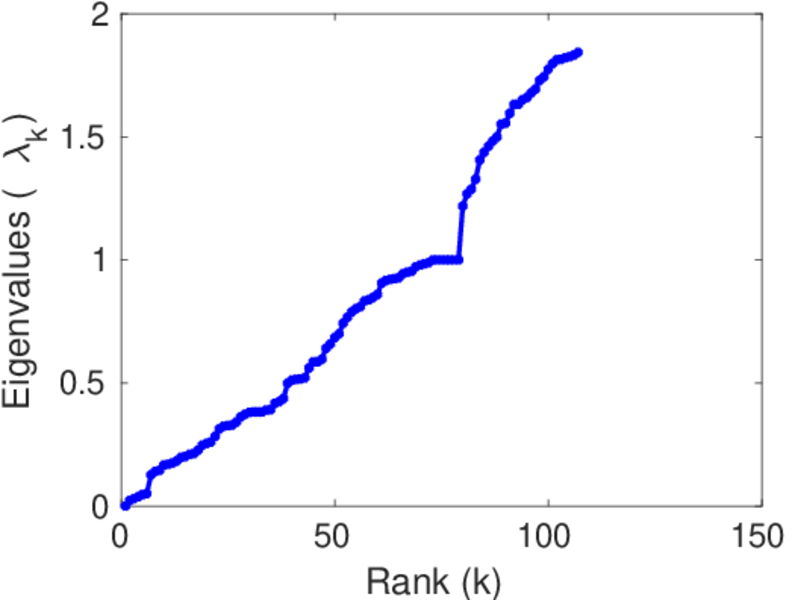
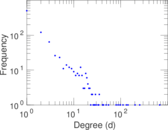
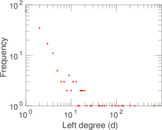
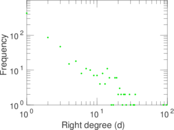
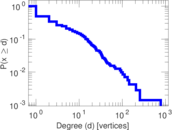
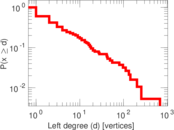
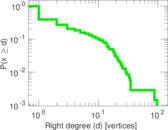
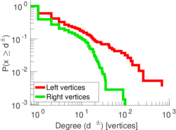
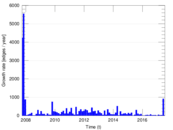
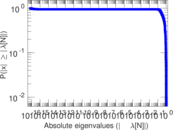
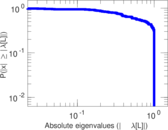
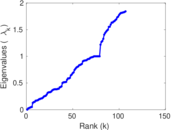
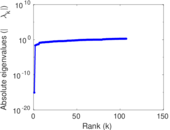
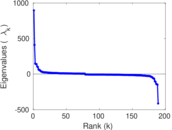
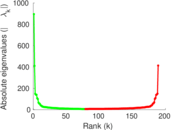
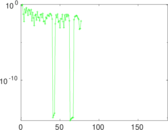
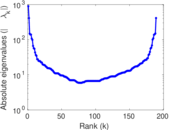
Plots


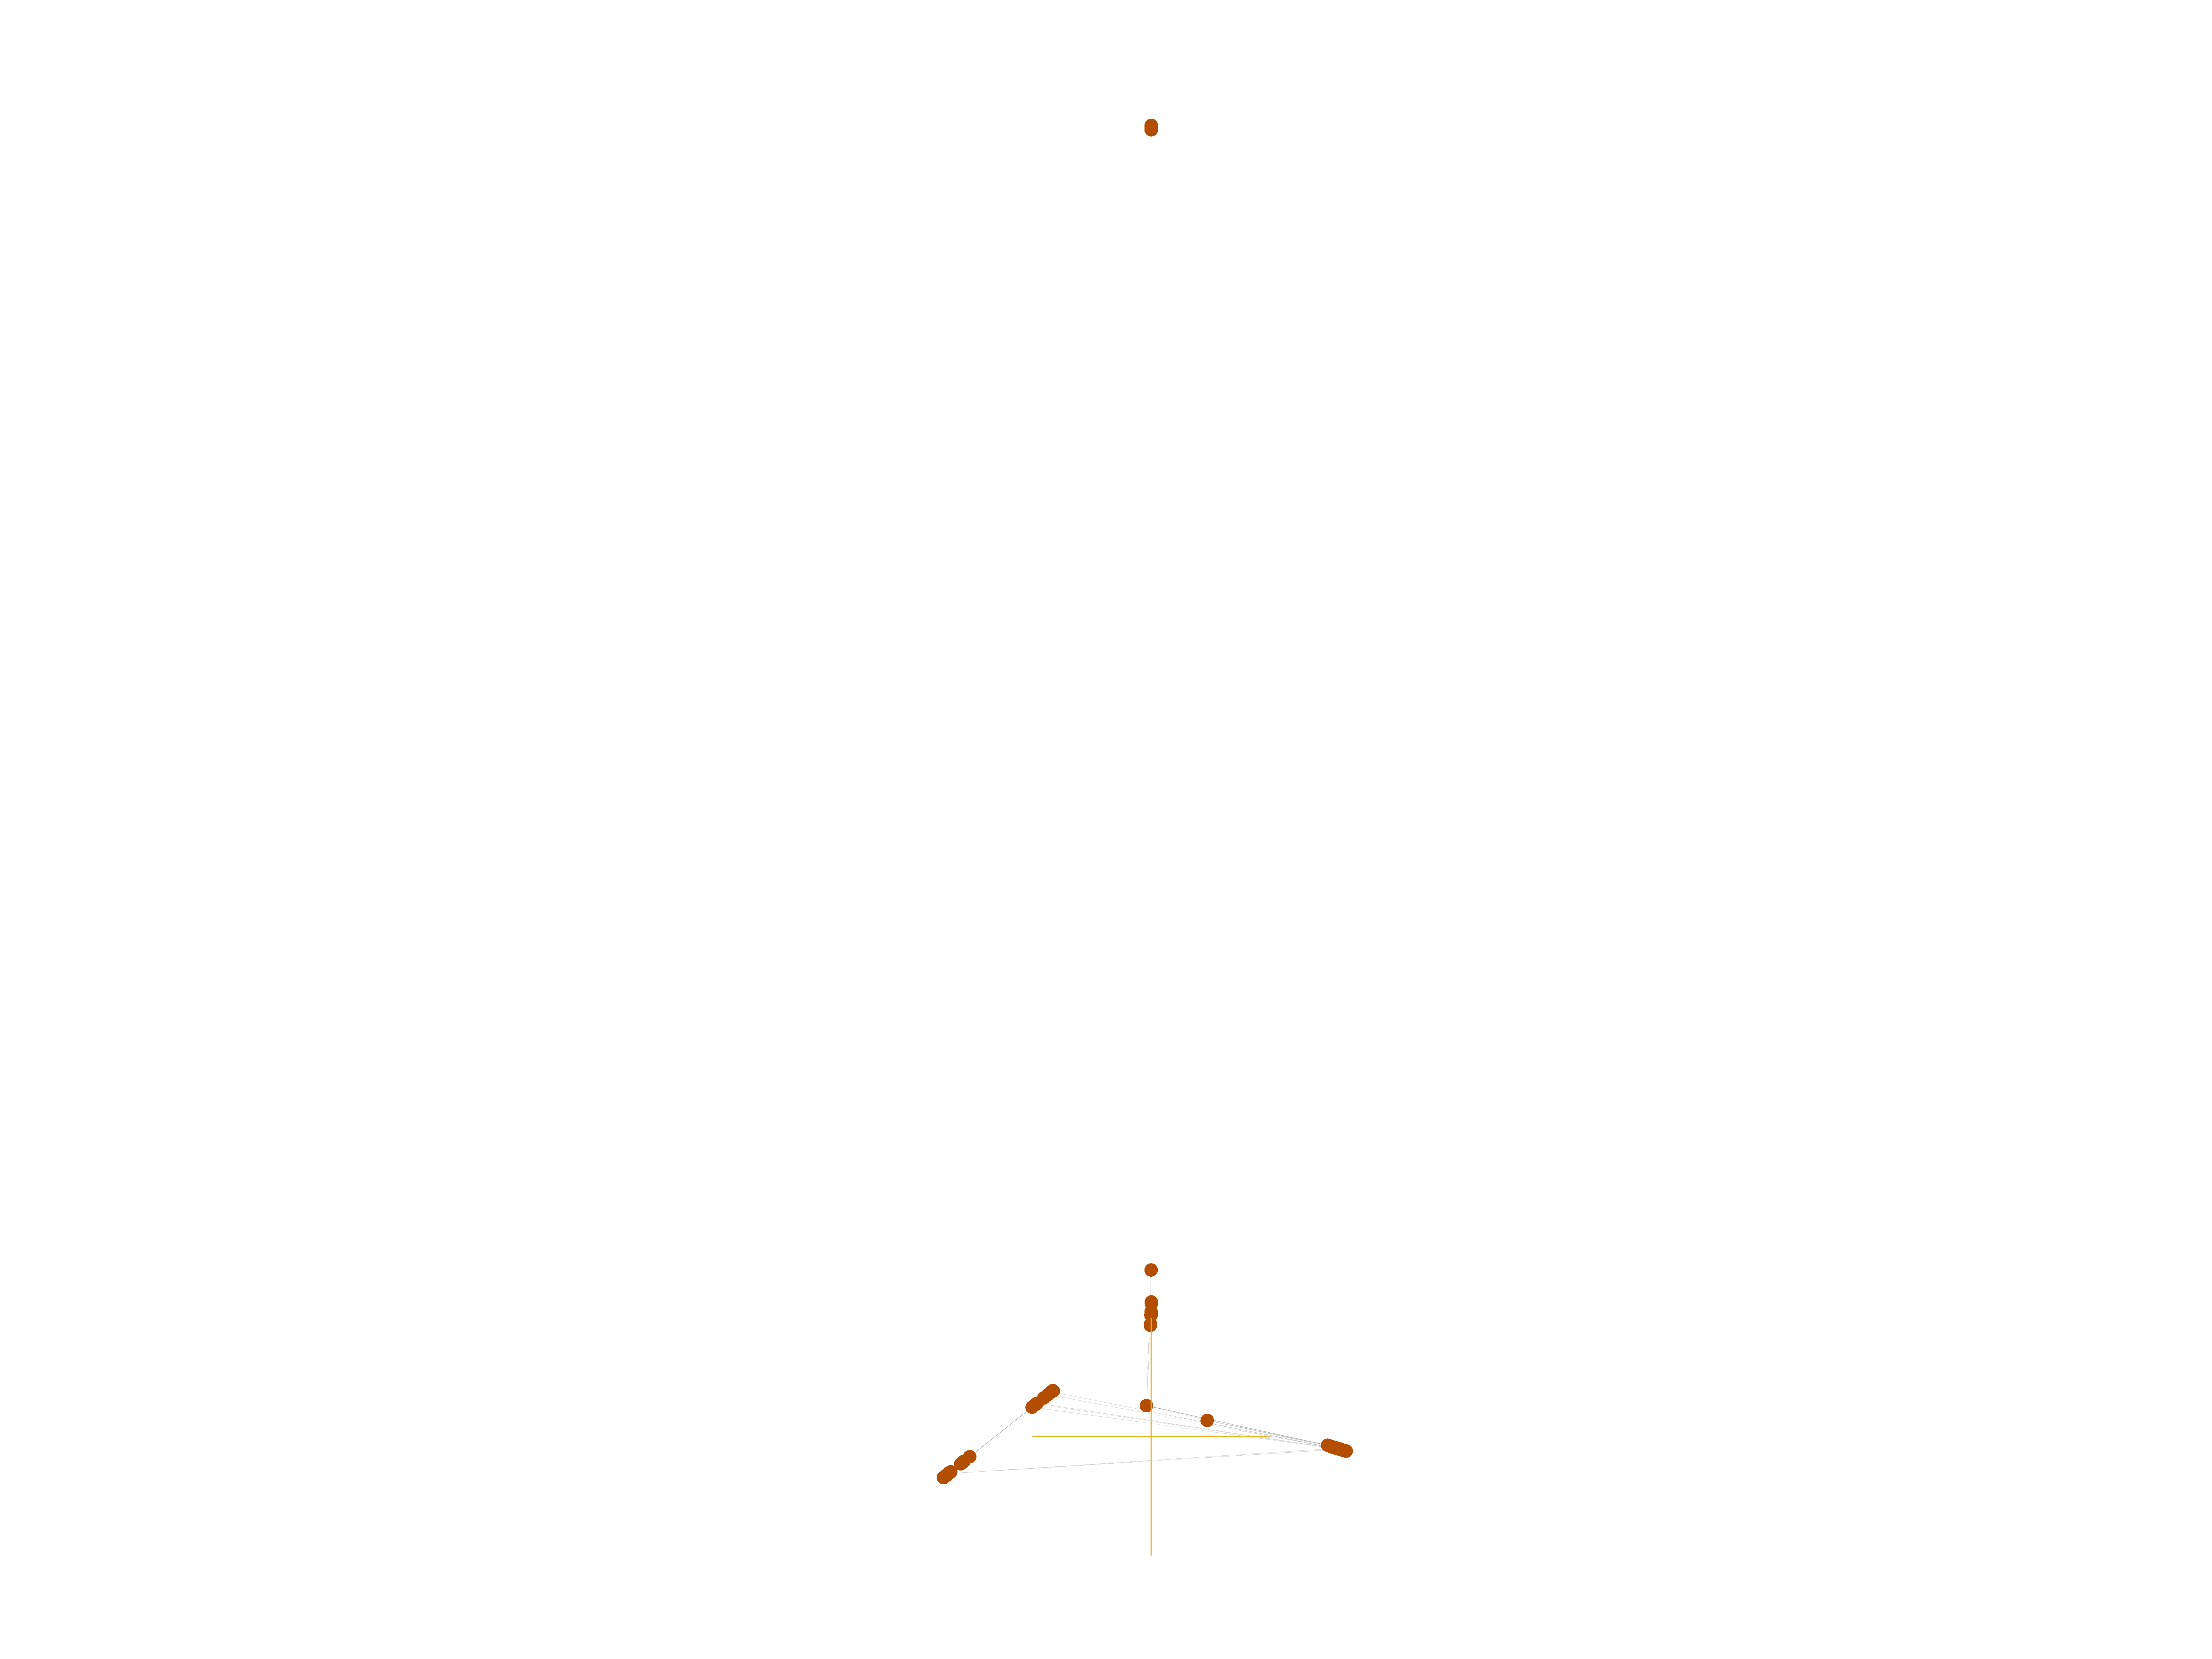
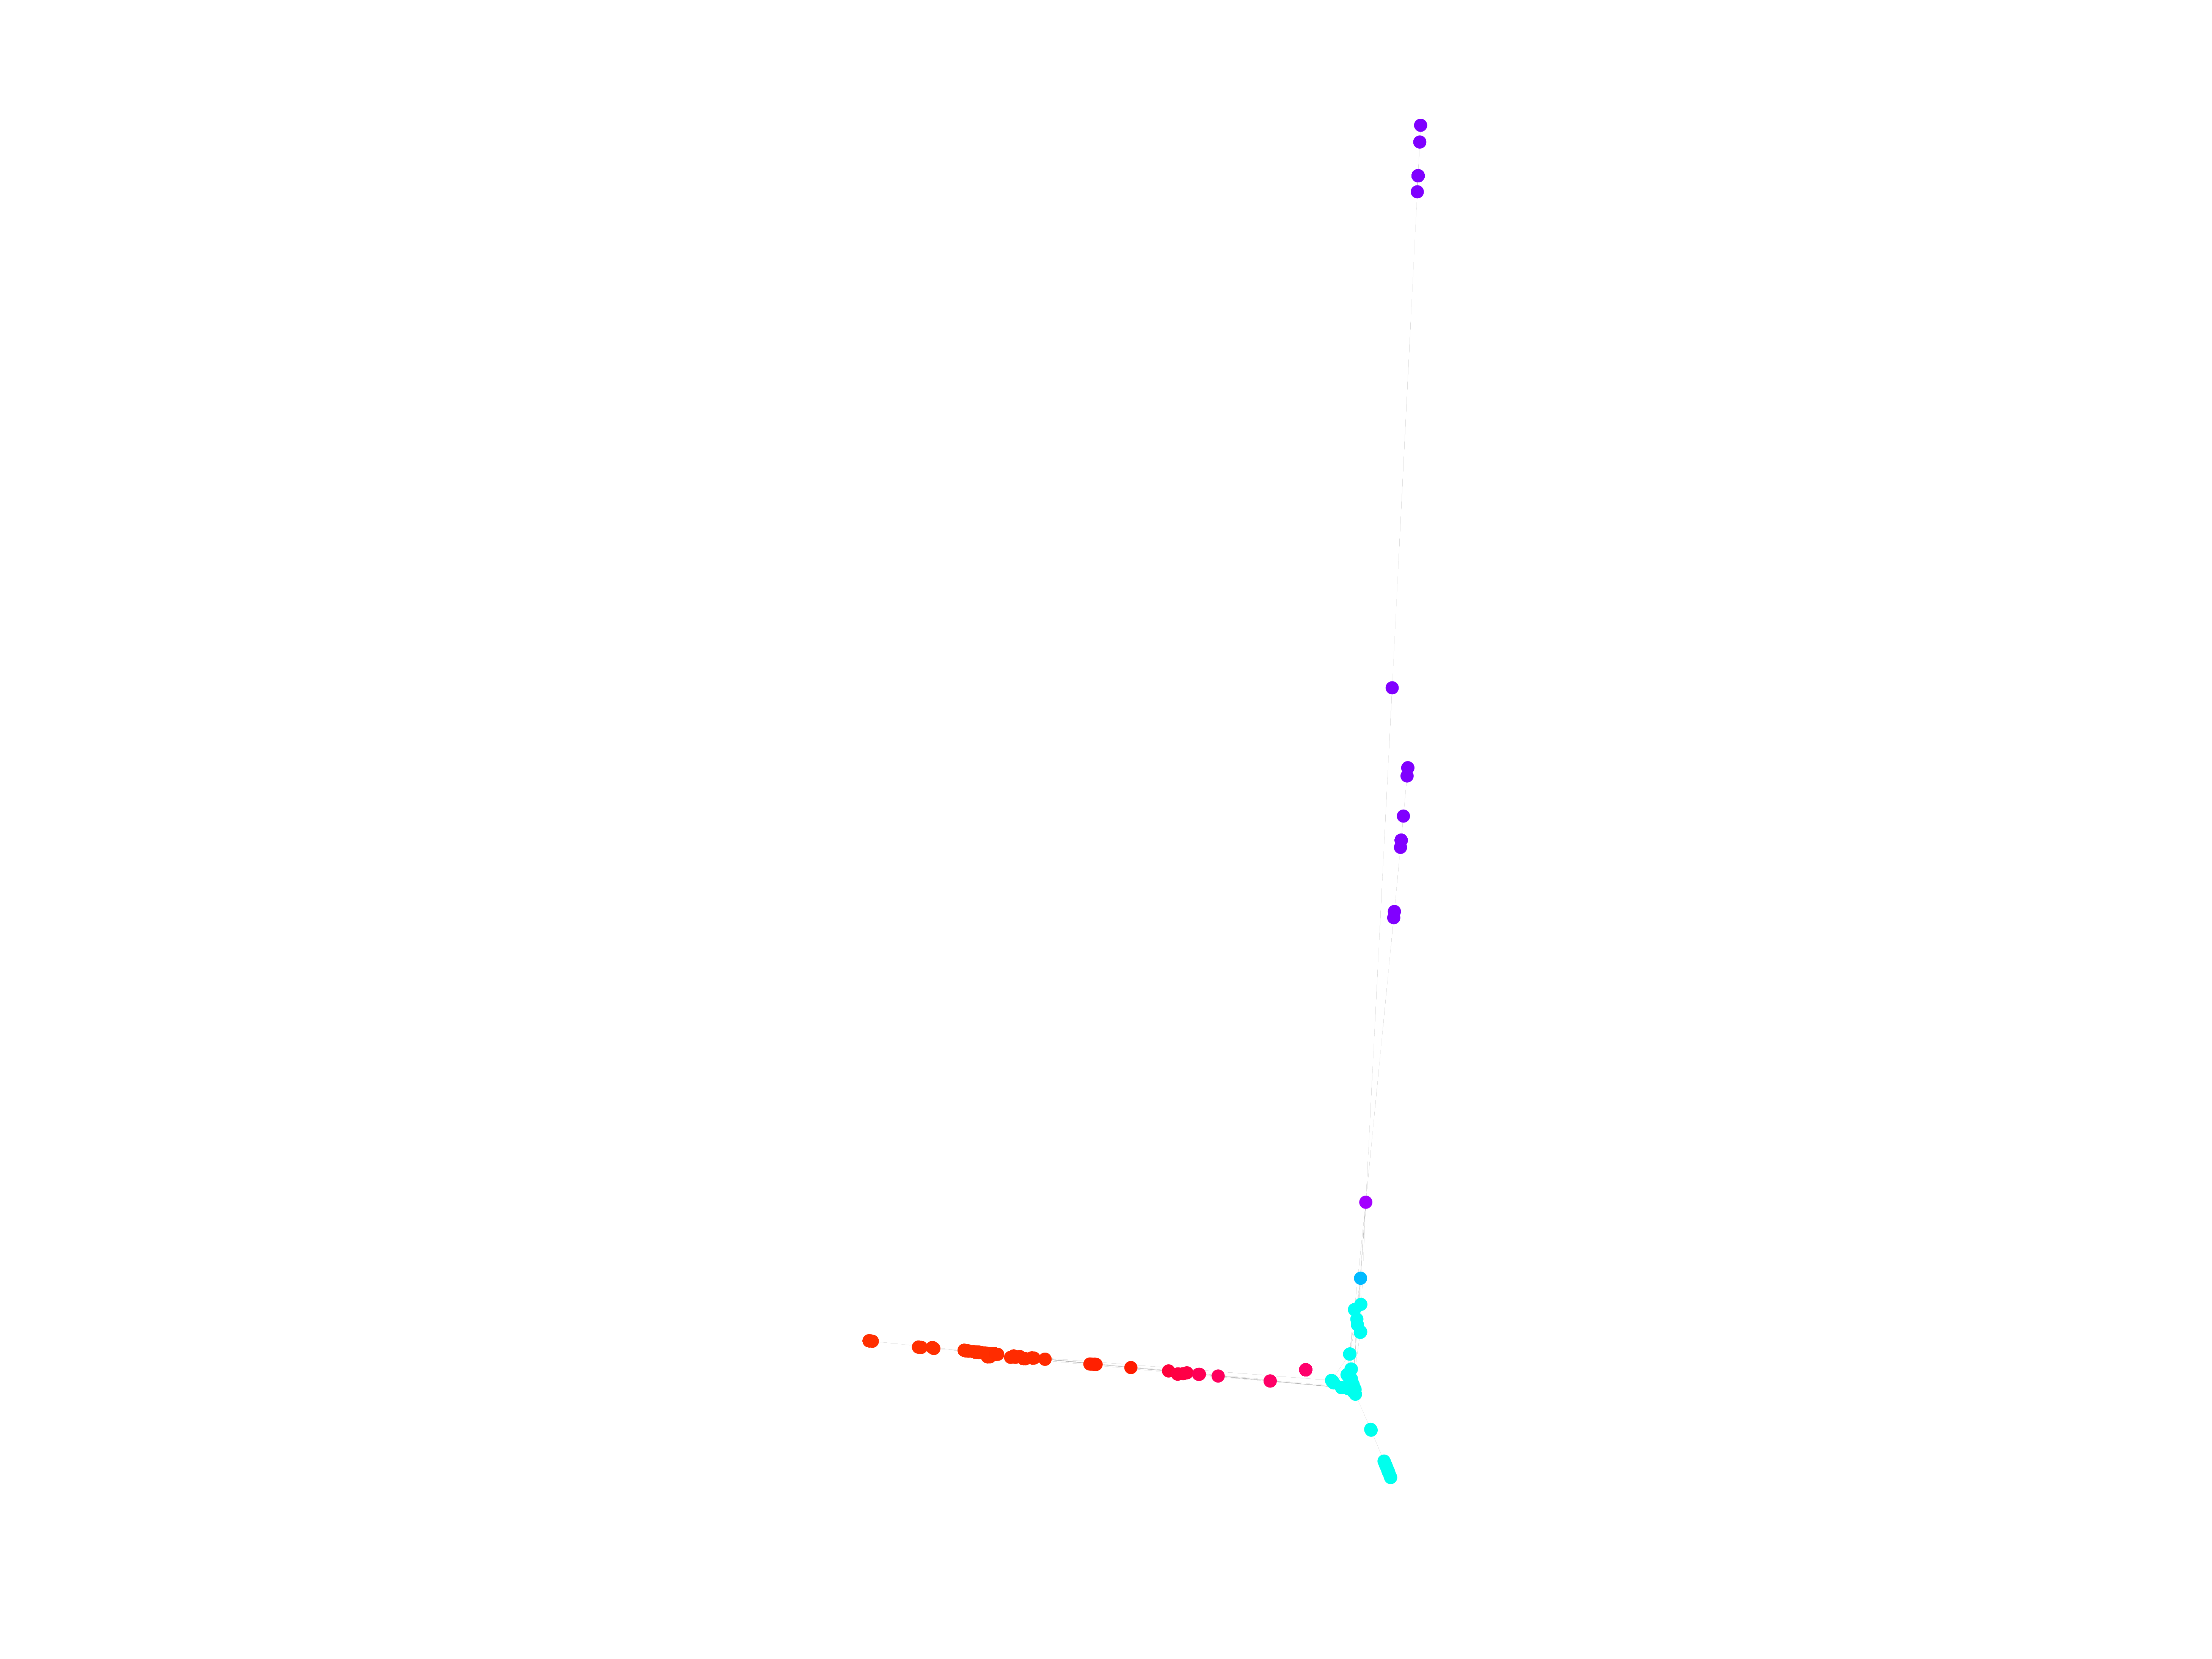
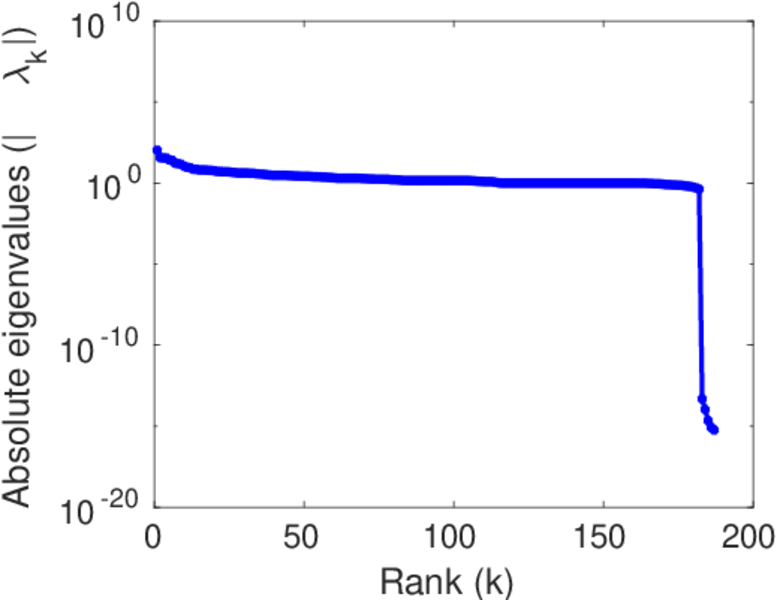
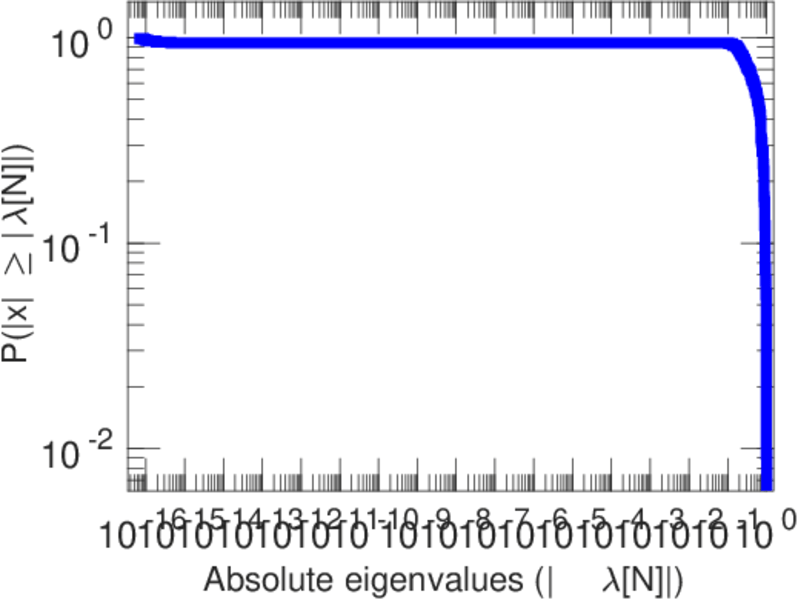
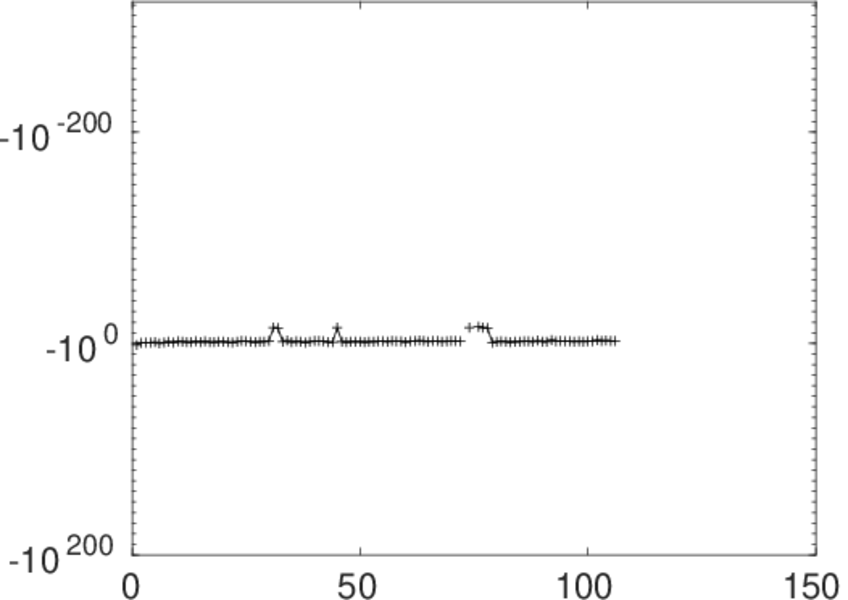
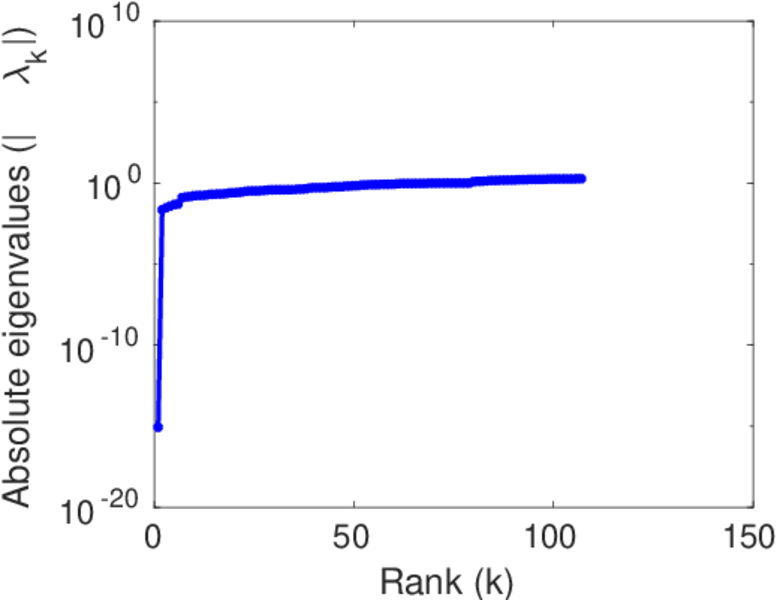
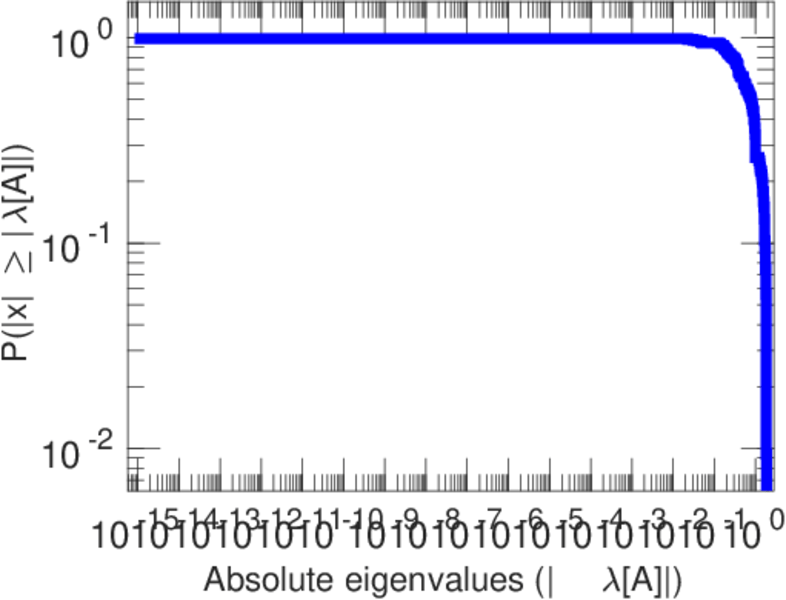
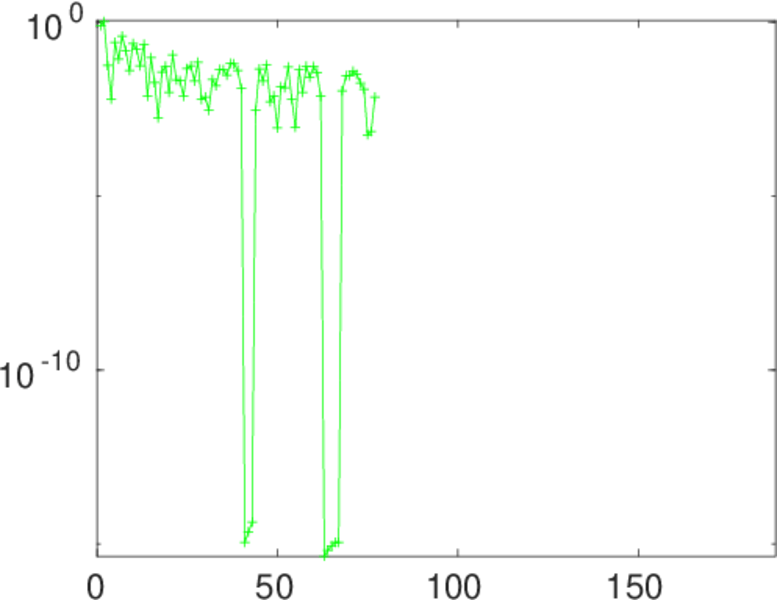
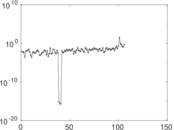
Matrix decompositions plots


Downloads
References
|
[1]
|
Jérôme Kunegis.
KONECT – The Koblenz Network Collection.
In Proc. Int. Conf. on World Wide Web Companion, pages
1343–1350, 2013.
[ http ]
|
|
[2]
|
Wikimedia Foundation.
Wikimedia downloads.
http://dumps.wikimedia.org/, January 2010.
|
 KONECT ‣ Networks ‣
Buy Me a Coffee
KONECT ‣ Networks ‣
Buy Me a Coffee