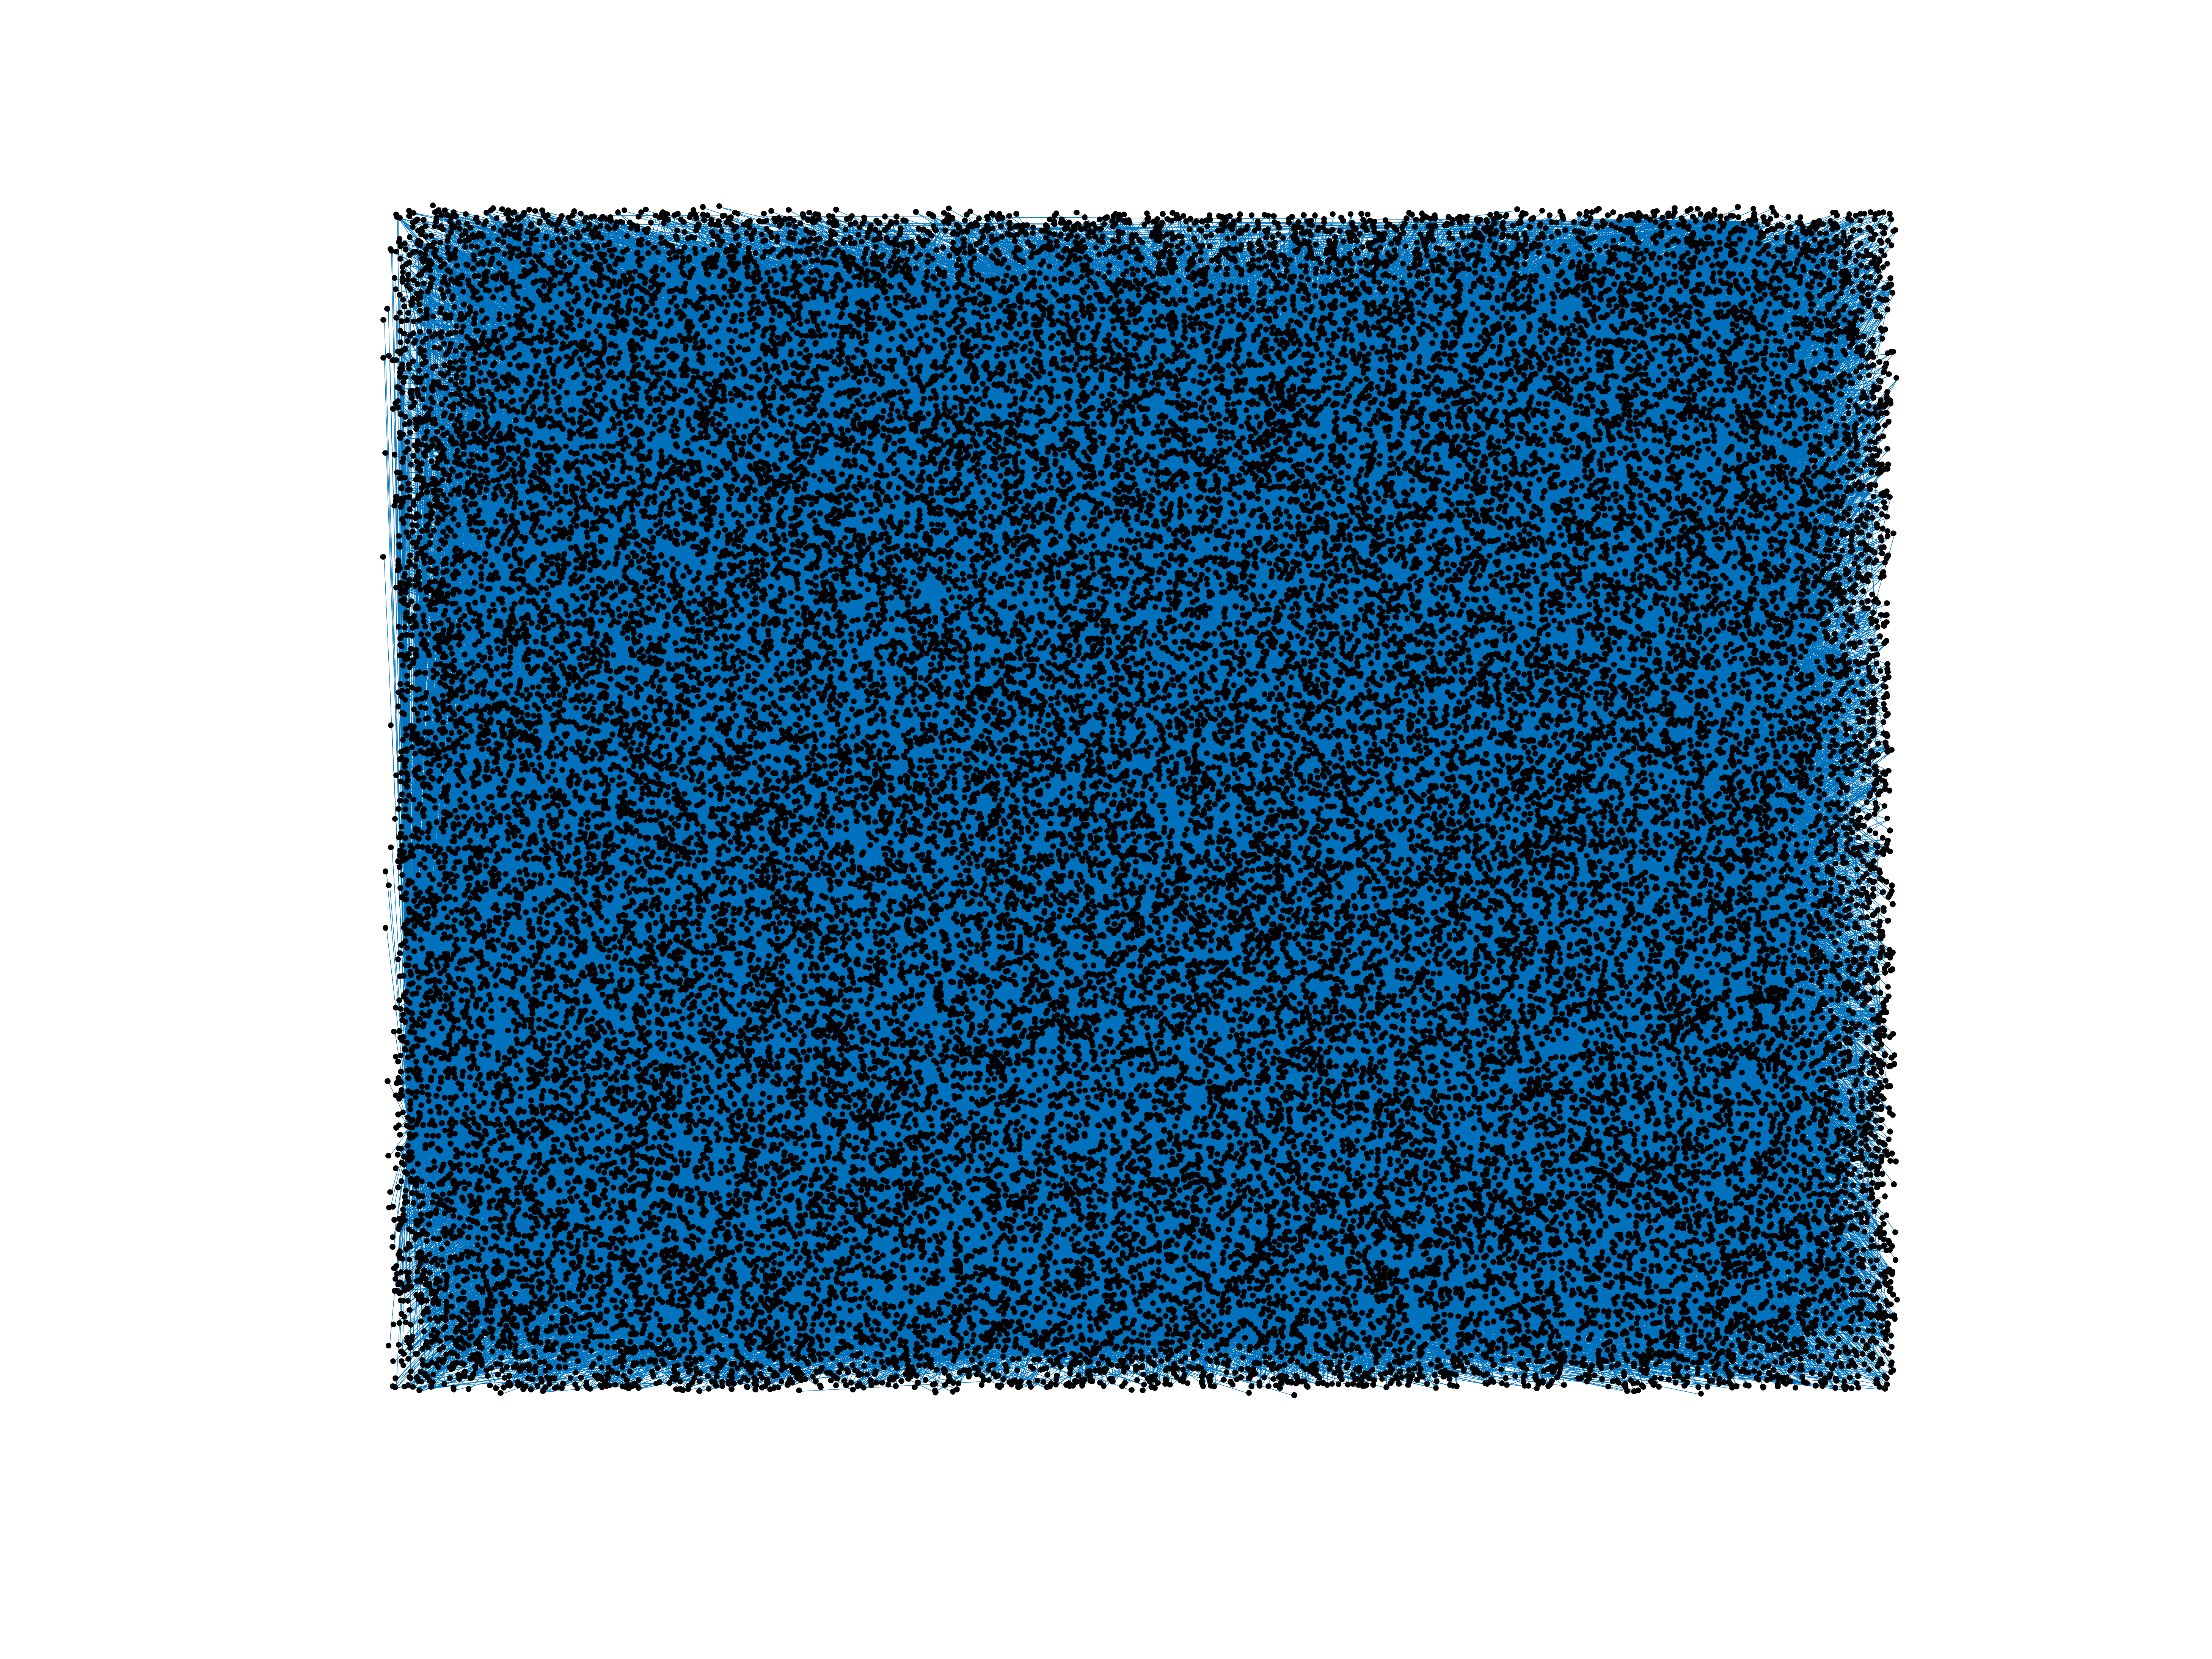
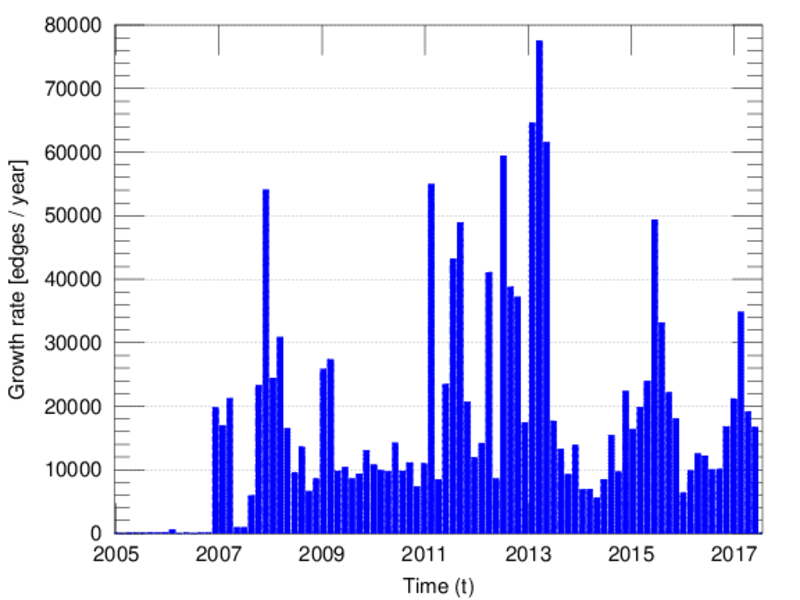
Wiktionary edits (br)
This is the bipartite edit network of the Breton Wiktionary. It contains users
and pages from the Breton Wiktionary, connected by edit events. Each edge
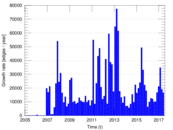
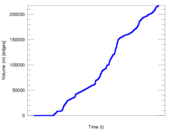
represents an edit. The dataset includes the timestamp of each edit.
Metadata
Statistics
| Size | n = | 44,388
|
| Left size | n1 = | 390
|
| Right size | n2 = | 43,998
|
| Volume | m = | 217,681
|
| Unique edge count | m̿ = | 112,920
|
| Wedge count | s = | 523,437,544
|
| Claw count | z = | 2,690,491,858,795
|
| Cross count | x = | 13,261,406,569,662,936
|
| Square count | q = | 184,708,533
|
| 4-Tour count | T4 = | 3,571,674,364
|
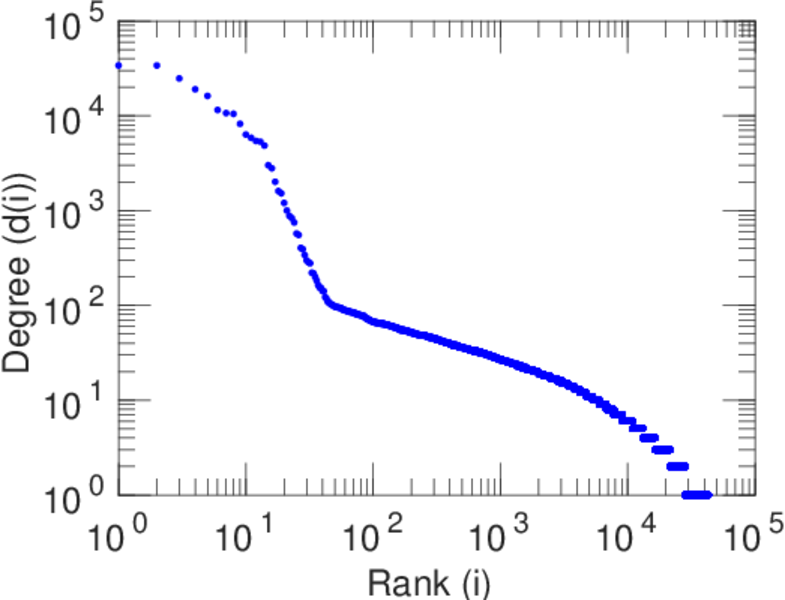
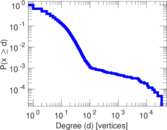
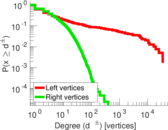
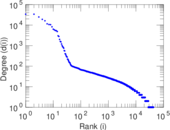
| Maximum degree | dmax = | 34,001
|
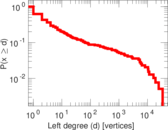
| Maximum left degree | d1max = | 34,001
|
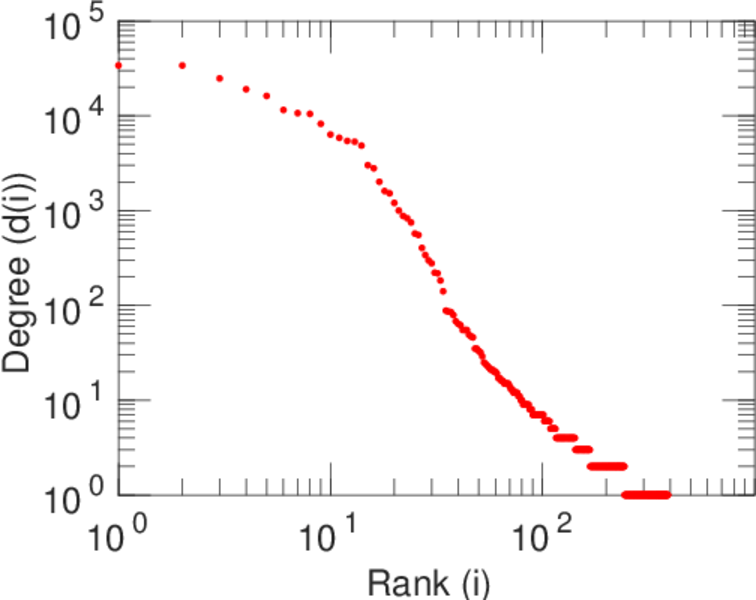
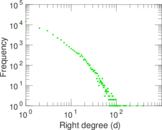
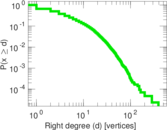
| Maximum right degree | d2max = | 392
|
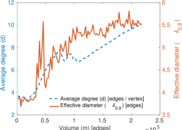
| Average degree | d = | 9.808 10
|
| Average left degree | d1 = | 558.156
|
| Average right degree | d2 = | 4.947 52
|
| Fill | p = | 0.006 580 72
|
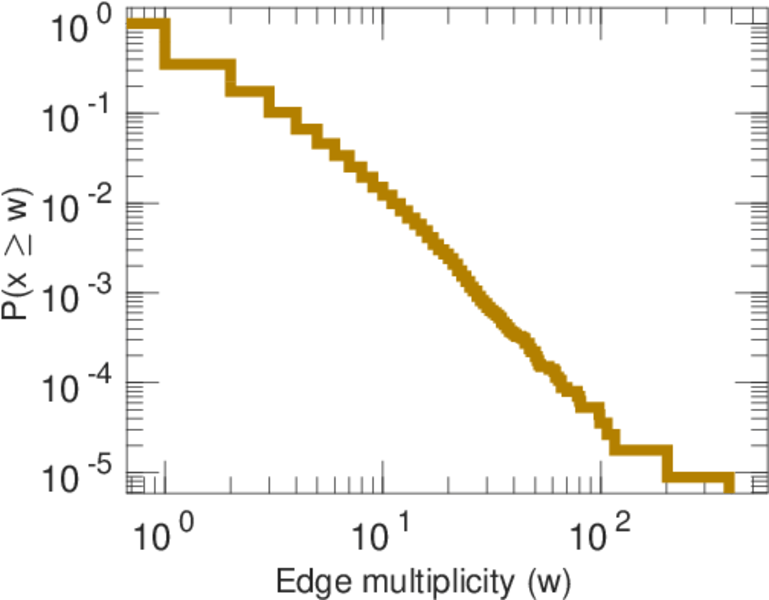
| Average edge multiplicity | m̃ = | 1.927 75
|
| Size of LCC | N = | 42,720
|
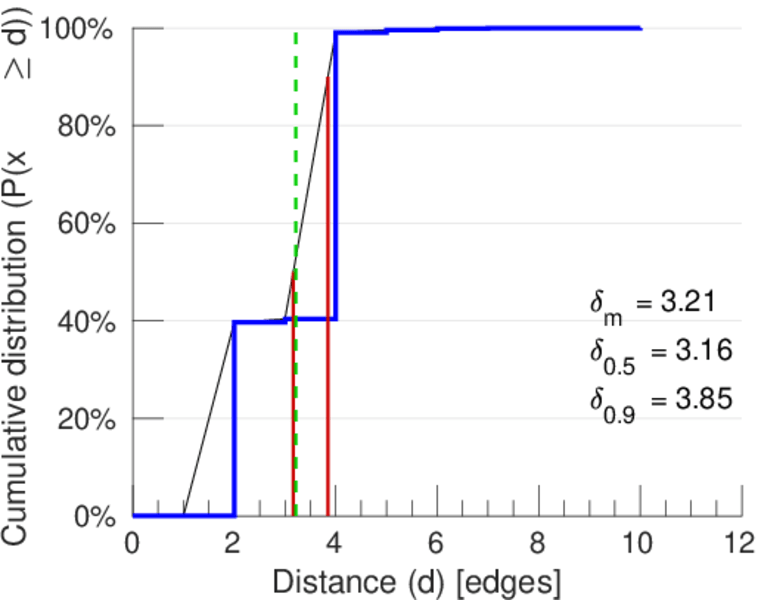
| Diameter | δ = | 14
|
| 50-Percentile effective diameter | δ0.5 = | 3.164 35
|
| 90-Percentile effective diameter | δ0.9 = | 3.845 93
|
| Median distance | δM = | 4
|
| Mean distance | δm = | 3.214 82
|
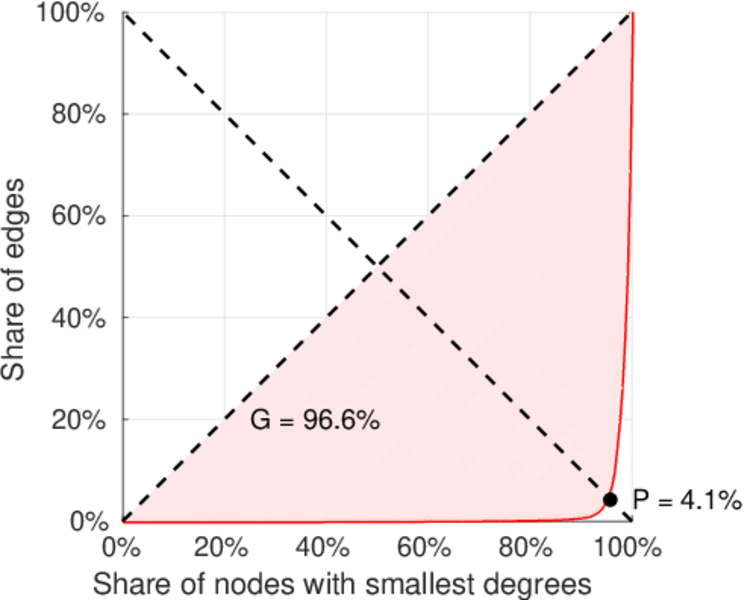
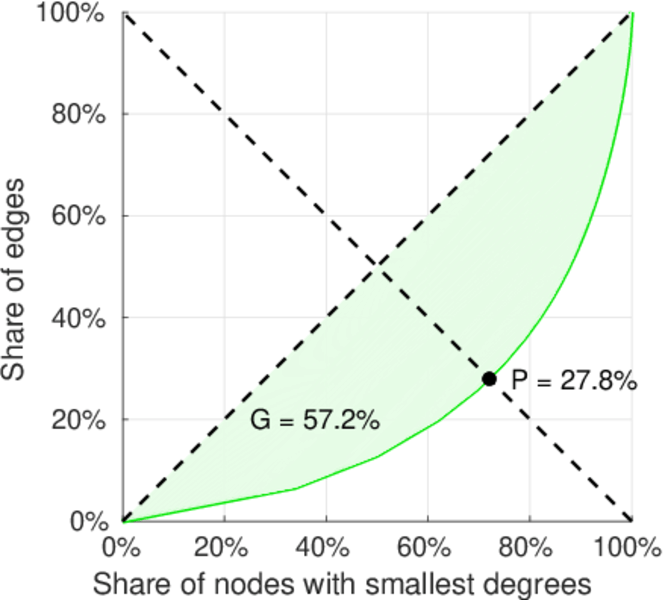
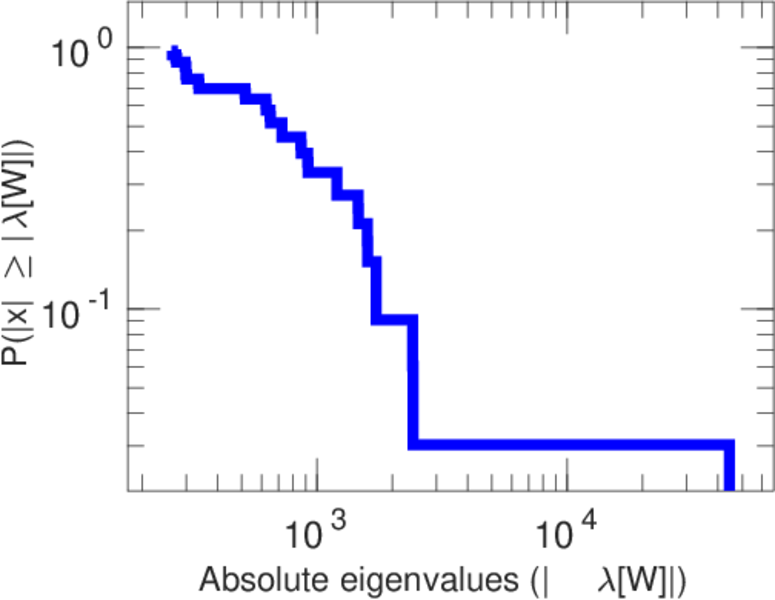
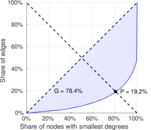
| Gini coefficient | G = | 0.784 156
|
| Balanced inequality ratio | P = | 0.191 877
|
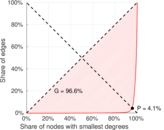
| Left balanced inequality ratio | P1 = | 0.040 632 9
|
| Right balanced inequality ratio | P2 = | 0.278 118
|
| Relative edge distribution entropy | Her = | 0.687 047
|
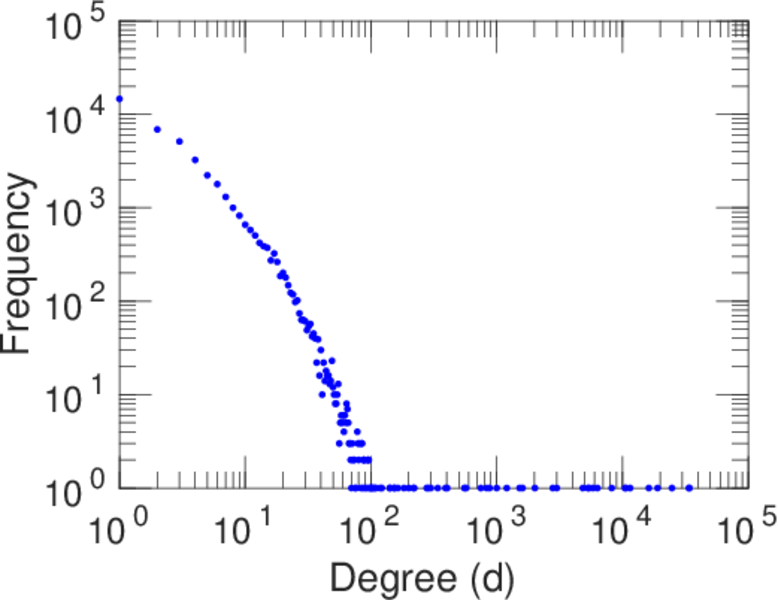
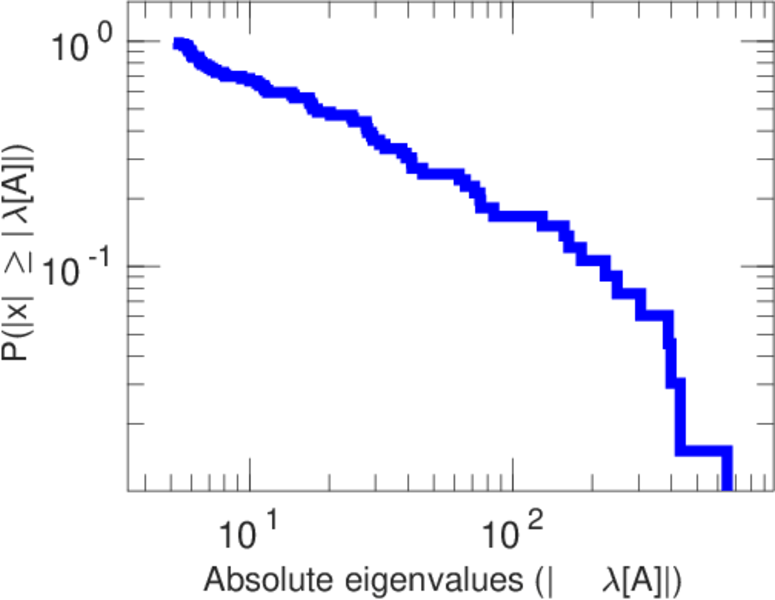
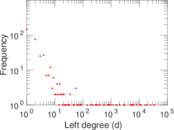
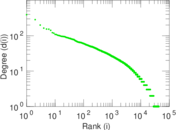
| Power law exponent | γ = | 2.496 73
|
| Tail power law exponent | γt = | 2.891 00
|
| Tail power law exponent with p | γ3 = | 2.891 00
|
| p-value | p = | 0.000 00
|
| Left tail power law exponent with p | γ3,1 = | 1.401 00
|
| Left p-value | p1 = | 0.026 000 0
|
| Right tail power law exponent with p | γ3,2 = | 8.991 00
|
| Right p-value | p2 = | 0.015 000 0
|
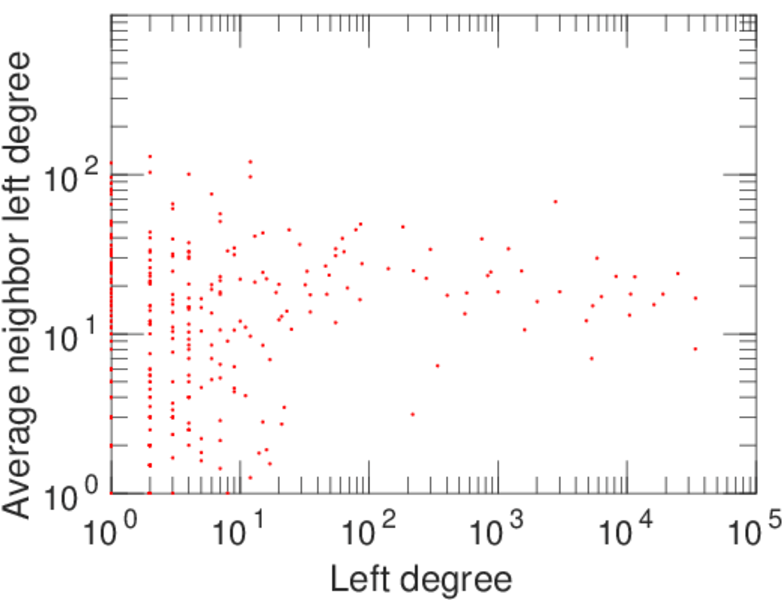
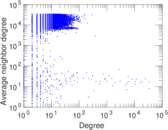
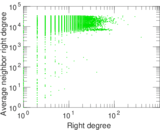
| Degree assortativity | ρ = | −0.400 647
|
| Degree assortativity p-value | pρ = | 0.000 00
|
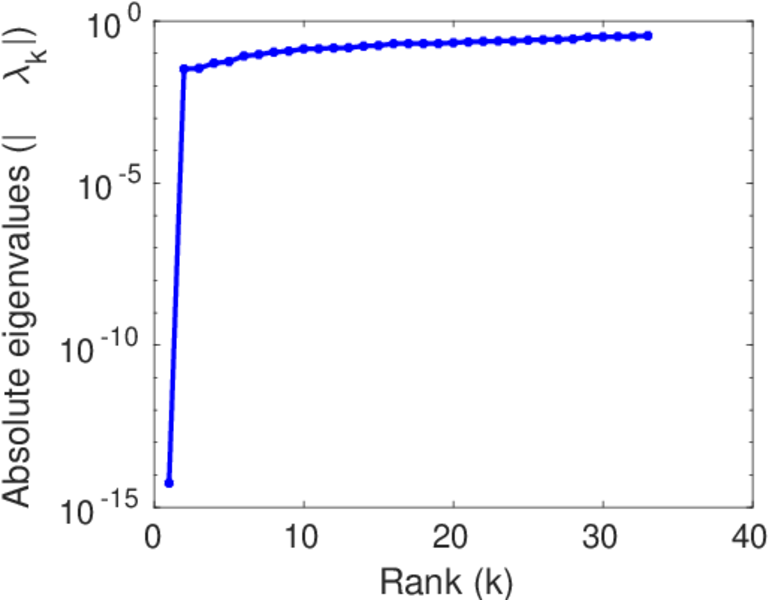
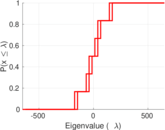
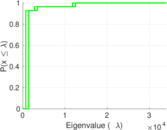
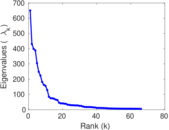
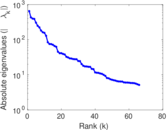
| Spectral norm | α = | 650.216
|
| Algebraic connectivity | a = | 0.032 779 0
|
| Spectral separation | |λ1[A] / λ2[A]| = | 1.509 15
|
| Controllability | C = | 42,216
|
| Relative controllability | Cr = | 0.982 041
|
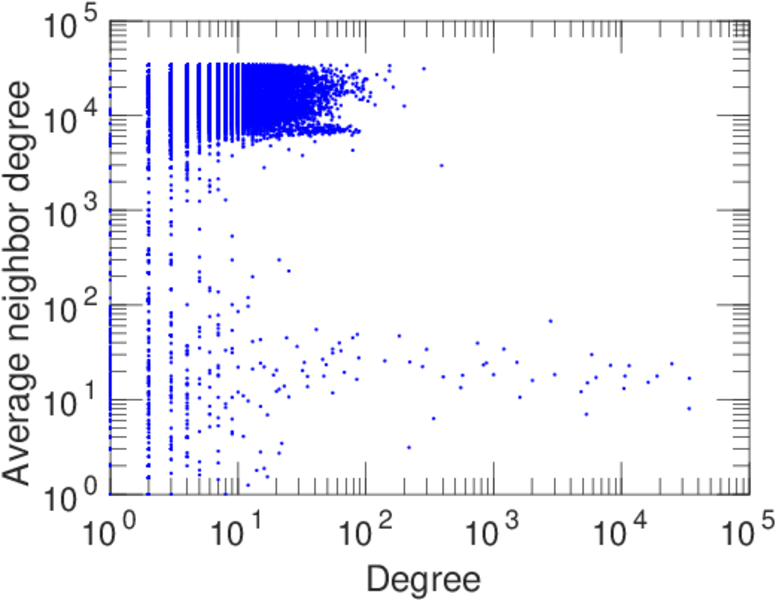
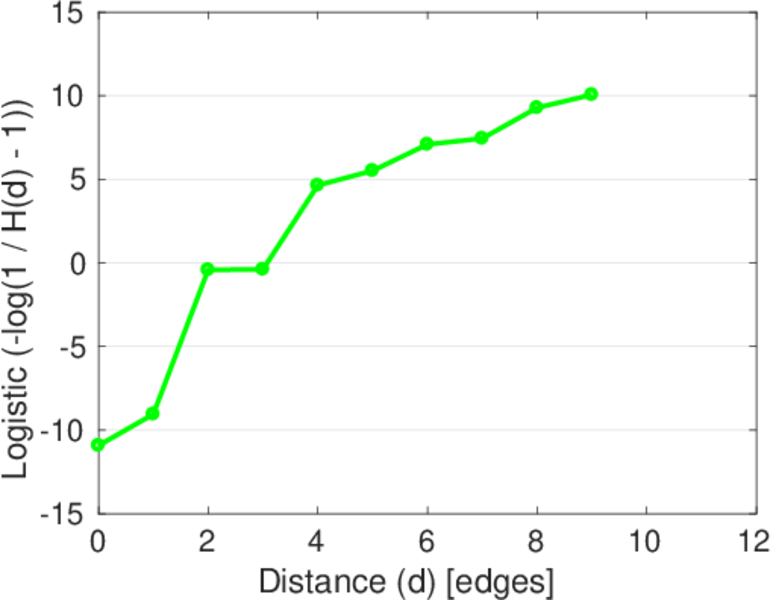
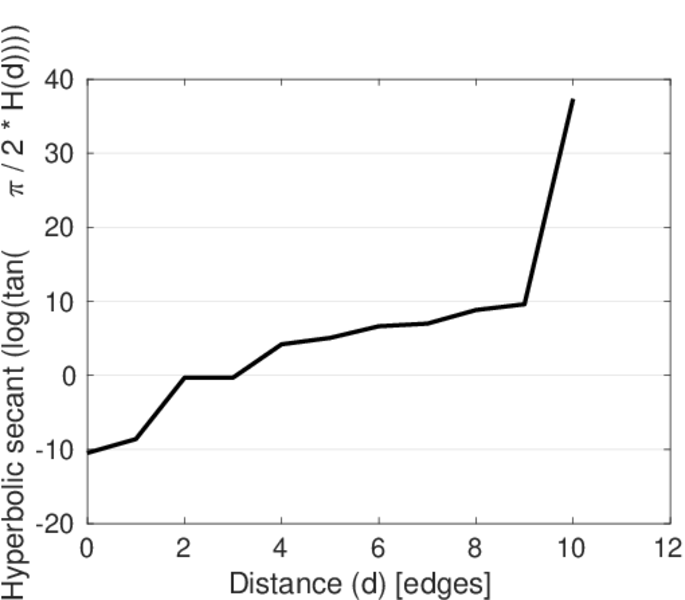
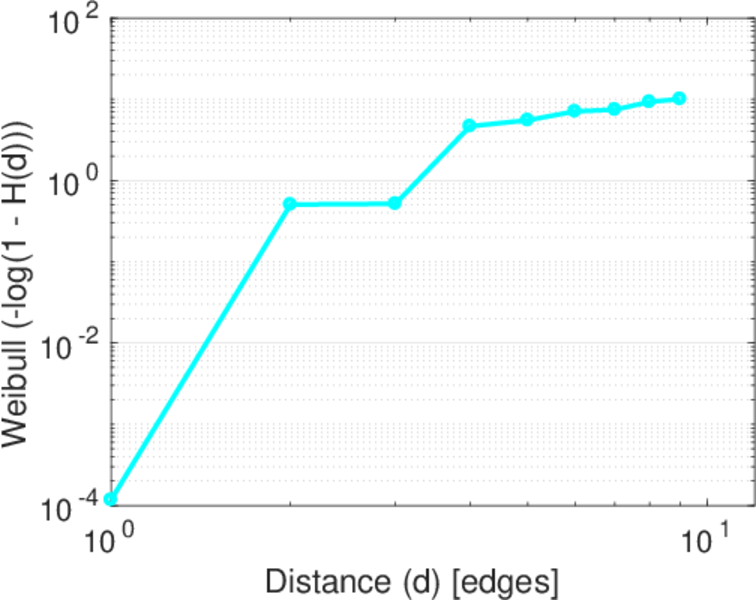
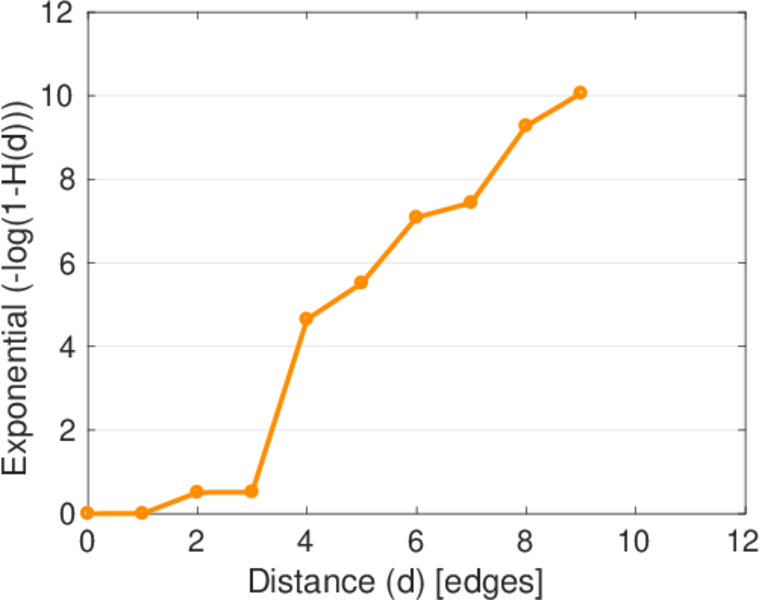
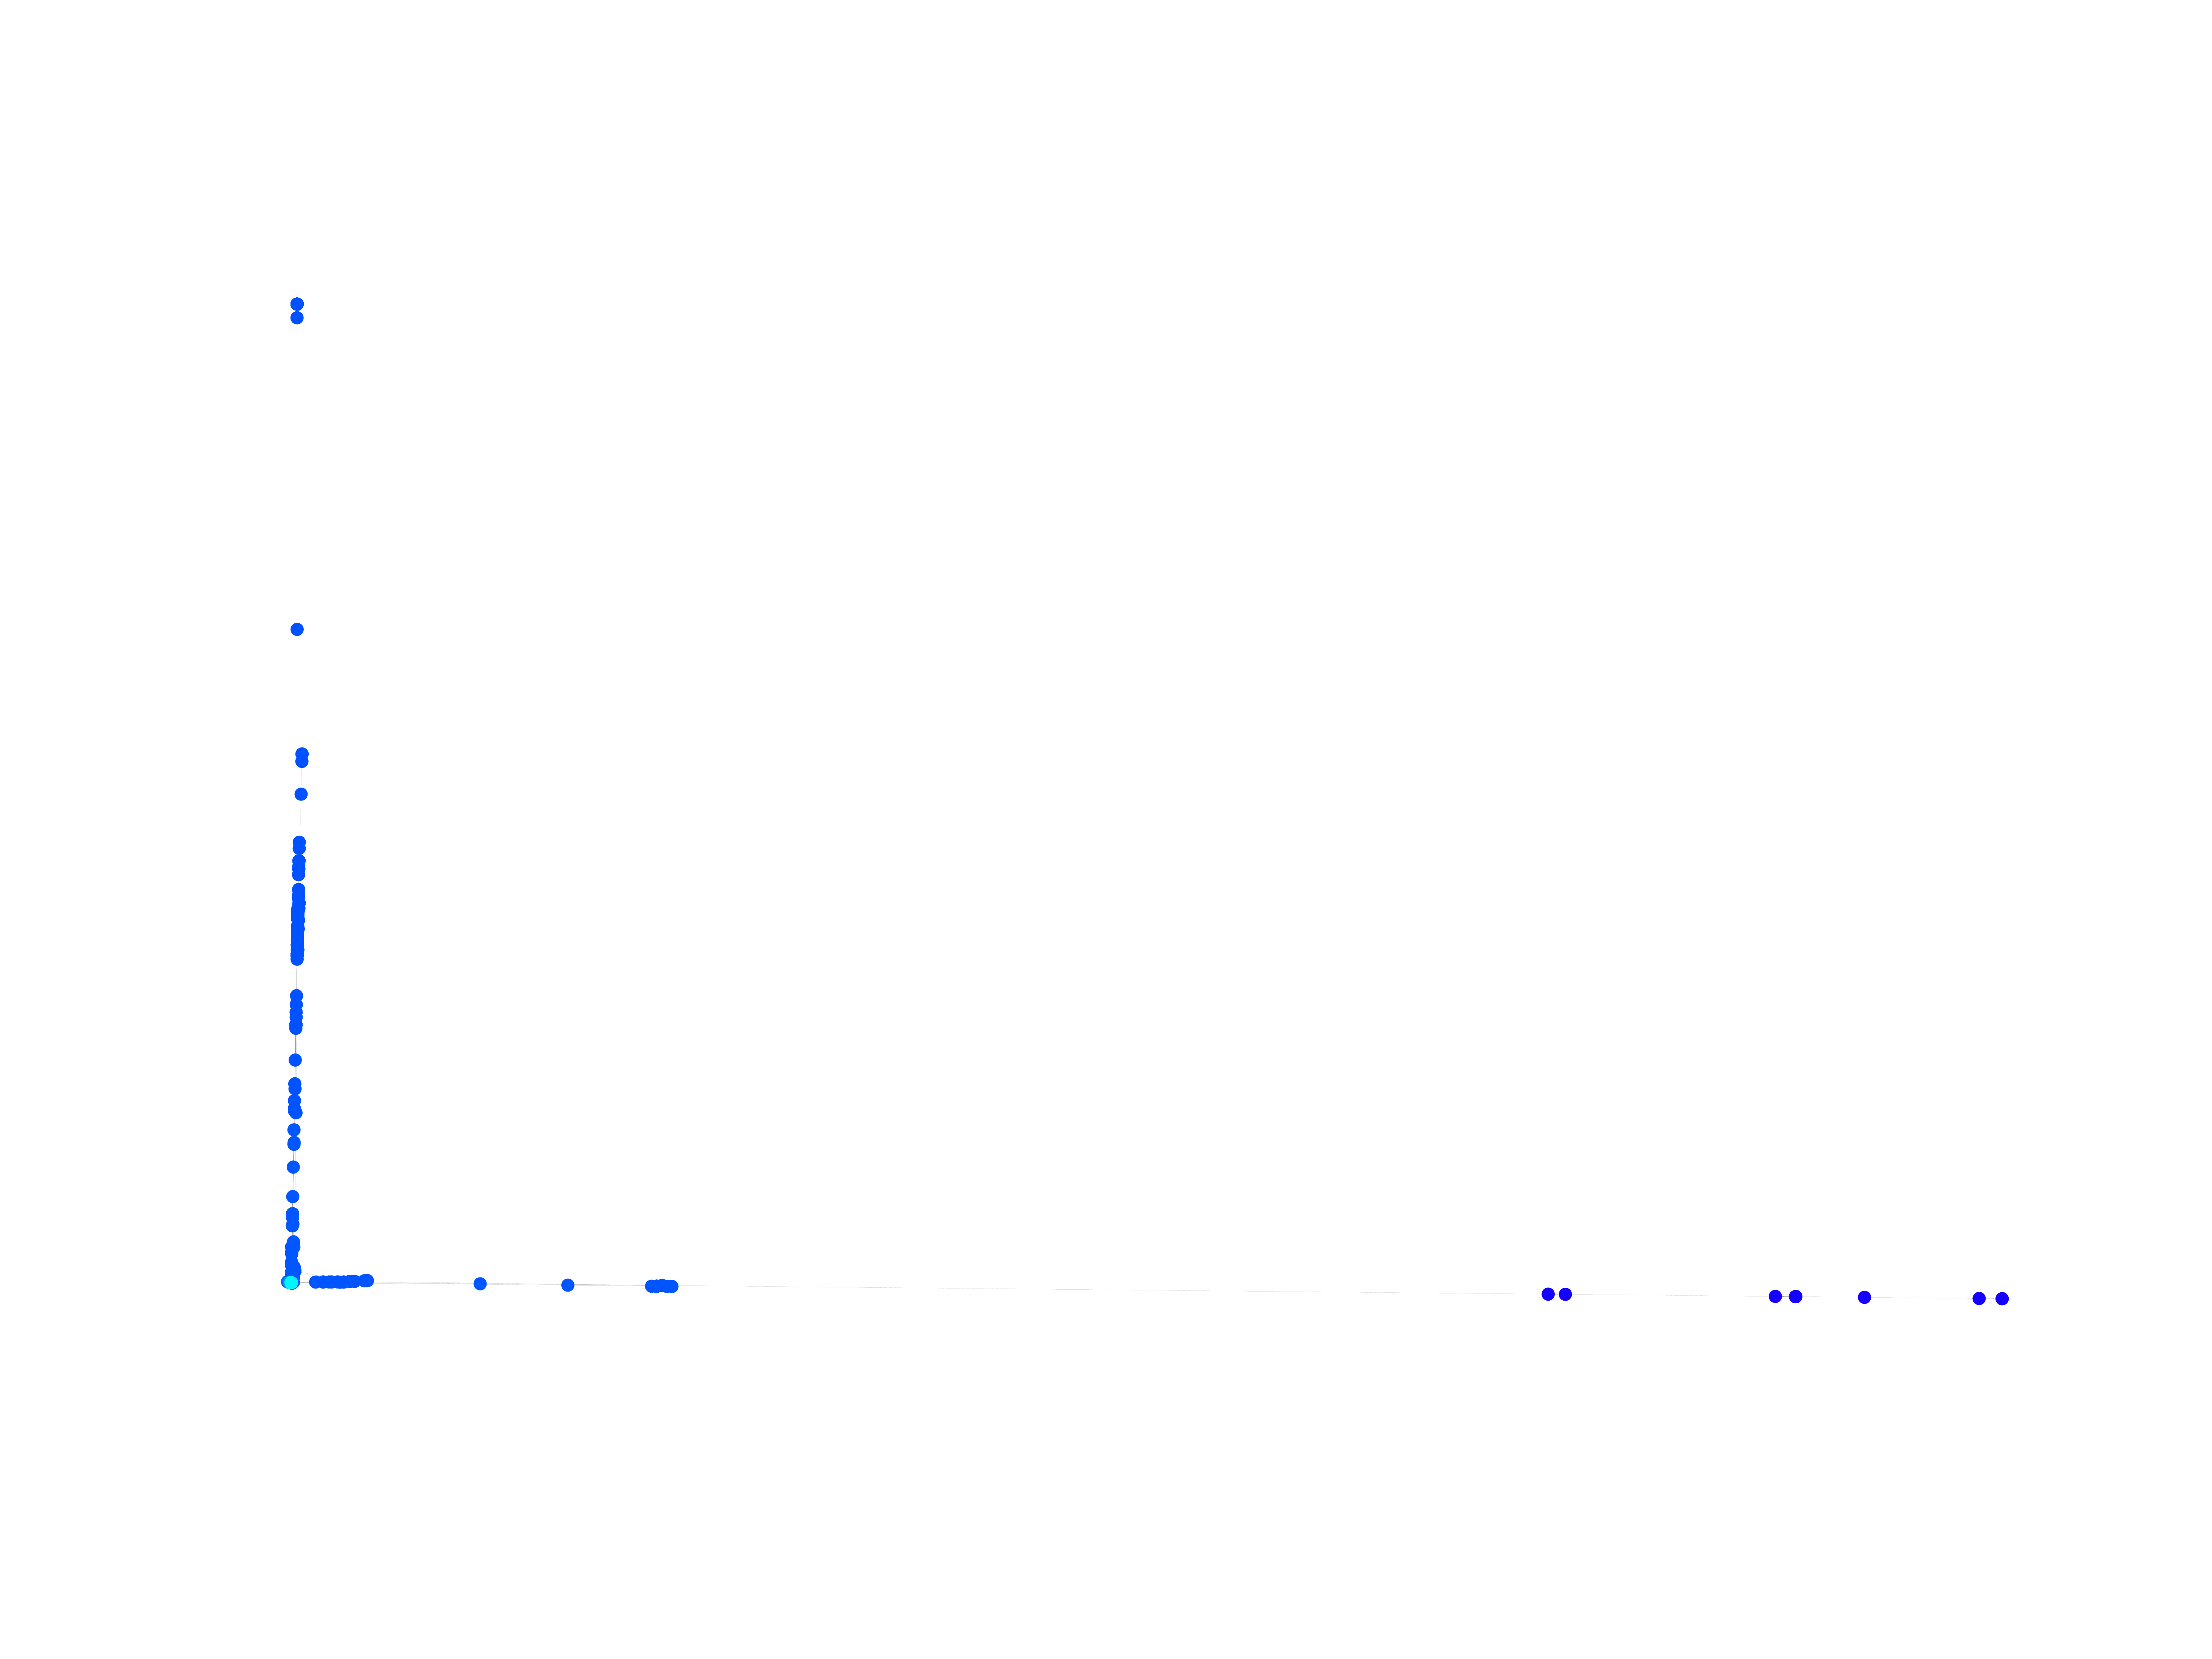
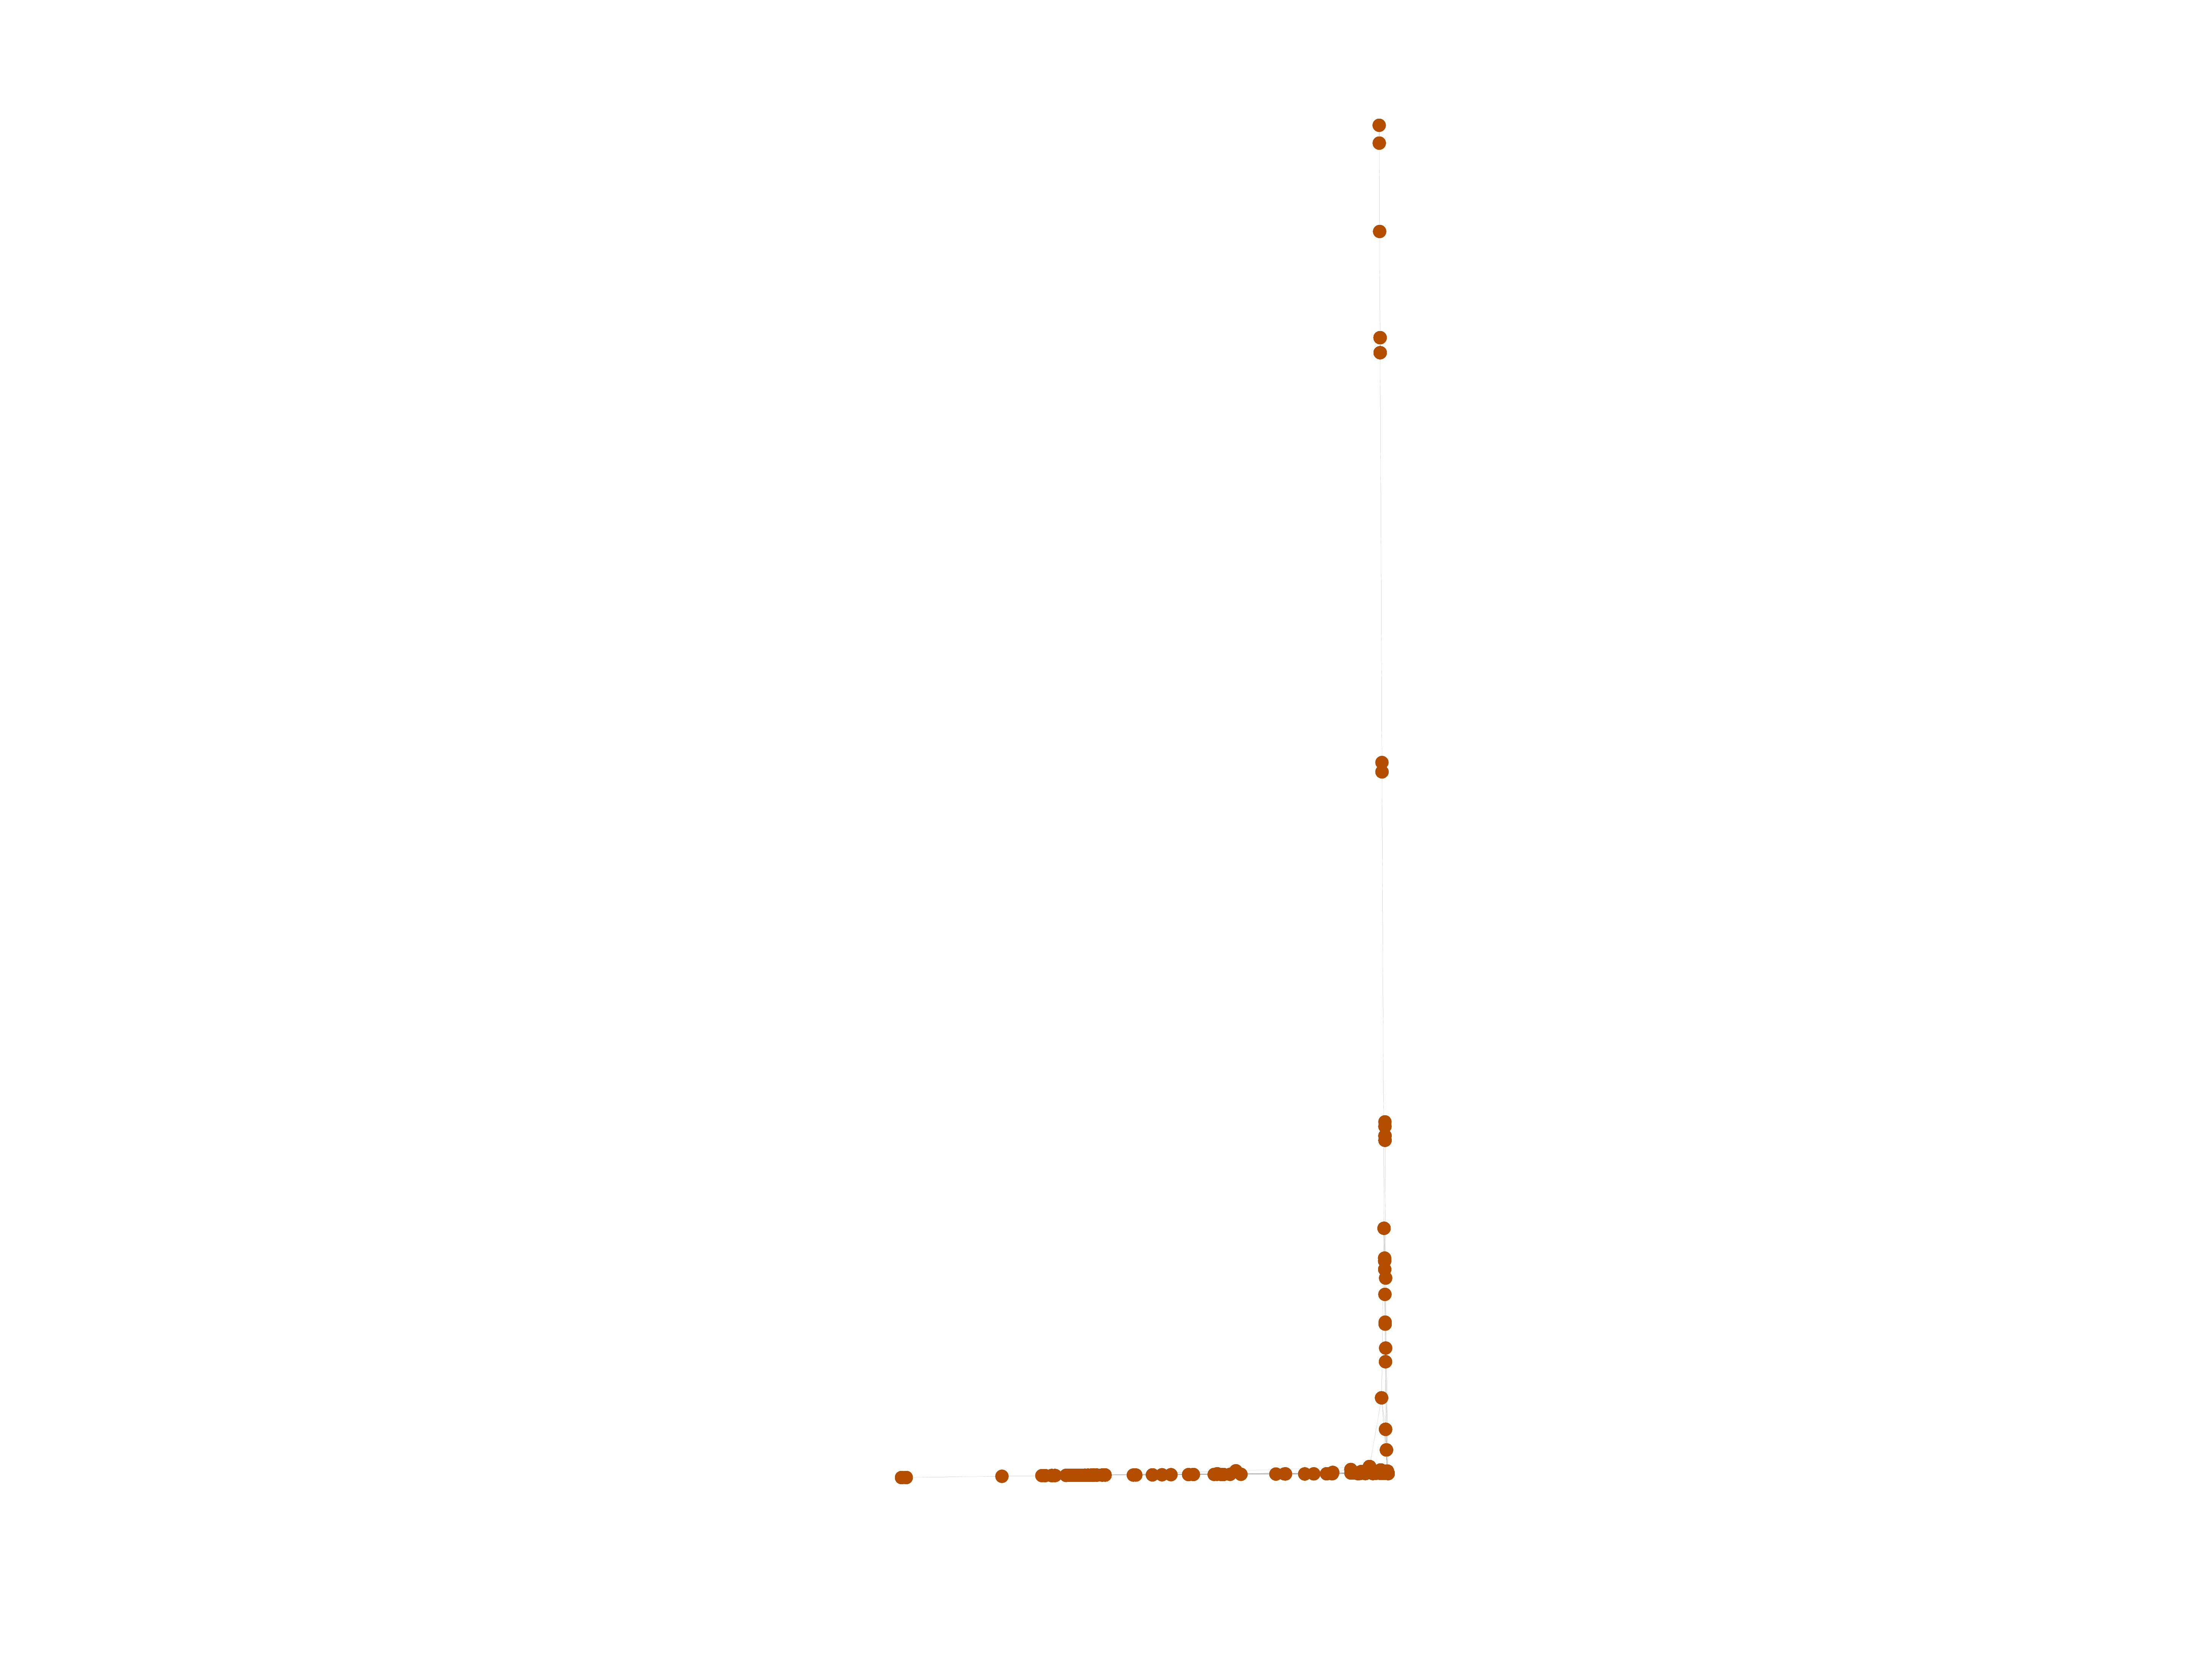
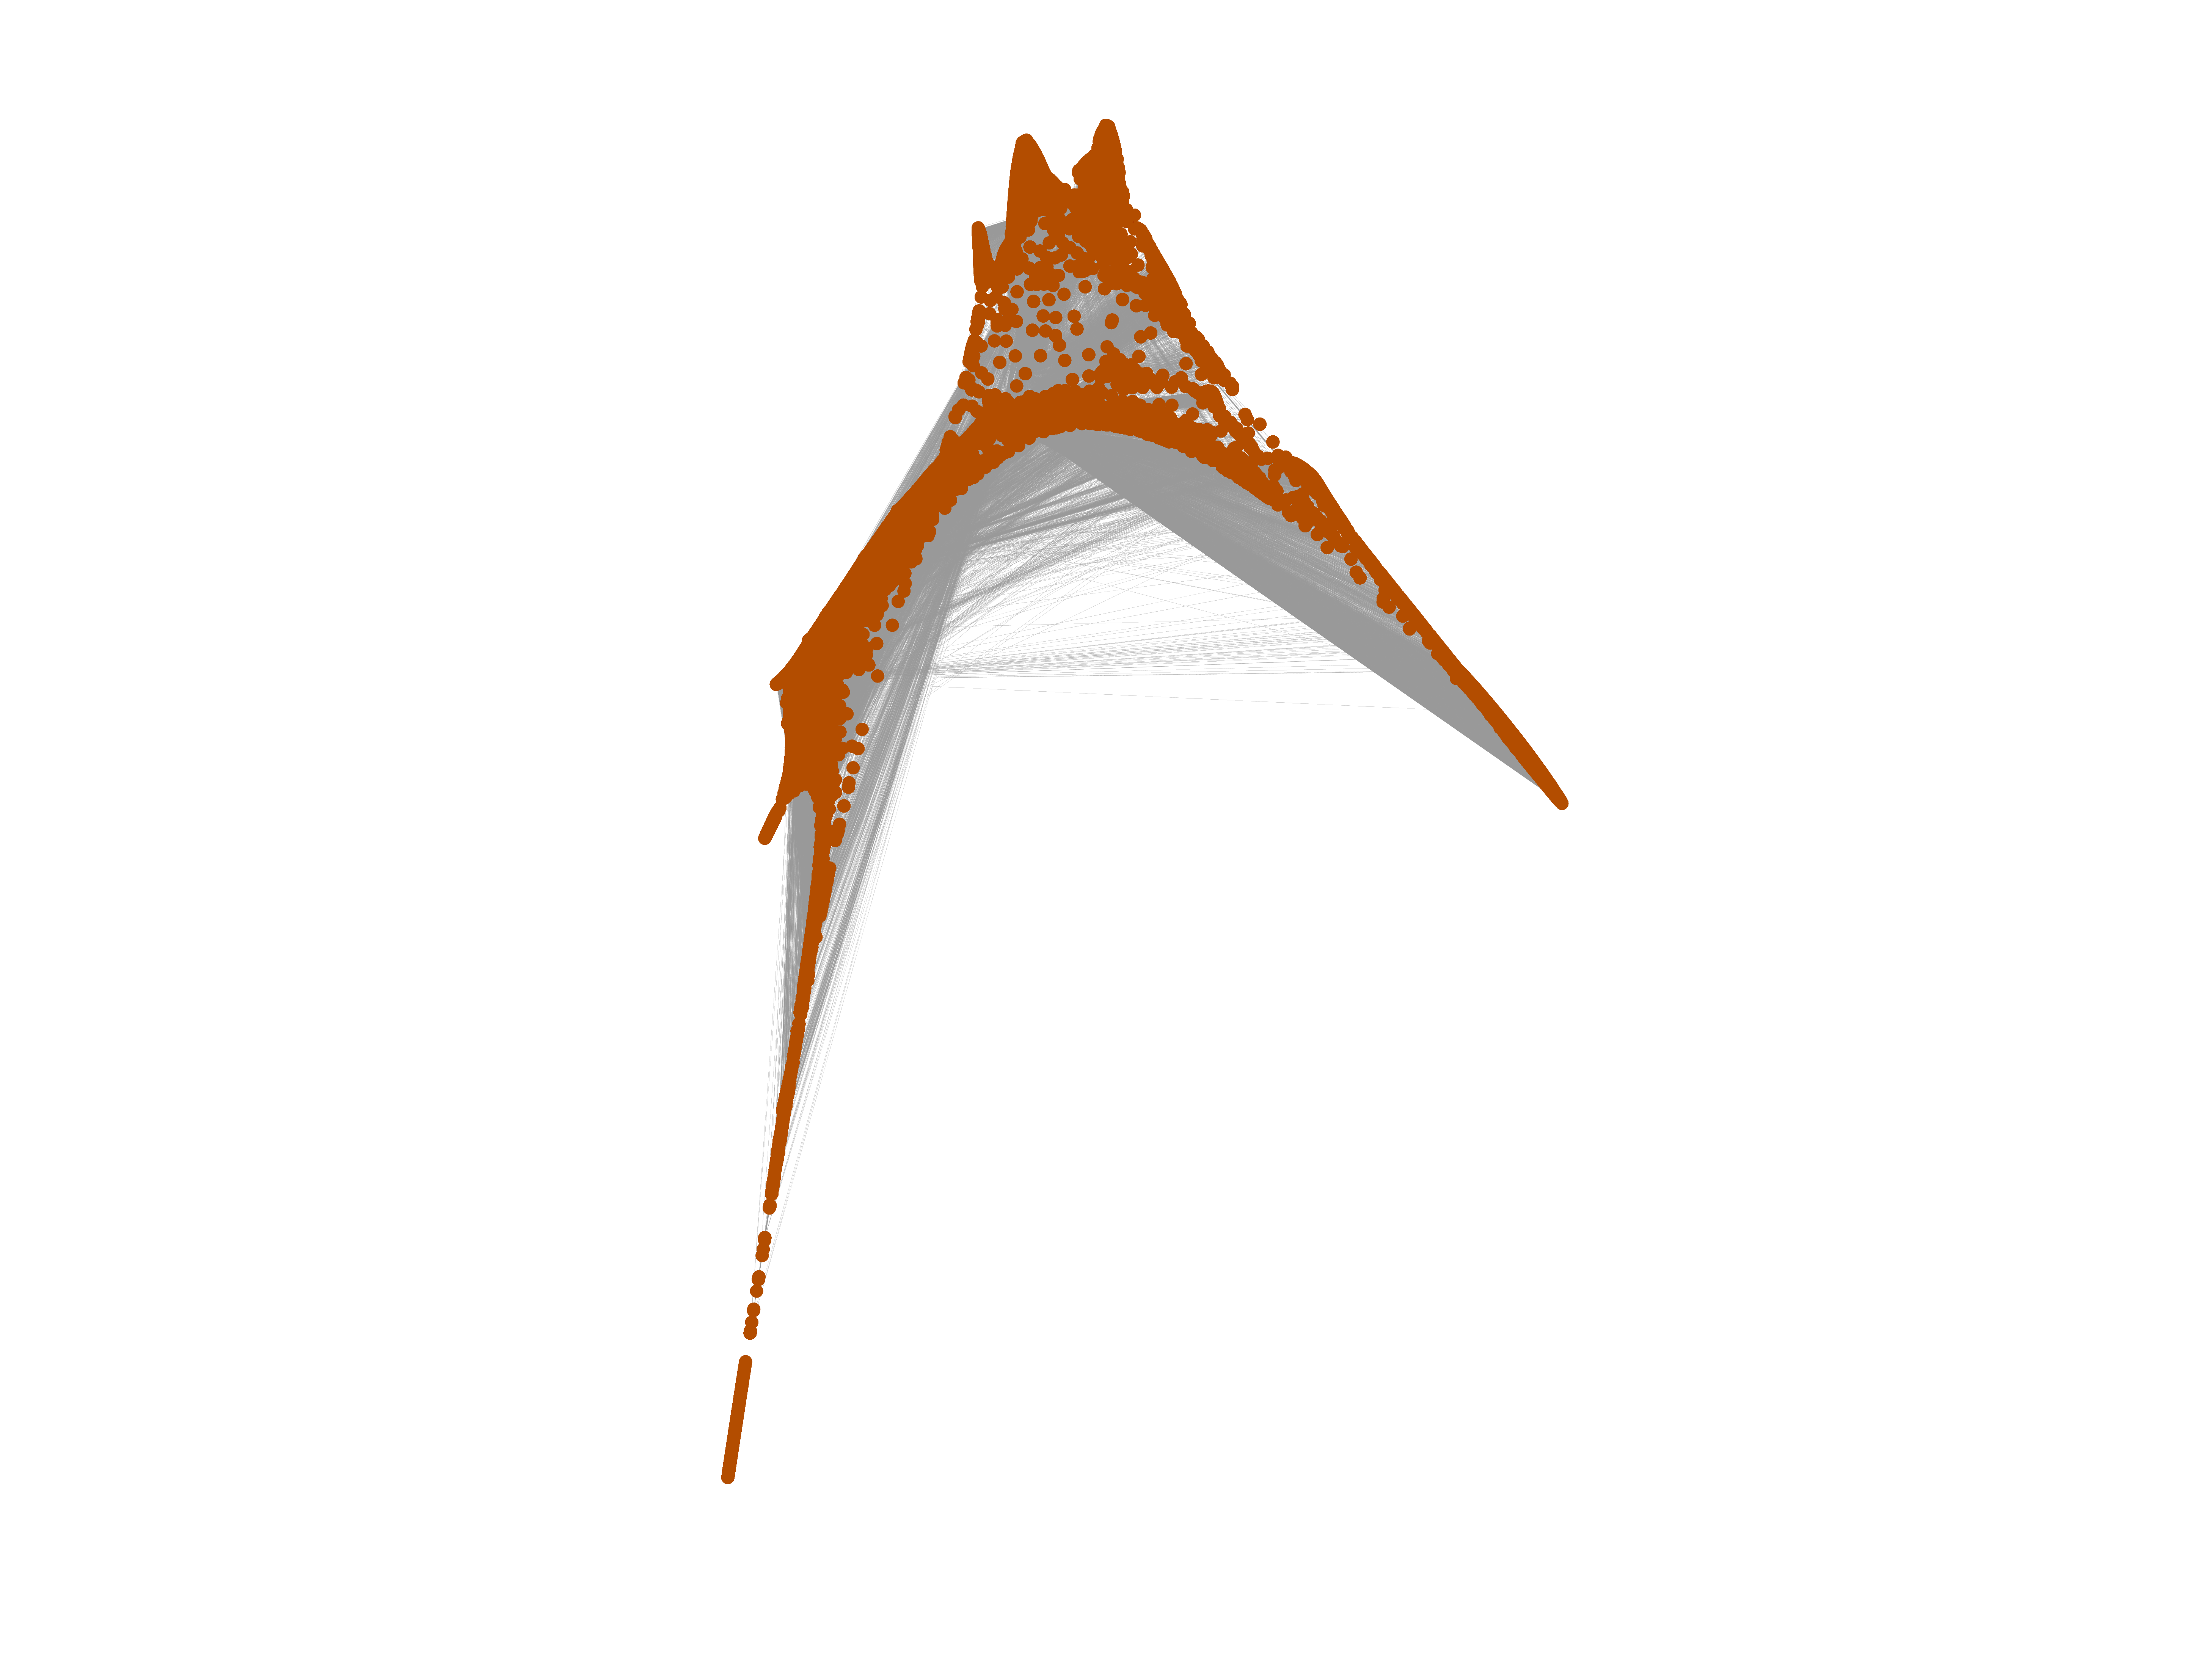
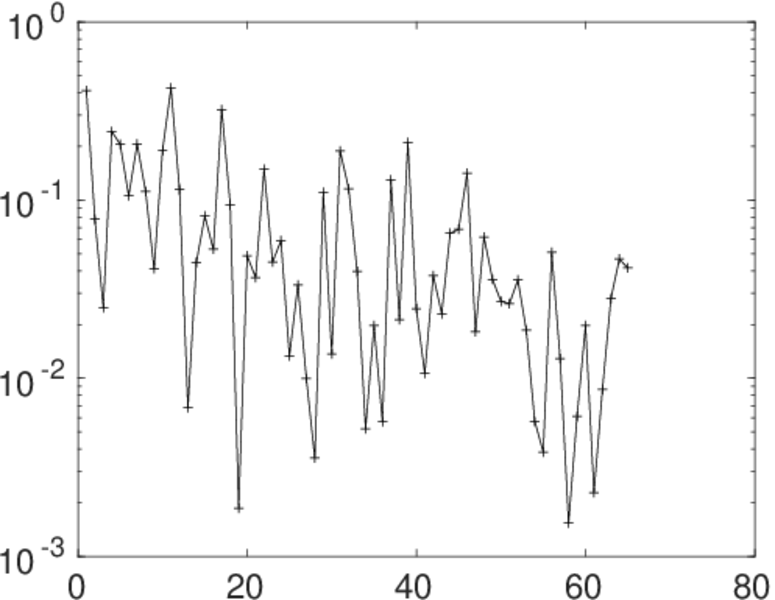
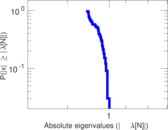
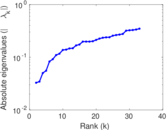
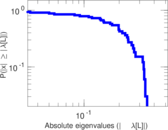
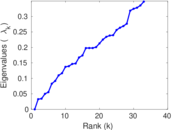
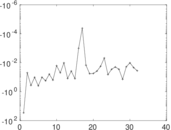
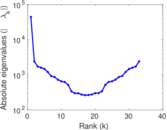
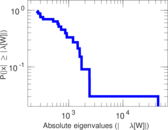
Plots


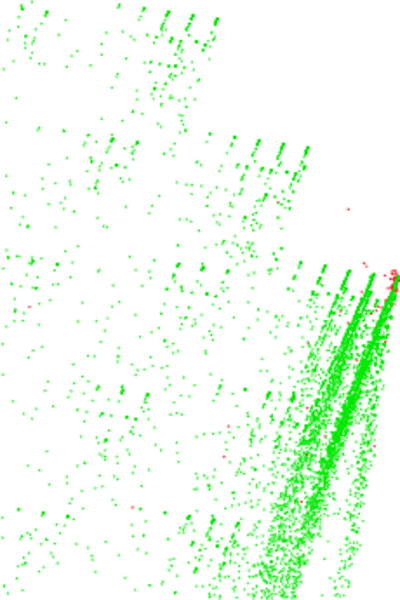
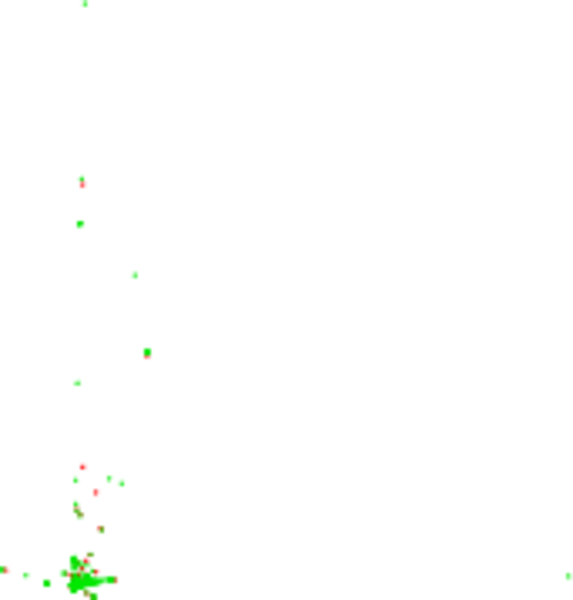
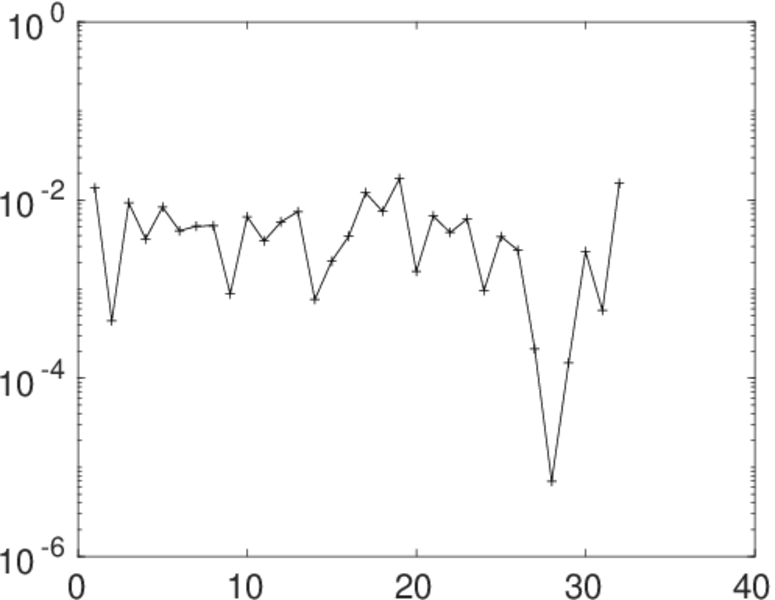
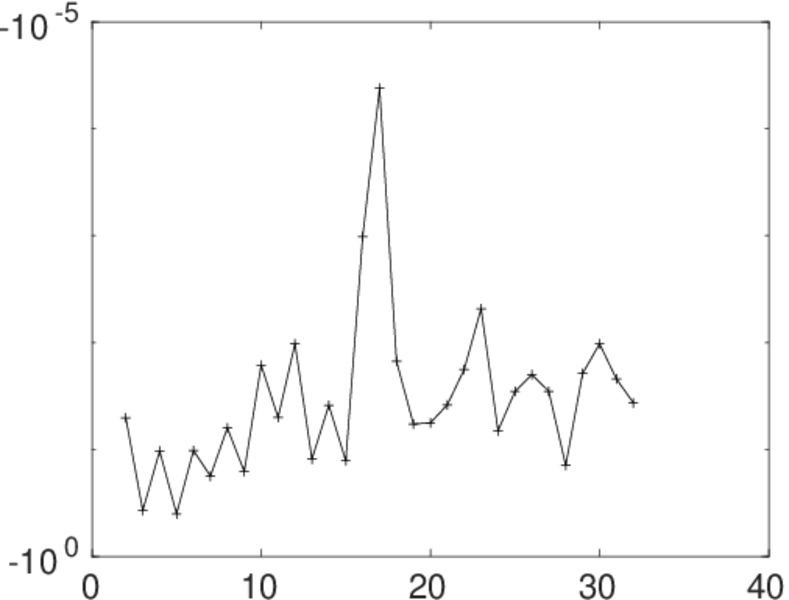
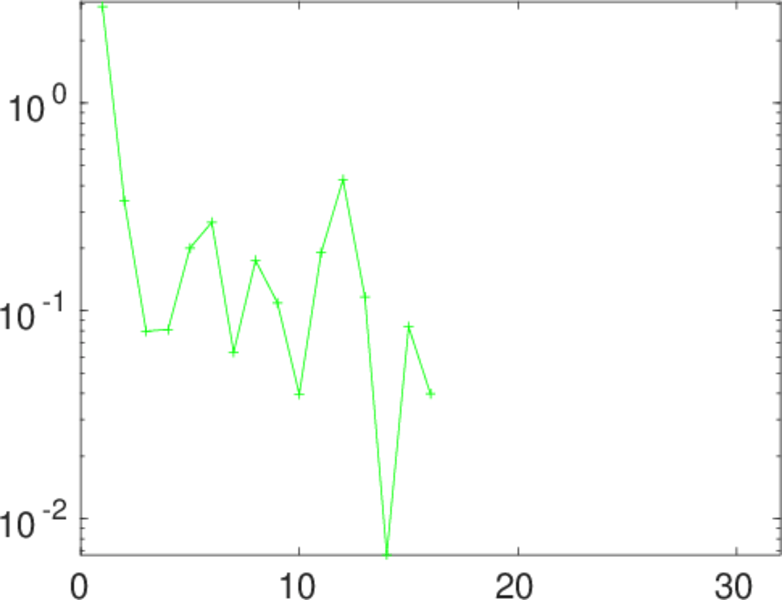
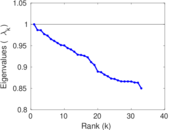
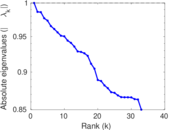
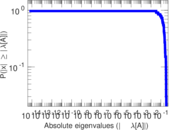
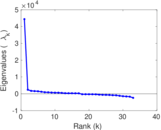
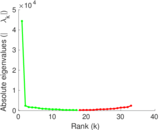
Matrix decompositions plots


Downloads
References
|
[1]
|
Jérôme Kunegis.
KONECT – The Koblenz Network Collection.
In Proc. Int. Conf. on World Wide Web Companion, pages
1343–1350, 2013.
[ http ]
|
|
[2]
|
Wikimedia Foundation.
Wikimedia downloads.
http://dumps.wikimedia.org/, January 2010.
|
 KONECT ‣ Networks ‣
Buy Me a Coffee
KONECT ‣ Networks ‣
Buy Me a Coffee