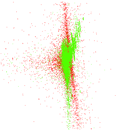
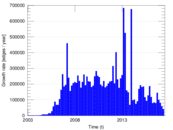
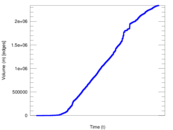
Wikipedia edits (bs)
This is the bipartite edit network of the Bosnian Wikipedia. It contains users
and pages from the Bosnian Wikipedia, connected by edit events. Each edge
represents an edit. The dataset includes the timestamp of each edit.
Metadata
Statistics
| Size | n = | 363,654
|
| Left size | n1 = | 9,994
|
| Right size | n2 = | 353,660
|
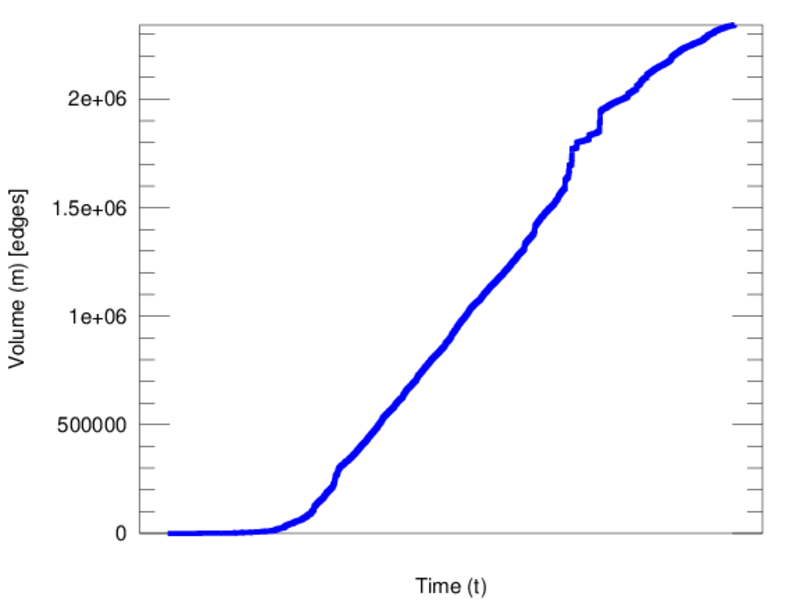
| Volume | m = | 2,341,558
|
| Unique edge count | m̿ = | 1,174,690
|
| Wedge count | s = | 28,787,944,341
|
| Claw count | z = | 1,483,115,085,429,858
|
| Cross count | x = | 7.243 61 × 1019
|
| Square count | q = | 19,923,342,385
|
| 4-Tour count | T4 = | 274,543,242,304
|
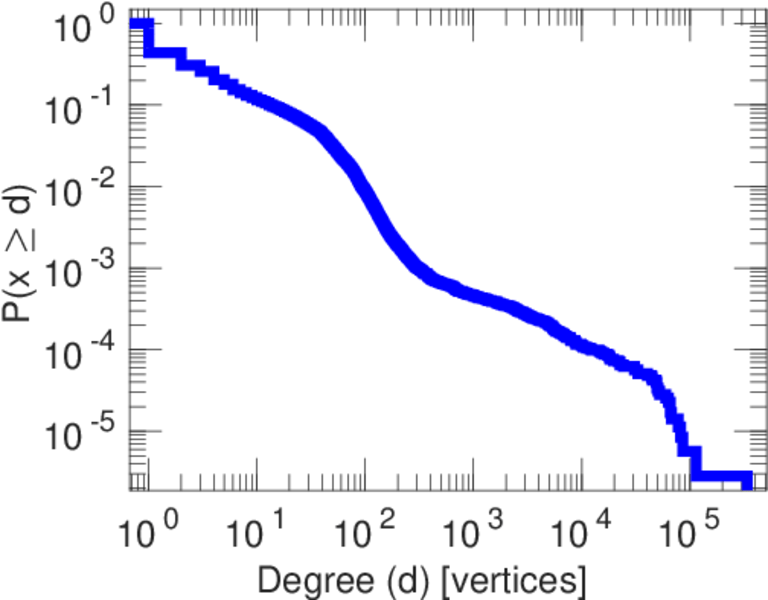
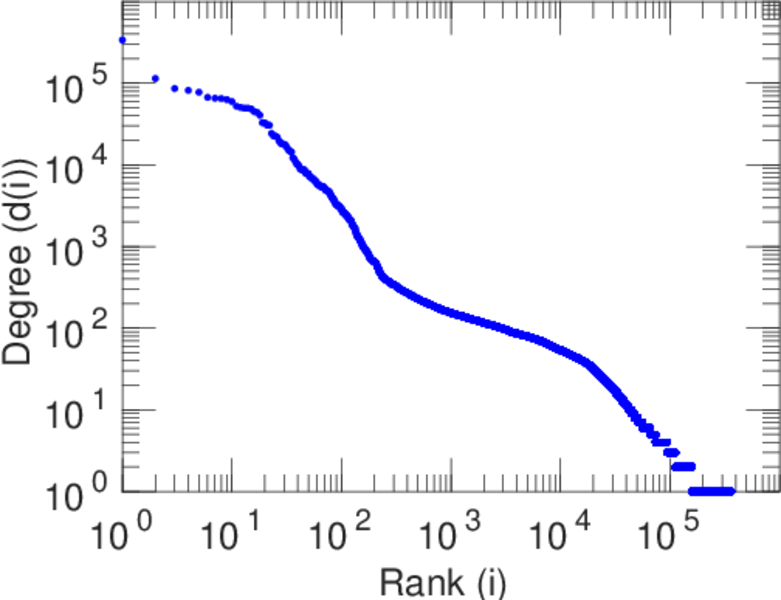
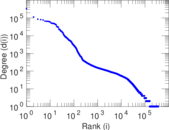
| Maximum degree | dmax = | 338,397
|
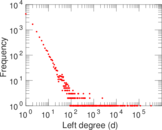
| Maximum left degree | d1max = | 338,397
|
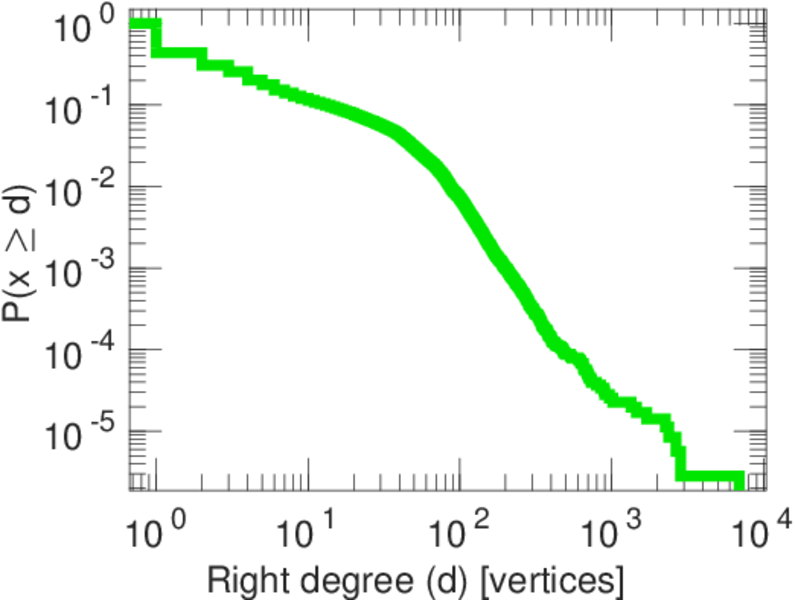
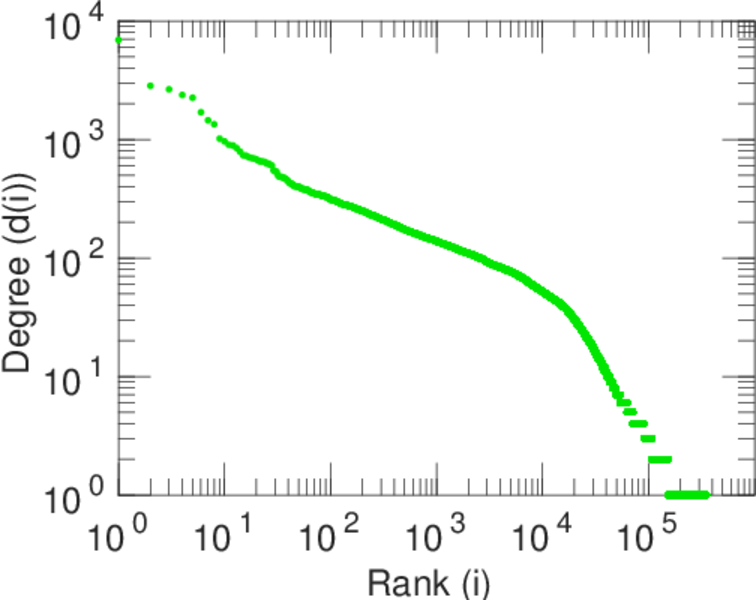
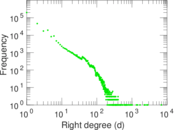
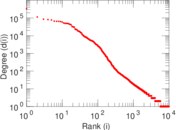
| Maximum right degree | d2max = | 6,924
|
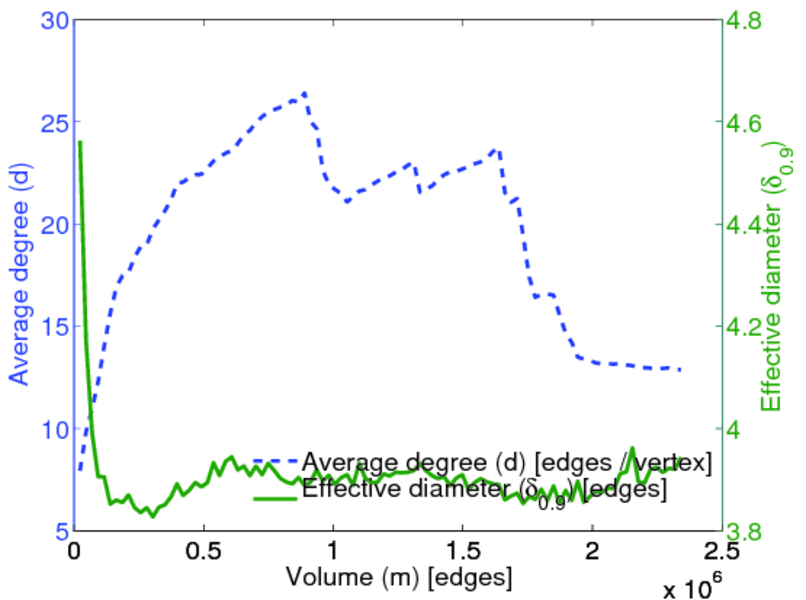
| Average degree | d = | 12.877 9
|
| Average left degree | d1 = | 234.296
|
| Average right degree | d2 = | 6.620 93
|
| Fill | p = | 0.000 332 352
|
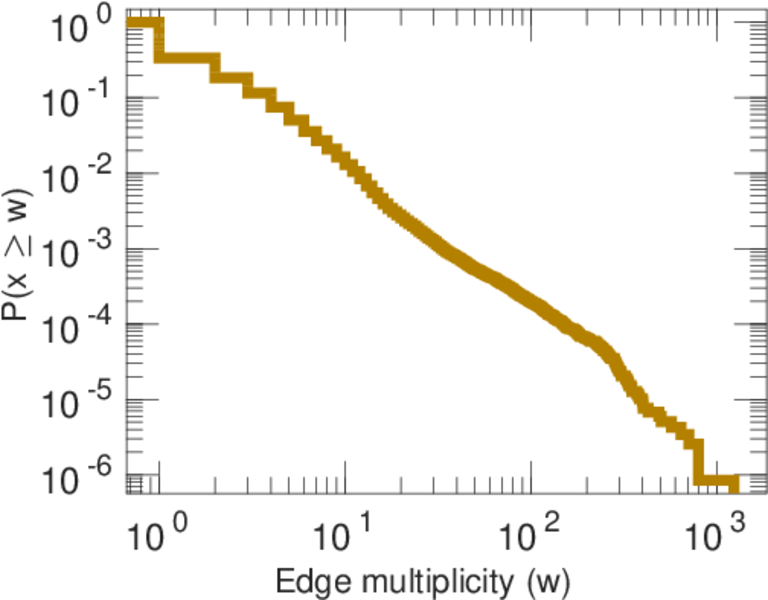
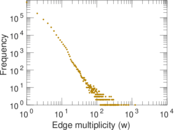
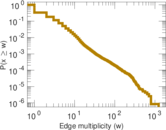
| Average edge multiplicity | m̃ = | 1.993 34
|
| Size of LCC | N = | 362,135
|
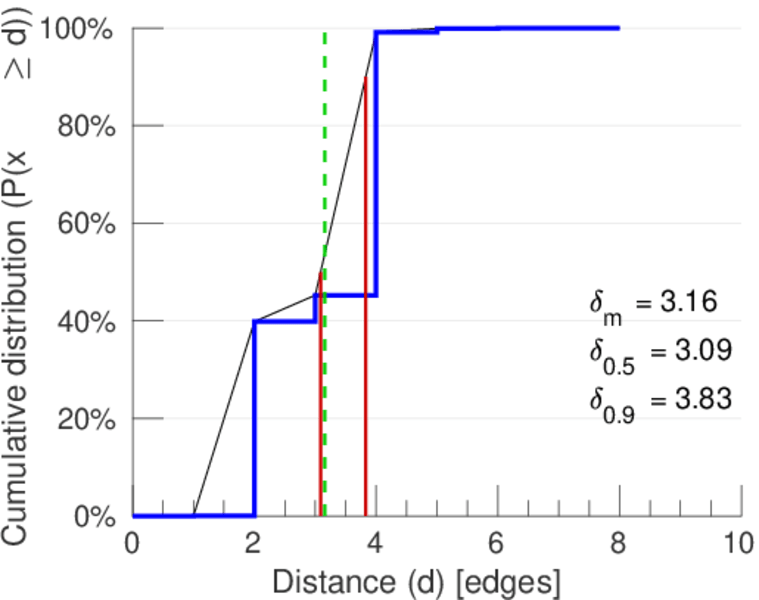
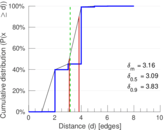
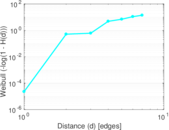
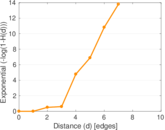
| Diameter | δ = | 10
|
| 50-Percentile effective diameter | δ0.5 = | 3.088 37
|
| 90-Percentile effective diameter | δ0.9 = | 3.830 13
|
| Median distance | δM = | 4
|
| Mean distance | δm = | 3.158 77
|
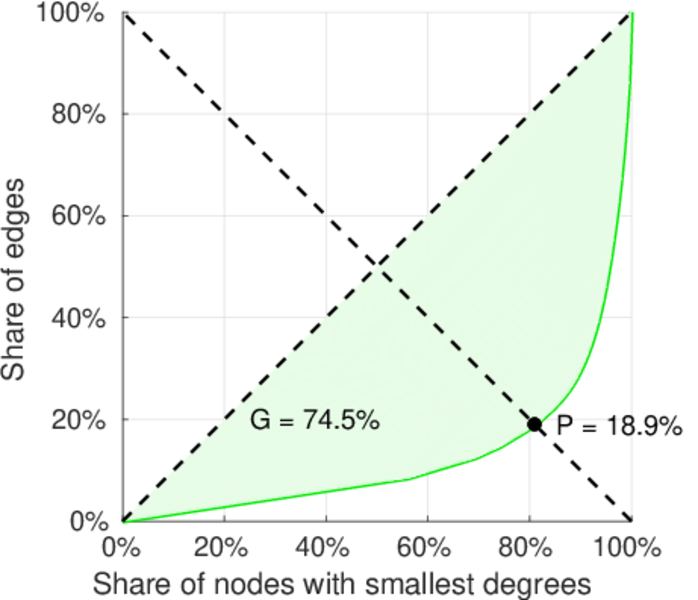
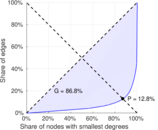
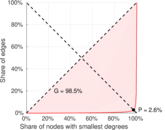
| Gini coefficient | G = | 0.871 313
|
| Balanced inequality ratio | P = | 0.124 250
|
| Left balanced inequality ratio | P1 = | 0.025 691 0
|
| Right balanced inequality ratio | P2 = | 0.188 876
|
| Relative edge distribution entropy | Her = | 0.690 872
|
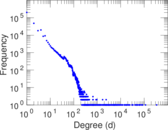
| Tail power law exponent | γt = | 2.051 00
|
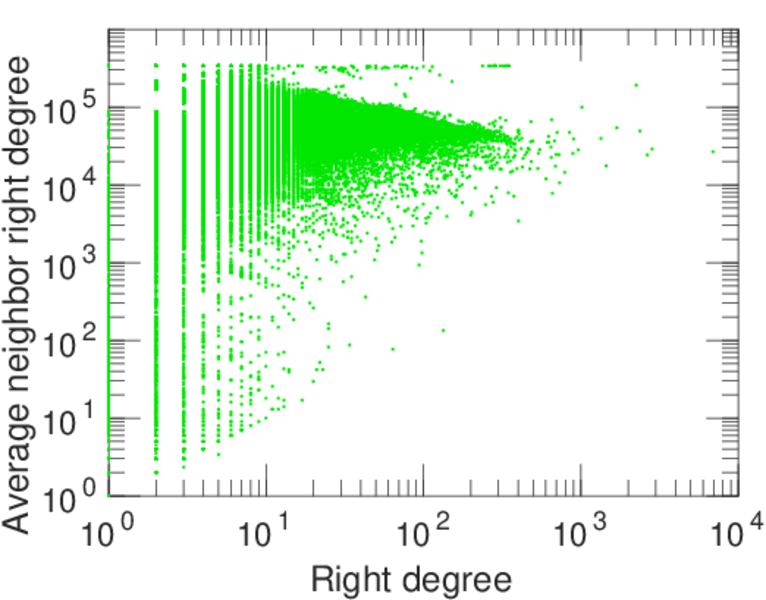
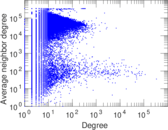
| Degree assortativity | ρ = | −0.328 969
|
| Degree assortativity p-value | pρ = | 0.000 00
|
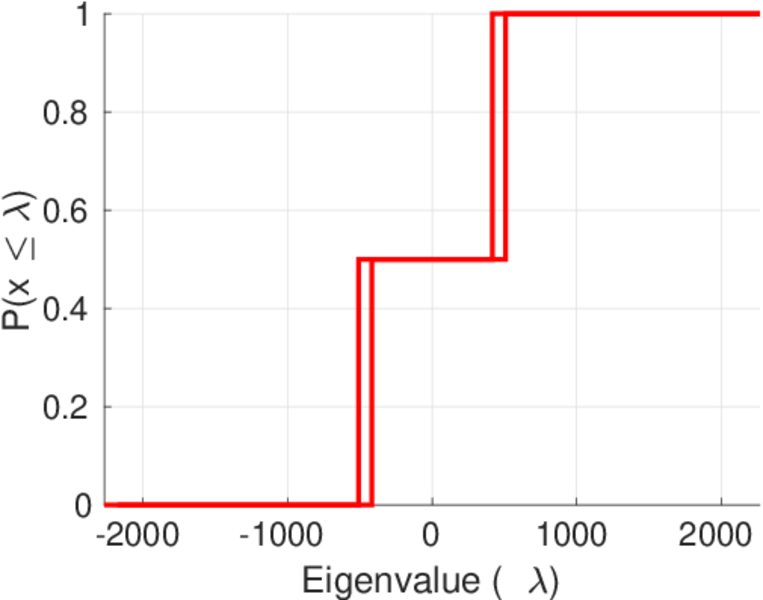
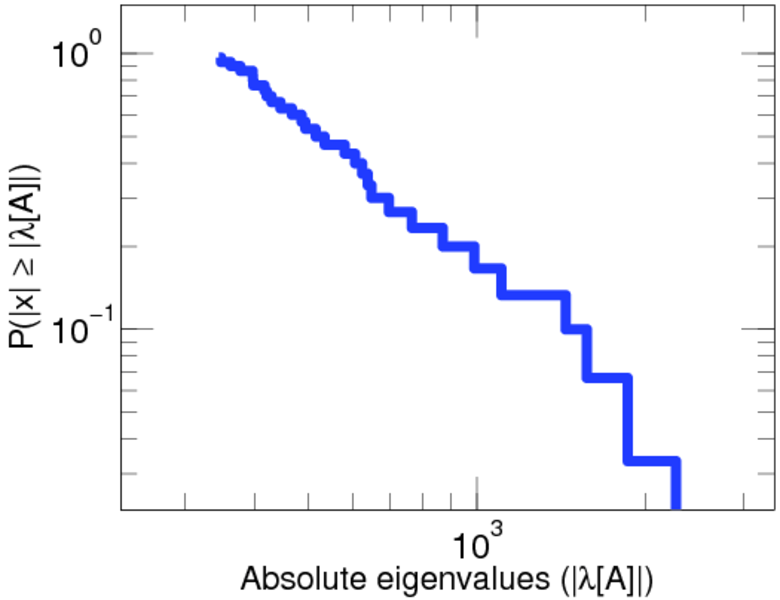
| Spectral norm | α = | 2,268.22
|
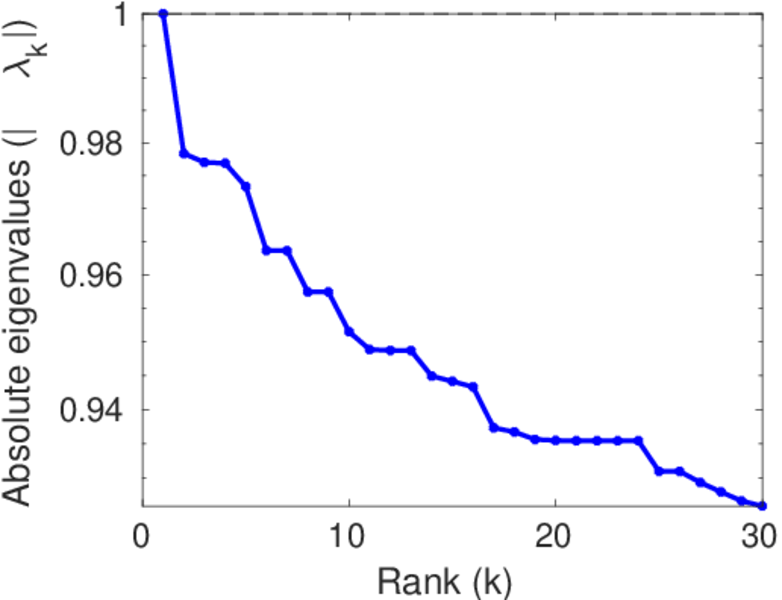
| Spectral separation | |λ1[A] / λ2[A]| = | 1.219 87
|
| Controllability | C = | 346,422
|
| Relative controllability | Cr = | 0.953 099
|
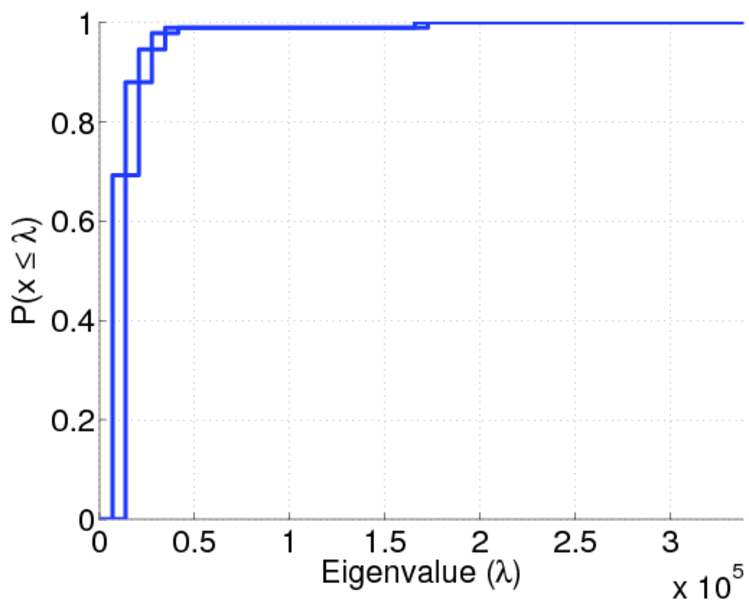
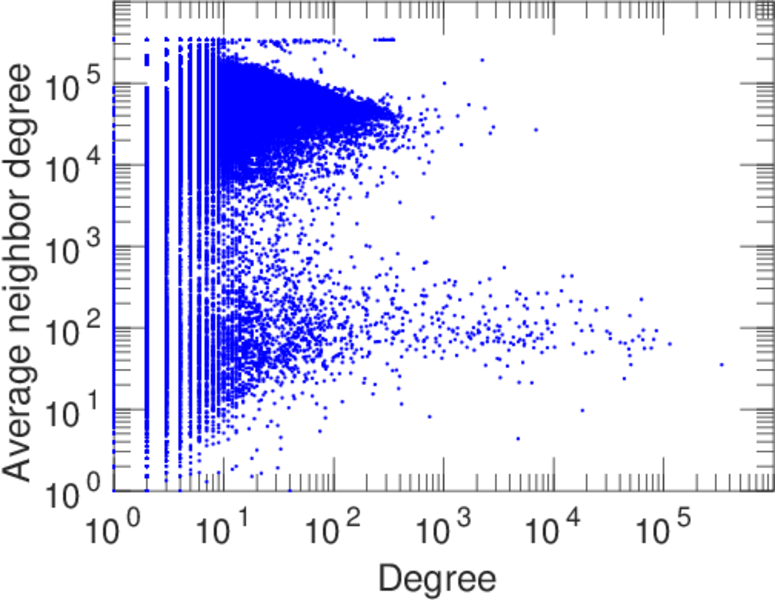
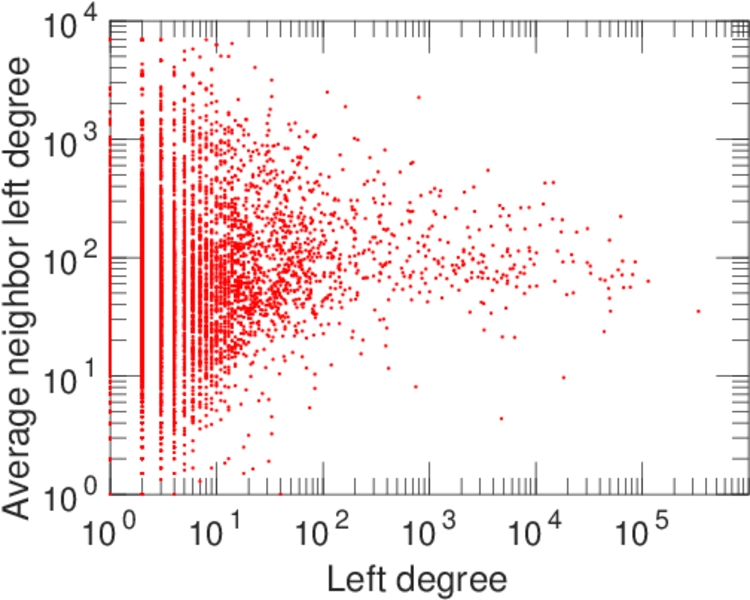
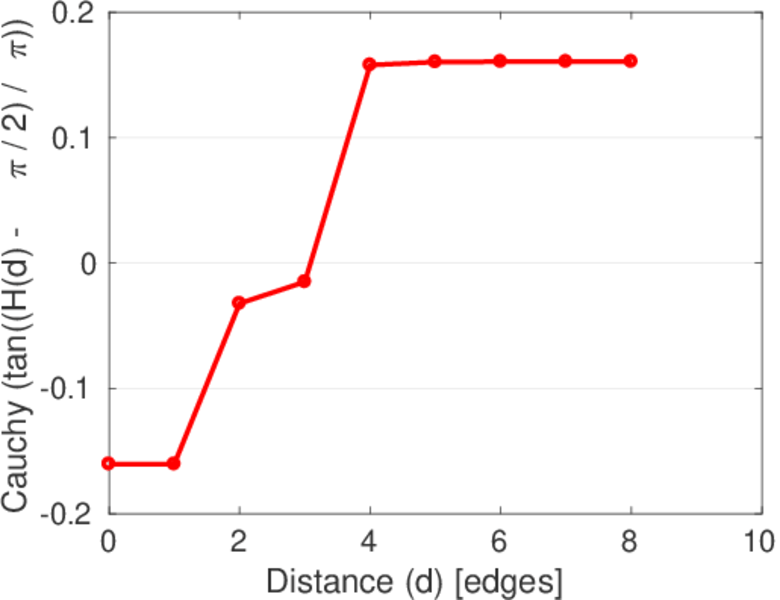
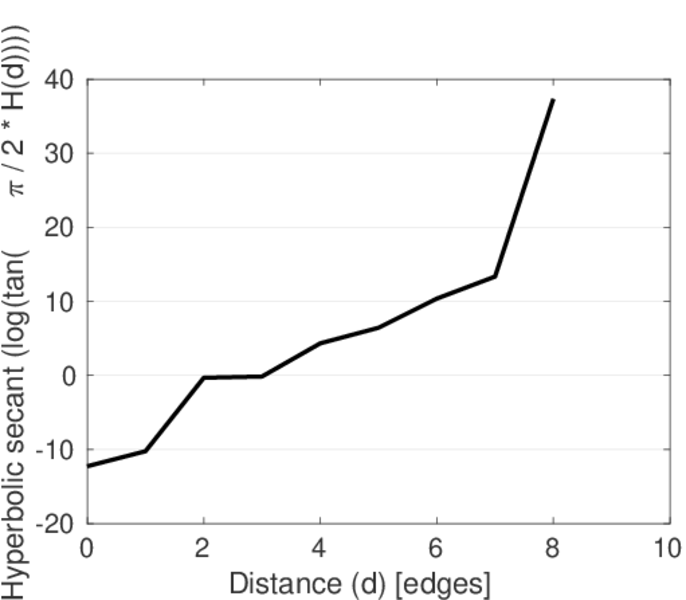
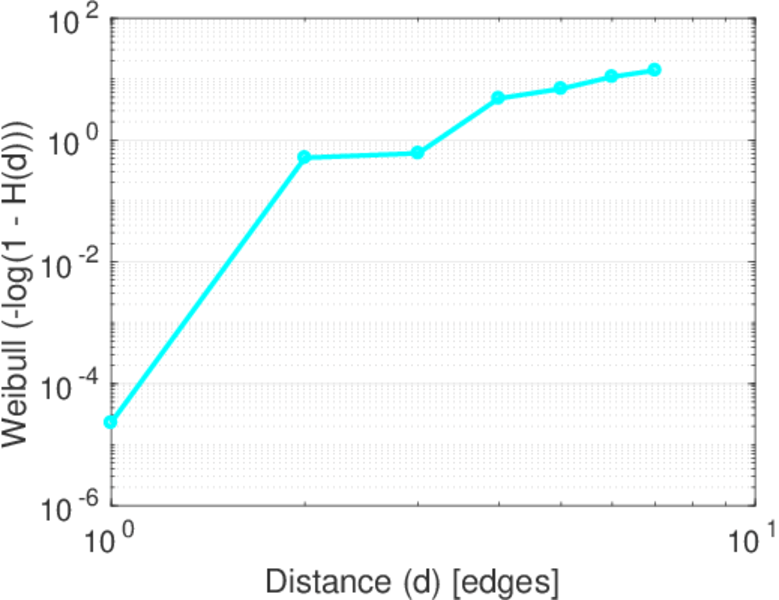
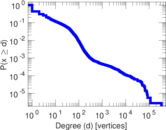
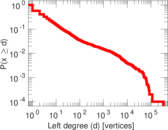
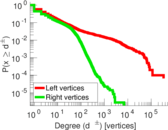
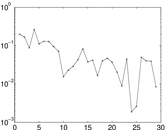
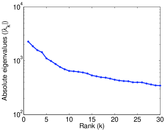
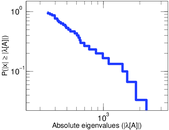
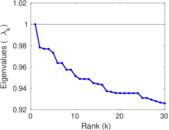
Plots


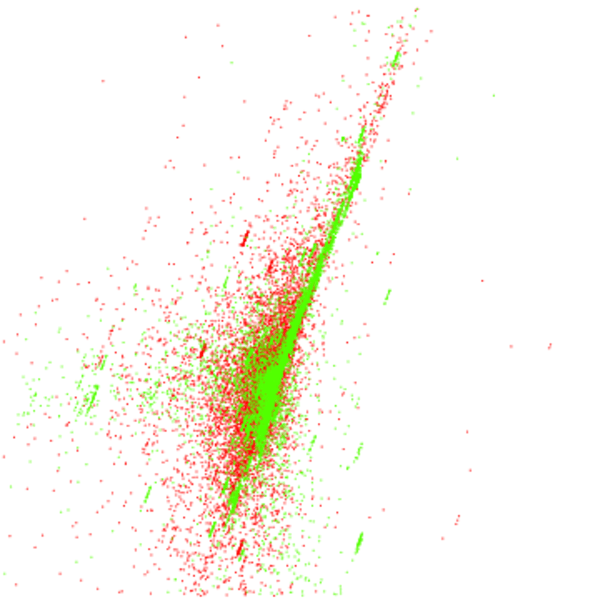
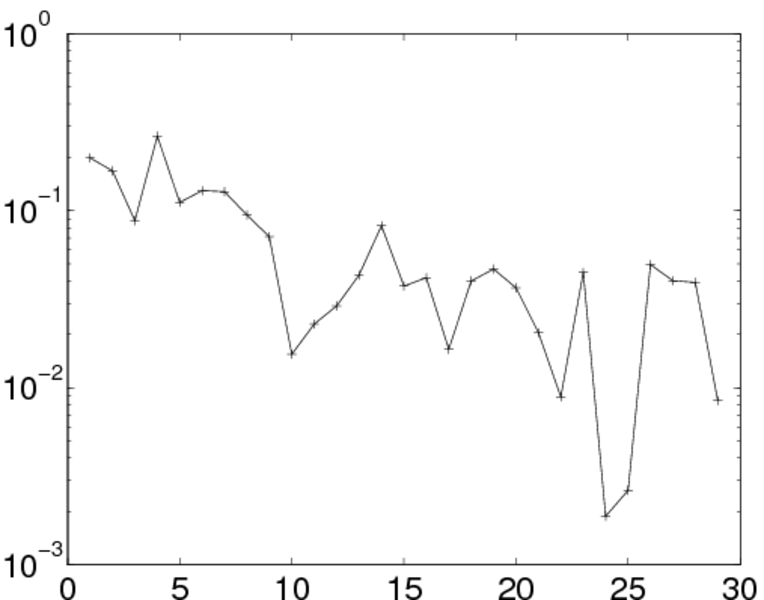
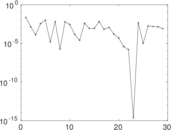
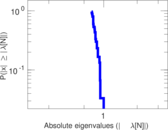
Matrix decompositions plots

Downloads
References
|
[1]
|
Jérôme Kunegis.
KONECT – The Koblenz Network Collection.
In Proc. Int. Conf. on World Wide Web Companion, pages
1343–1350, 2013.
[ http ]
|
|
[2]
|
Wikimedia Foundation.
Wikimedia downloads.
http://dumps.wikimedia.org/, January 2010.
|
 KONECT ‣ Networks ‣
Buy Me a Coffee
KONECT ‣ Networks ‣
Buy Me a Coffee