Wikipedia edits (bug)
This is the bipartite edit network of the Buginese Wikipedia. It contains users
and pages from the Buginese Wikipedia, connected by edit events. Each edge
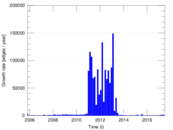
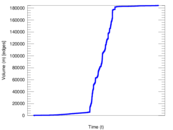
represents an edit. The dataset includes the timestamp of each edit.
Metadata
Statistics
| Size | n = | 19,261
|
| Left size | n1 = | 746
|
| Right size | n2 = | 18,515
|
| Volume | m = | 184,412
|
| Unique edge count | m̿ = | 125,106
|
| Wedge count | s = | 395,448,362
|
| Claw count | z = | 1,211,587,949,425
|
| Cross count | x = | 3,240,312,031,028,652
|
| Square count | q = | 711,164,526
|
| 4-Tour count | T4 = | 7,271,382,544
|
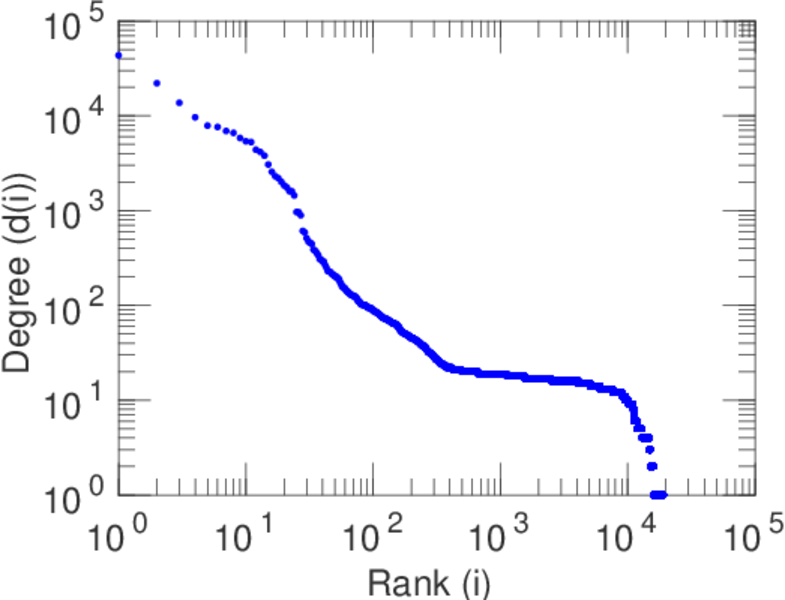
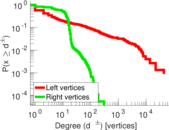
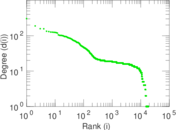
| Maximum degree | dmax = | 43,459
|
| Maximum left degree | d1max = | 43,459
|
| Maximum right degree | d2max = | 304
|
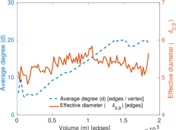
| Average degree | d = | 19.148 7
|
| Average left degree | d1 = | 247.201
|
| Average right degree | d2 = | 9.960 14
|
| Fill | p = | 0.009 057 65
|
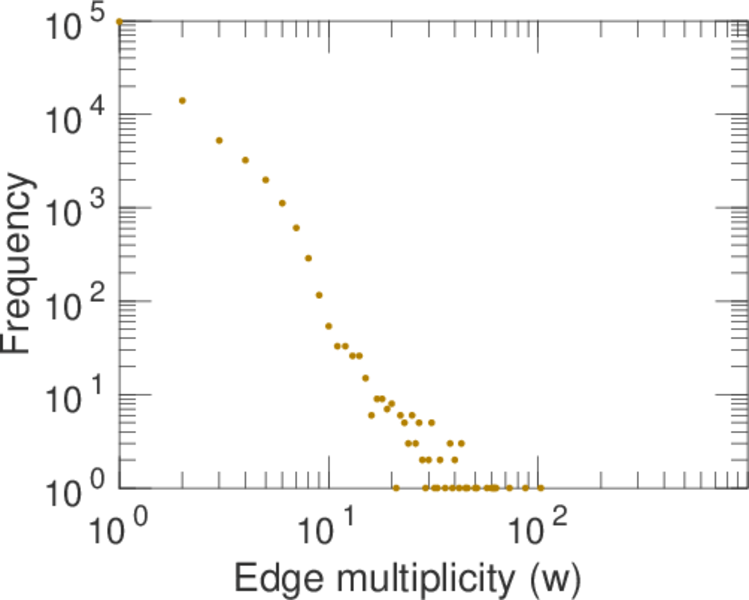
| Average edge multiplicity | m̃ = | 1.474 05
|
| Size of LCC | N = | 18,524
|
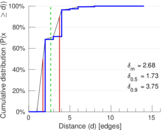
| Diameter | δ = | 15
|
| 50-Percentile effective diameter | δ0.5 = | 1.730 11
|
| 90-Percentile effective diameter | δ0.9 = | 3.746 45
|
| Median distance | δM = | 2
|
| Mean distance | δm = | 2.679 58
|
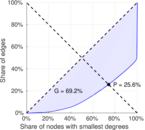
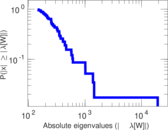
| Gini coefficient | G = | 0.684 155
|
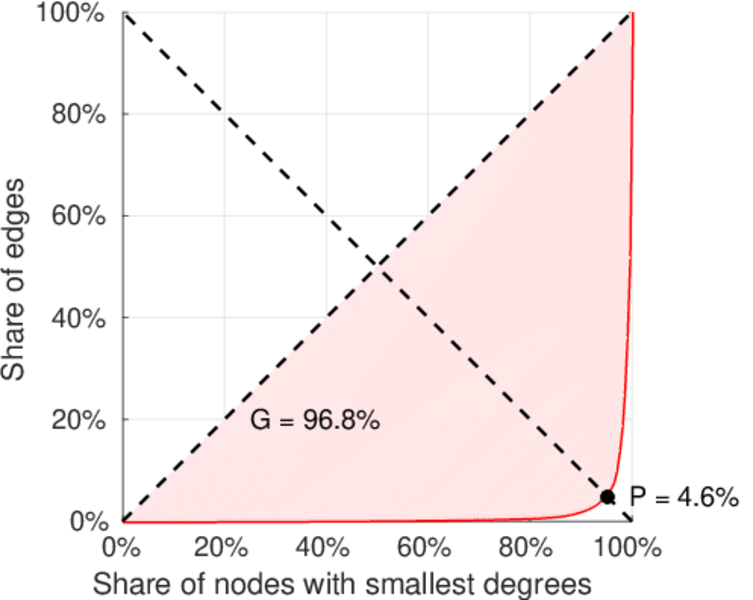
| Balanced inequality ratio | P = | 0.262 014
|
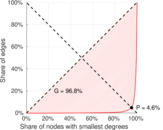
| Left balanced inequality ratio | P1 = | 0.046 293 1
|
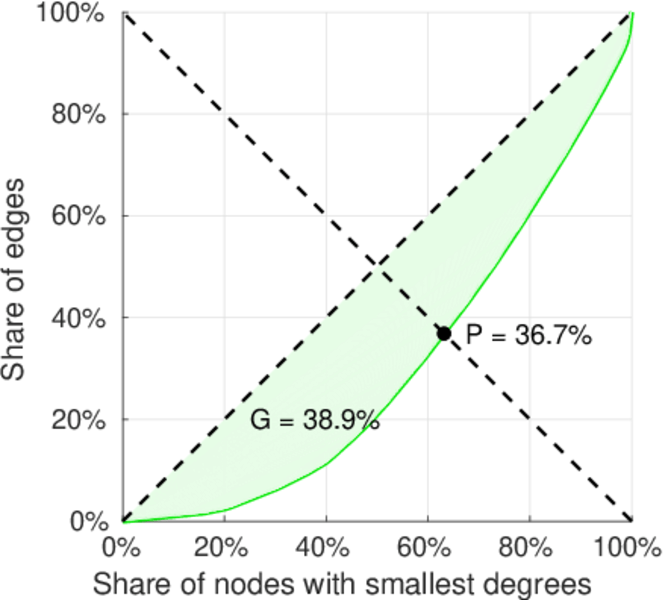
| Right balanced inequality ratio | P2 = | 0.367 059
|
| Relative edge distribution entropy | Her = | 0.733 442
|
| Power law exponent | γ = | 1.620 27
|
| Tail power law exponent | γt = | 1.511 00
|
| Tail power law exponent with p | γ3 = | 1.511 00
|
| p-value | p = | 0.095 000 0
|
| Left tail power law exponent with p | γ3,1 = | 1.401 00
|
| Left p-value | p1 = | 0.010 000 0
|
| Right tail power law exponent with p | γ3,2 = | 6.391 00
|
| Right p-value | p2 = | 0.941 000
|
| Degree assortativity | ρ = | −0.132 132
|
| Degree assortativity p-value | pρ = | 0.000 00
|
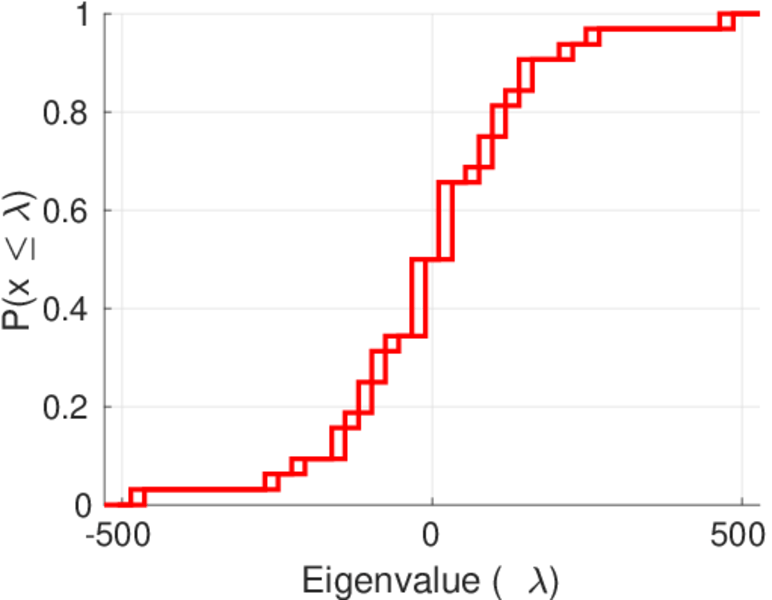
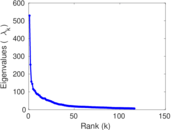
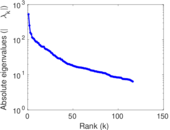
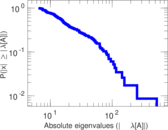
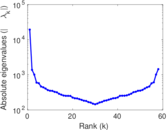
| Spectral norm | α = | 529.071
|
| Algebraic connectivity | a = | 0.004 209 22
|
| Spectral separation | |λ1[A] / λ2[A]| = | 2.089 88
|
| Controllability | C = | 17,754
|
| Relative controllability | Cr = | 0.927 586
|
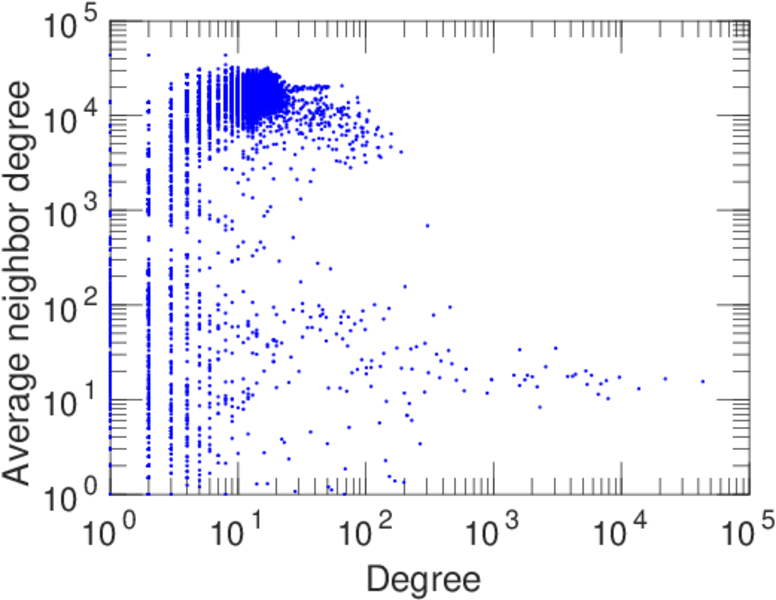
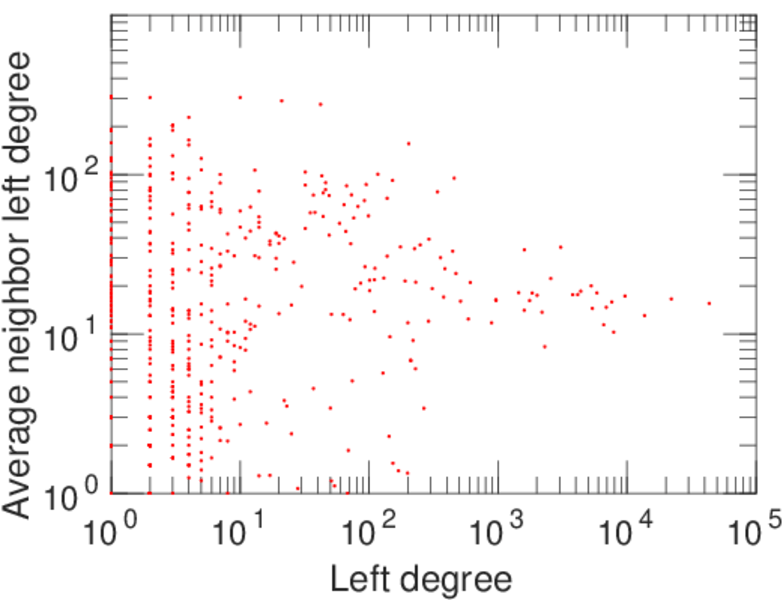
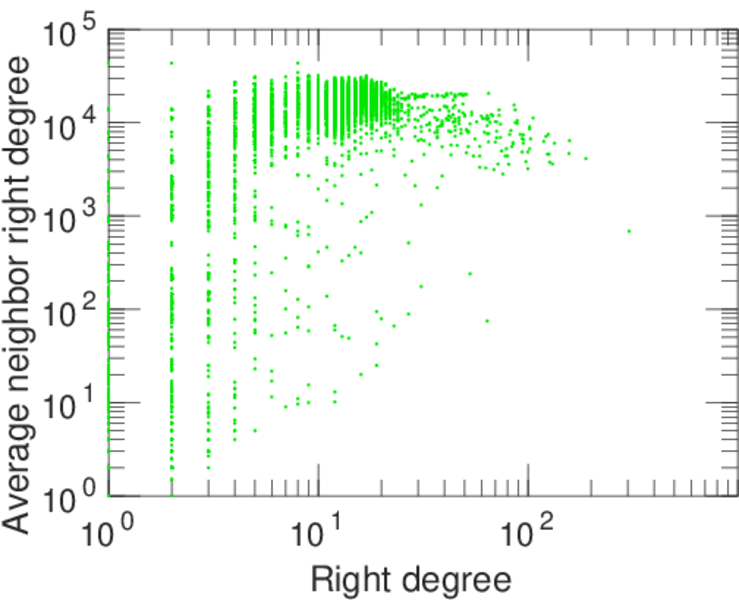
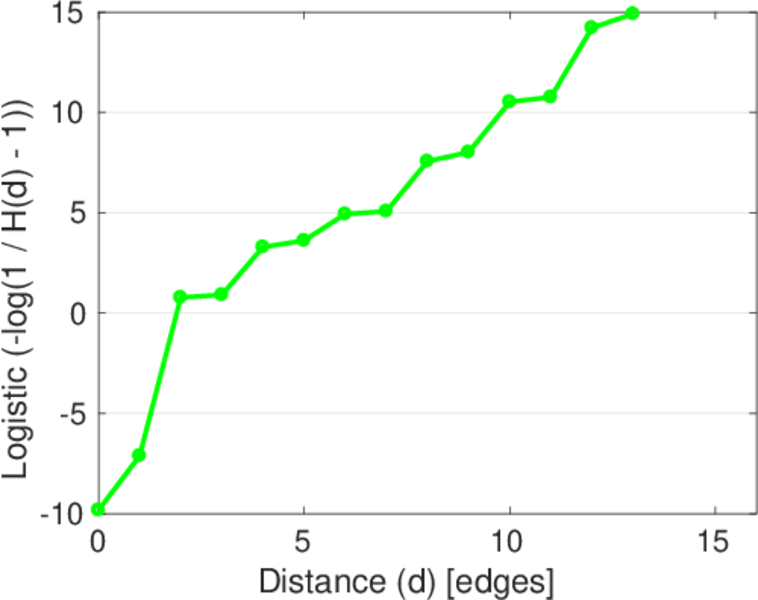
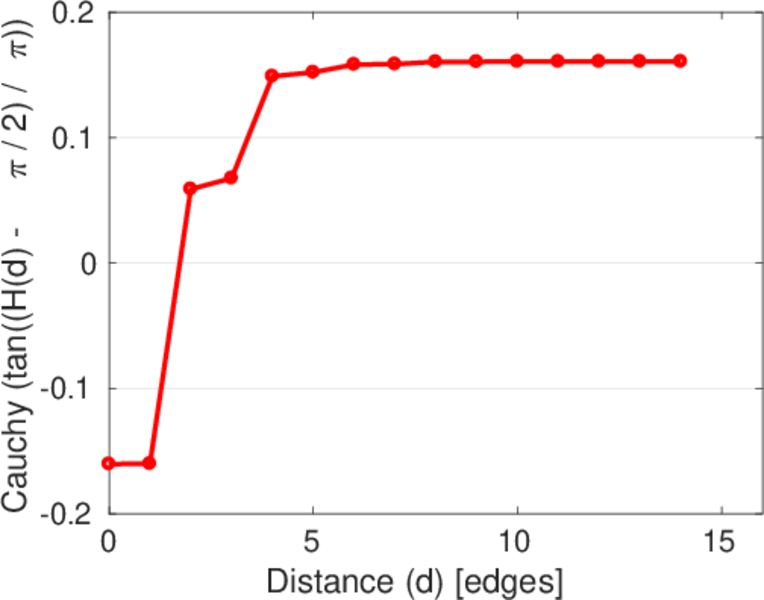
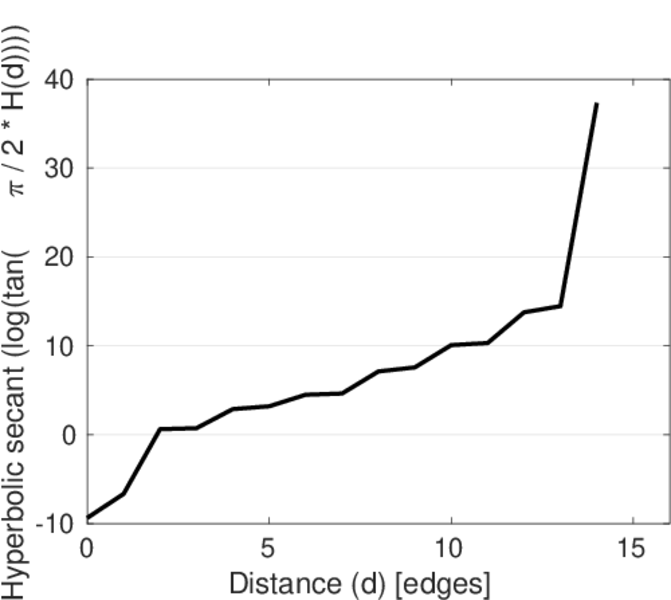
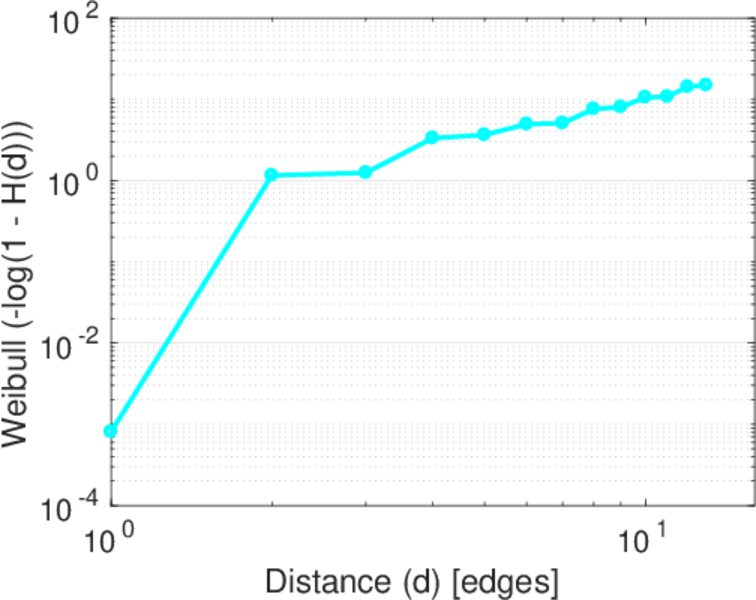
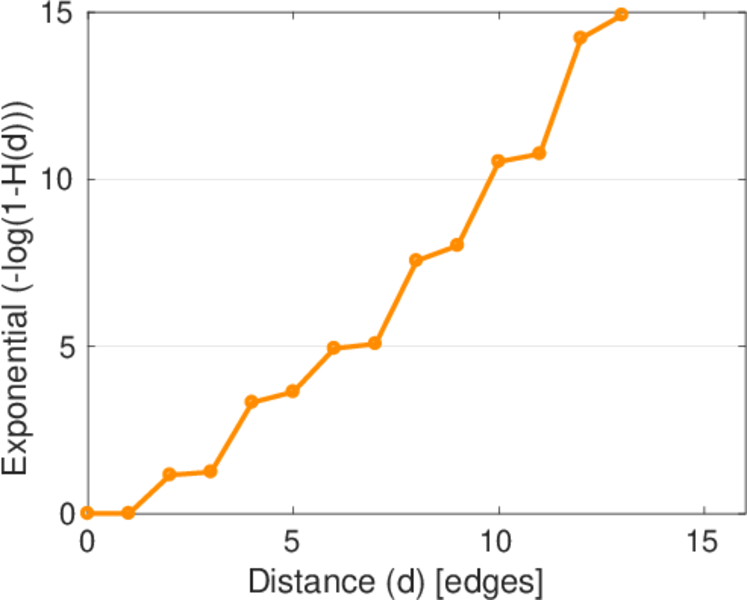
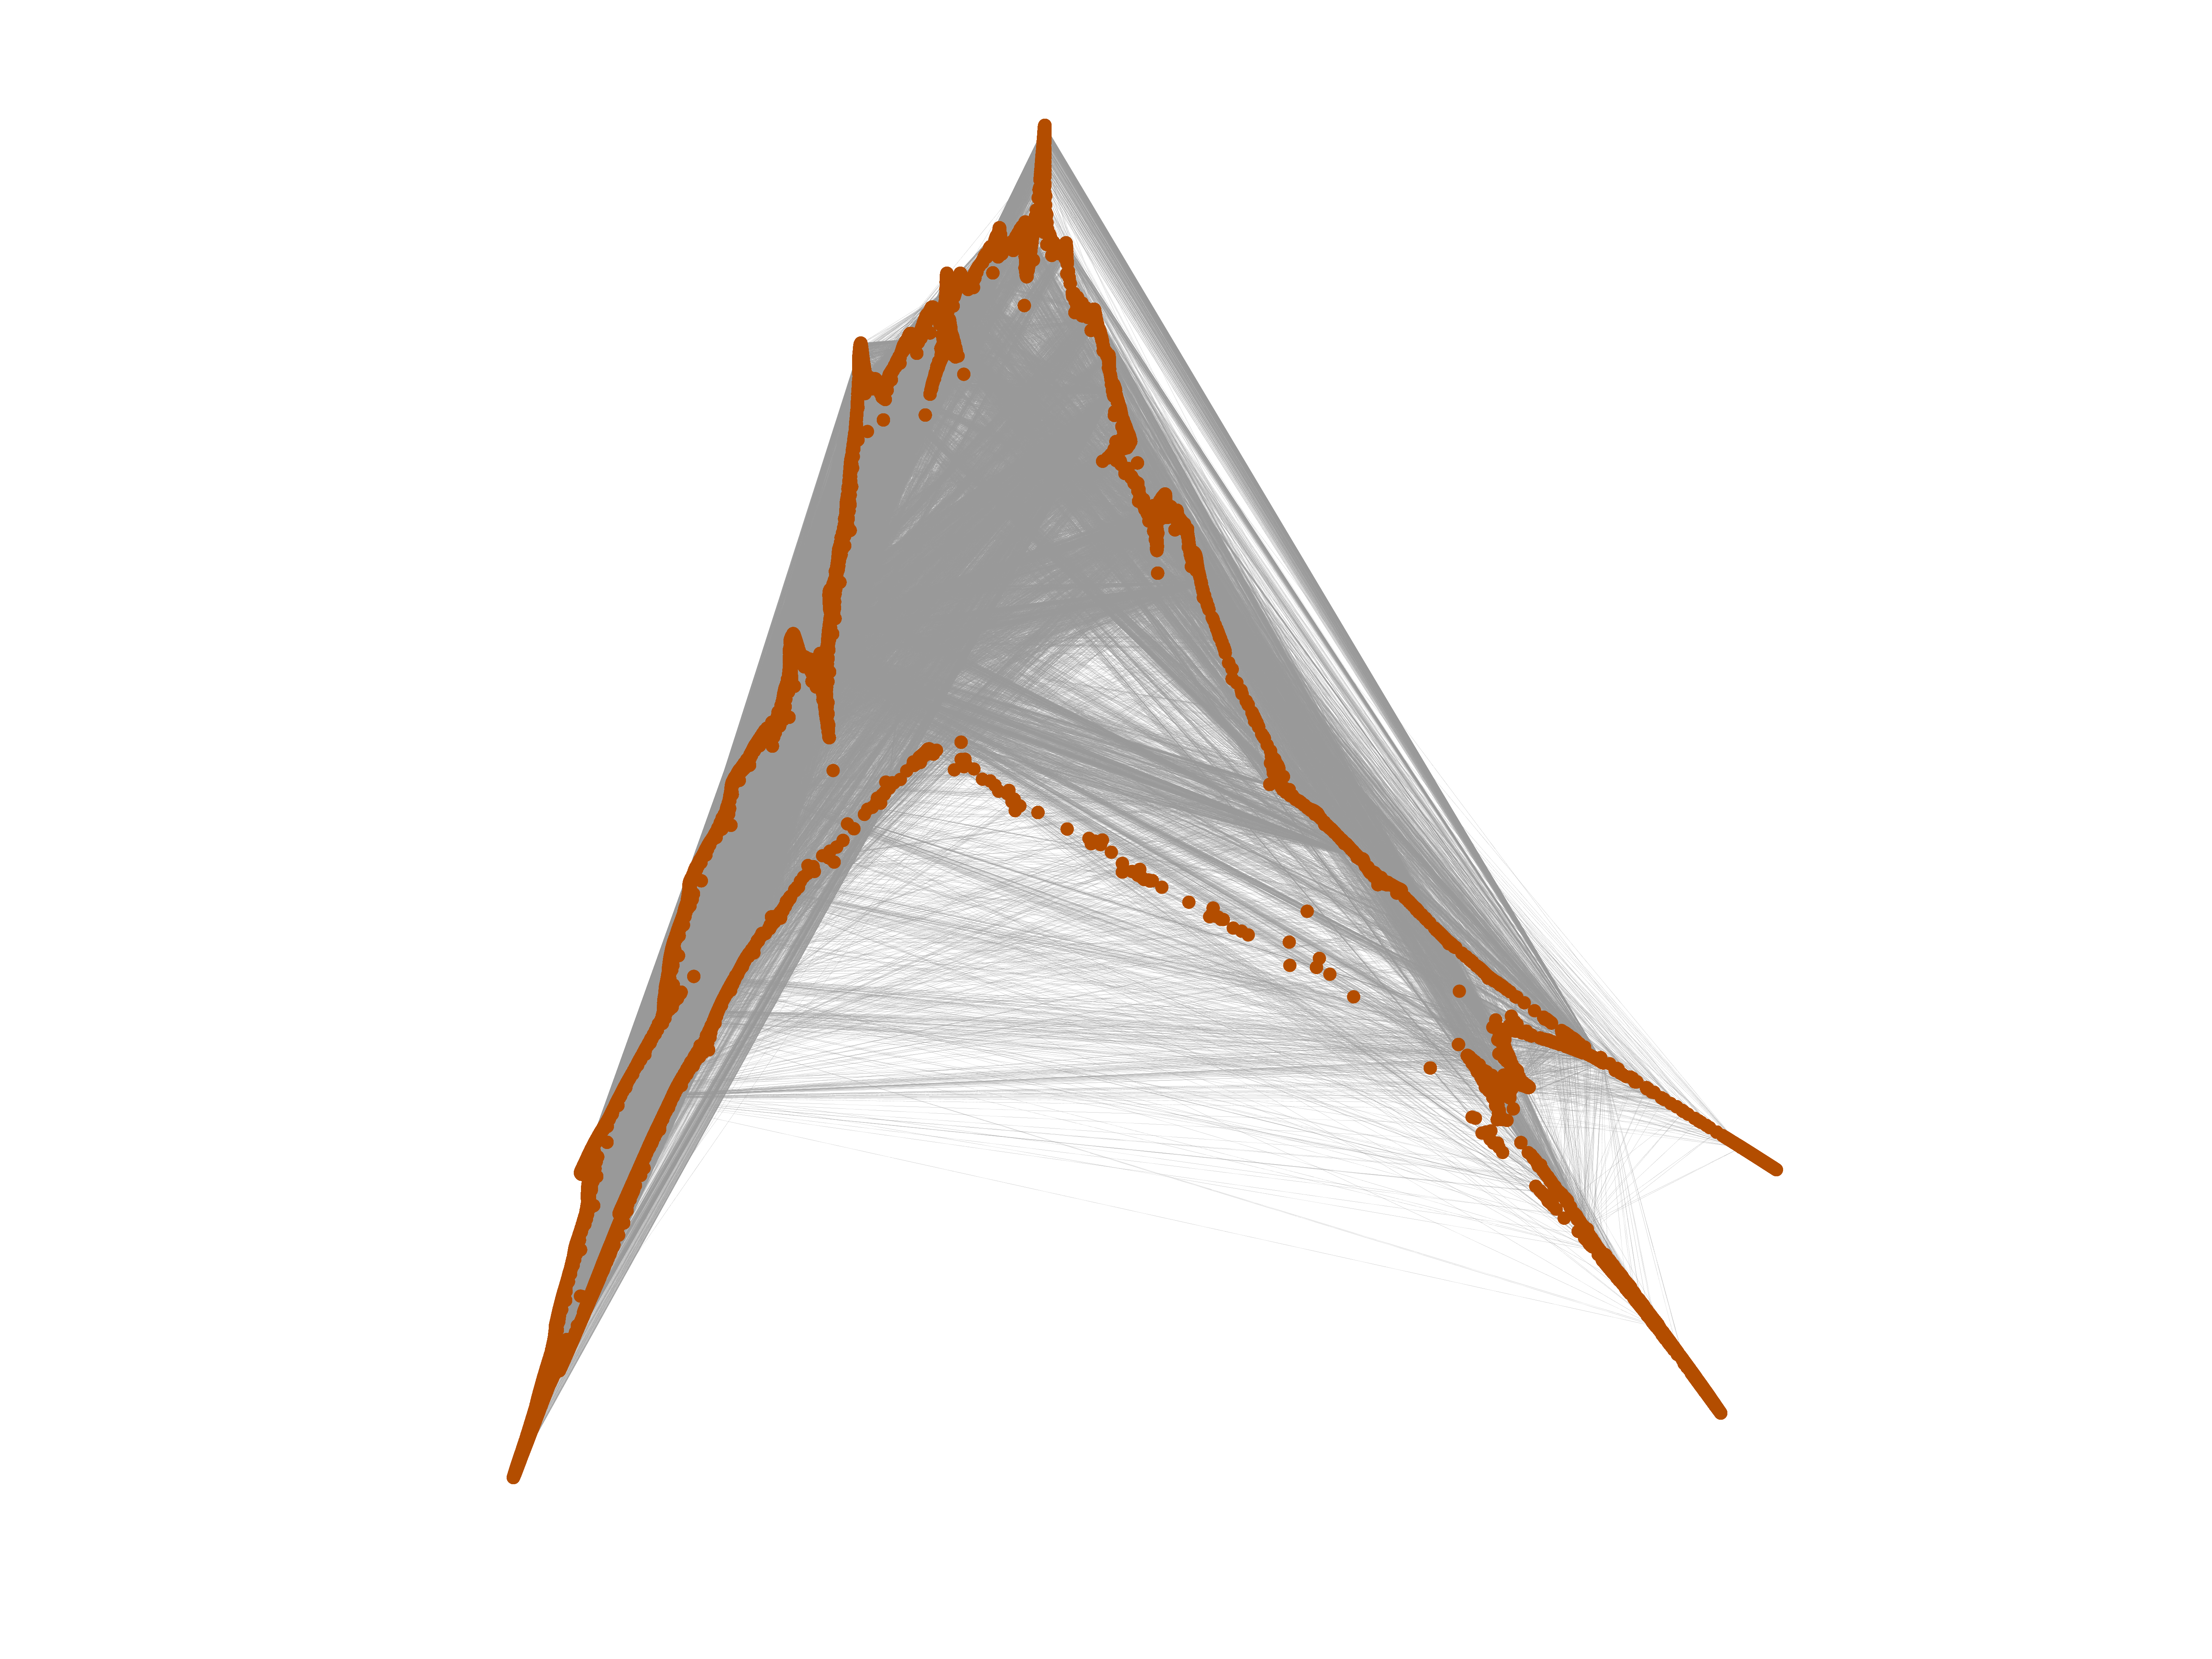
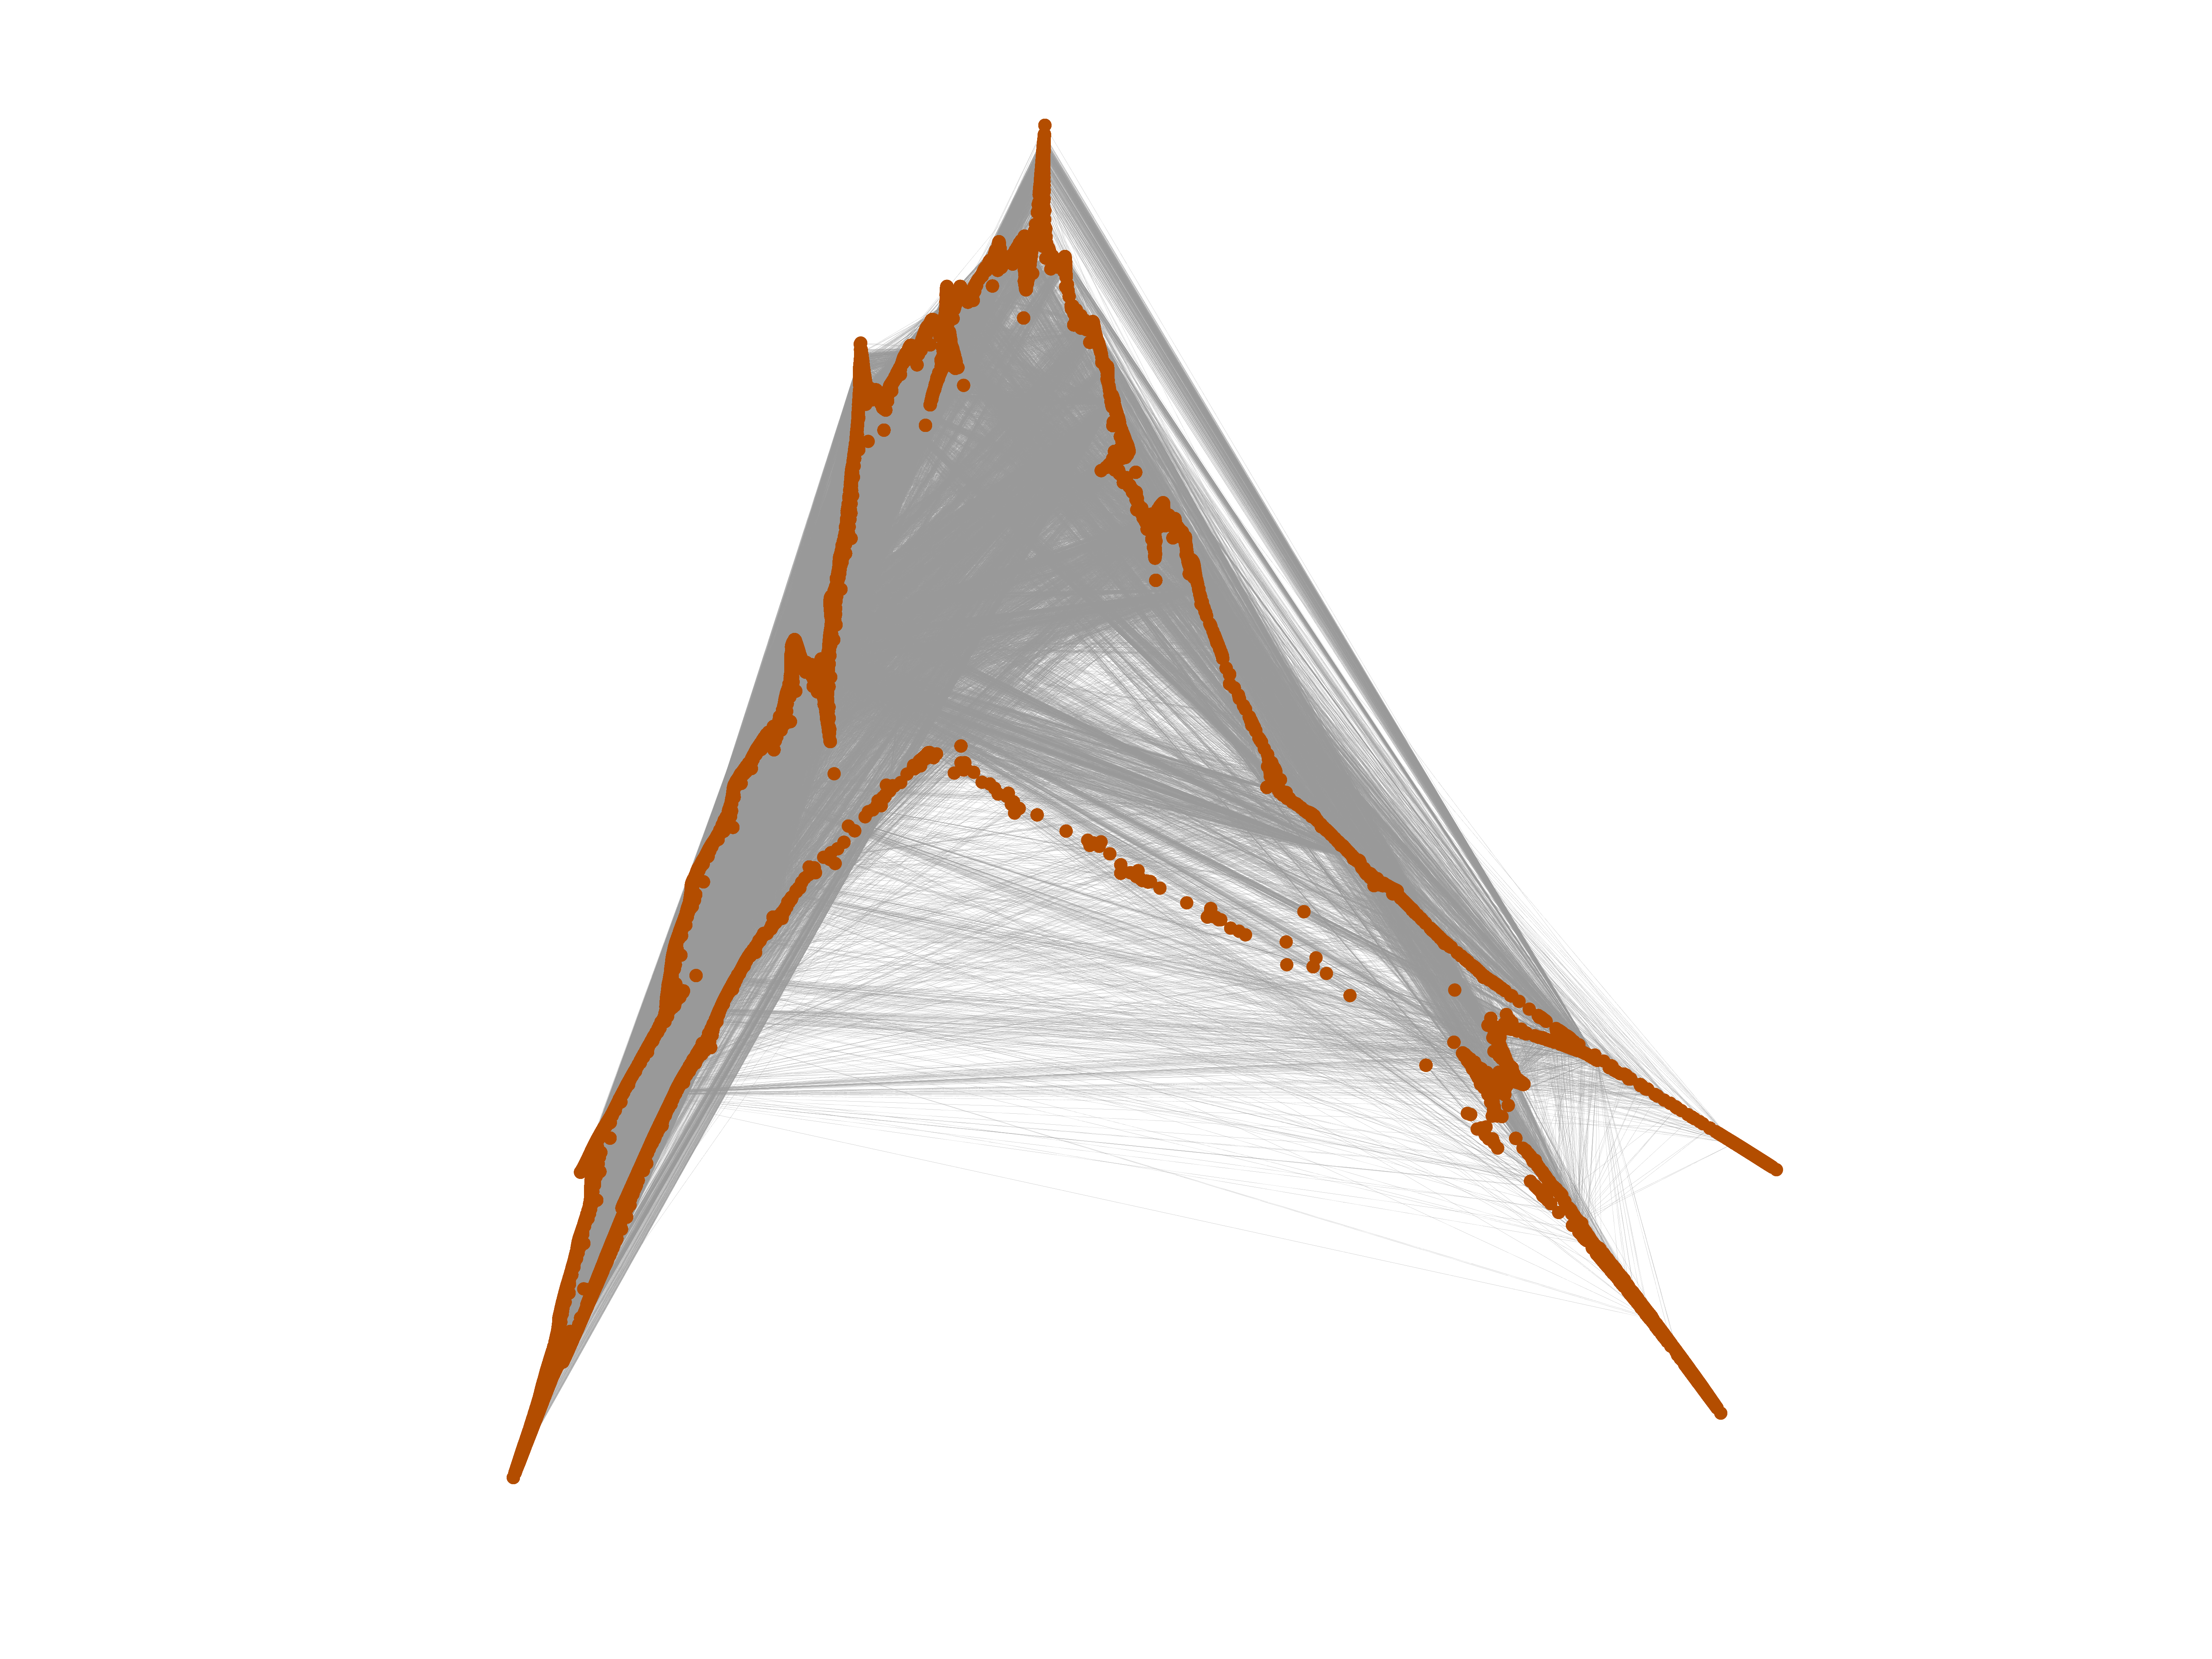
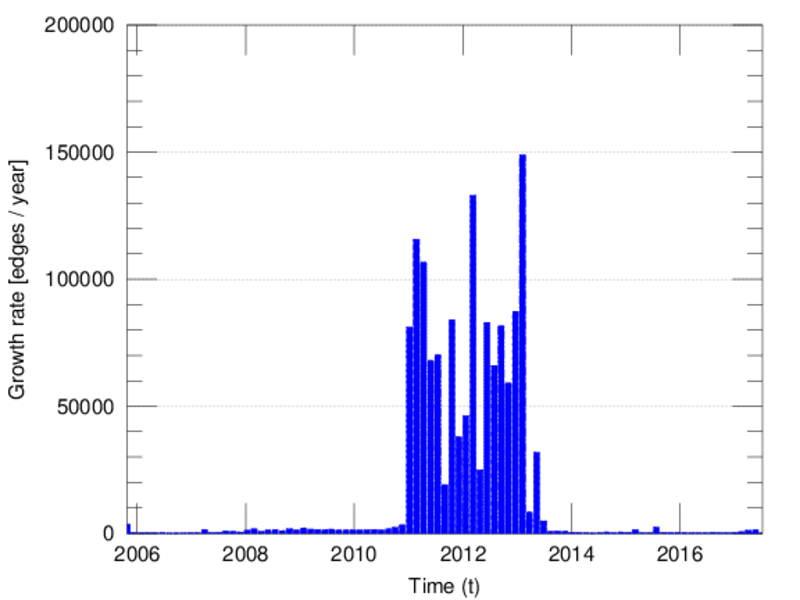
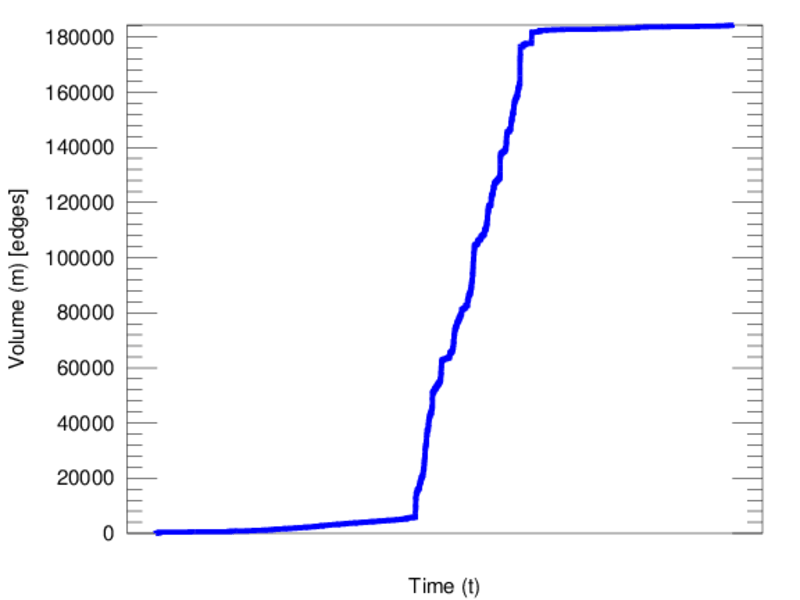
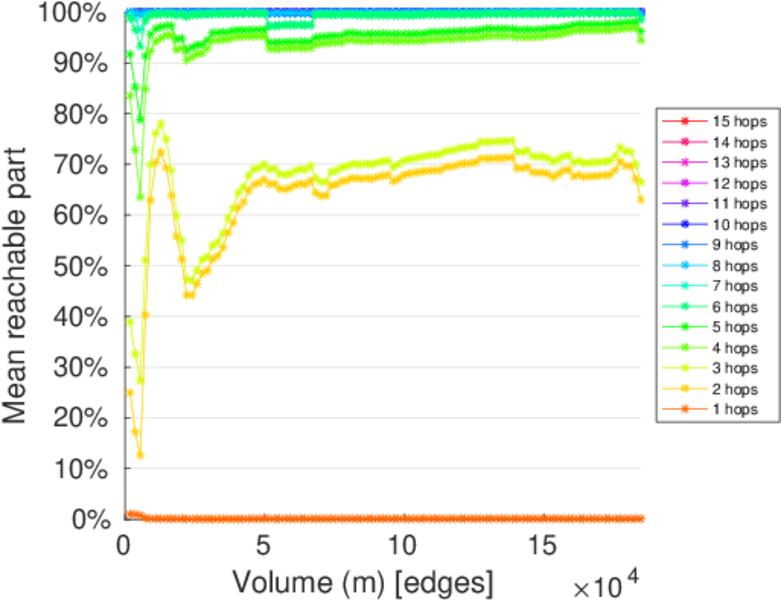
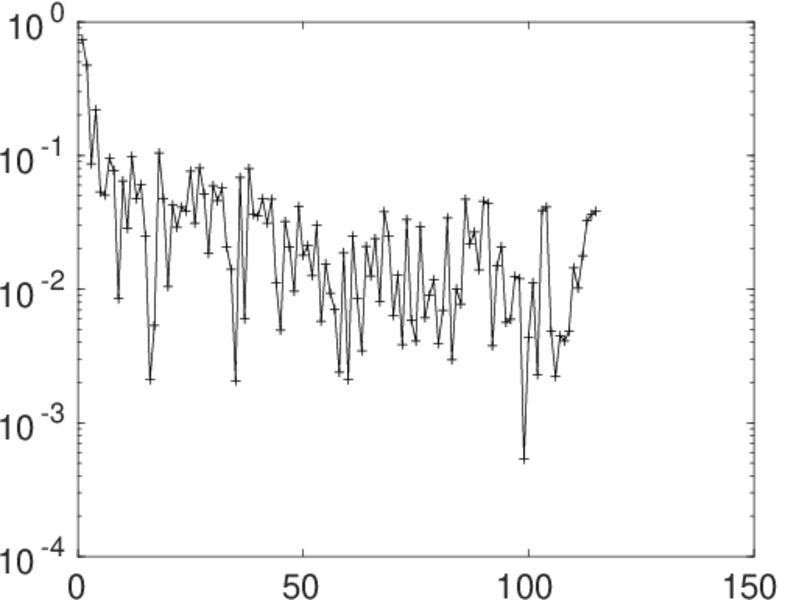
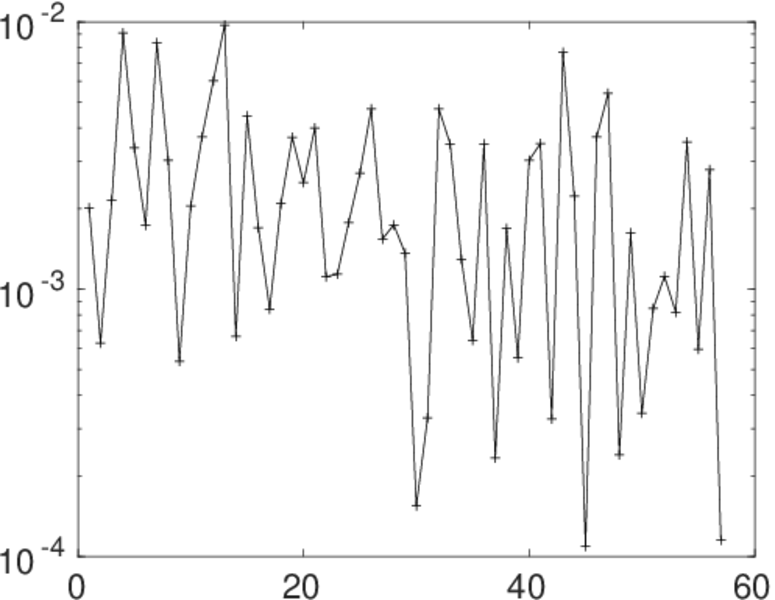
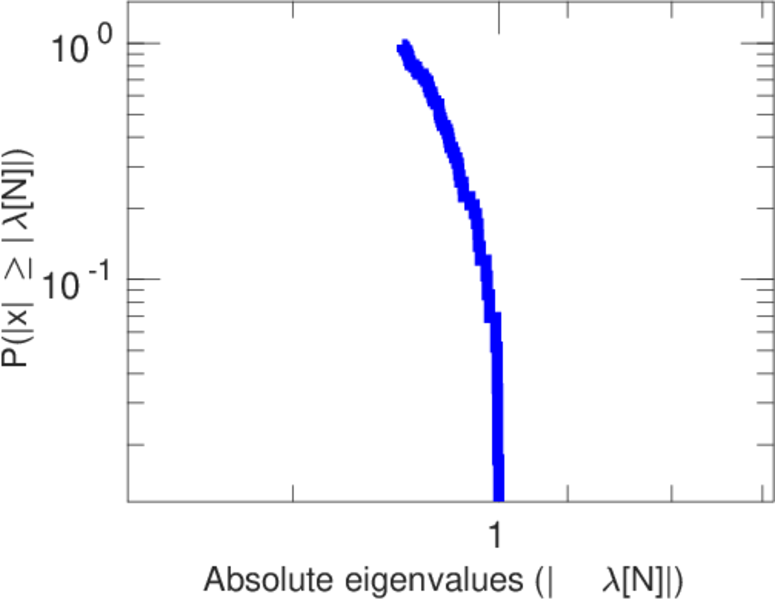
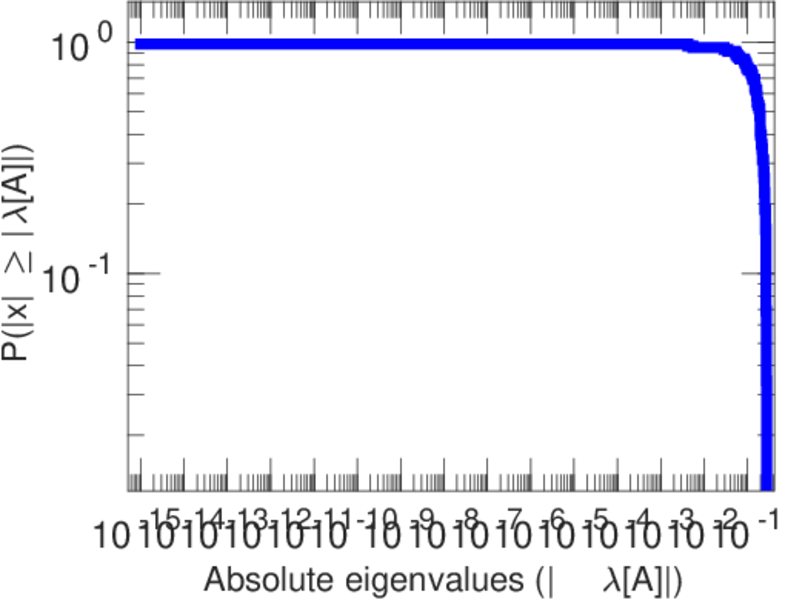
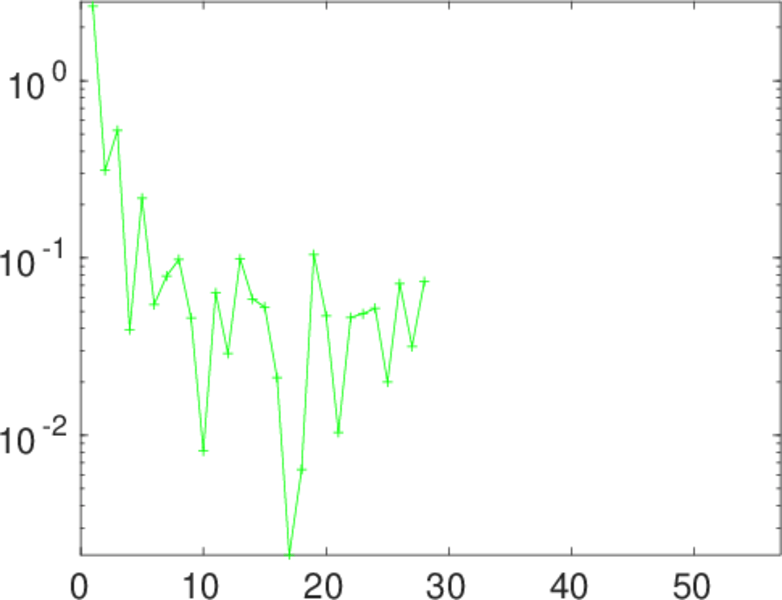
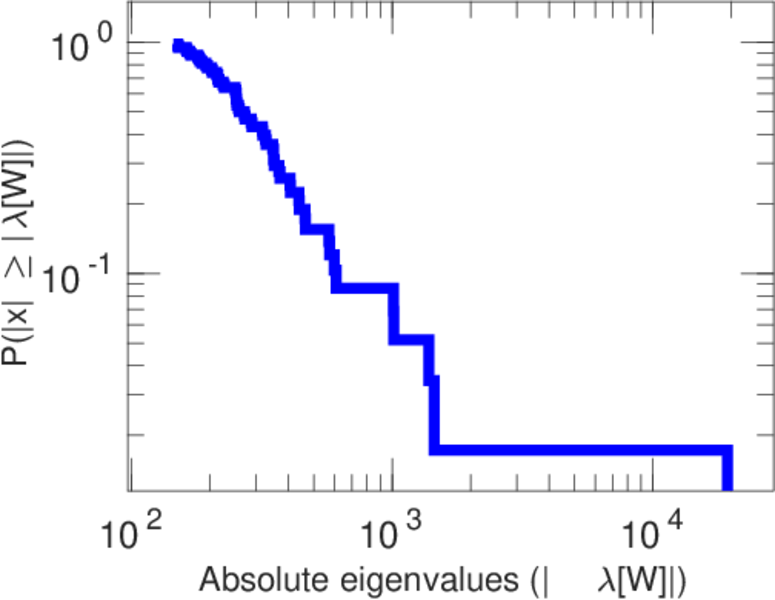
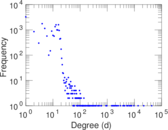
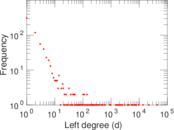
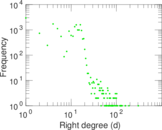
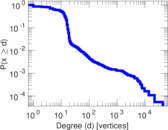
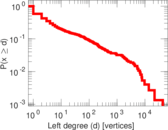
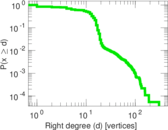
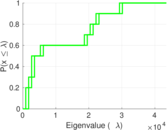
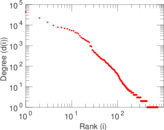
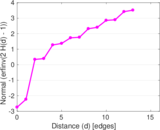
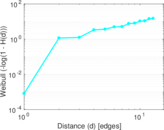
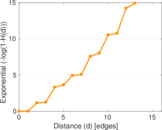
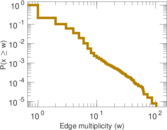
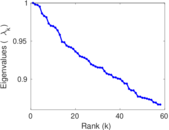
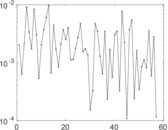
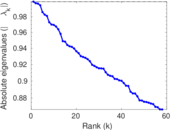
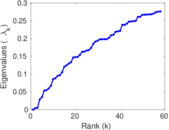
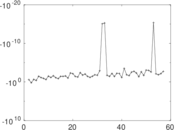
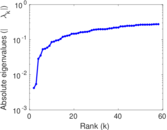
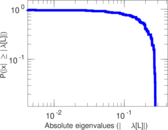
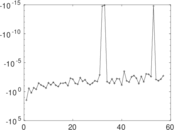
Plots


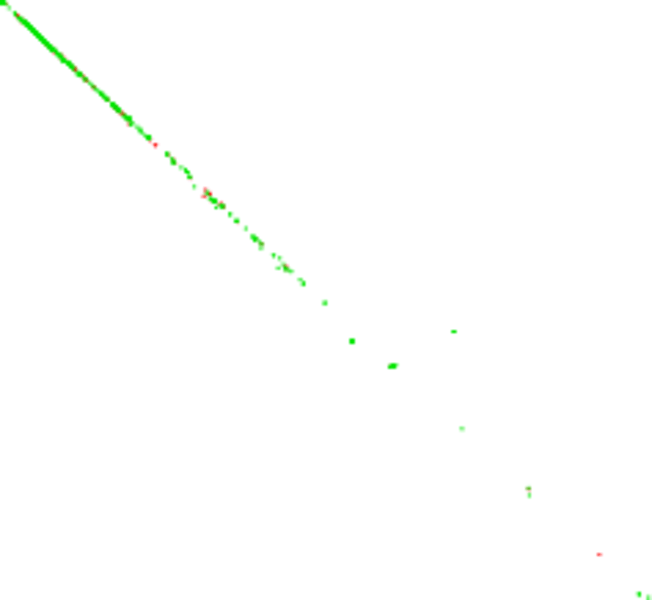
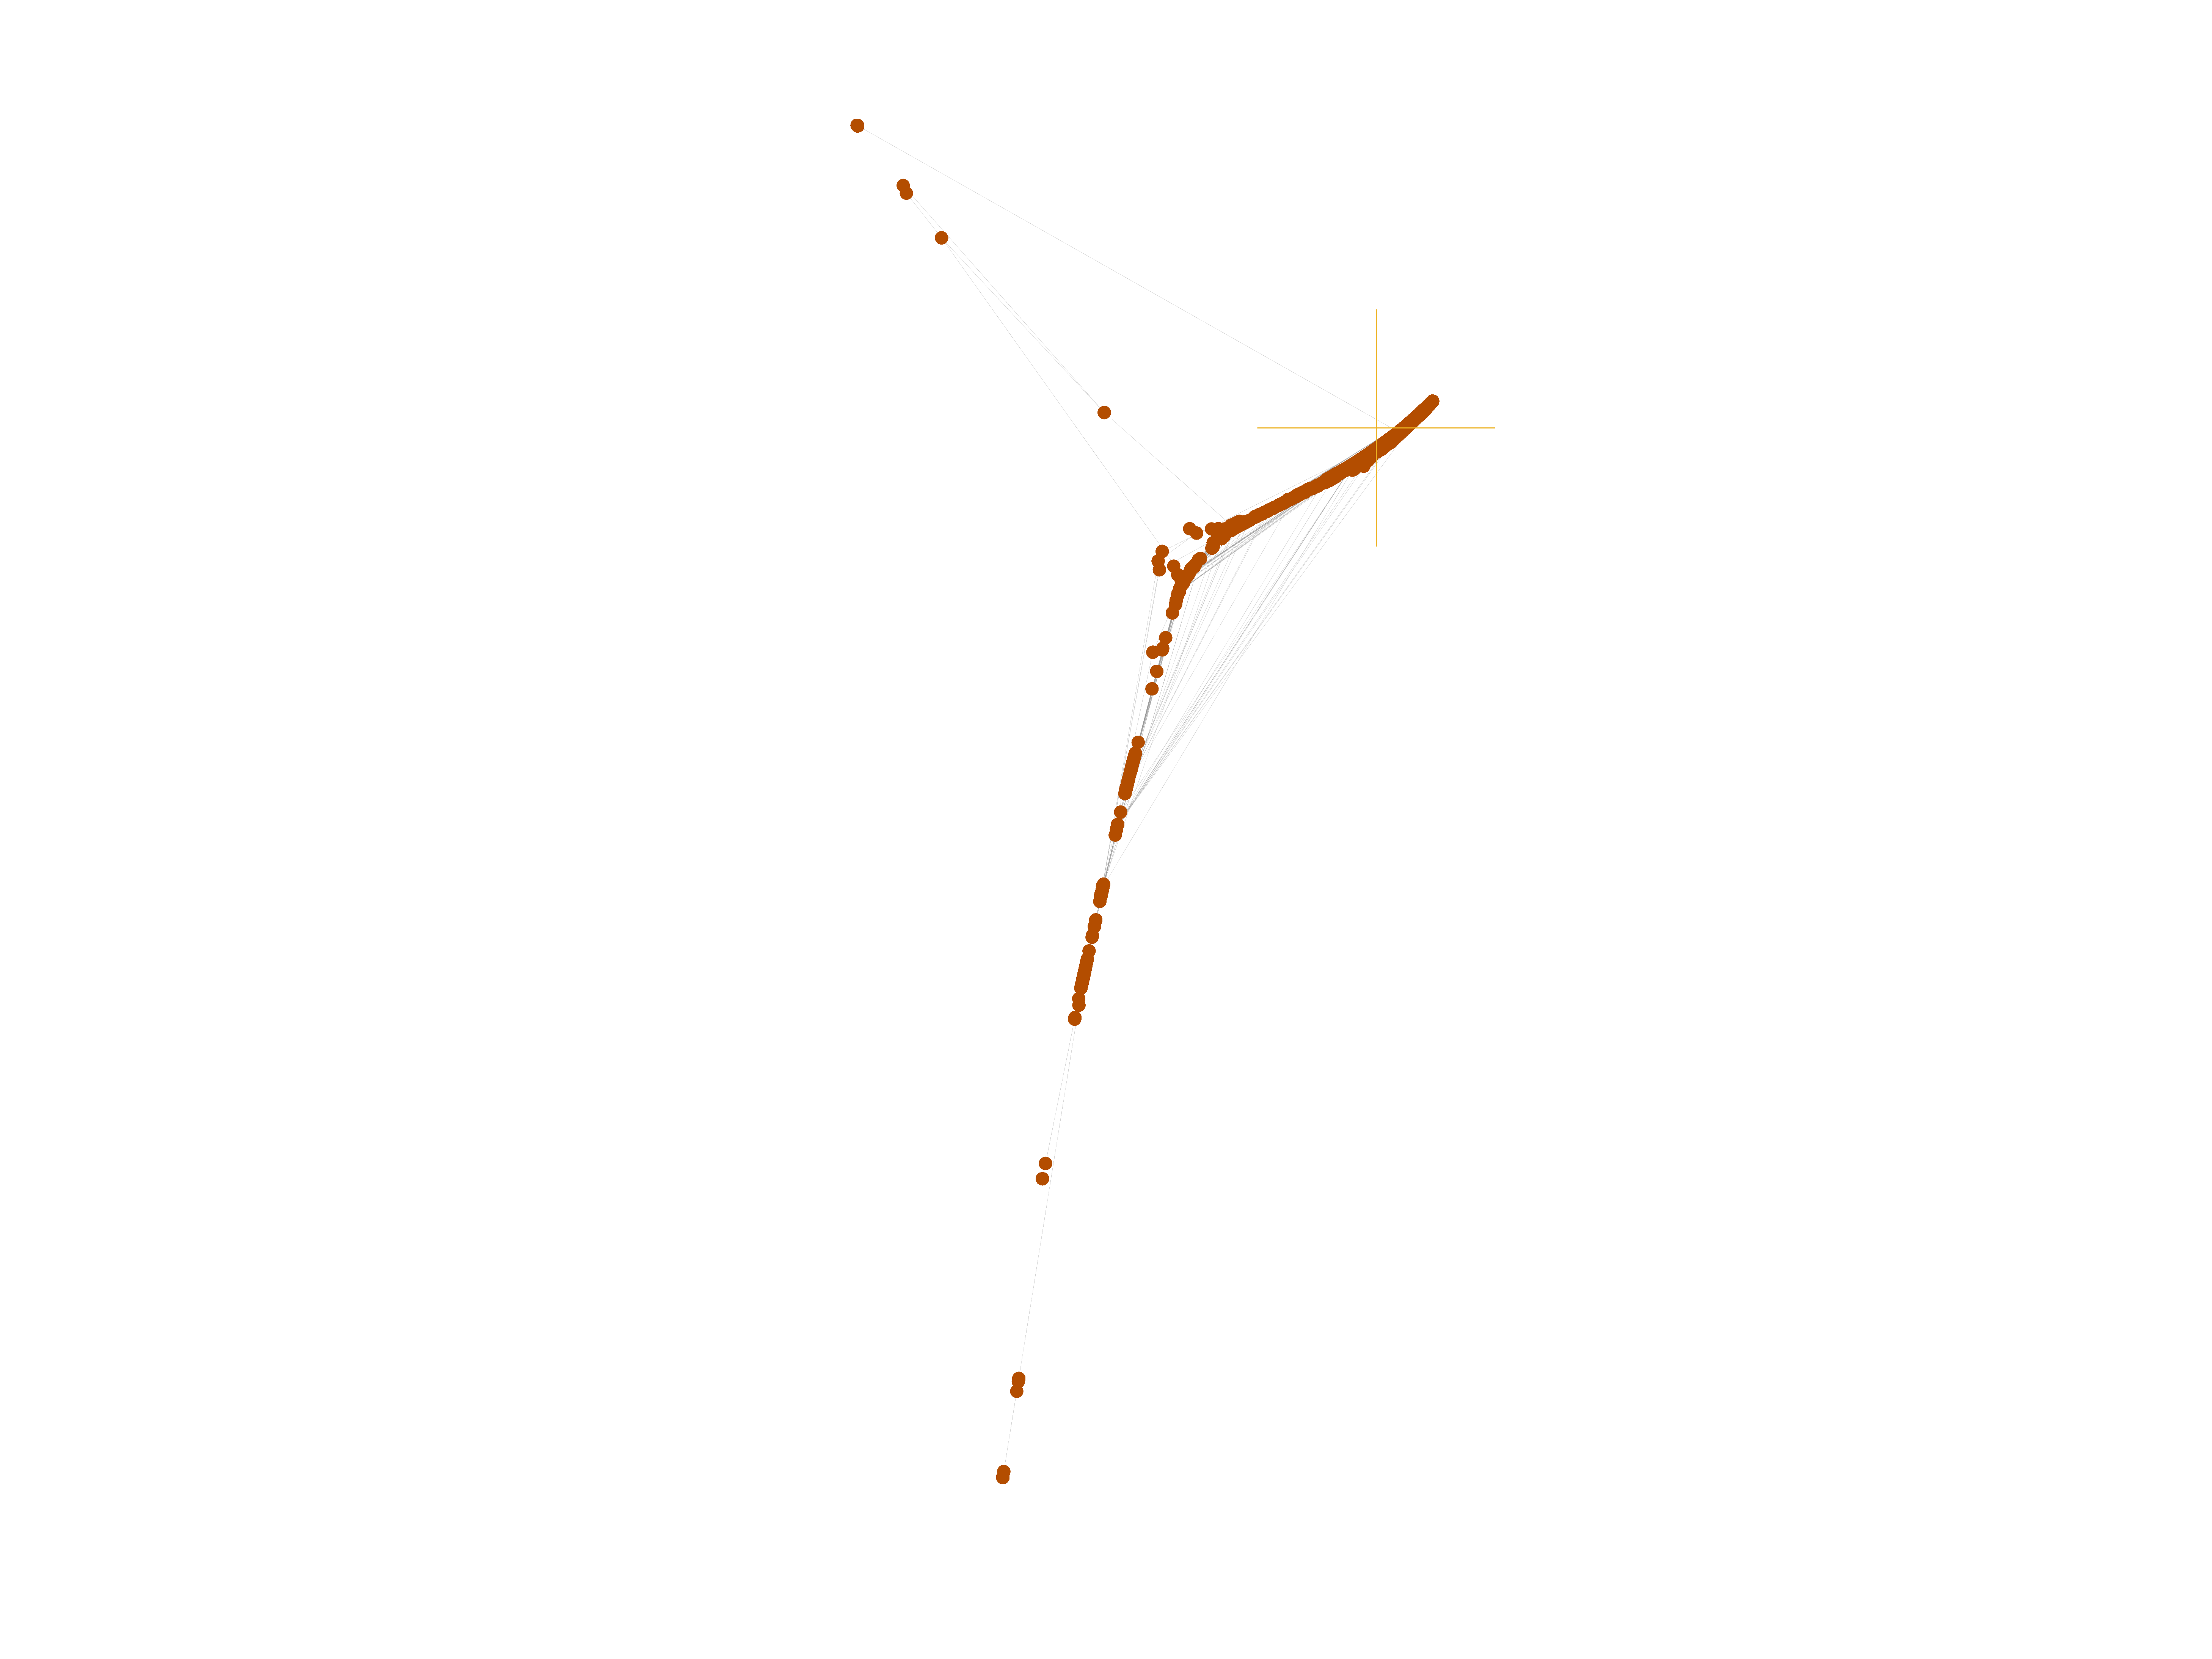
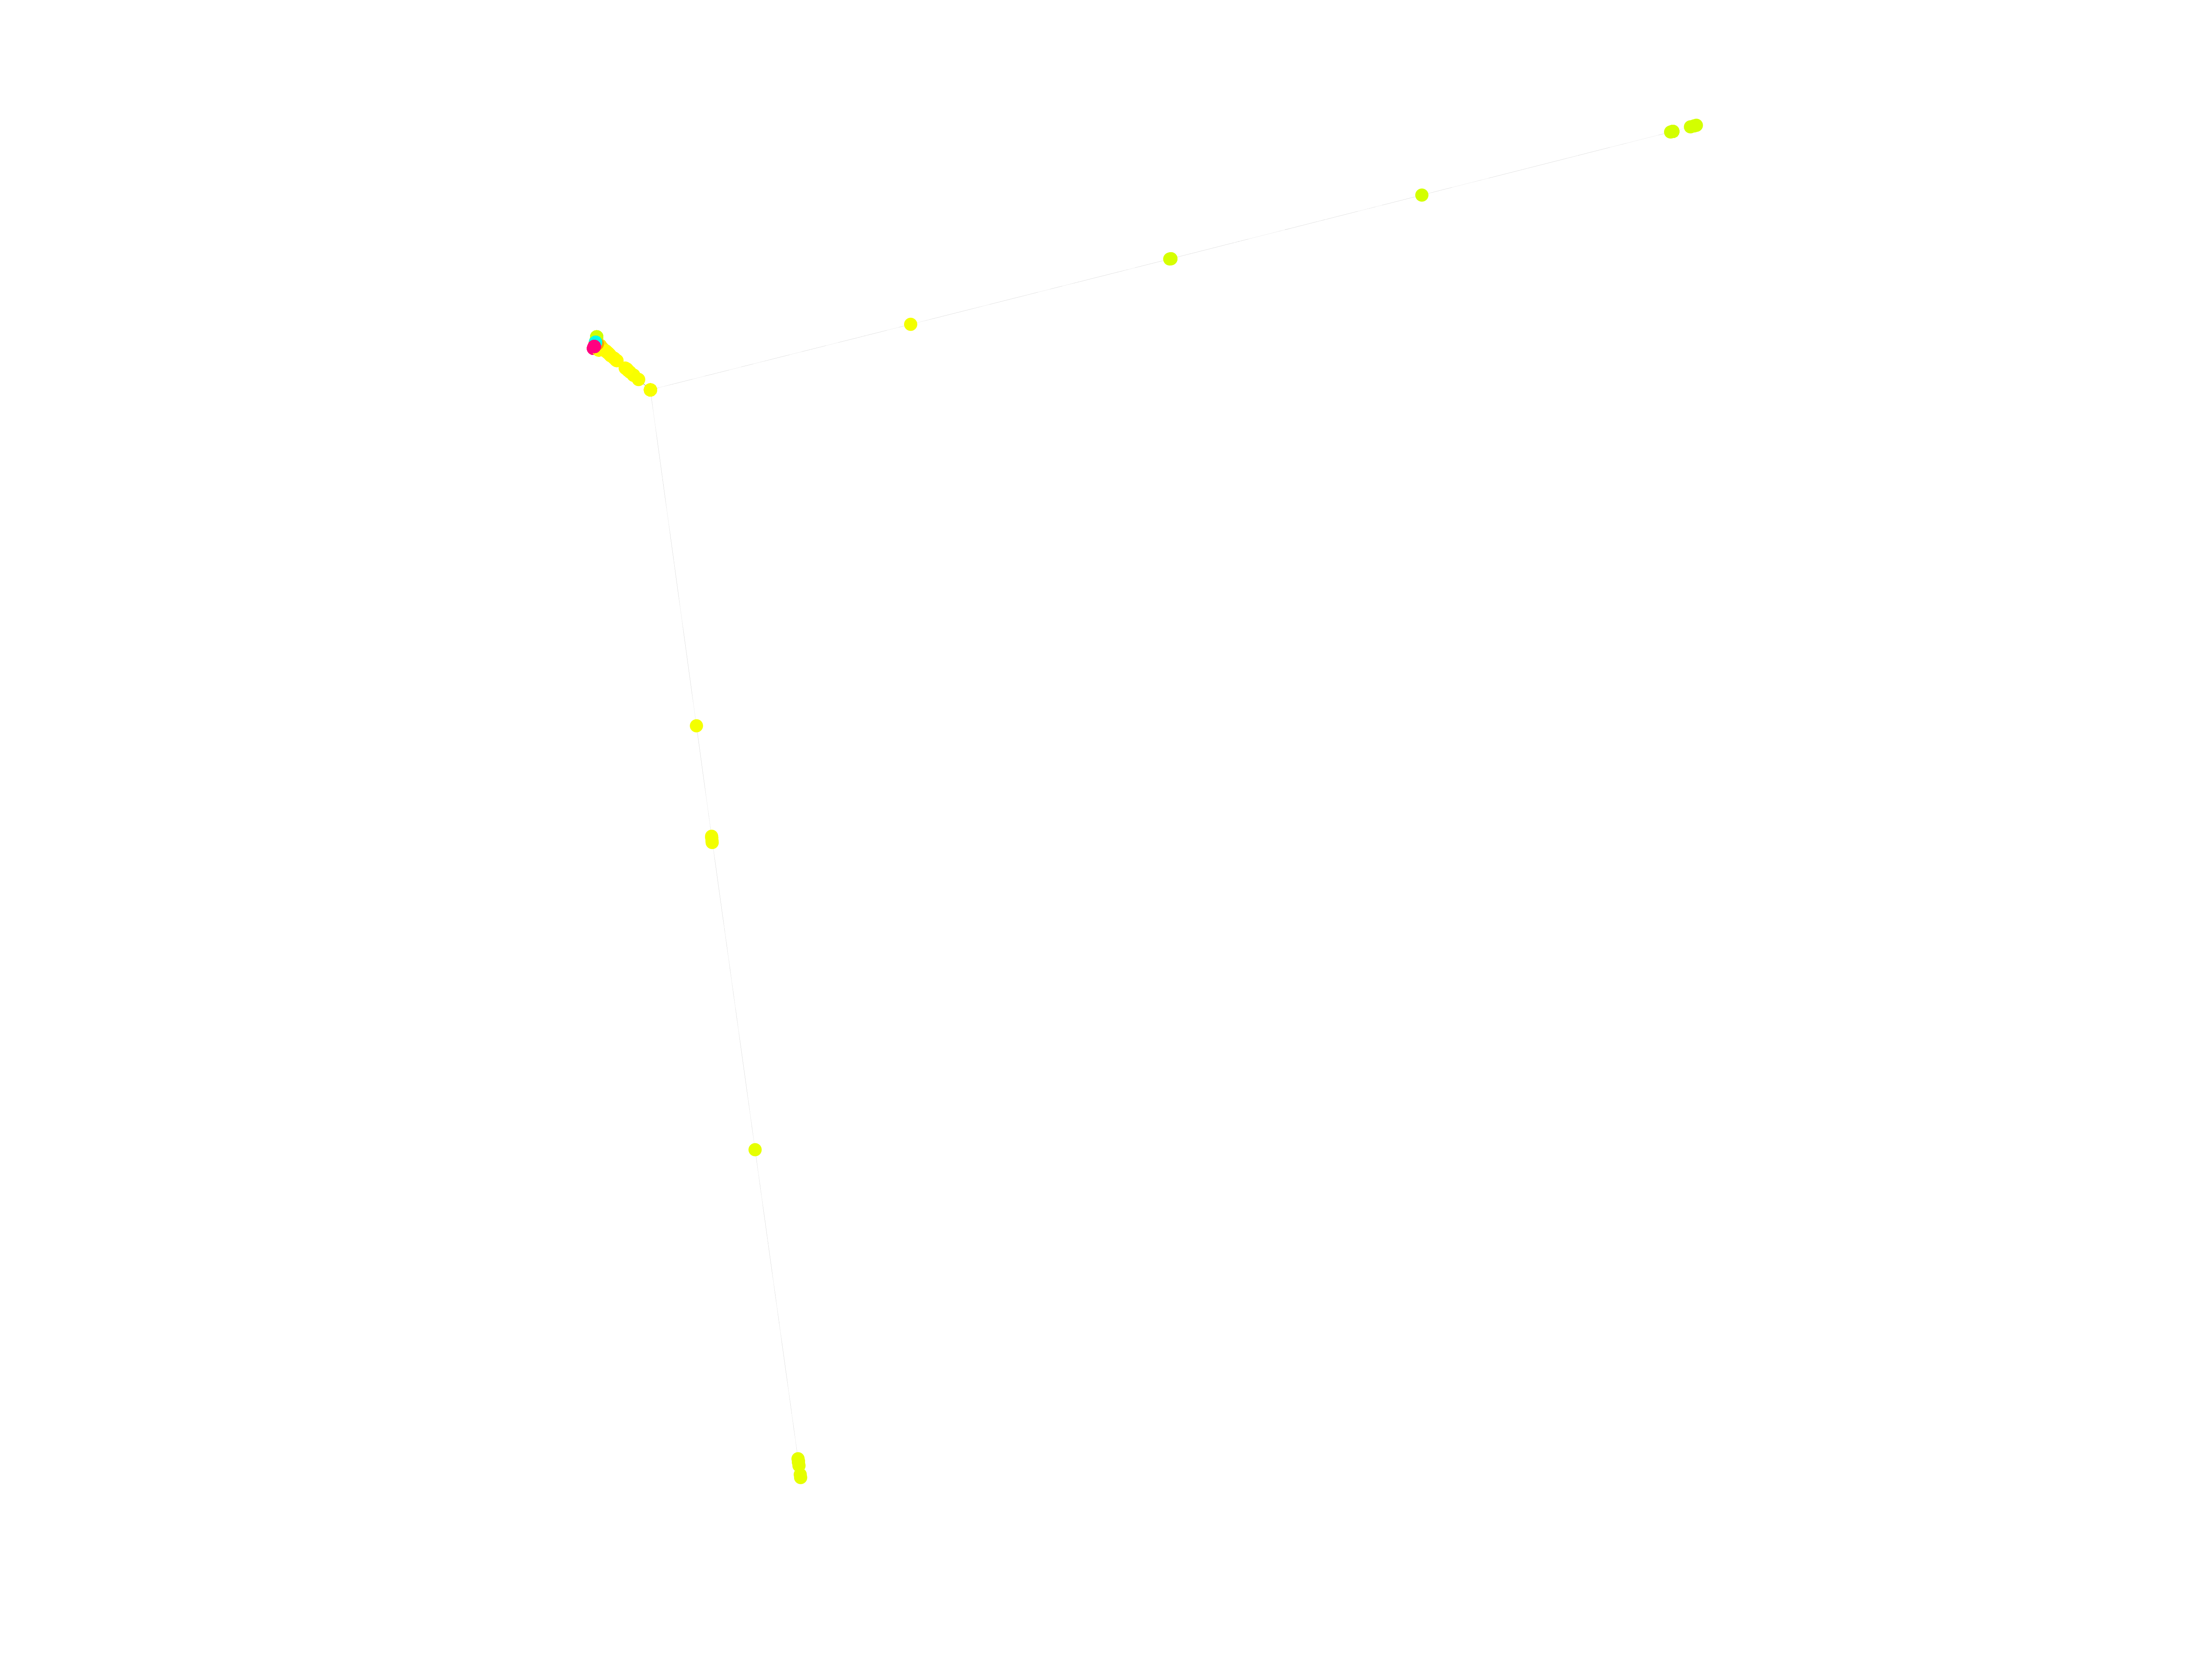
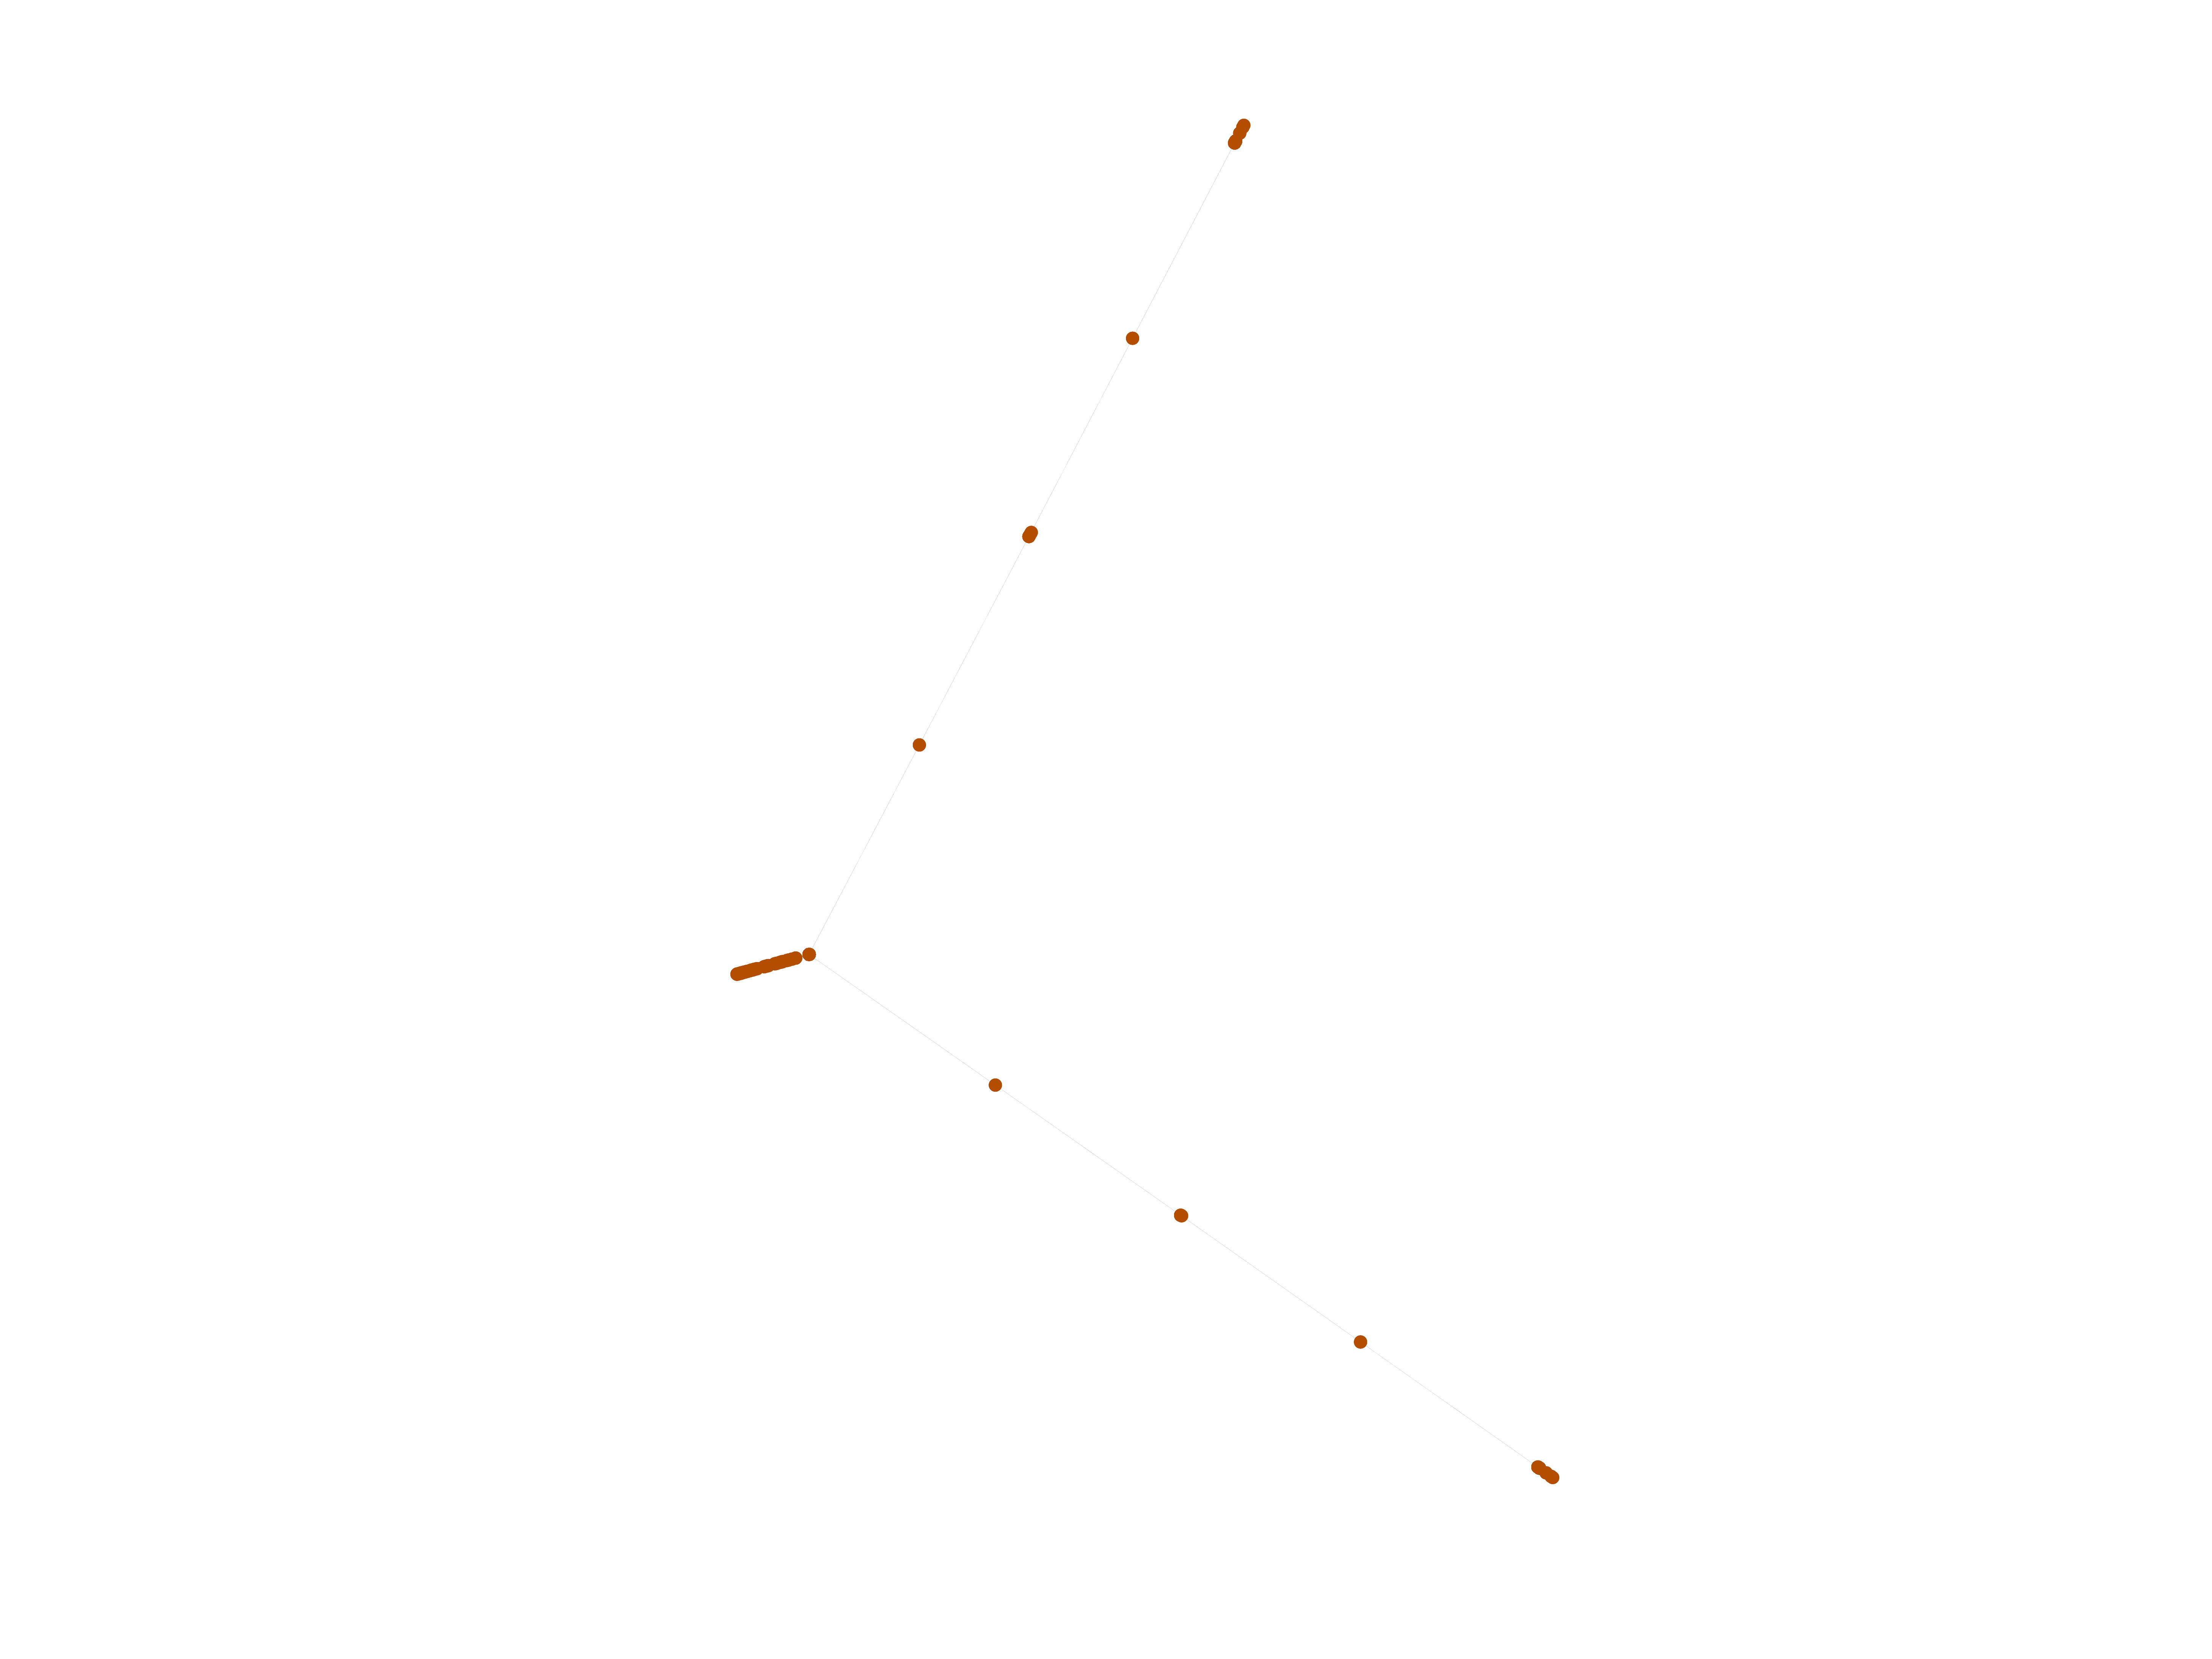
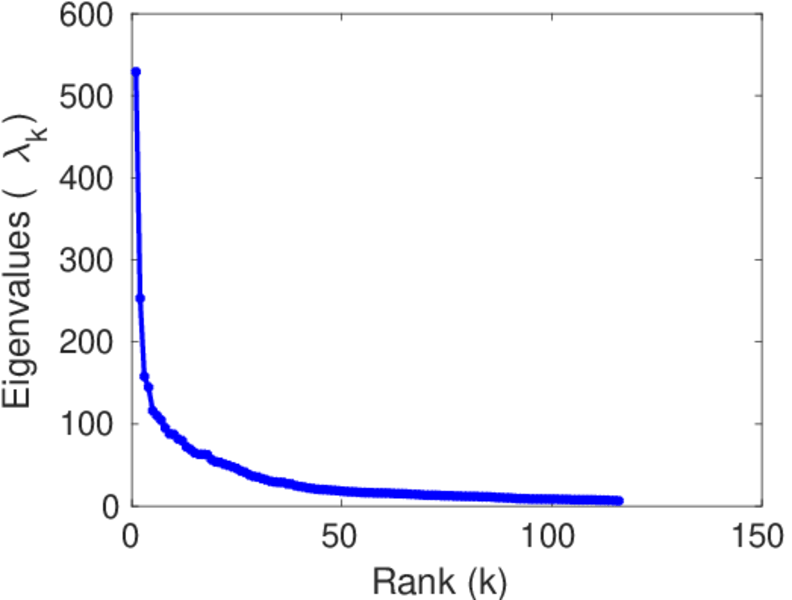
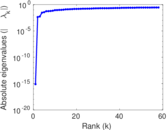
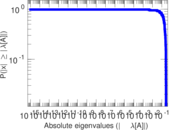
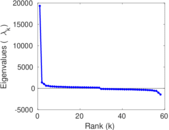
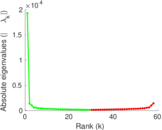
Matrix decompositions plots


Downloads
References
|
[1]
|
Jérôme Kunegis.
KONECT – The Koblenz Network Collection.
In Proc. Int. Conf. on World Wide Web Companion, pages
1343–1350, 2013.
[ http ]
|
|
[2]
|
Wikimedia Foundation.
Wikimedia downloads.
http://dumps.wikimedia.org/, January 2010.
|
 KONECT ‣ Networks ‣
Buy Me a Coffee
KONECT ‣ Networks ‣
Buy Me a Coffee