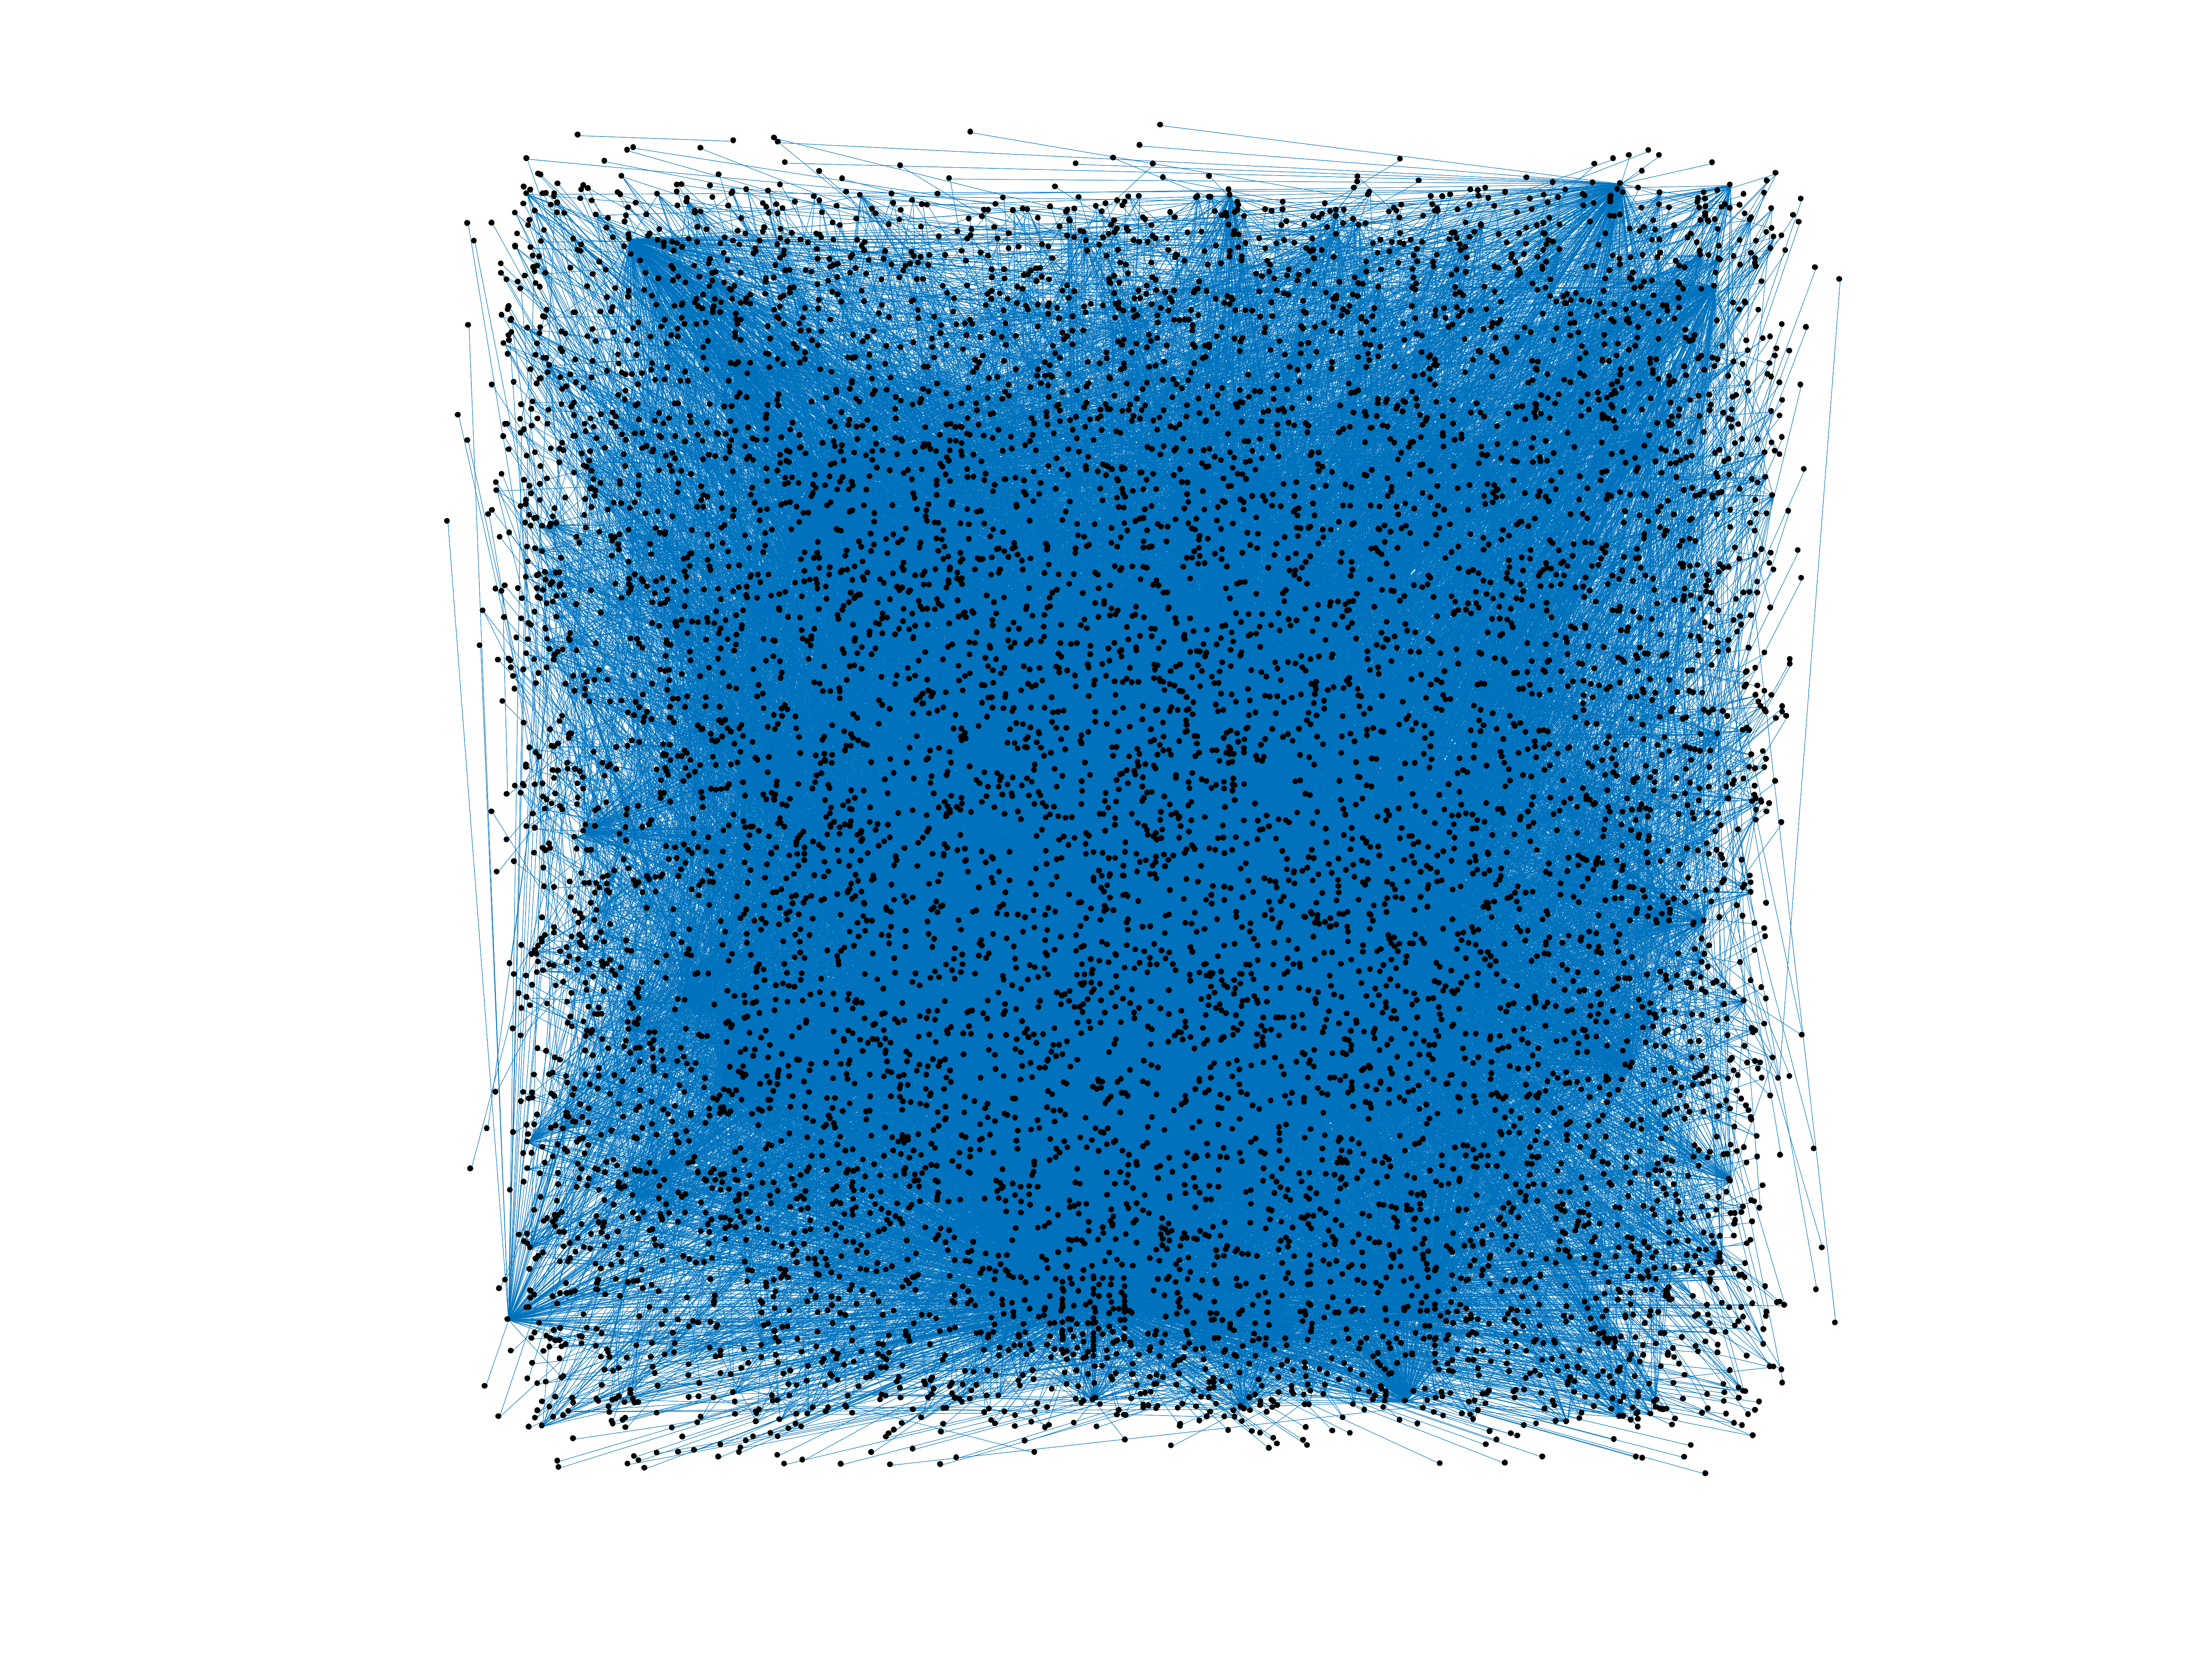
Wikipedia edits (bxr)
This is the bipartite edit network of the буряад Wikipedia. It contains
users and pages from the буряад Wikipedia, connected by edit events. Each
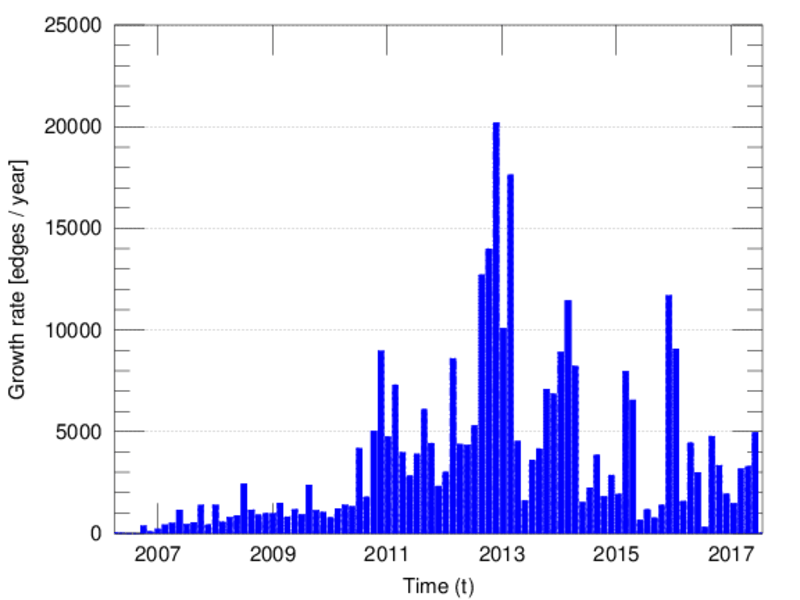
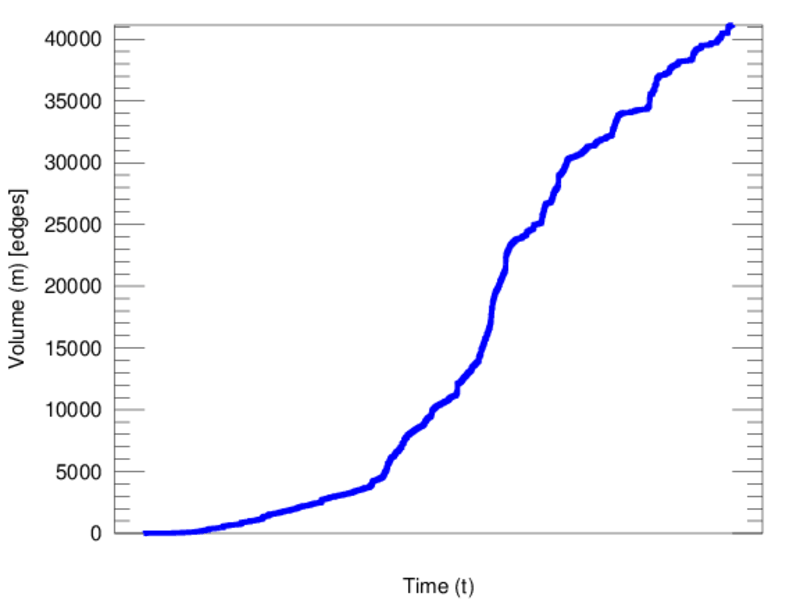
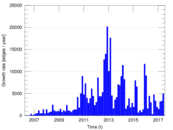
edge represents an edit. The dataset includes the timestamp of each edit.
Metadata
Statistics
| Size | n = | 8,187
|
| Left size | n1 = | 919
|
| Right size | n2 = | 7,268
|
| Volume | m = | 41,140
|
| Unique edge count | m̿ = | 18,581
|
| Wedge count | s = | 8,823,554
|
| Claw count | z = | 7,673,463,785
|
| Cross count | x = | 6,306,544,703,856
|
| Square count | q = | 3,201,558
|
| 4-Tour count | T4 = | 60,946,882
|
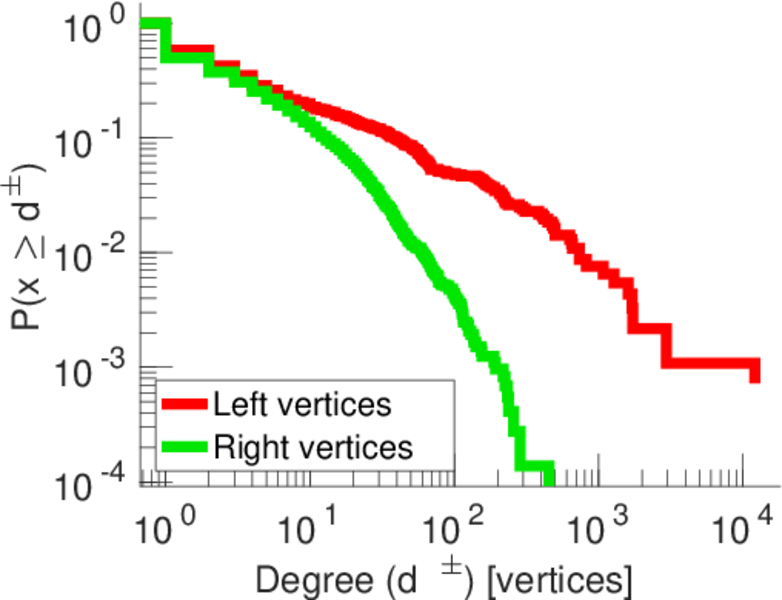
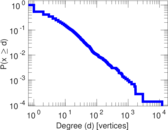
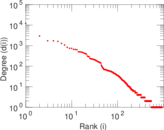
| Maximum degree | dmax = | 12,131
|
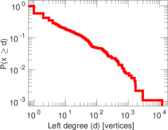
| Maximum left degree | d1max = | 12,131
|
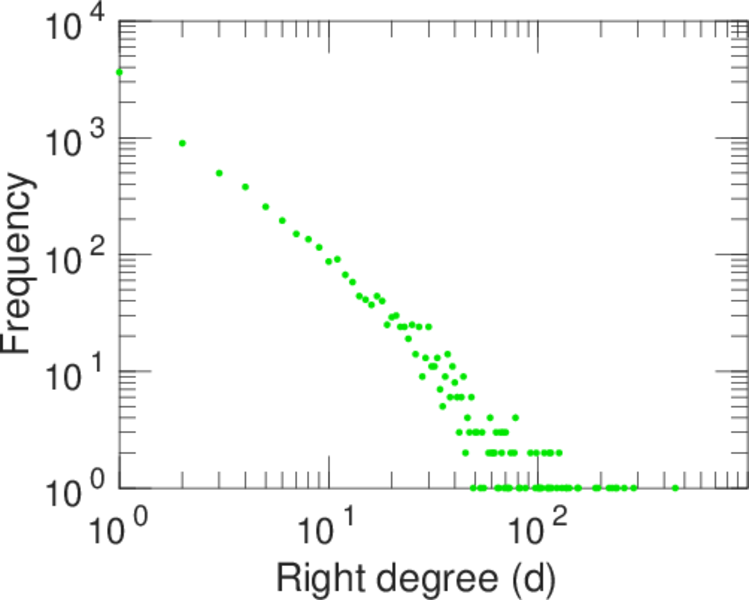
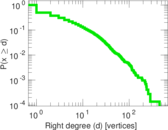
| Maximum right degree | d2max = | 452
|
| Average degree | d = | 10.050 1
|
| Average left degree | d1 = | 44.766 1
|
| Average right degree | d2 = | 5.660 43
|
| Fill | p = | 0.002 781 88
|
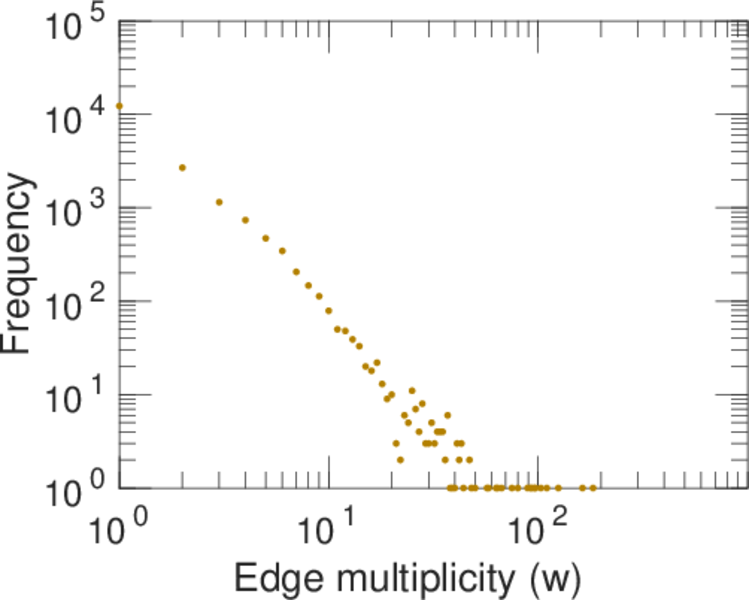
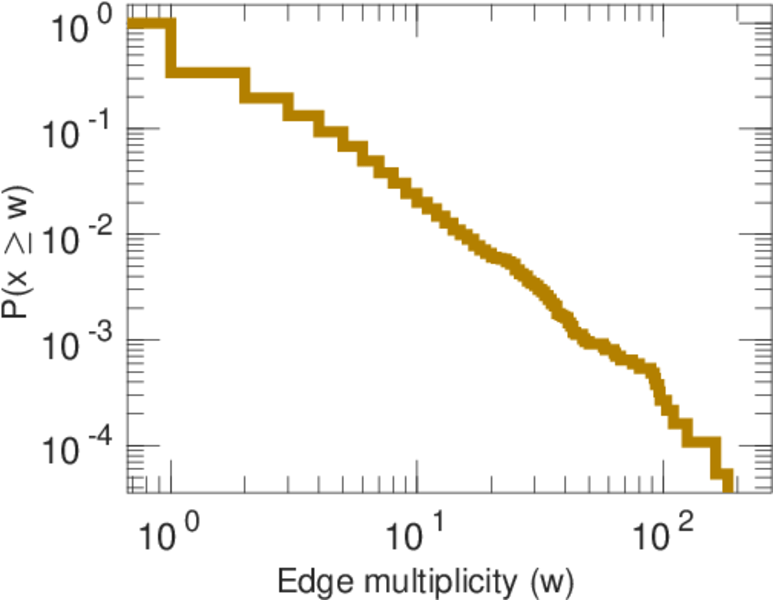
| Average edge multiplicity | m̃ = | 2.214 09
|
| Size of LCC | N = | 7,587
|
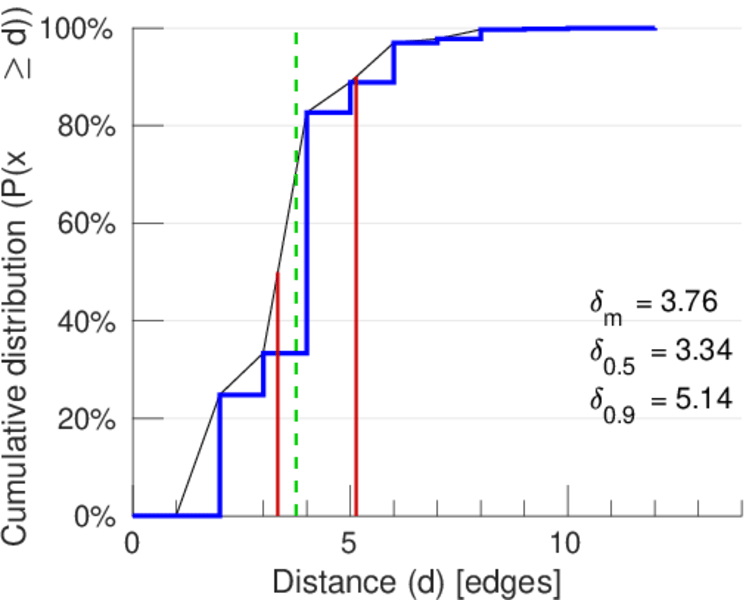
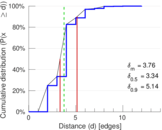
| Diameter | δ = | 12
|
| 50-Percentile effective diameter | δ0.5 = | 3.337 58
|
| 90-Percentile effective diameter | δ0.9 = | 5.138 03
|
| Median distance | δM = | 4
|
| Mean distance | δm = | 3.760 24
|
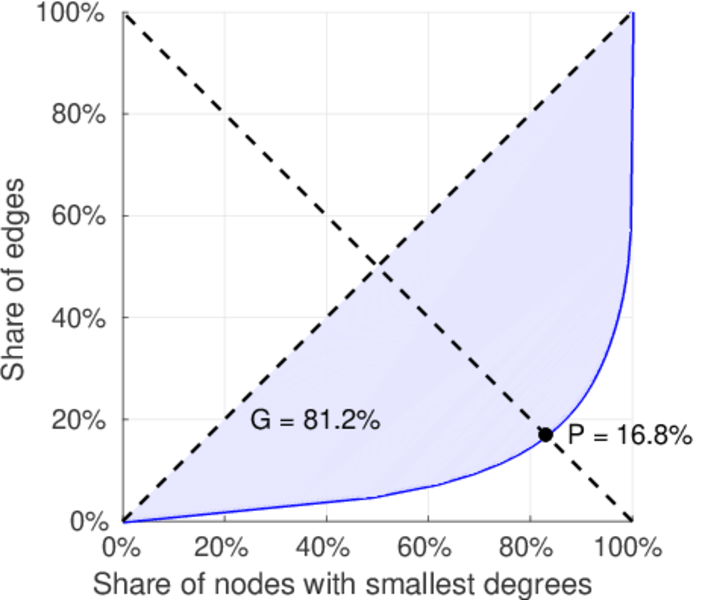
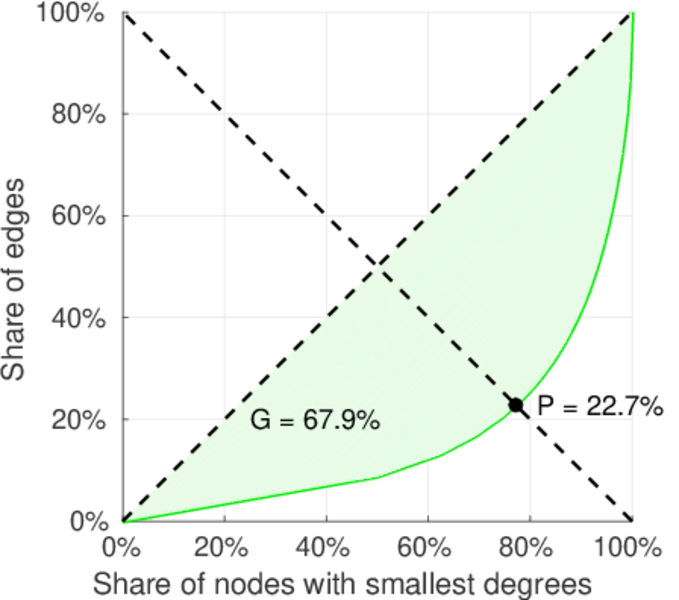
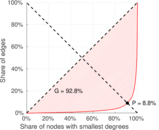
| Gini coefficient | G = | 0.815 457
|
| Balanced inequality ratio | P = | 0.168 777
|
| Left balanced inequality ratio | P1 = | 0.088 040 8
|
| Right balanced inequality ratio | P2 = | 0.226 641
|
| Relative edge distribution entropy | Her = | 0.770 620
|
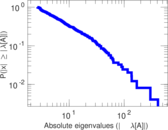
| Power law exponent | γ = | 2.960 61
|
| Tail power law exponent | γt = | 2.071 00
|
| Tail power law exponent with p | γ3 = | 2.071 00
|
| p-value | p = | 0.000 00
|
| Left tail power law exponent with p | γ3,1 = | 1.701 00
|
| Left p-value | p1 = | 0.002 000 00
|
| Right tail power law exponent with p | γ3,2 = | 2.151 00
|
| Right p-value | p2 = | 0.000 00
|
| Degree assortativity | ρ = | −0.347 464
|
| Degree assortativity p-value | pρ = | 0.000 00
|
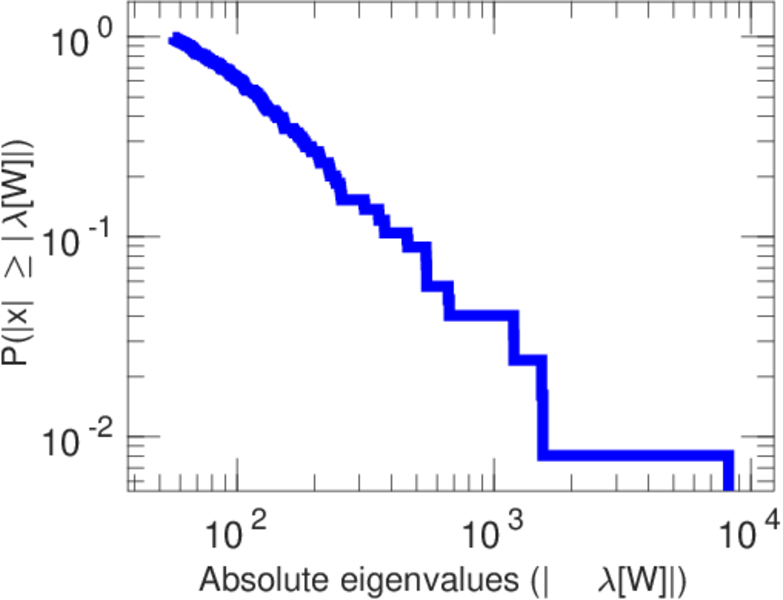
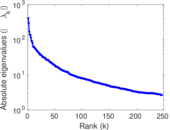
| Spectral norm | α = | 411.216
|
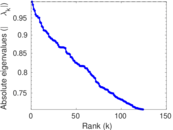
| Algebraic connectivity | a = | 0.021 232 4
|
| Spectral separation | |λ1[A] / λ2[A]| = | 1.375 30
|
| Controllability | C = | 6,521
|
| Relative controllability | Cr = | 0.798 066
|
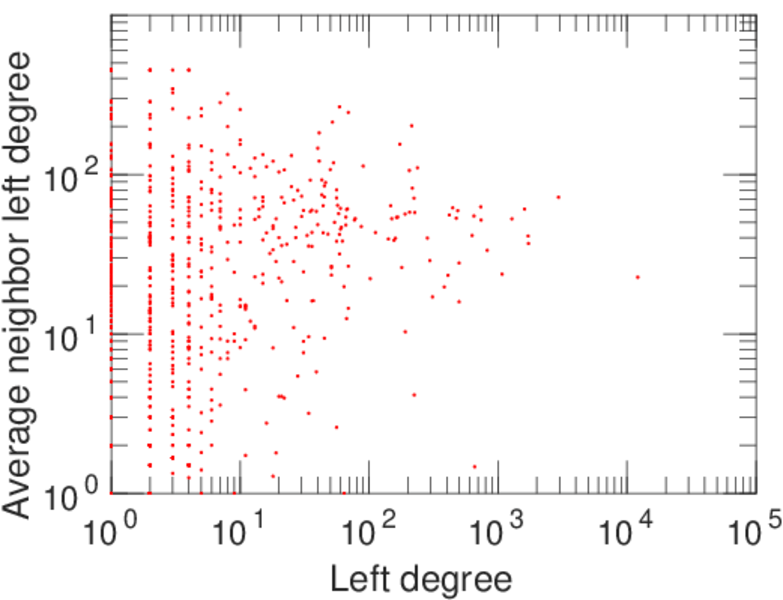
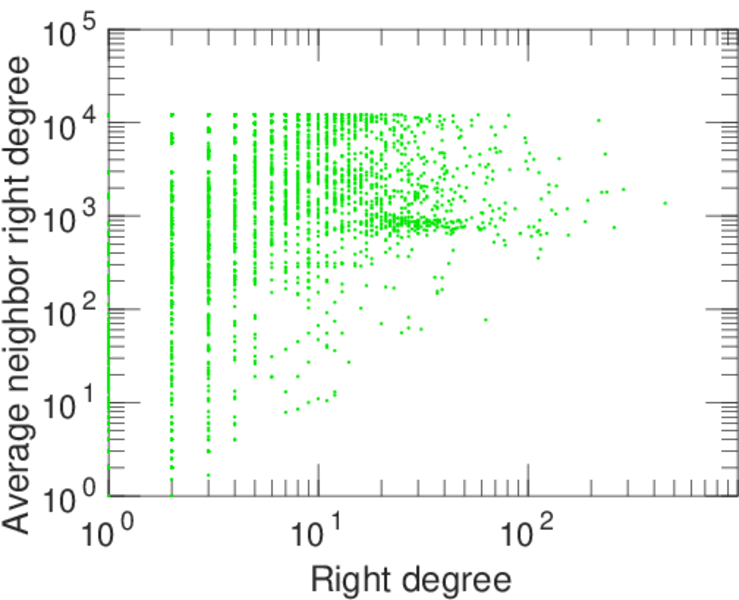
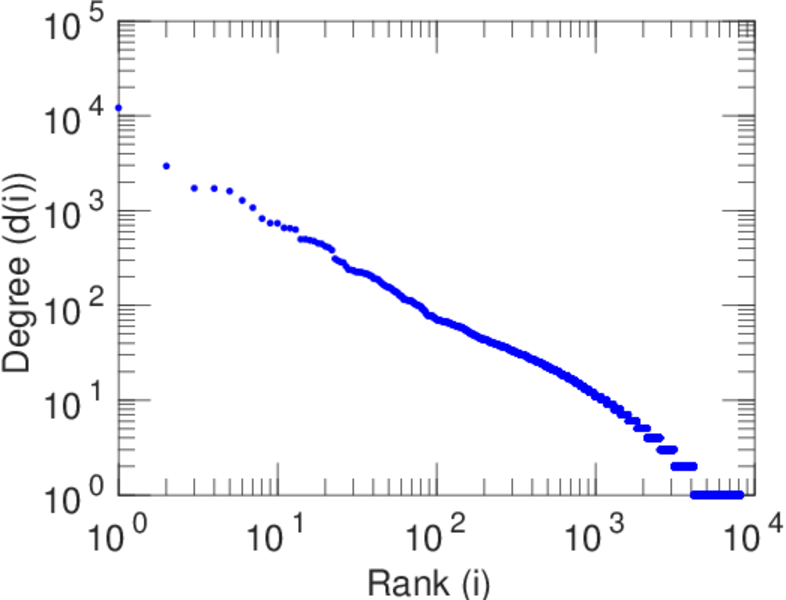
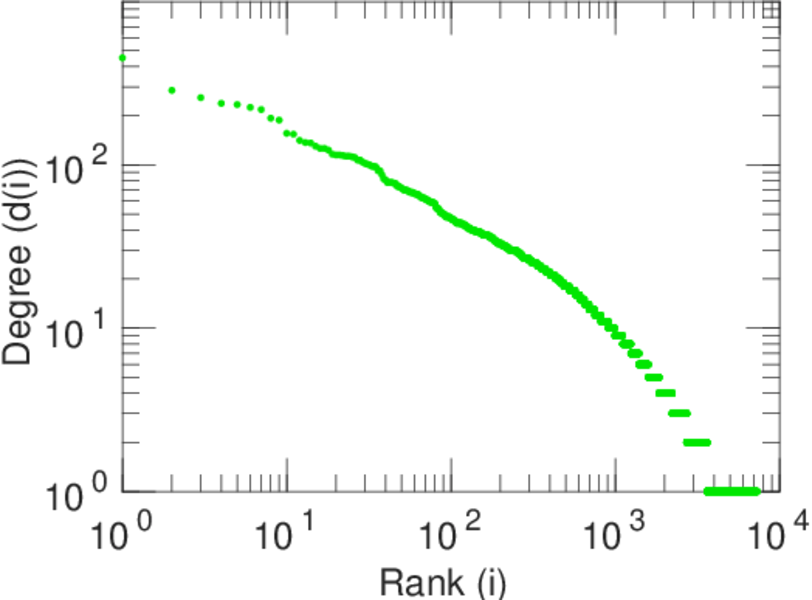
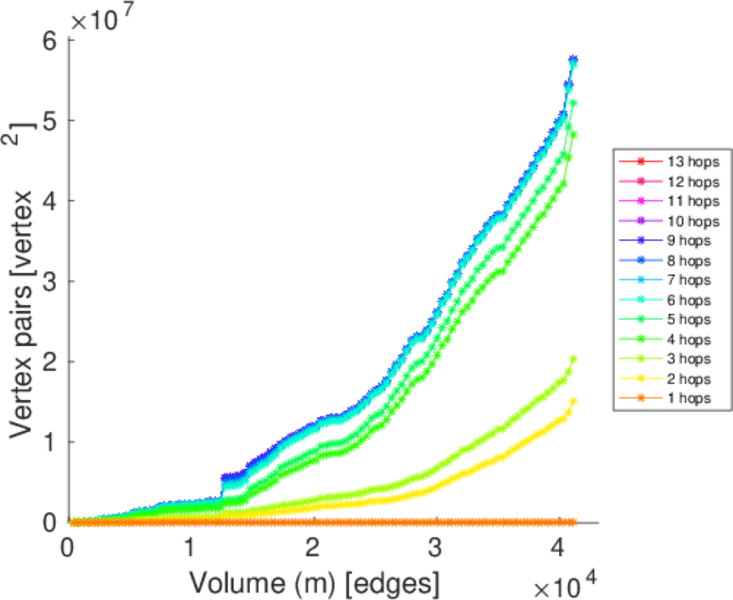
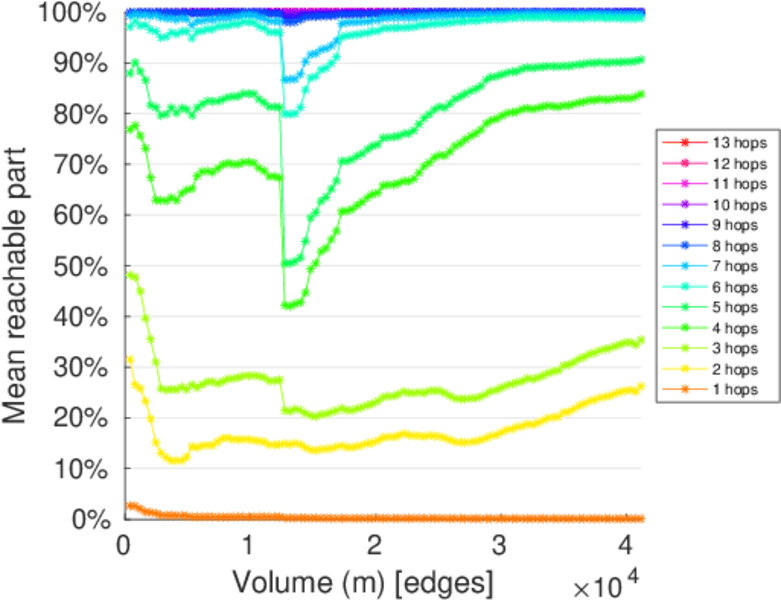
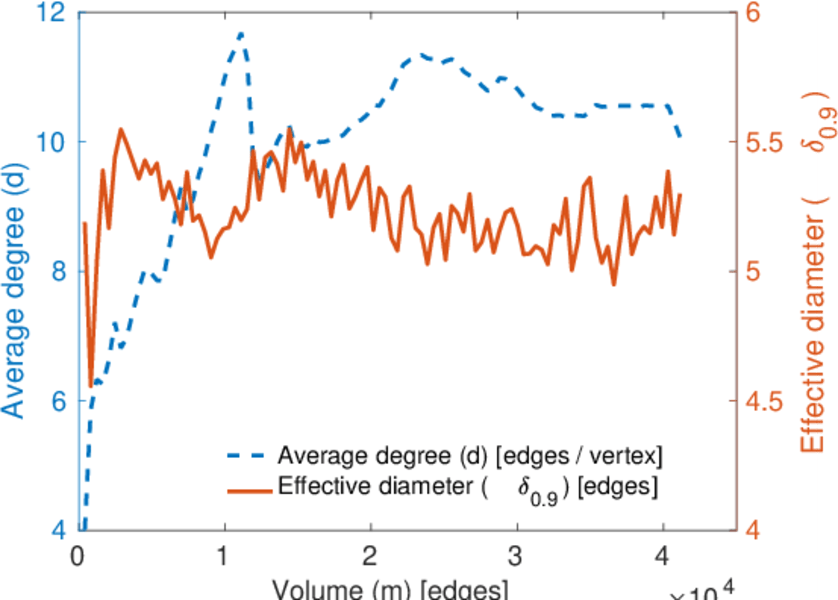
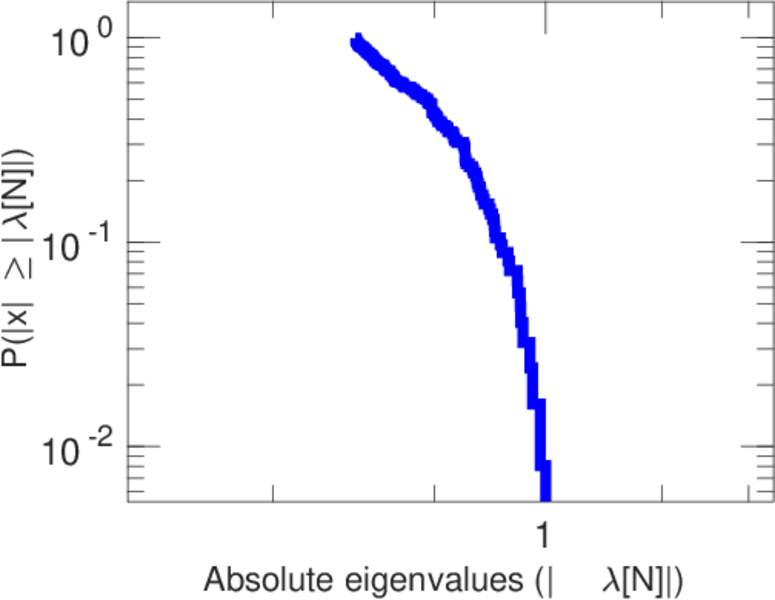
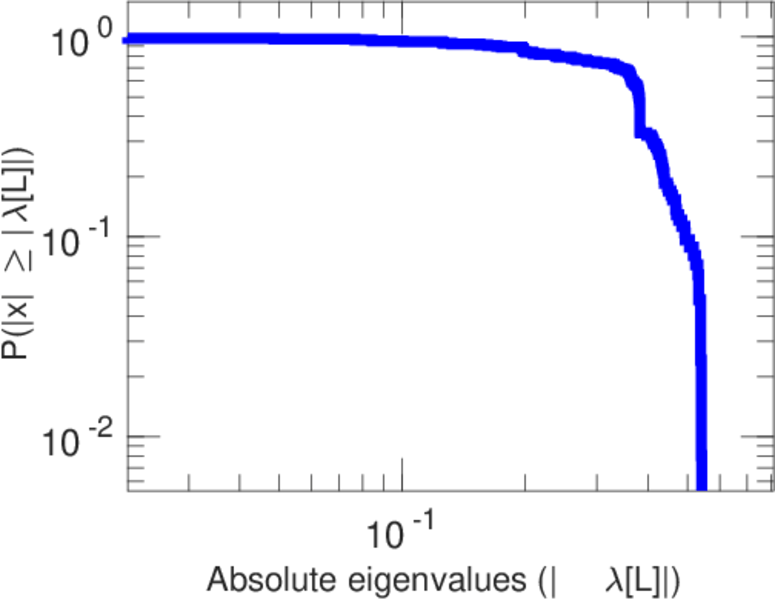
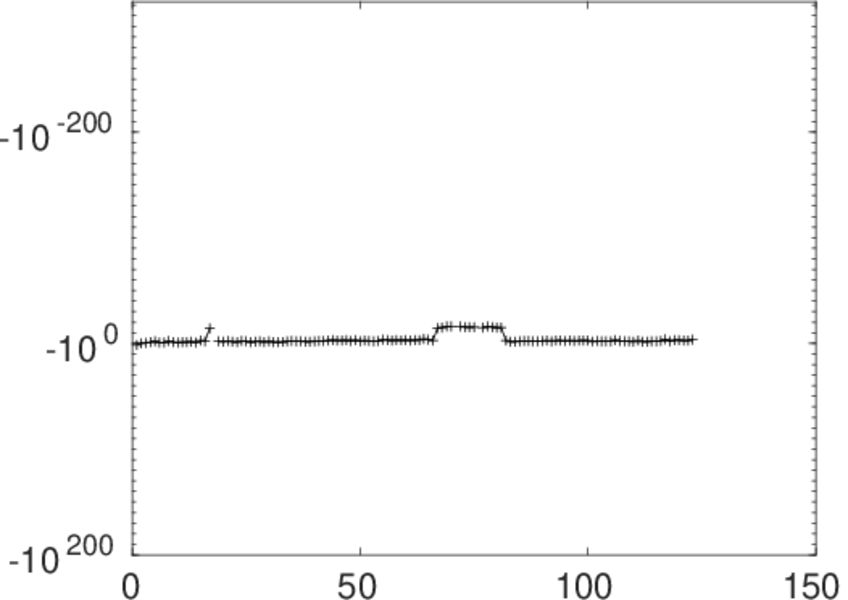
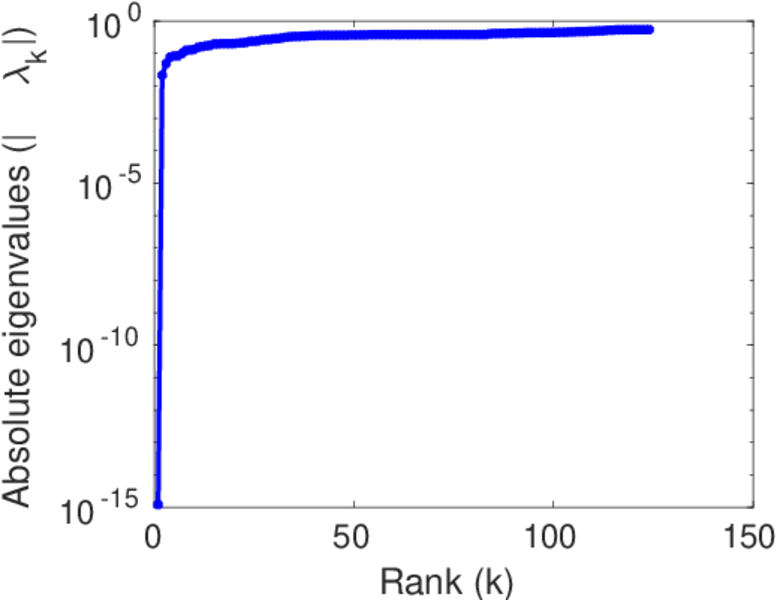
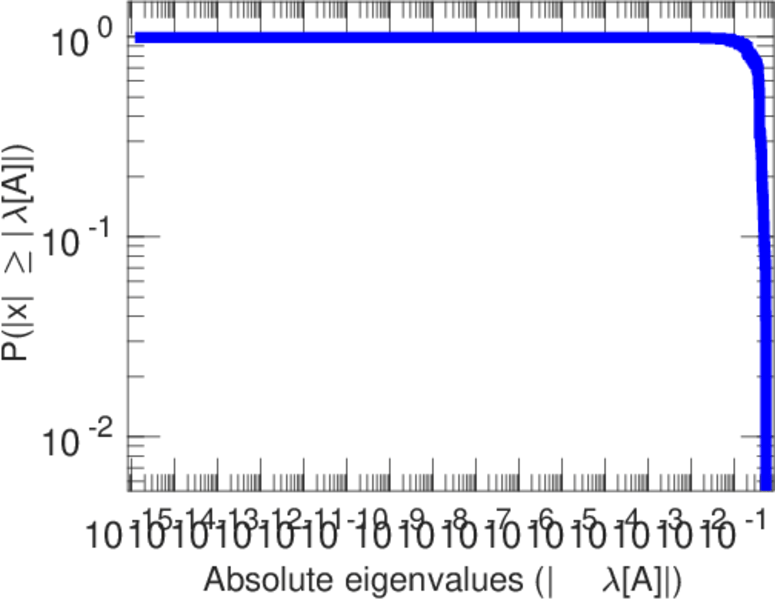
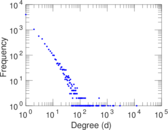
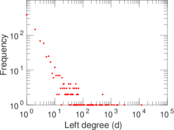
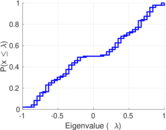
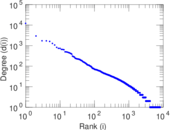
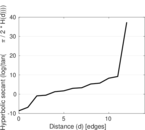
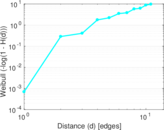
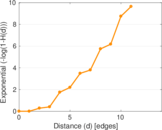
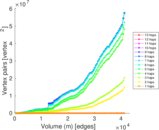
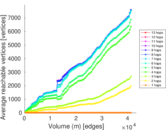
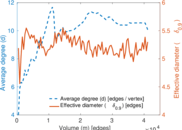
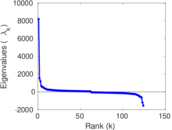
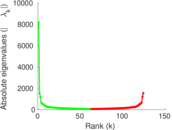
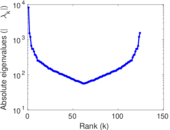
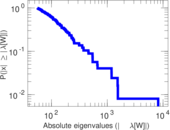
Plots


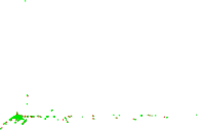
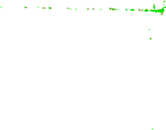


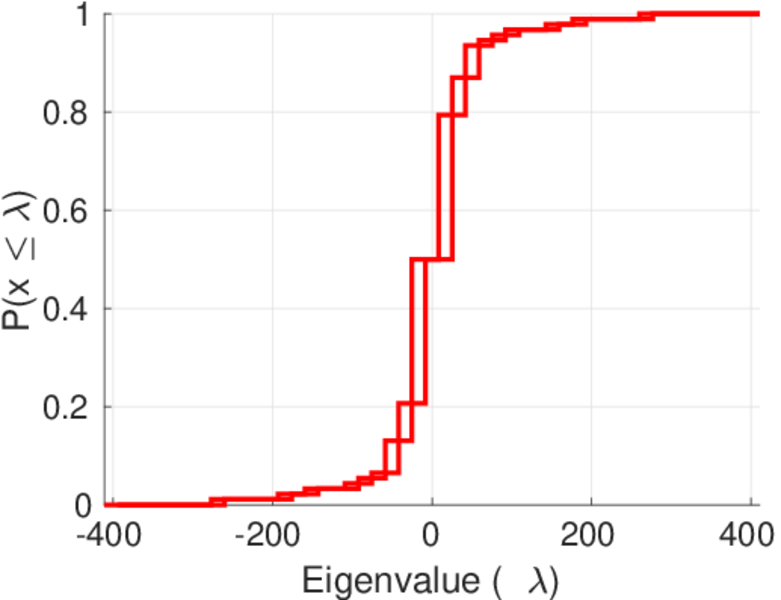
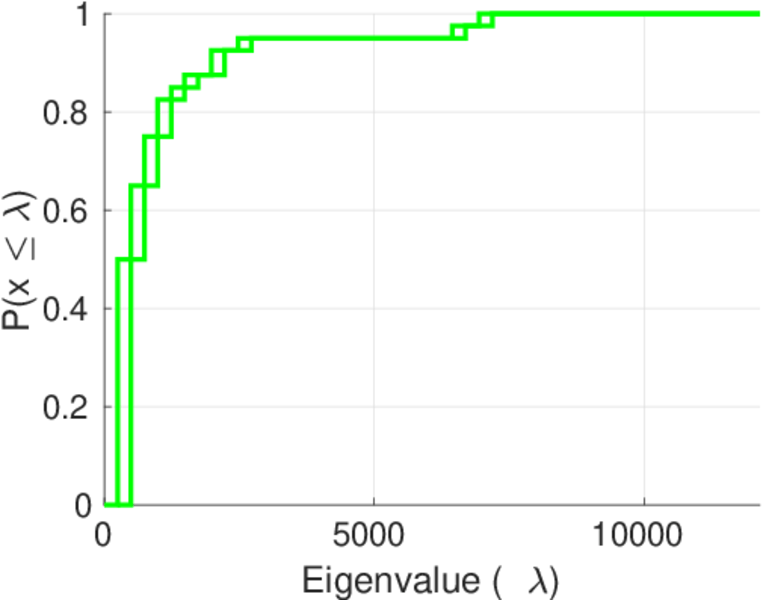
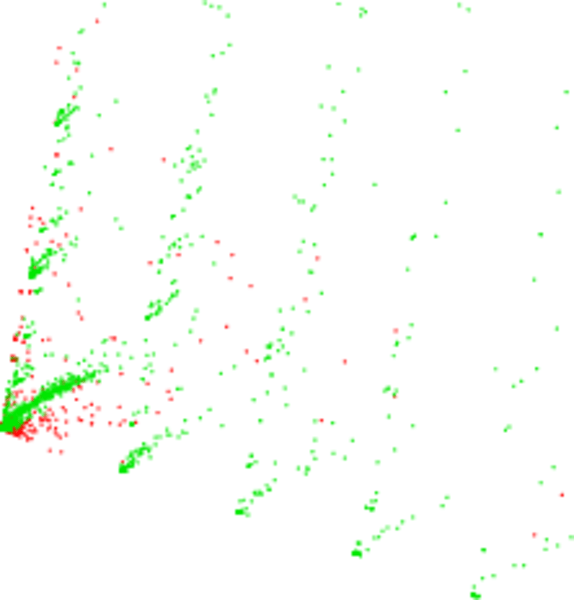
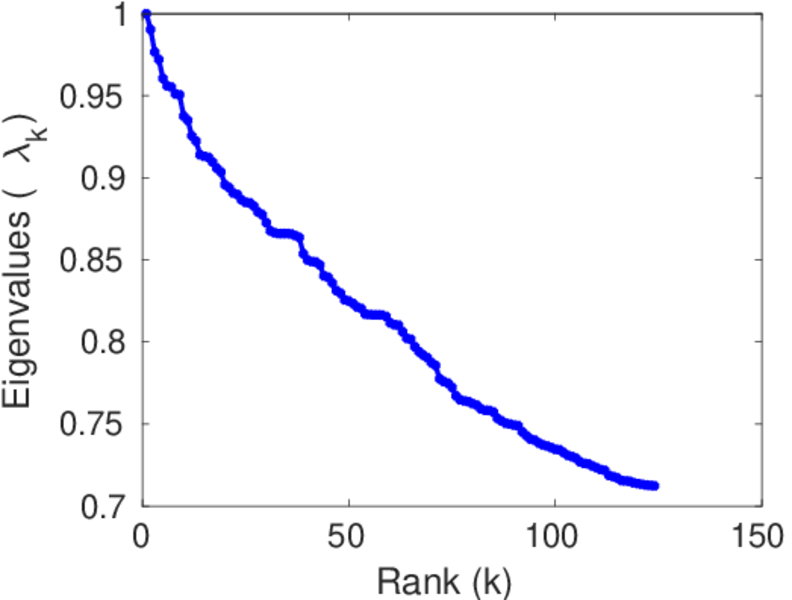
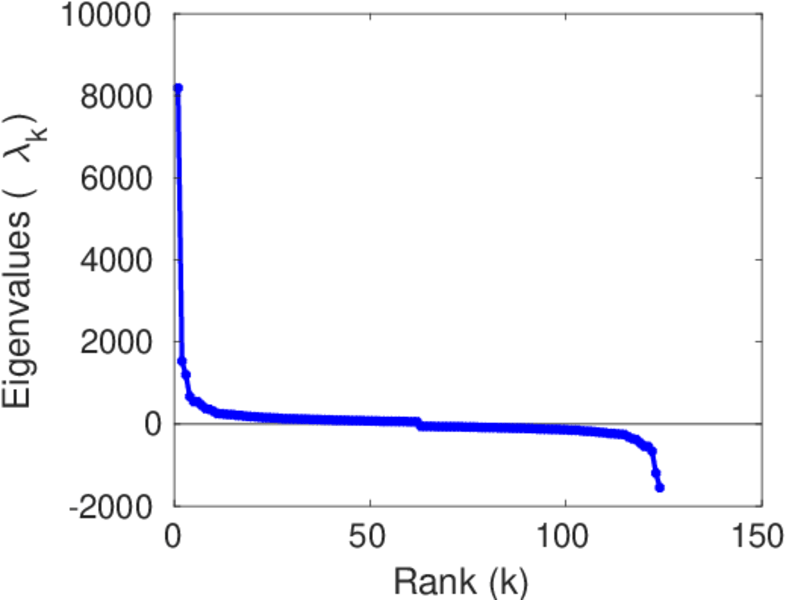
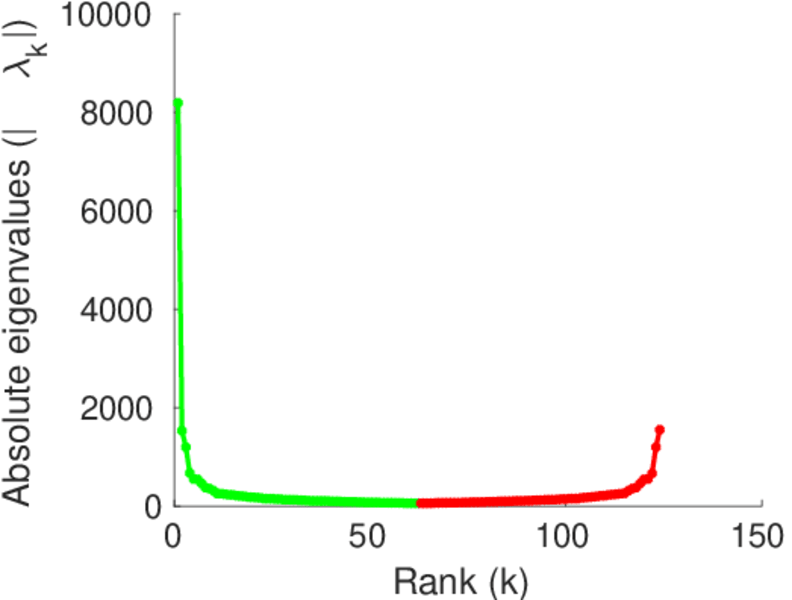
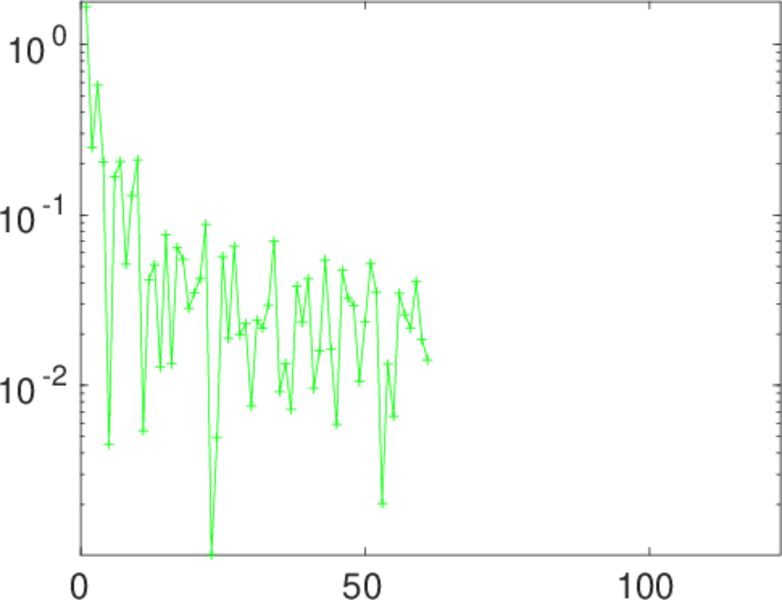
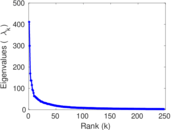
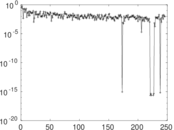
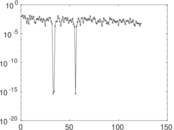
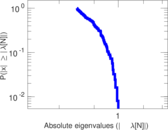
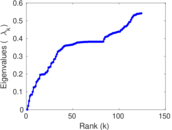
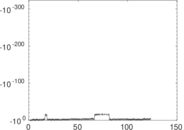
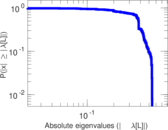
Matrix decompositions plots


Downloads
References
|
[1]
|
Jérôme Kunegis.
KONECT – The Koblenz Network Collection.
In Proc. Int. Conf. on World Wide Web Companion, pages
1343–1350, 2013.
[ http ]
|
|
[2]
|
Wikimedia Foundation.
Wikimedia downloads.
http://dumps.wikimedia.org/, January 2010.
|
 KONECT ‣ Networks ‣
Buy Me a Coffee
KONECT ‣ Networks ‣
Buy Me a Coffee