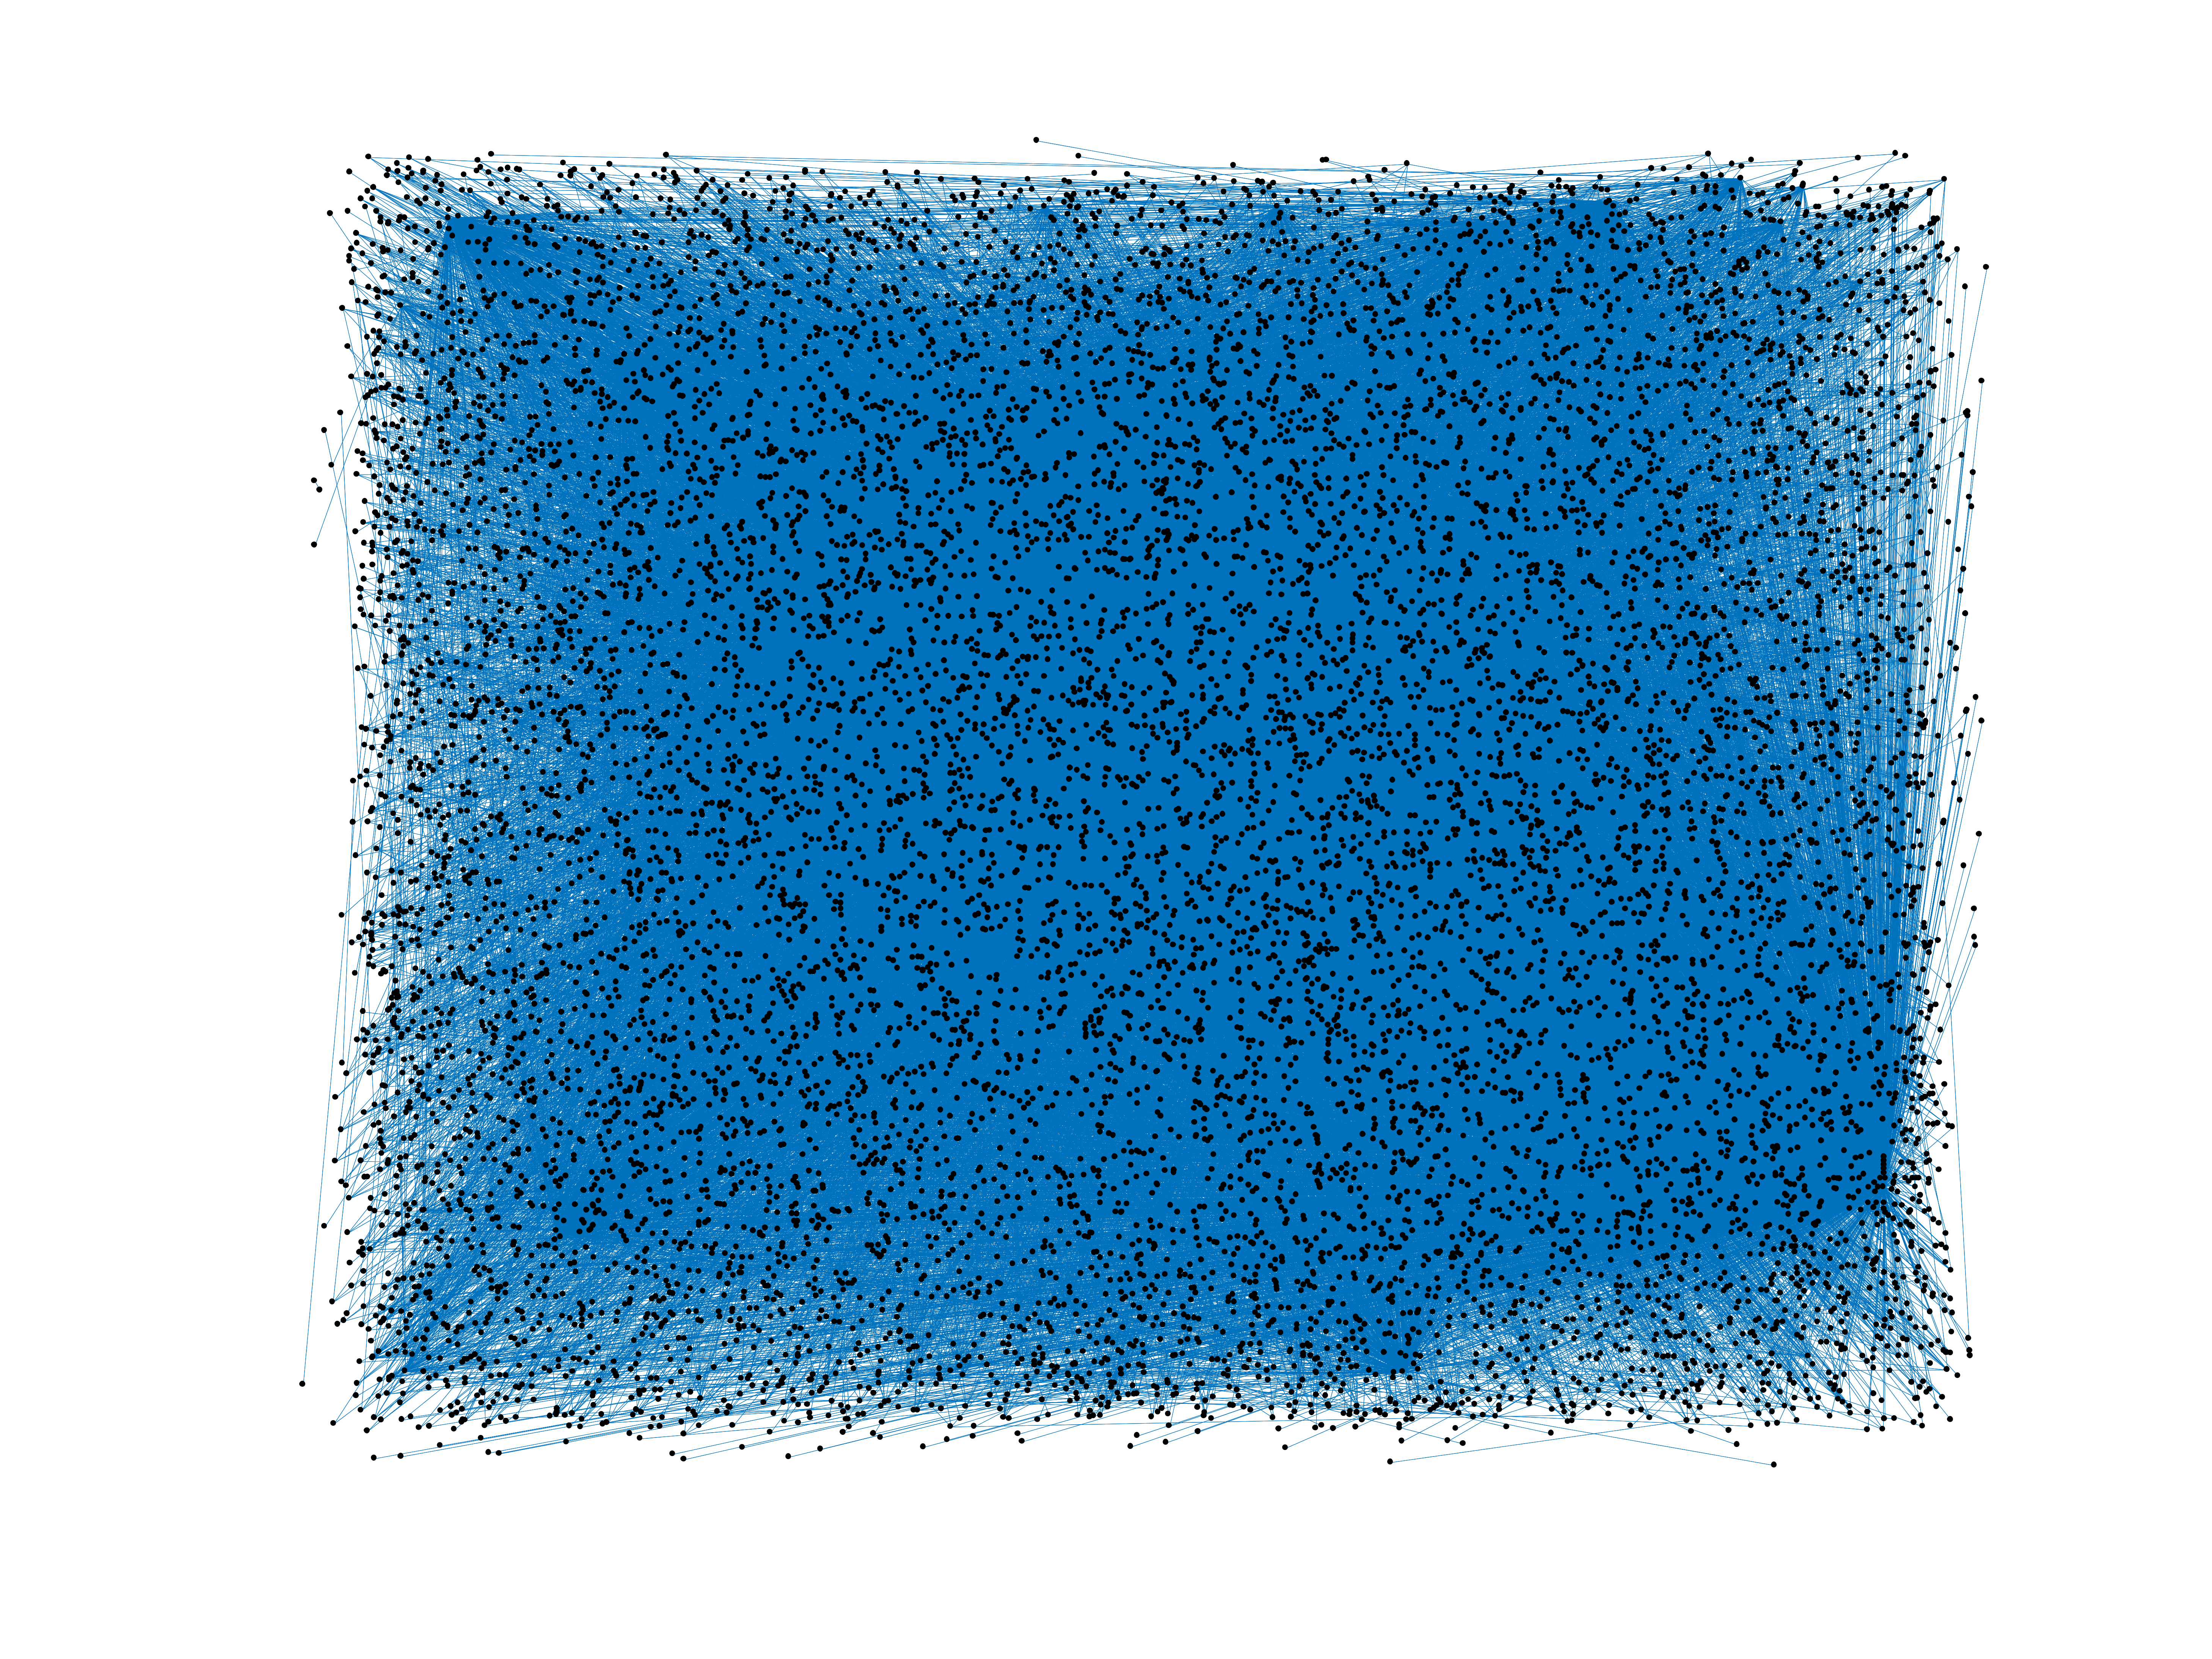
Wikinews edits (ca)
This is the bipartite edit network of the Catalan Wikinews. It contains users
and pages from the Catalan Wikinews, connected by edit events. Each edge
represents an edit. The dataset includes the timestamp of each edit.
Metadata
Statistics
| Size | n = | 11,942
|
| Left size | n1 = | 818
|
| Right size | n2 = | 11,124
|
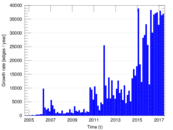
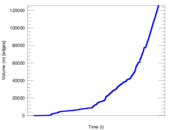
| Volume | m = | 125,869
|
| Unique edge count | m̿ = | 28,593
|
| Wedge count | s = | 33,049,321
|
| Claw count | z = | 43,838,339,691
|
| Cross count | x = | 49,146,079,396,784
|
| Square count | q = | 10,222,278
|
| 4-Tour count | T4 = | 214,062,578
|
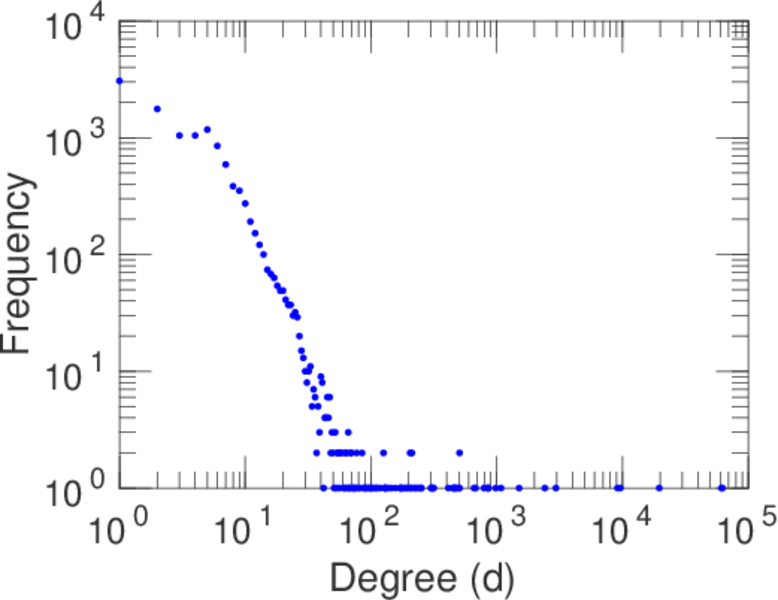
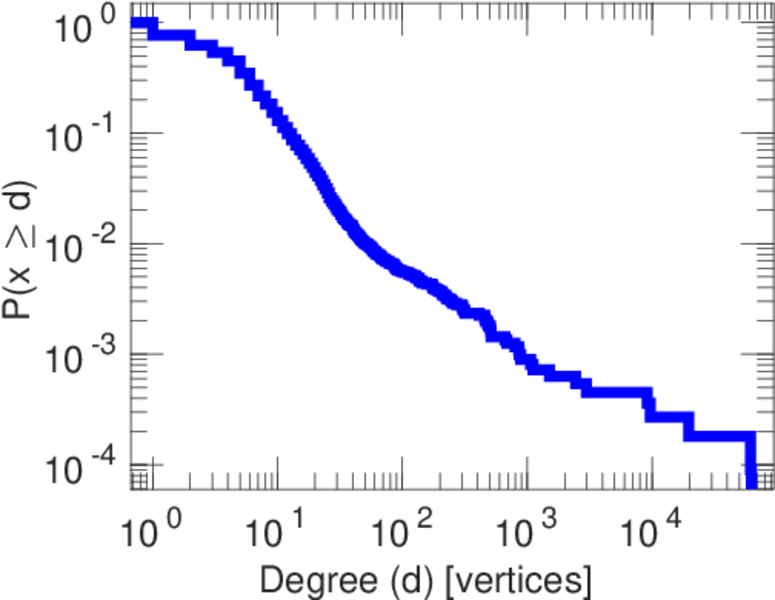
| Maximum degree | dmax = | 62,477
|
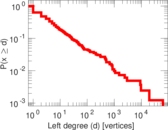
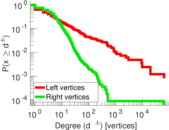
| Maximum left degree | d1max = | 62,477
|
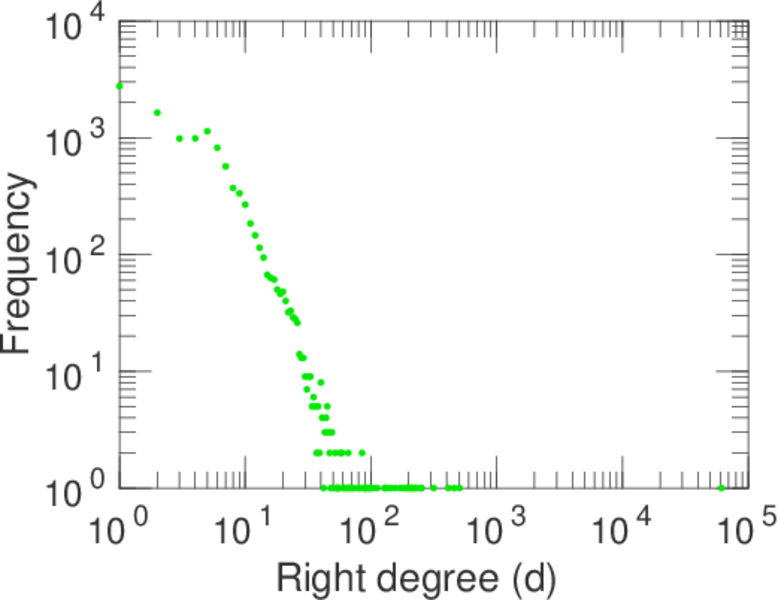
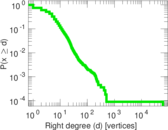
| Maximum right degree | d2max = | 61,300
|
| Average degree | d = | 21.080 1
|
| Average left degree | d1 = | 153.874
|
| Average right degree | d2 = | 11.315 1
|
| Fill | p = | 0.003 142 28
|
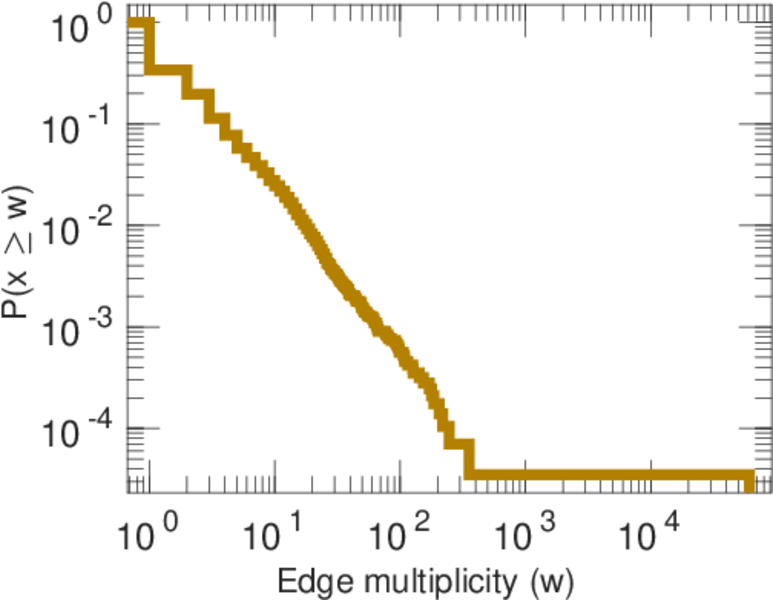
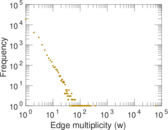
| Average edge multiplicity | m̃ = | 4.402 09
|
| Size of LCC | N = | 11,614
|
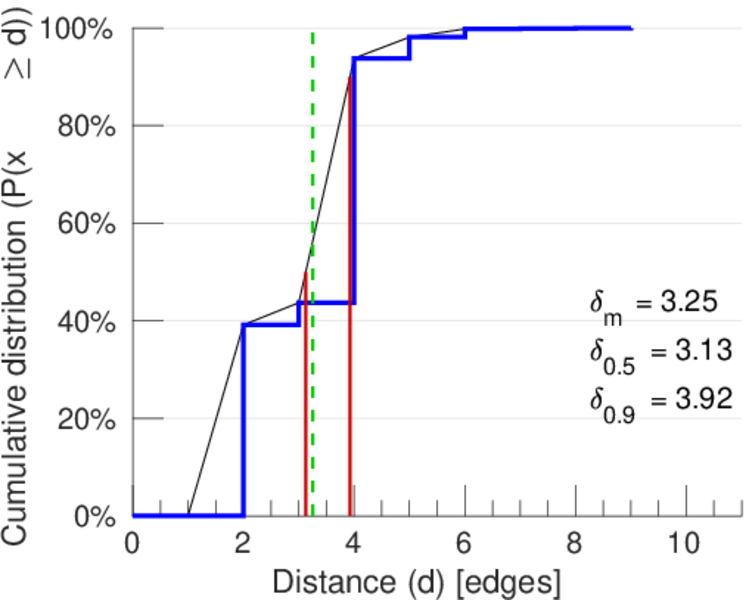
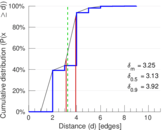
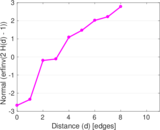
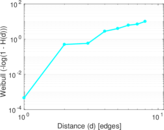
| Diameter | δ = | 10
|
| 50-Percentile effective diameter | δ0.5 = | 3.125 98
|
| 90-Percentile effective diameter | δ0.9 = | 3.924 18
|
| Median distance | δM = | 4
|
| Mean distance | δm = | 3.254 84
|
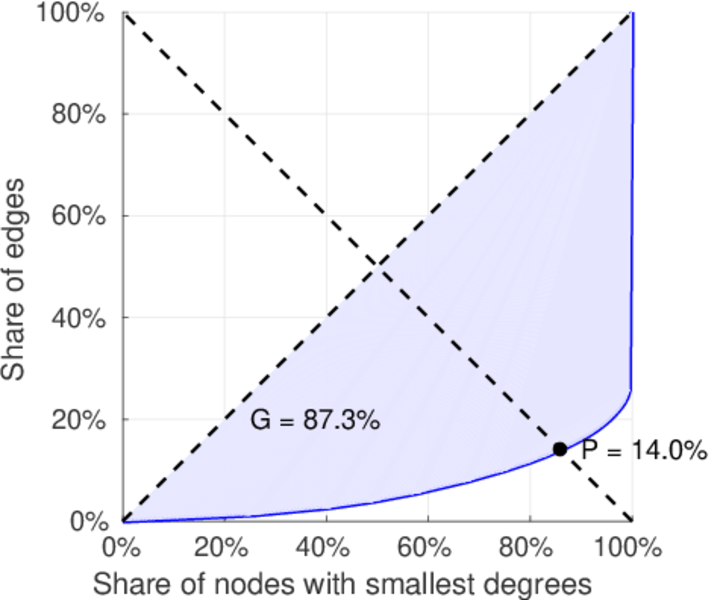
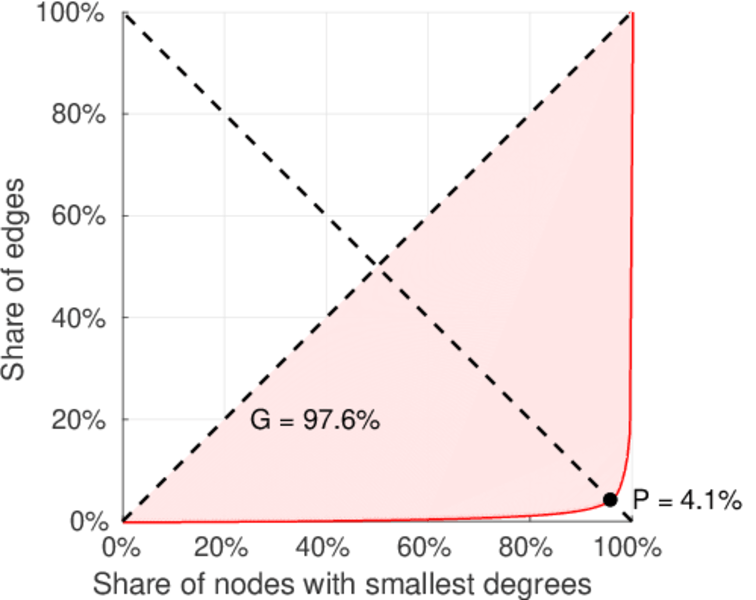
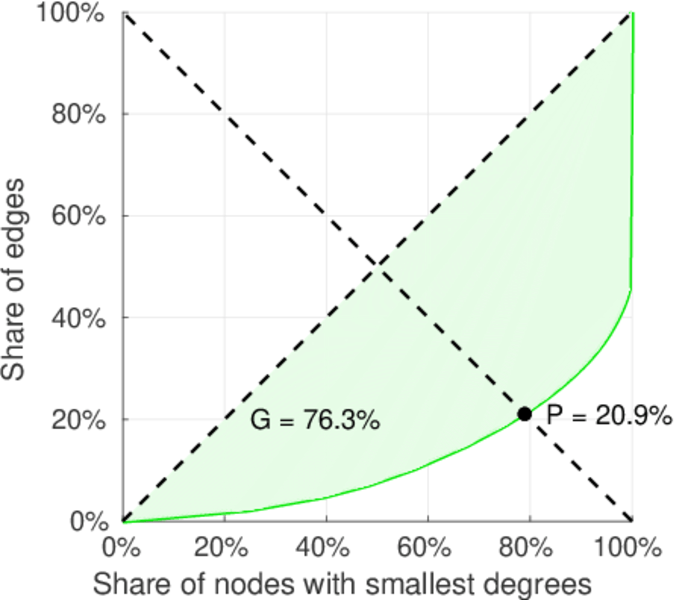
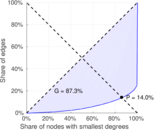
| Gini coefficient | G = | 0.873 556
|
| Balanced inequality ratio | P = | 0.138 982
|
| Left balanced inequality ratio | P1 = | 0.040 748 7
|
| Right balanced inequality ratio | P2 = | 0.209 098
|
| Relative edge distribution entropy | Her = | 0.737 244
|
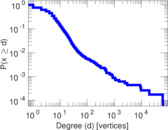
| Power law exponent | γ = | 2.426 19
|
| Tail power law exponent | γt = | 2.841 00
|
| Tail power law exponent with p | γ3 = | 2.841 00
|
| p-value | p = | 0.000 00
|
| Left tail power law exponent with p | γ3,1 = | 1.751 00
|
| Left p-value | p1 = | 0.124 000
|
| Right tail power law exponent with p | γ3,2 = | 5.381 00
|
| Right p-value | p2 = | 0.072 000 0
|
| Degree assortativity | ρ = | −0.286 644
|
| Degree assortativity p-value | pρ = | 0.000 00
|
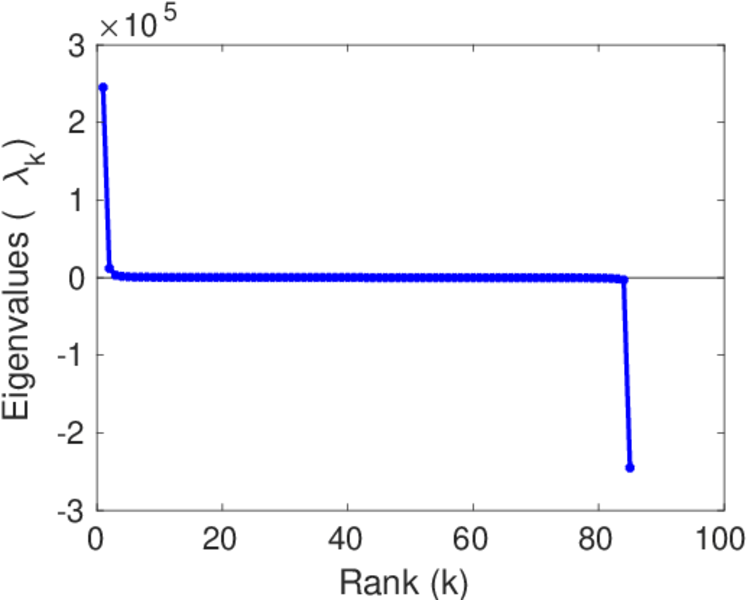
| Spectral norm | α = | 61,293.0
|
| Algebraic connectivity | a = | 0.039 669 5
|
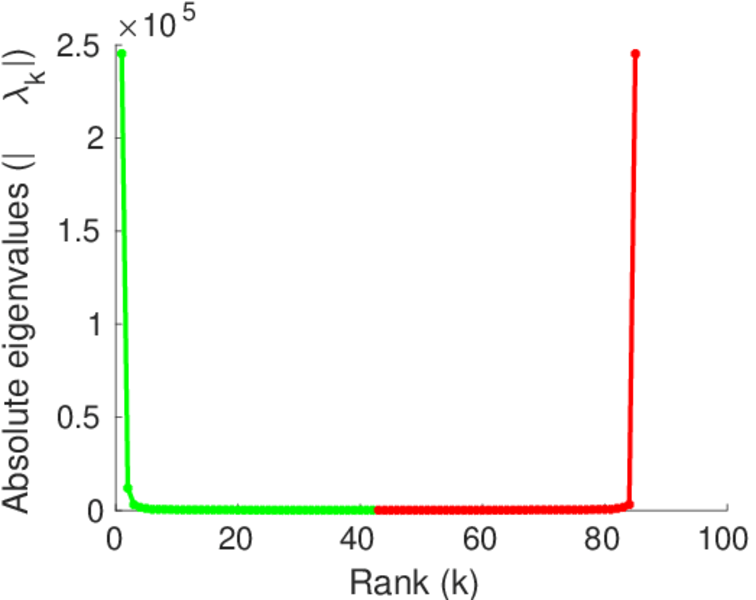
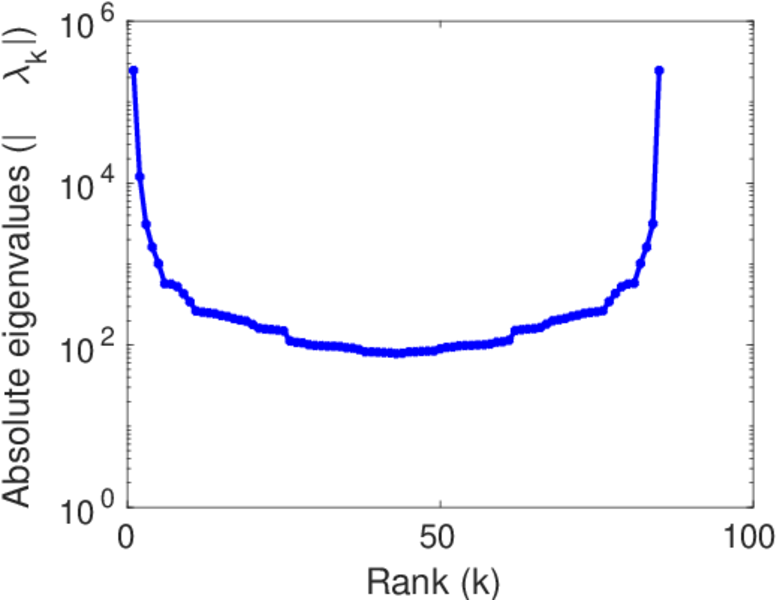
| Spectral separation | |λ1[A] / λ2[A]| = | 76.128 9
|
| Controllability | C = | 10,700
|
| Relative controllability | Cr = | 0.896 899
|
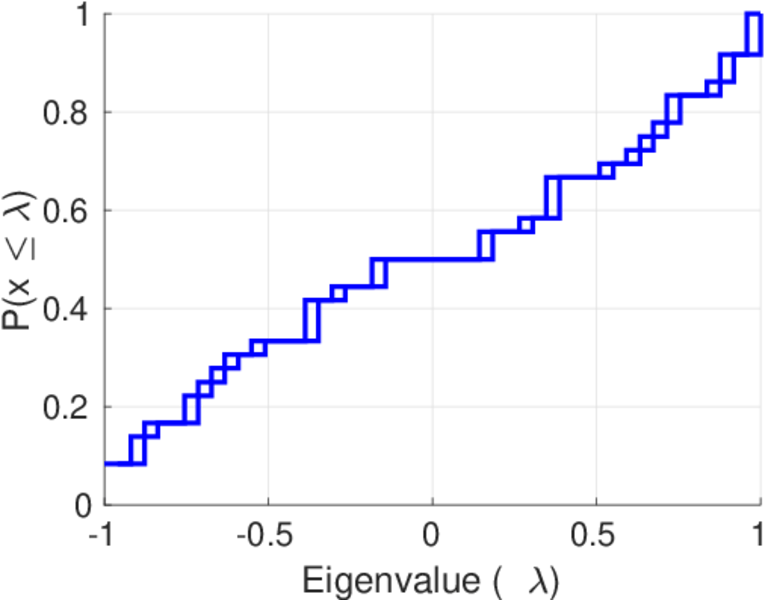
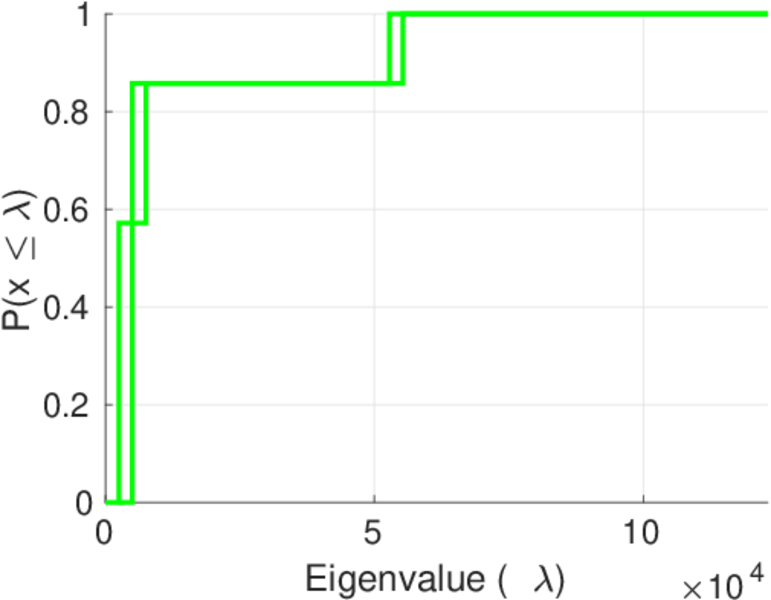
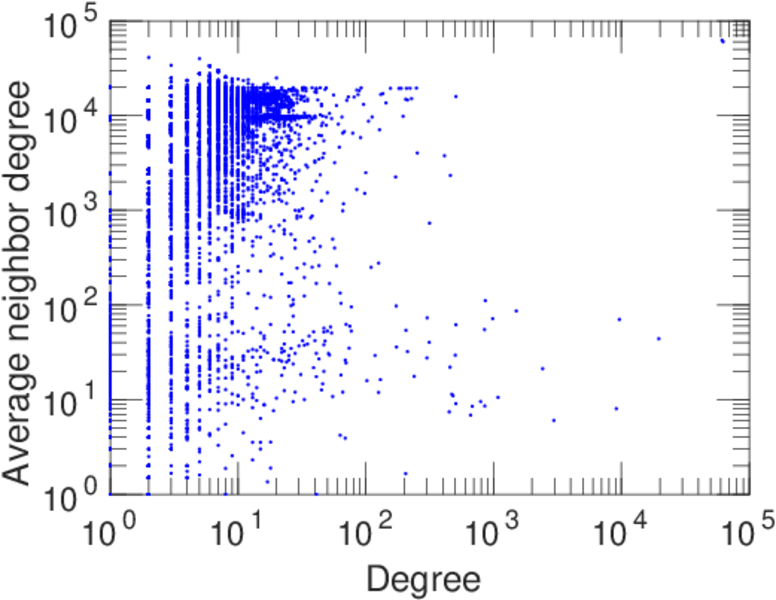
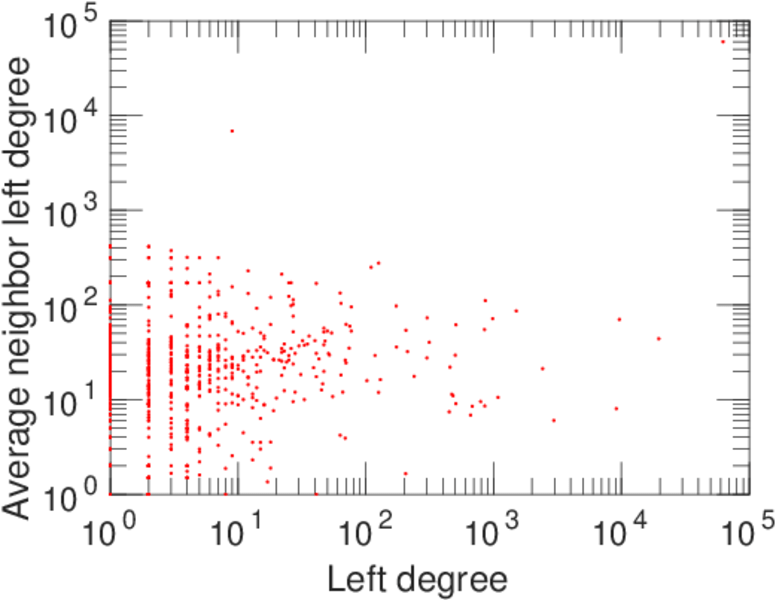
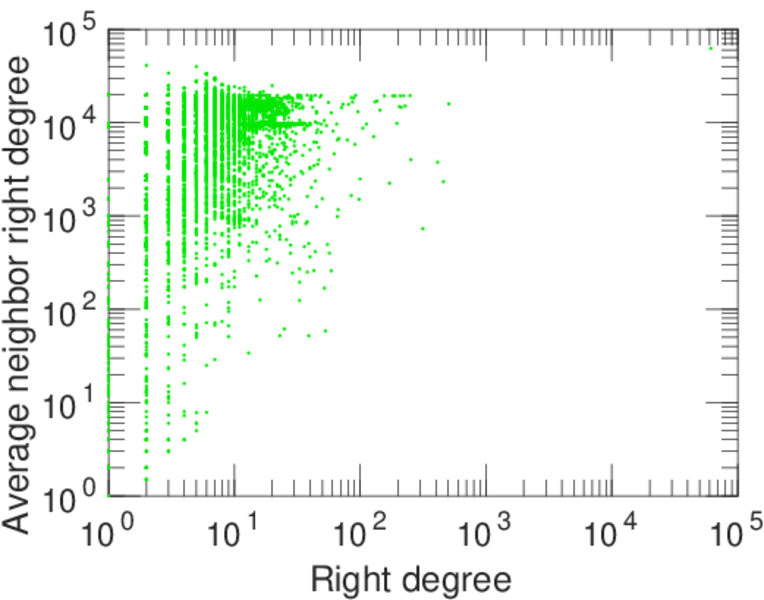
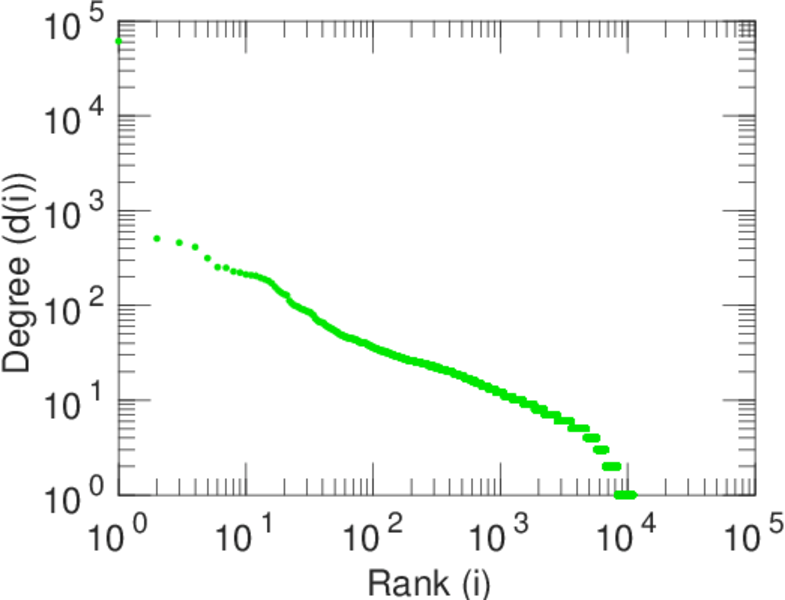
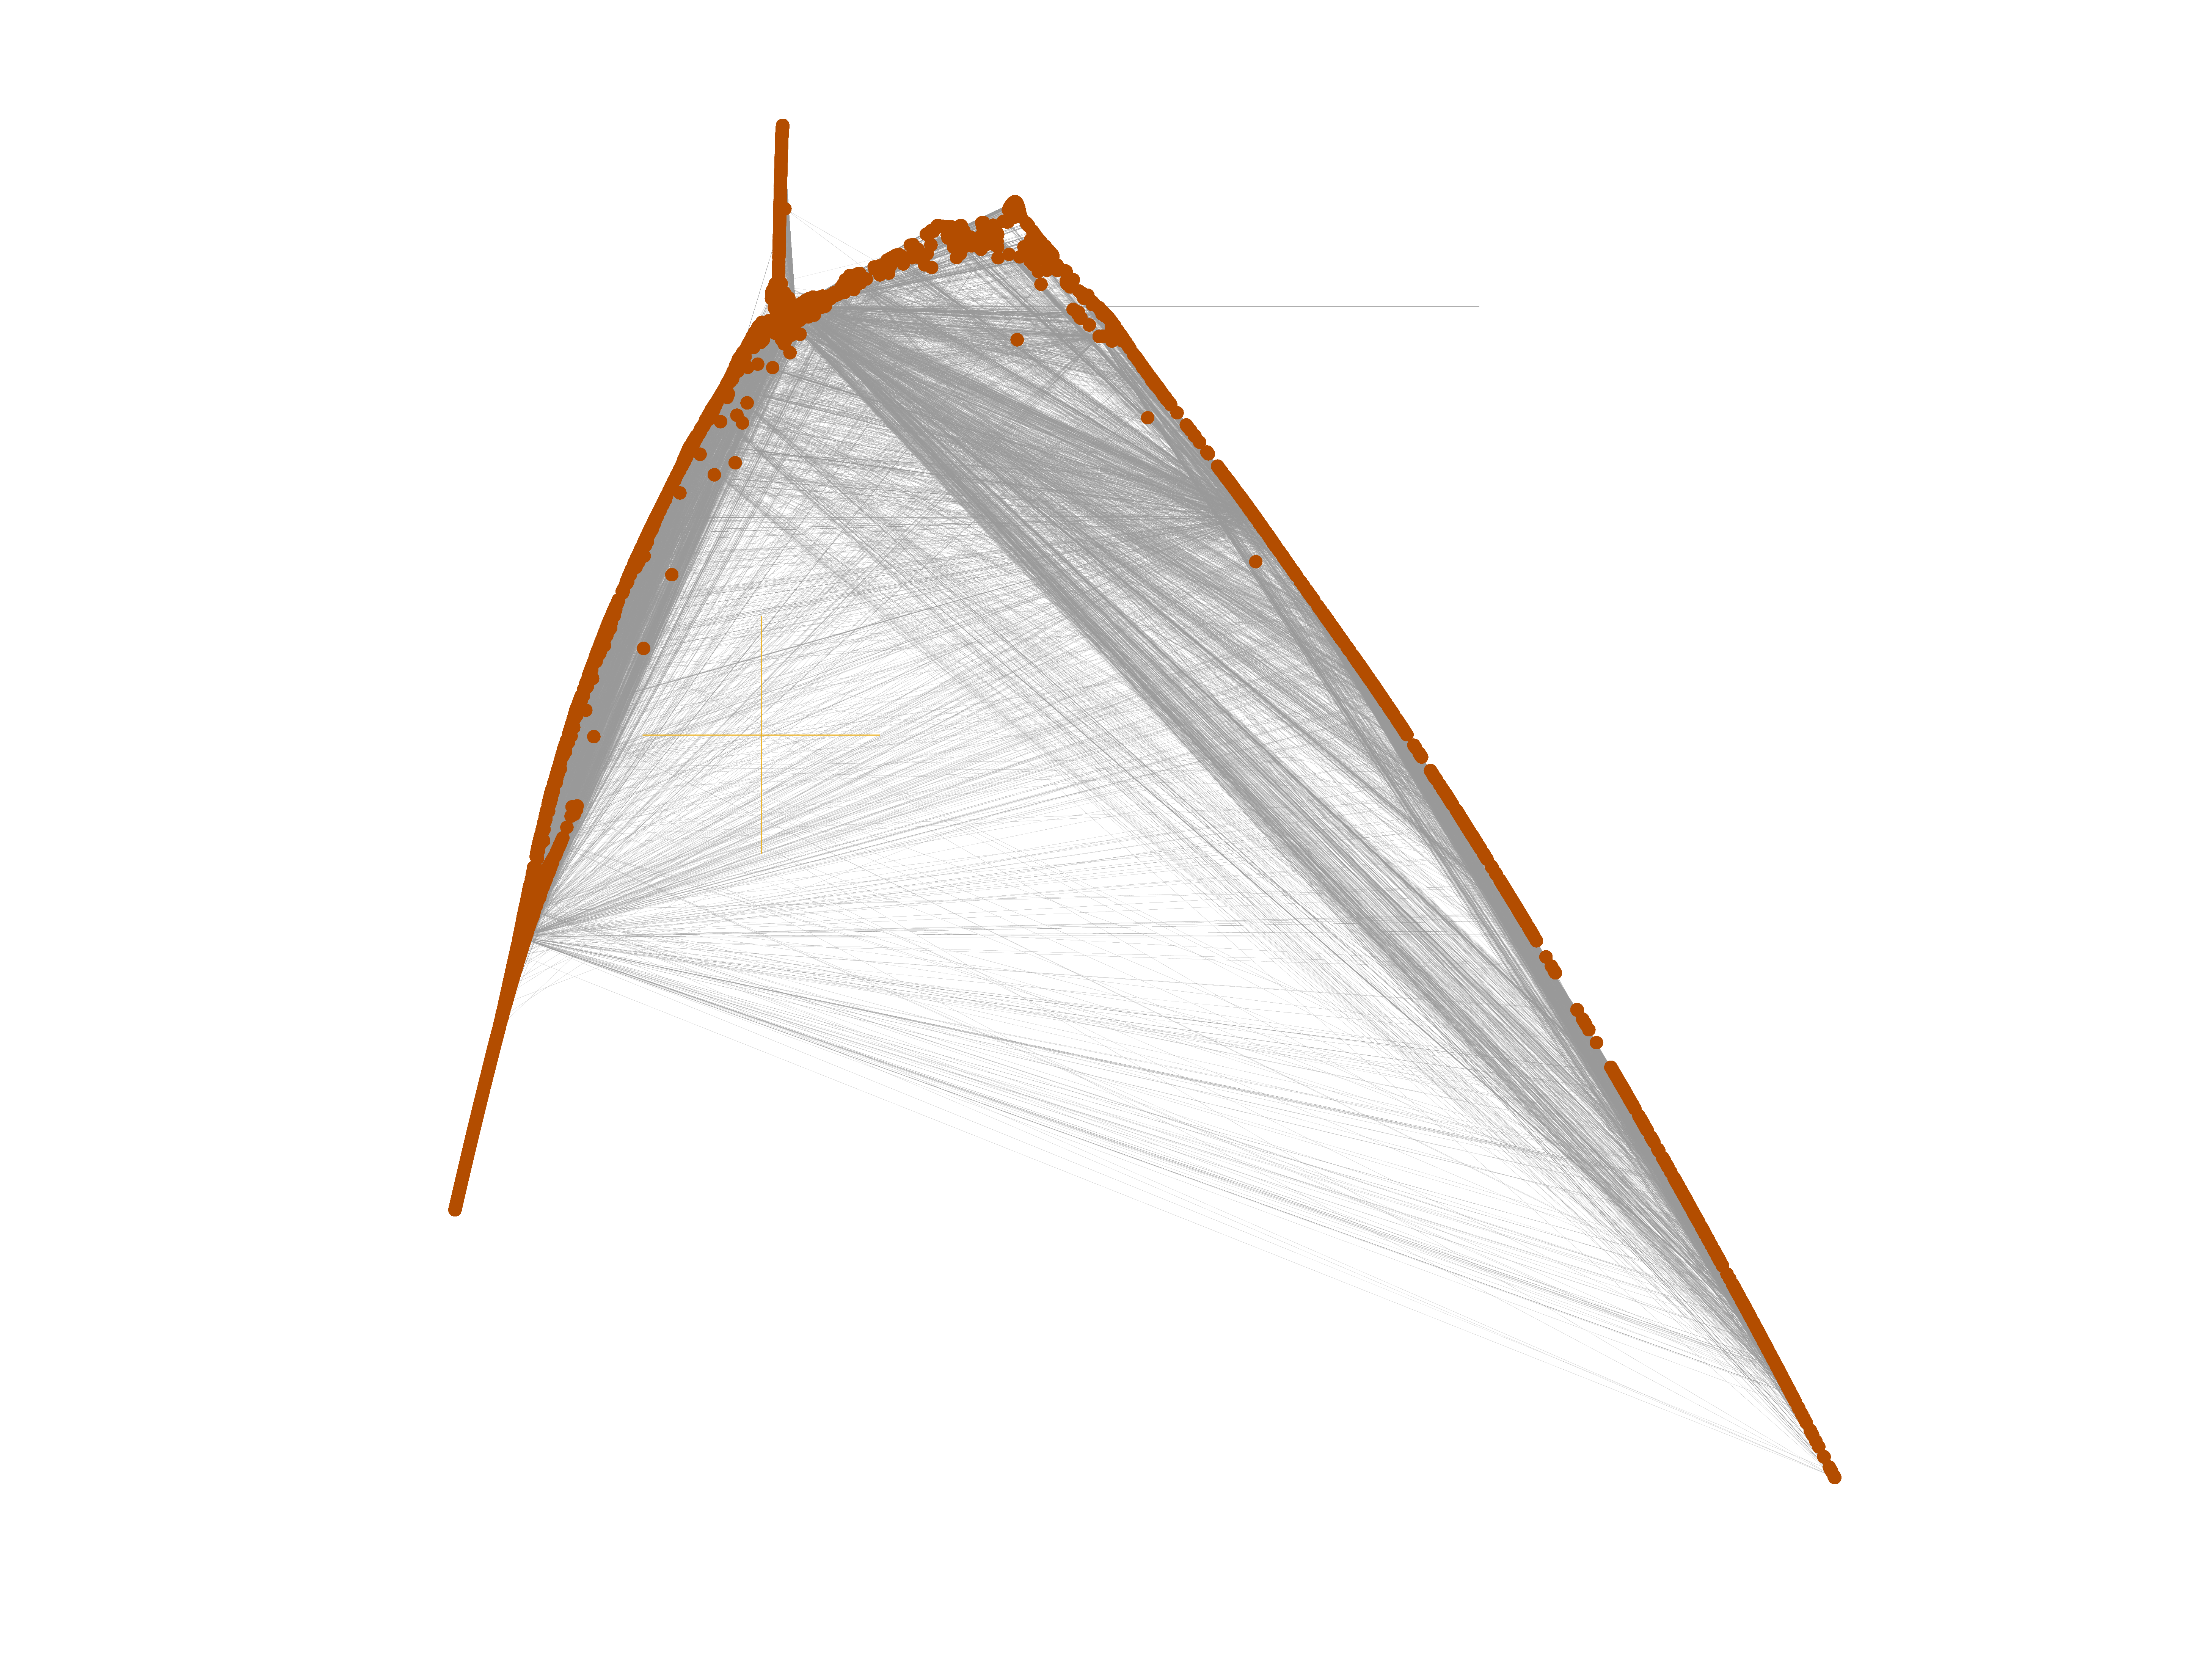
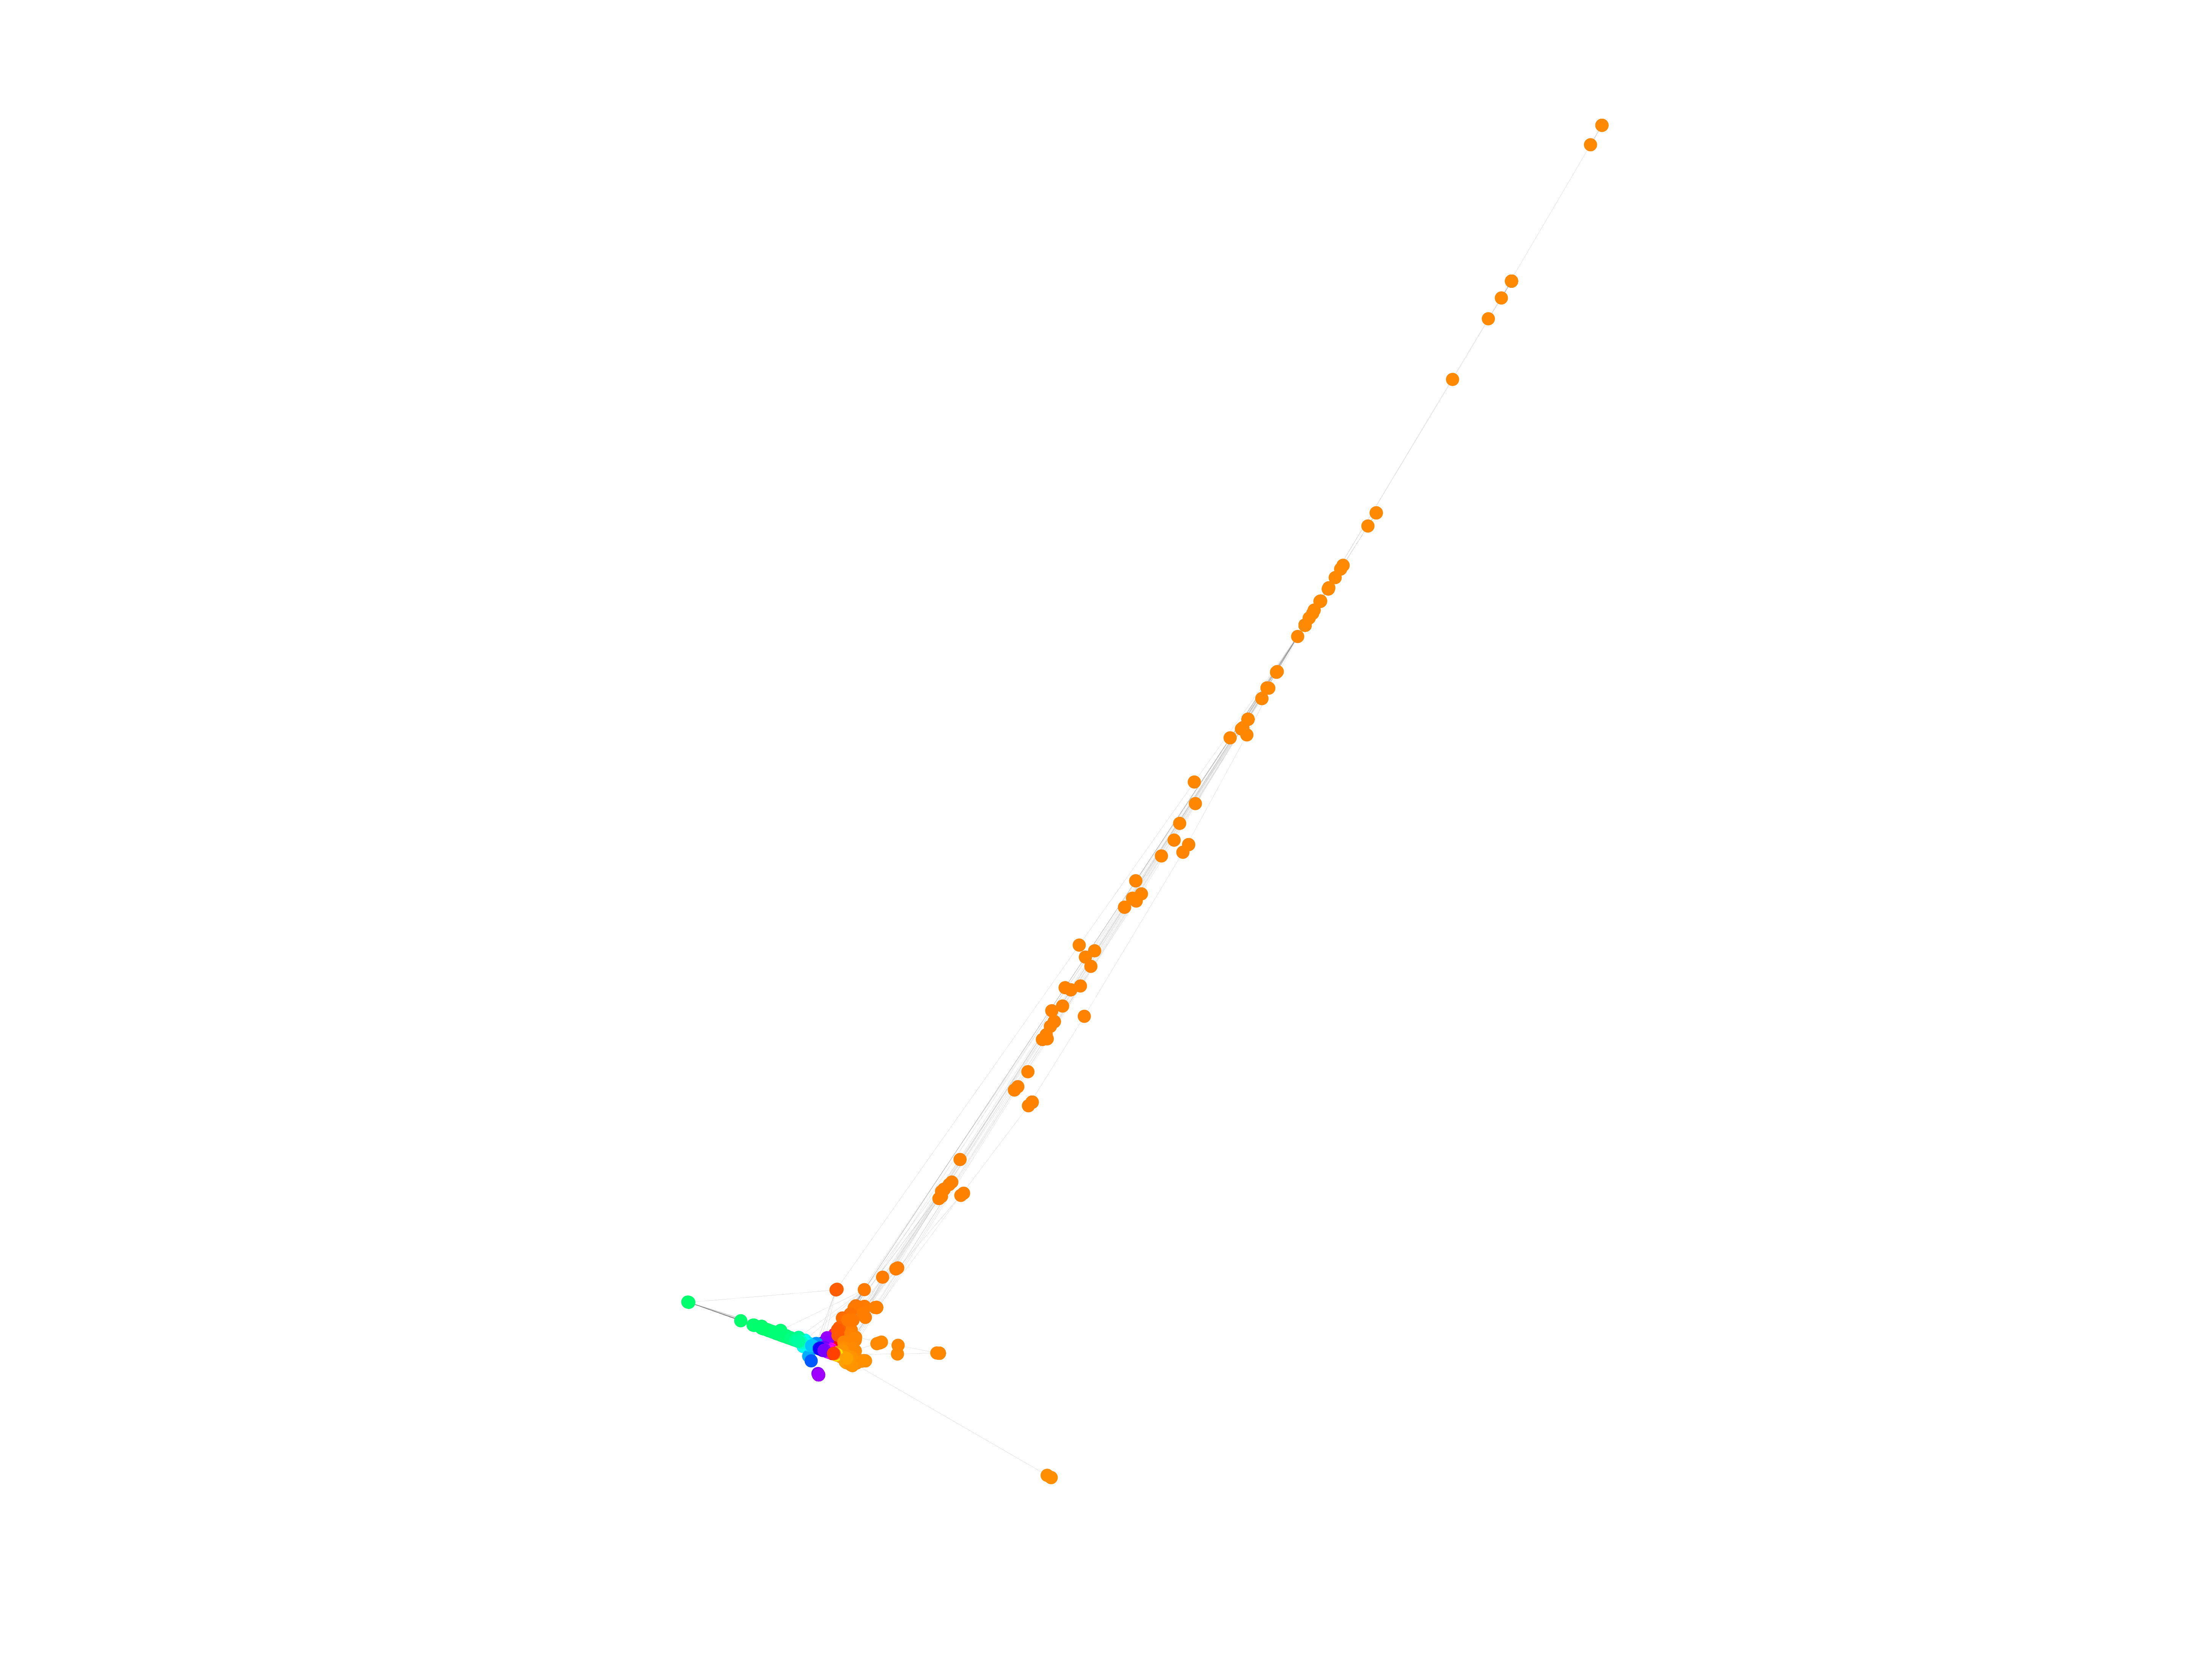
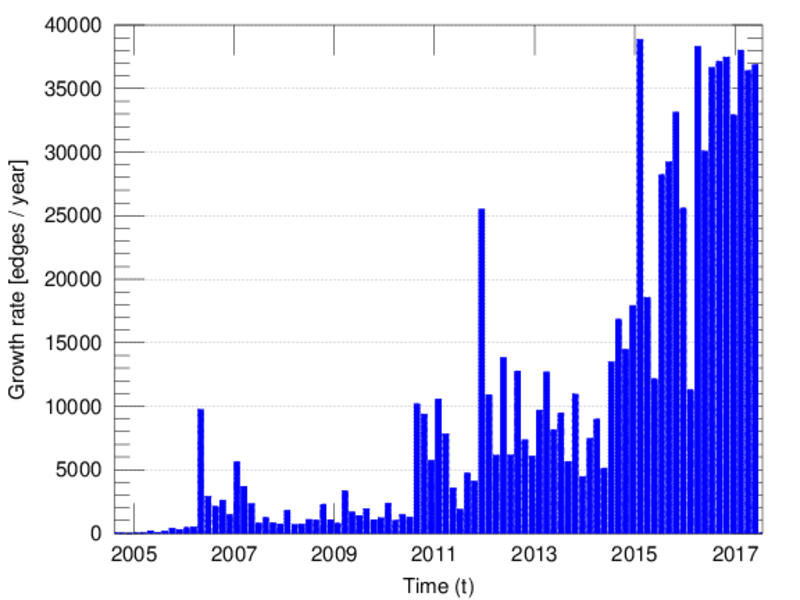
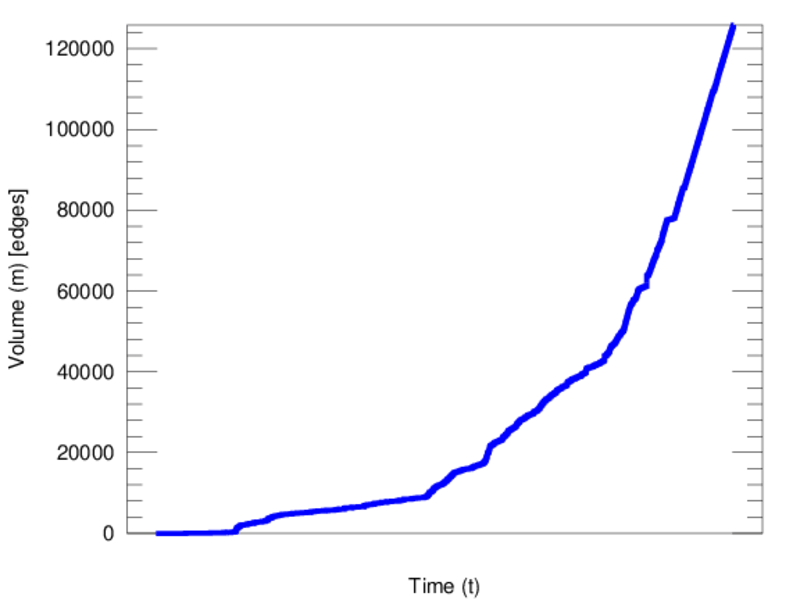
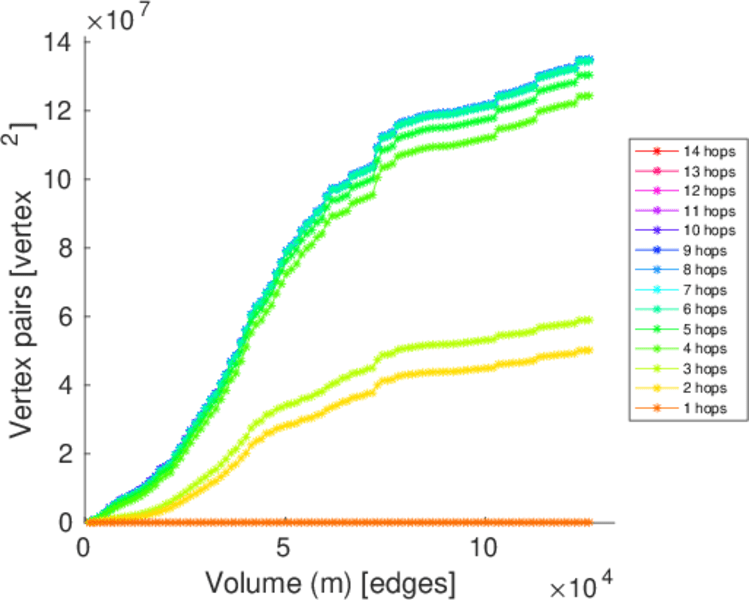
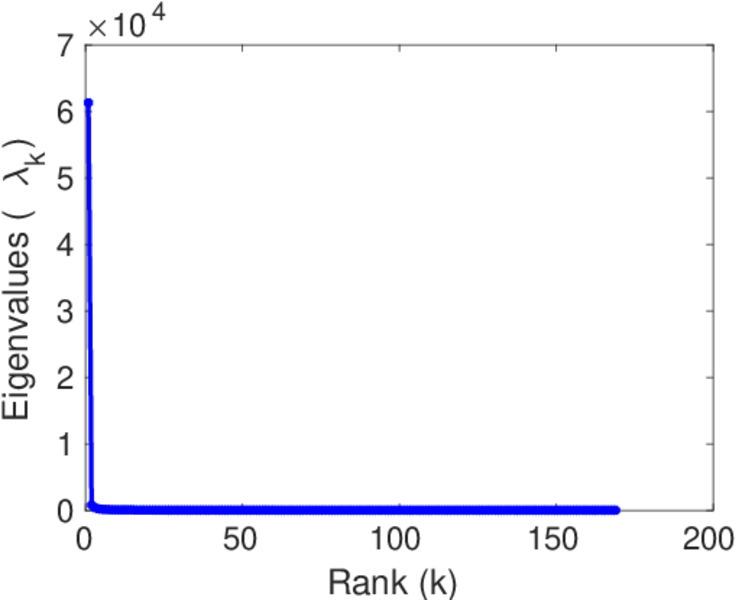
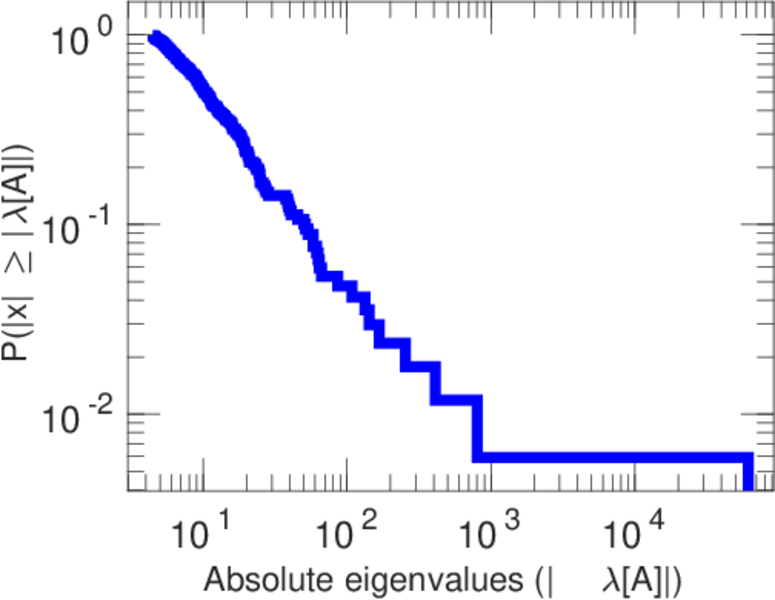
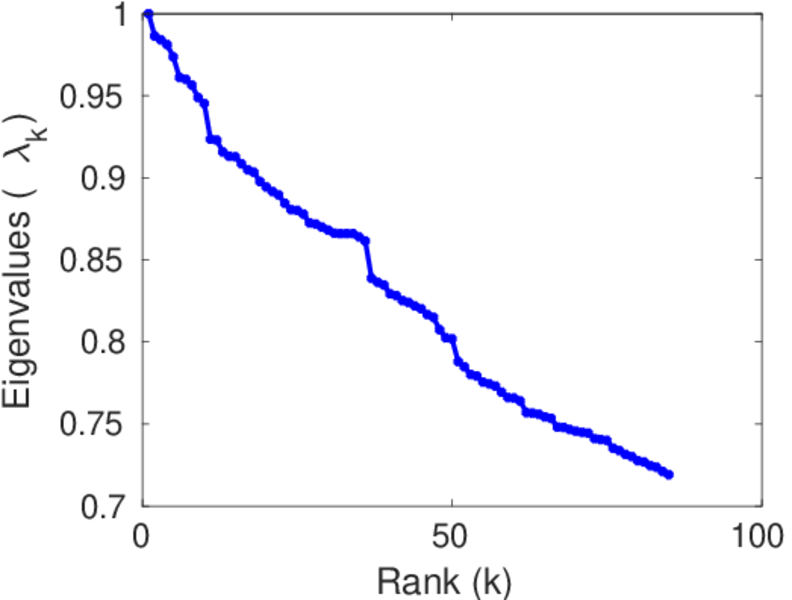
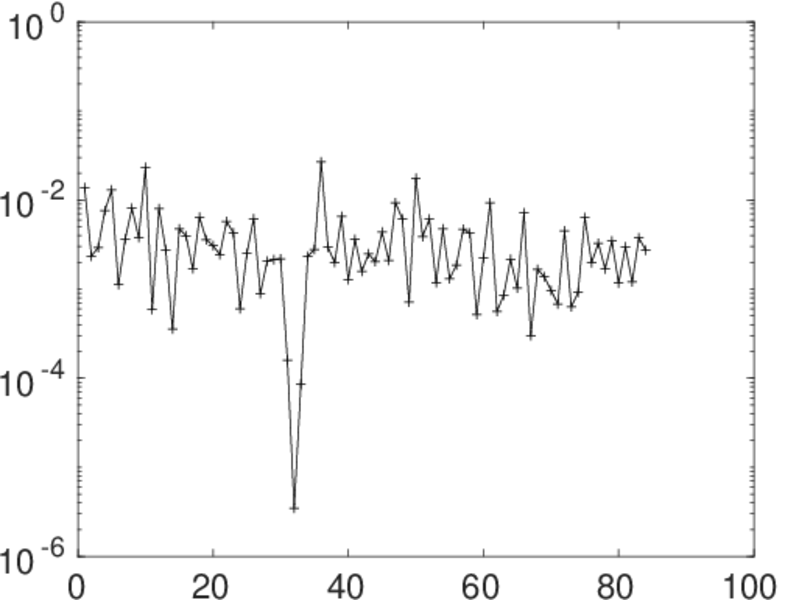
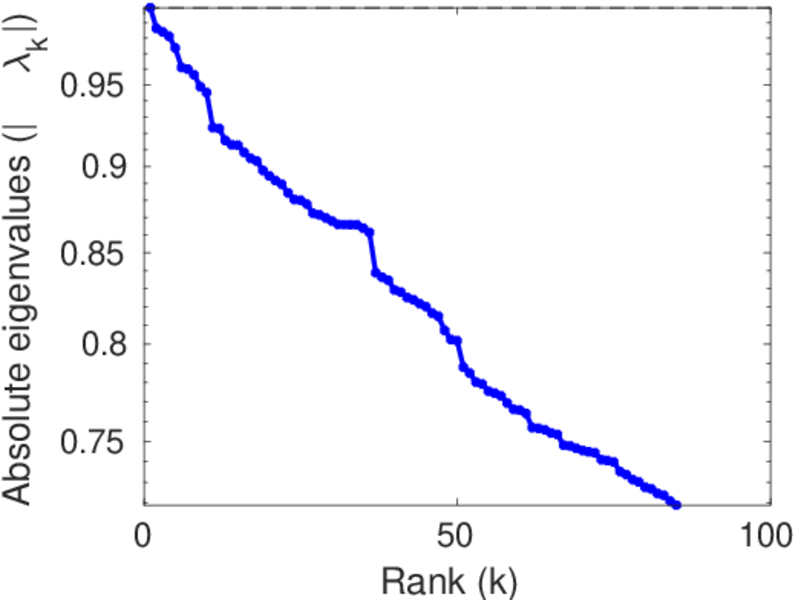
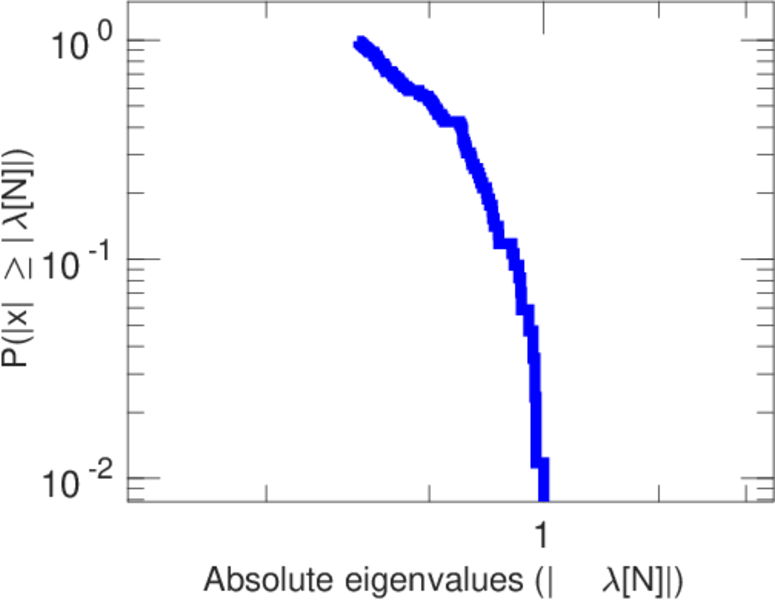
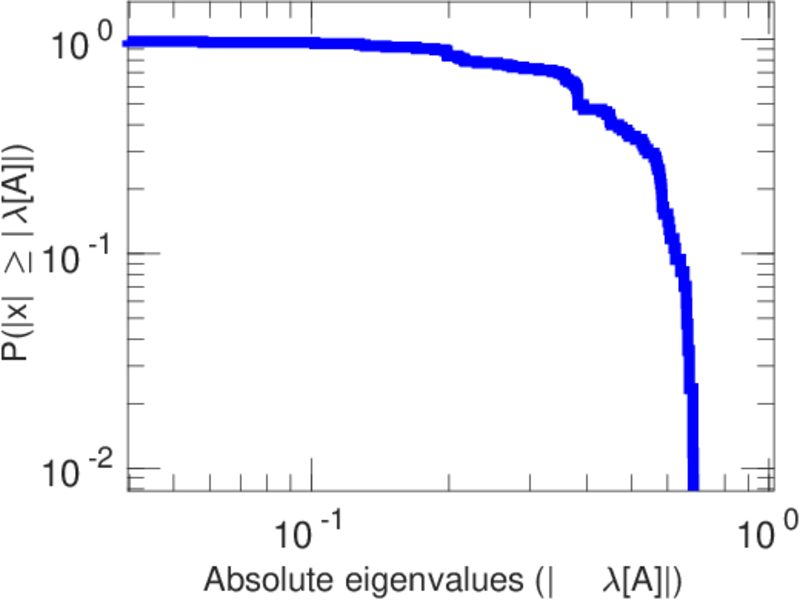
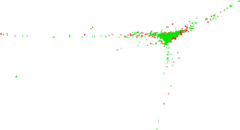
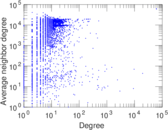
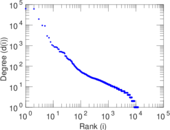
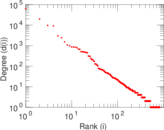
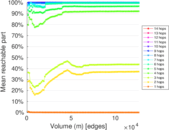
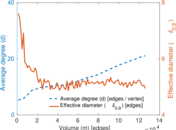
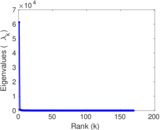
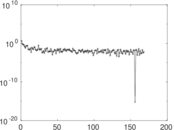
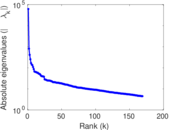
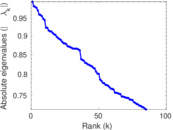
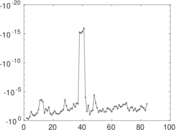
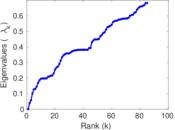
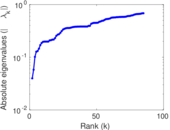
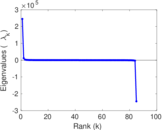
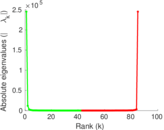
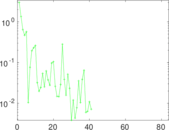
Plots


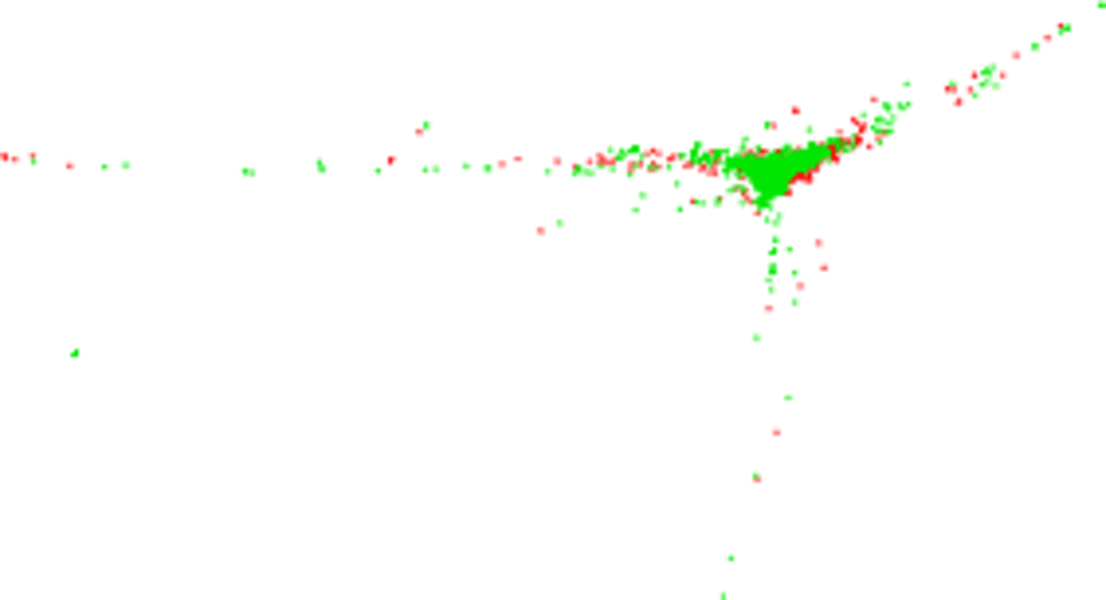
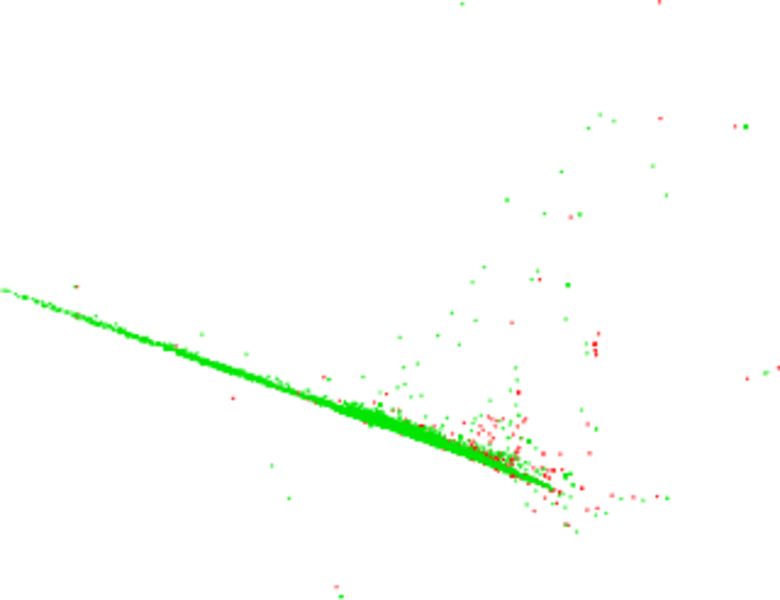
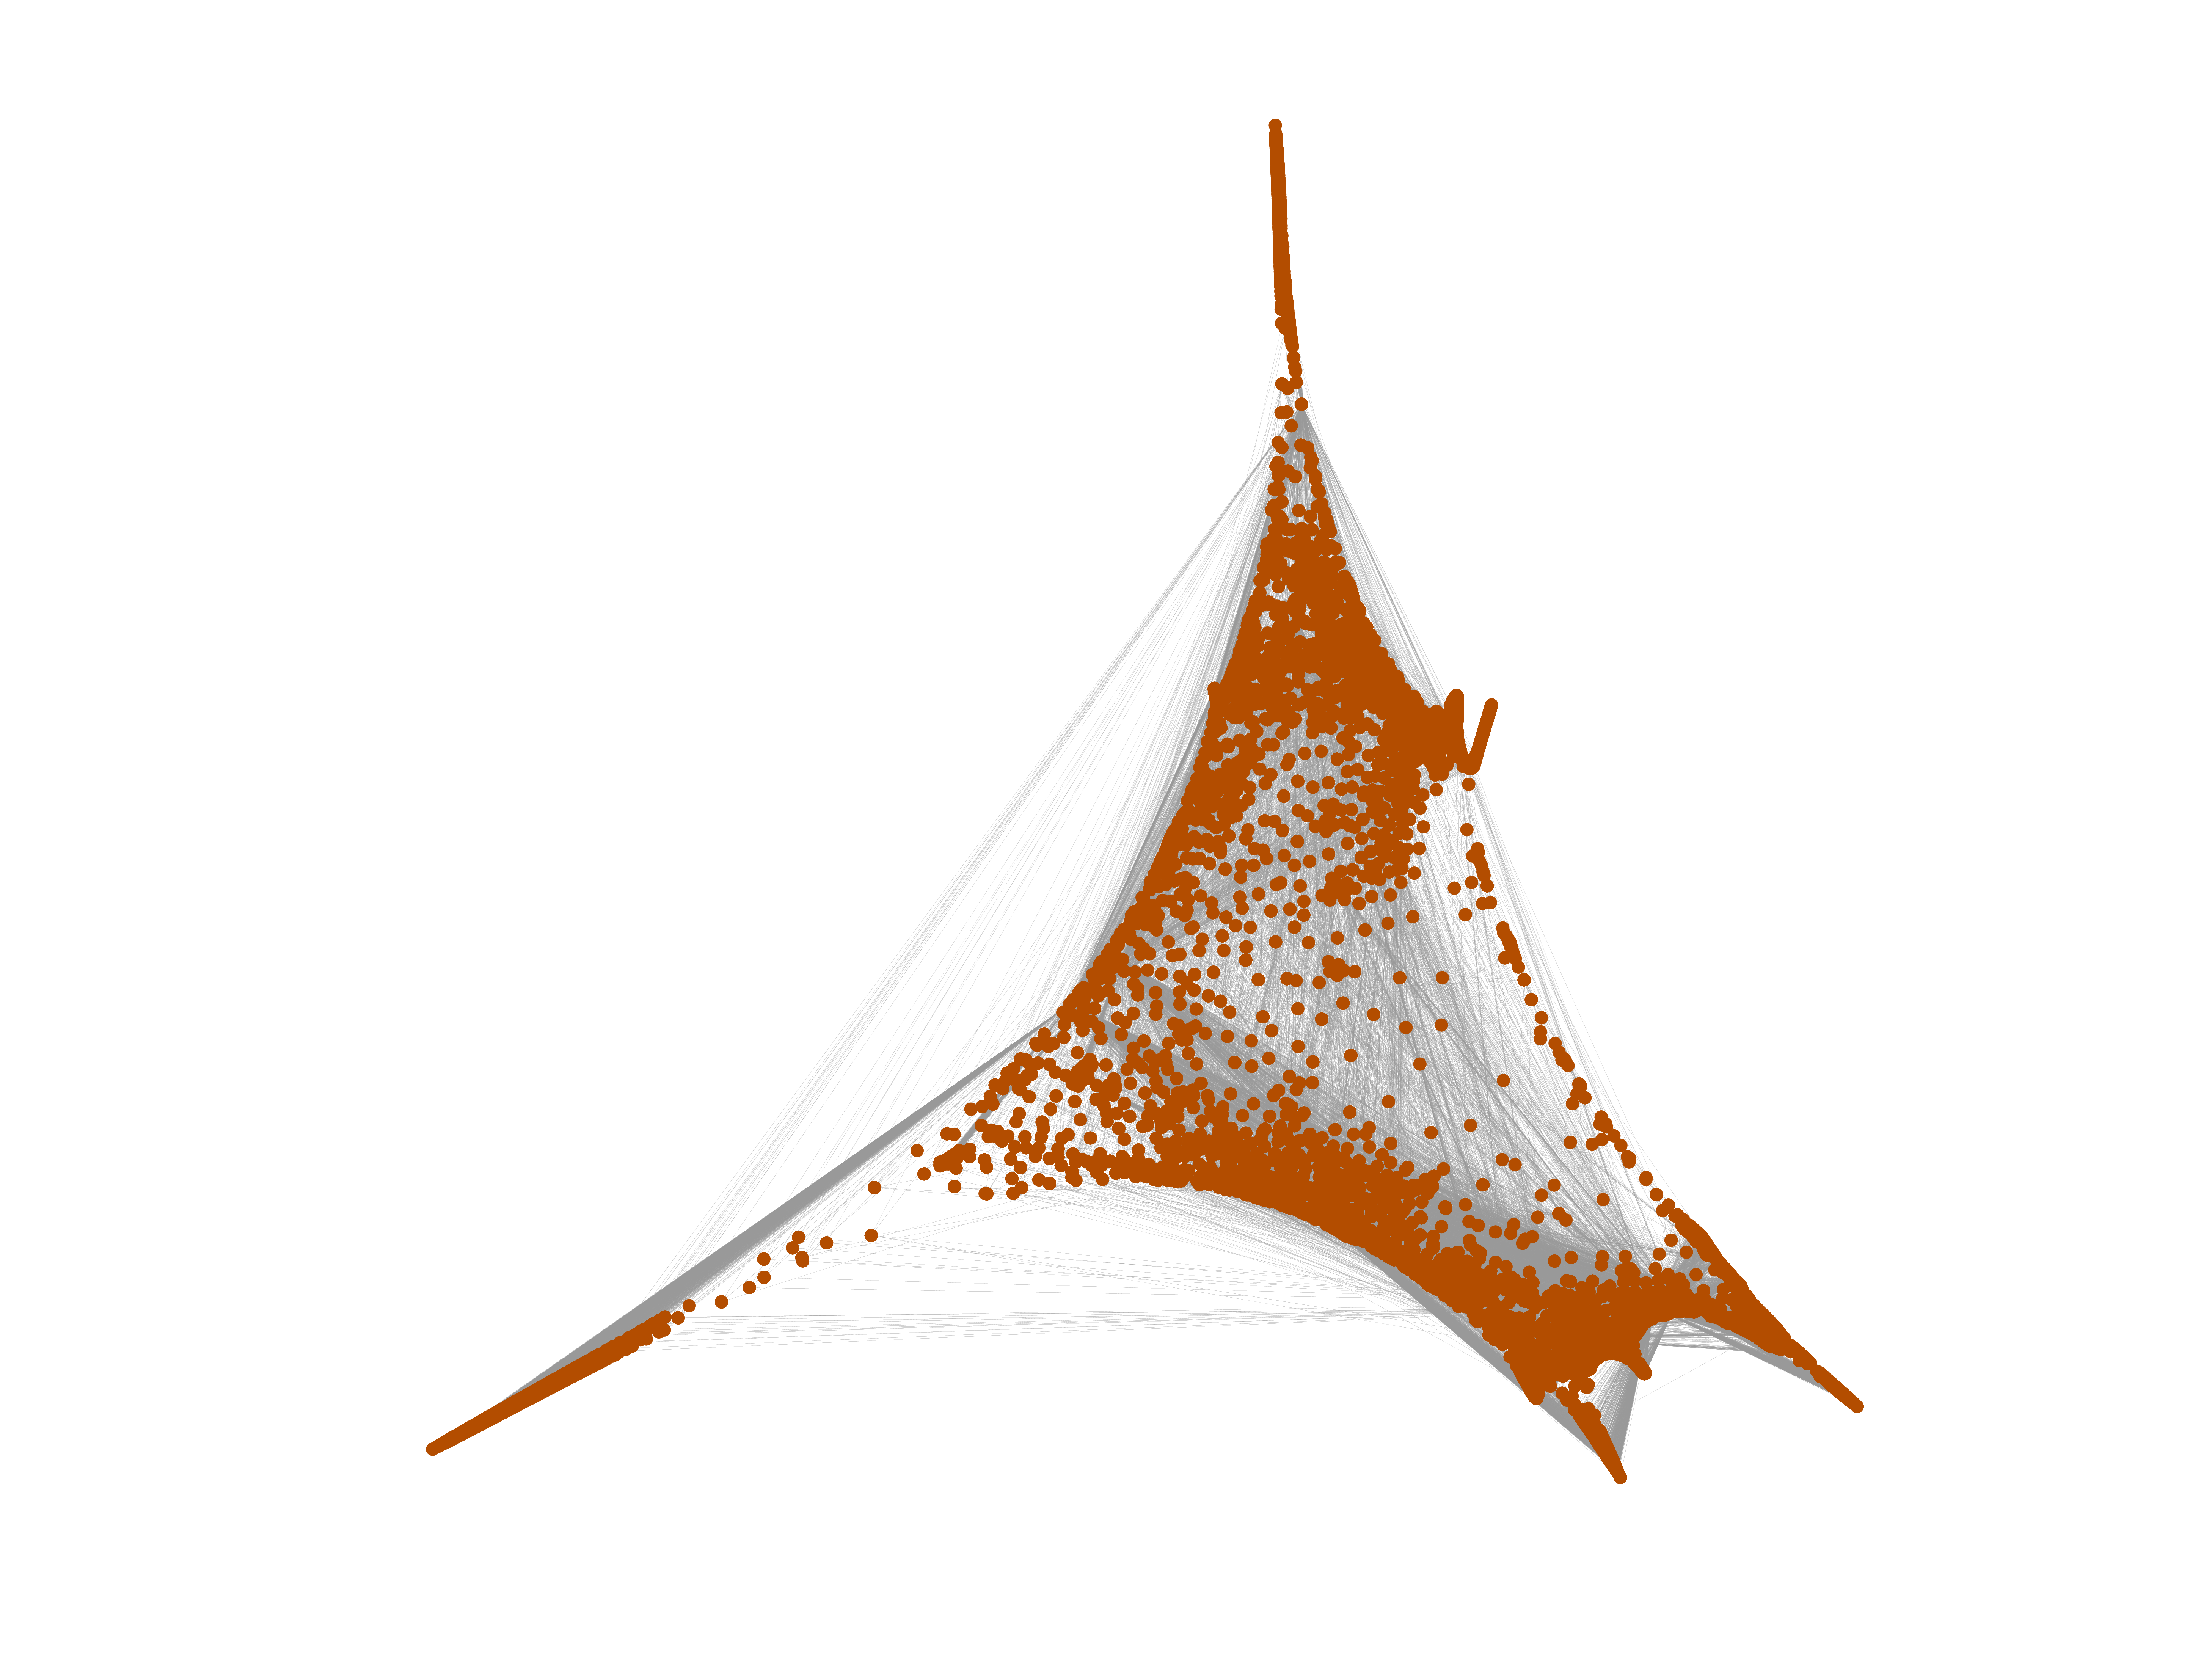
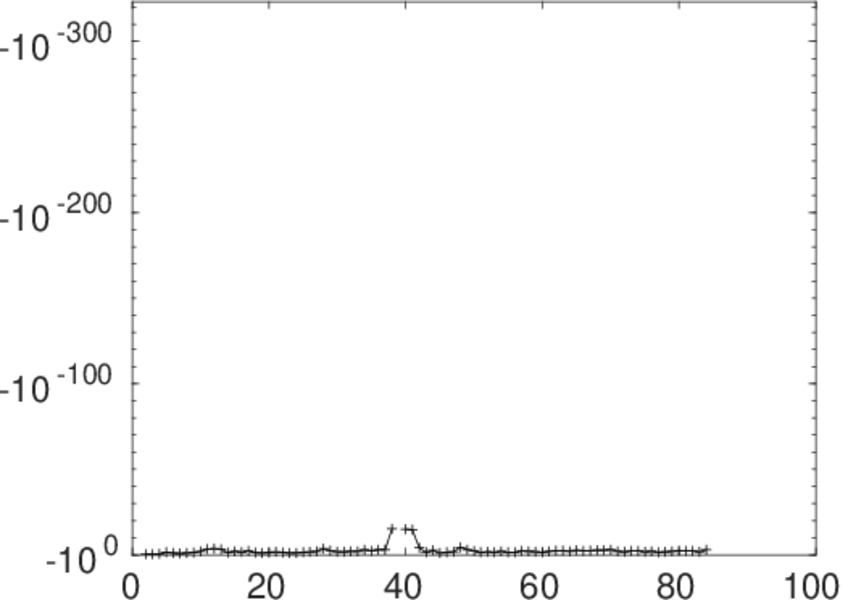
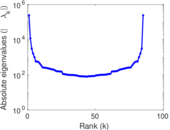
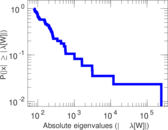
Matrix decompositions plots


Downloads
References
|
[1]
|
Jérôme Kunegis.
KONECT – The Koblenz Network Collection.
In Proc. Int. Conf. on World Wide Web Companion, pages
1343–1350, 2013.
[ http ]
|
|
[2]
|
Wikimedia Foundation.
Wikimedia downloads.
http://dumps.wikimedia.org/, January 2010.
|
 KONECT ‣ Networks ‣
Buy Me a Coffee
KONECT ‣ Networks ‣
Buy Me a Coffee