Wikiquote edits (ca)
This is the bipartite edit network of the Catalan Wikisource. It contains users
and pages from the Catalan Wikisource, connected by edit events. Each edge
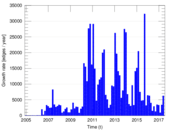
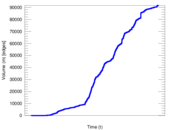
represents an edit. The dataset includes the timestamp of each edit.
Metadata
Statistics
| Size | n = | 38,382
|
| Left size | n1 = | 688
|
| Right size | n2 = | 37,694
|
| Volume | m = | 91,702
|
| Unique edge count | m̿ = | 61,521
|
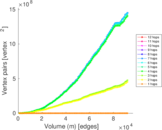
| Wedge count | s = | 240,367,065
|
| Claw count | z = | 1,007,606,689,056
|
| Square count | q = | 14,660,939
|
| 4-Tour count | T4 = | 1,078,882,450
|
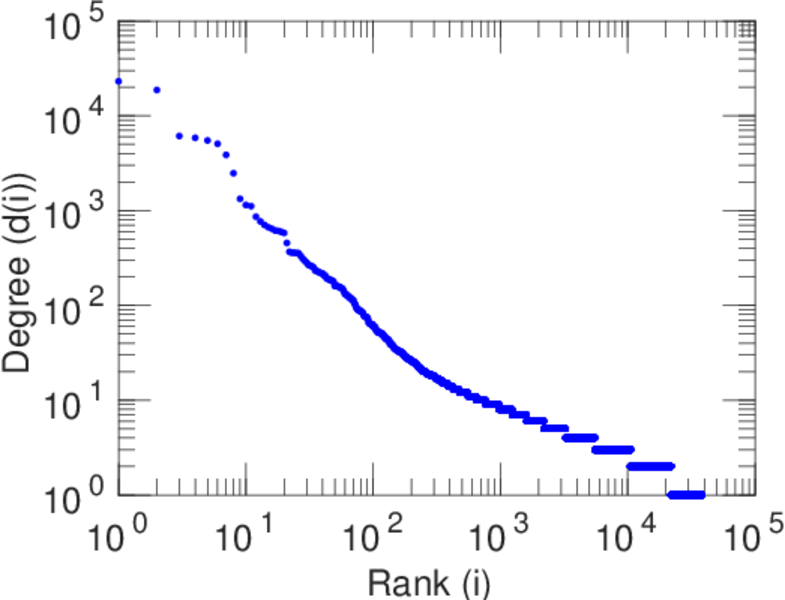
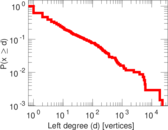
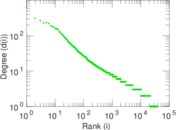
| Maximum degree | dmax = | 23,107
|
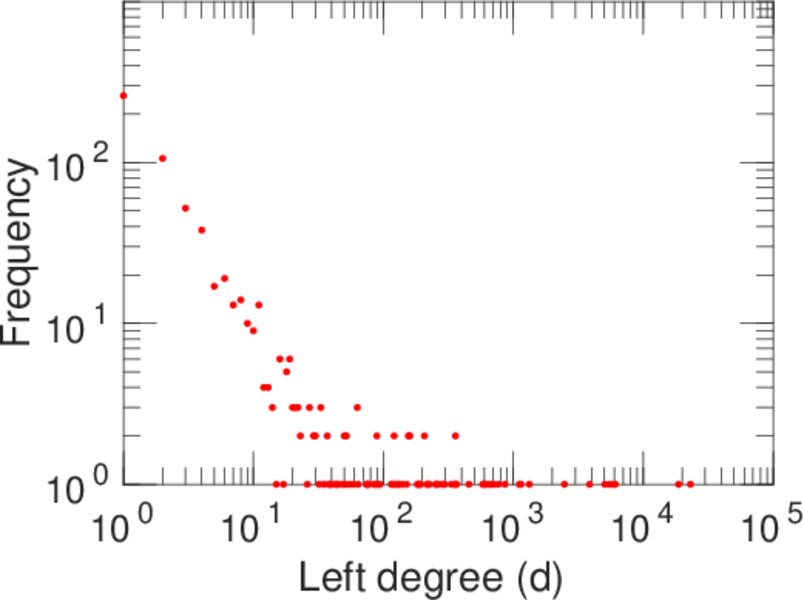
| Maximum left degree | d1max = | 23,107
|
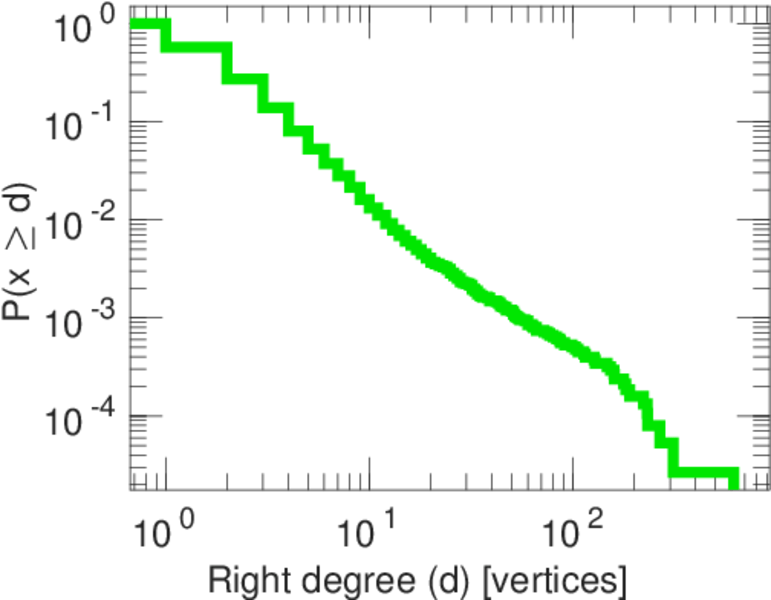
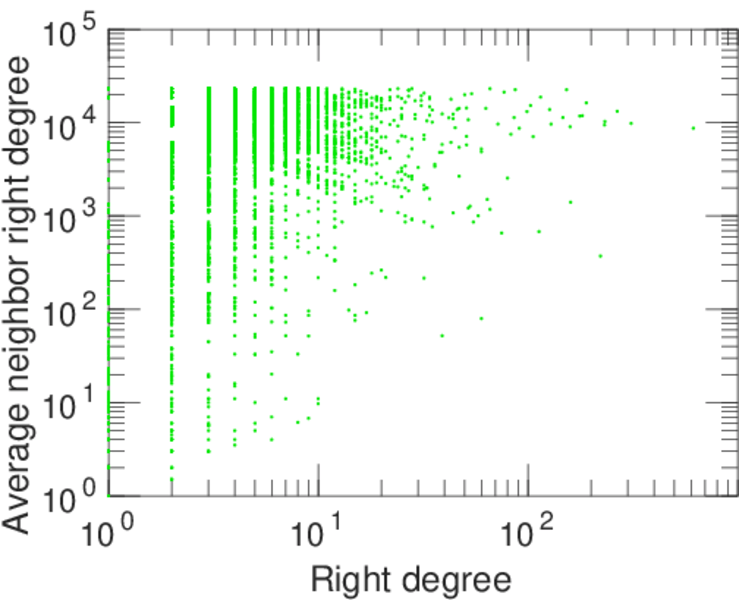
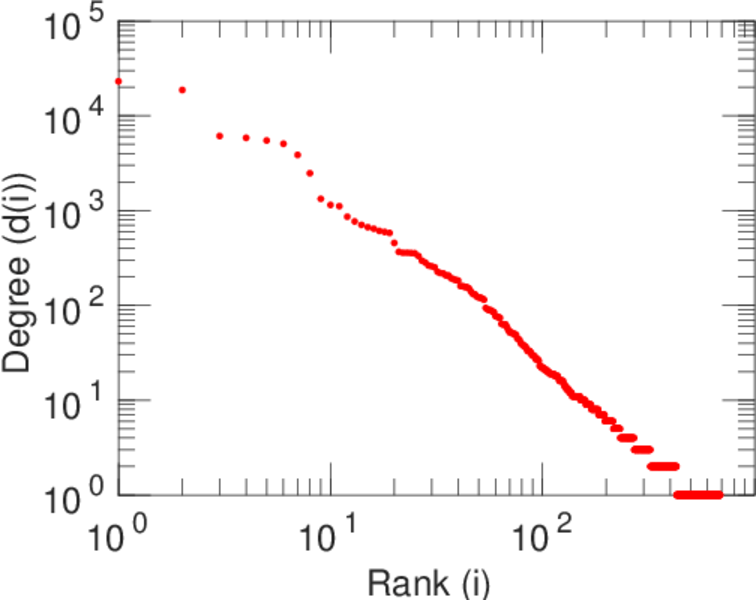
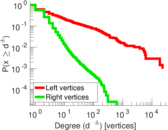
| Maximum right degree | d2max = | 616
|
| Average degree | d = | 4.778 39
|
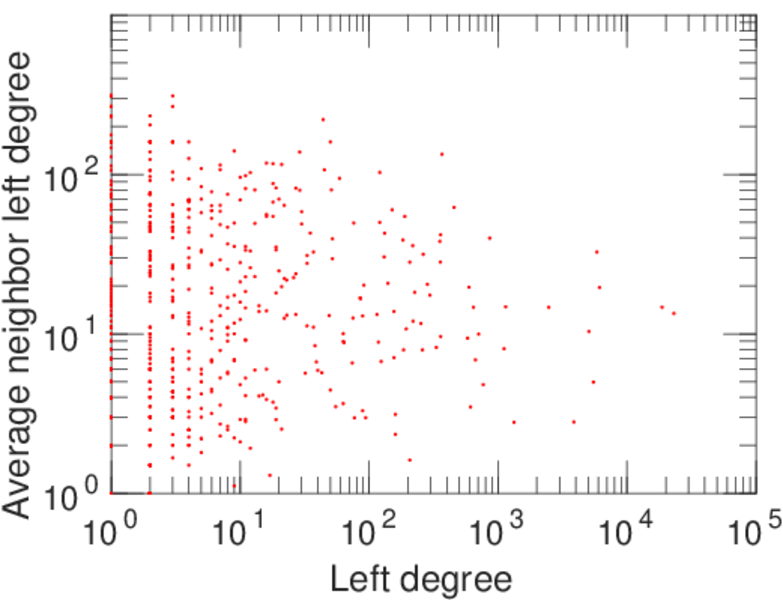
| Average left degree | d1 = | 133.288
|
| Average right degree | d2 = | 2.432 80
|
| Fill | p = | 0.002 372 26
|
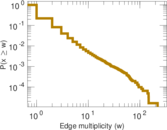
| Average edge multiplicity | m̃ = | 1.490 58
|
| Size of LCC | N = | 38,076
|
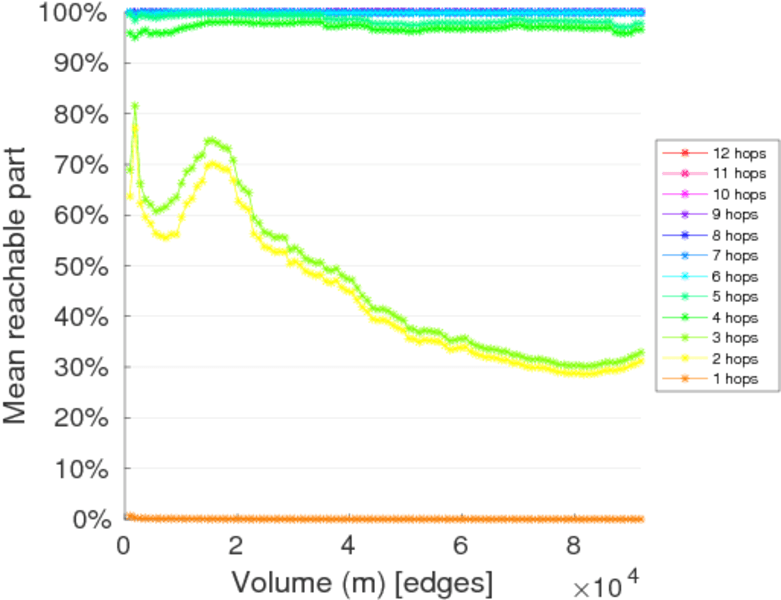
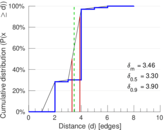
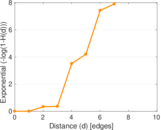
| Diameter | δ = | 10
|
| 50-Percentile effective diameter | δ0.5 = | 3.296 81
|
| 90-Percentile effective diameter | δ0.9 = | 3.895 38
|
| Median distance | δM = | 4
|
| Mean distance | δm = | 3.460 16
|
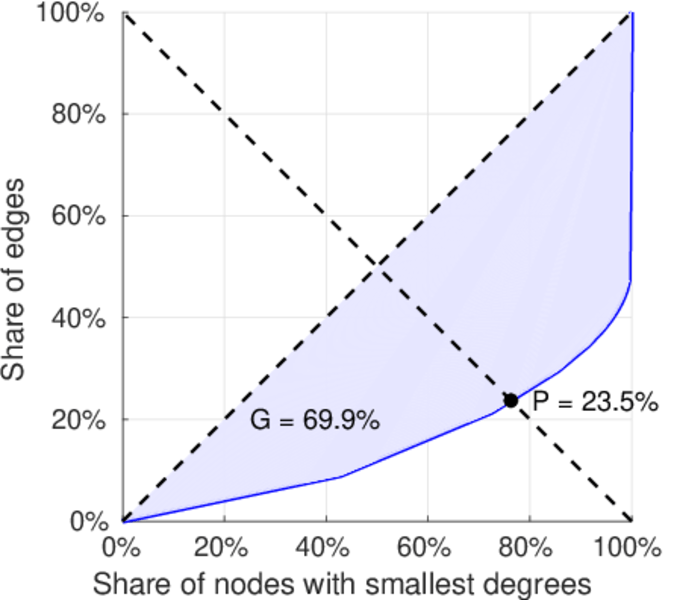
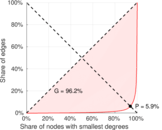
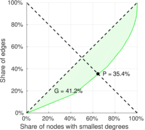
| Gini coefficient | G = | 0.702 875
|
| Balanced inequality ratio | P = | 0.232 650
|
| Left balanced inequality ratio | P1 = | 0.059 289 9
|
| Right balanced inequality ratio | P2 = | 0.353 547
|
| Relative edge distribution entropy | Her = | 0.694 086
|
| Power law exponent | γ = | 3.582 57
|
| Tail power law exponent | γt = | 3.781 00
|
| Tail power law exponent with p | γ3 = | 3.781 00
|
| p-value | p = | 0.000 00
|
| Left tail power law exponent with p | γ3,1 = | 1.651 00
|
| Left p-value | p1 = | 0.000 00
|
| Right tail power law exponent with p | γ3,2 = | 5.231 00
|
| Right p-value | p2 = | 0.000 00
|
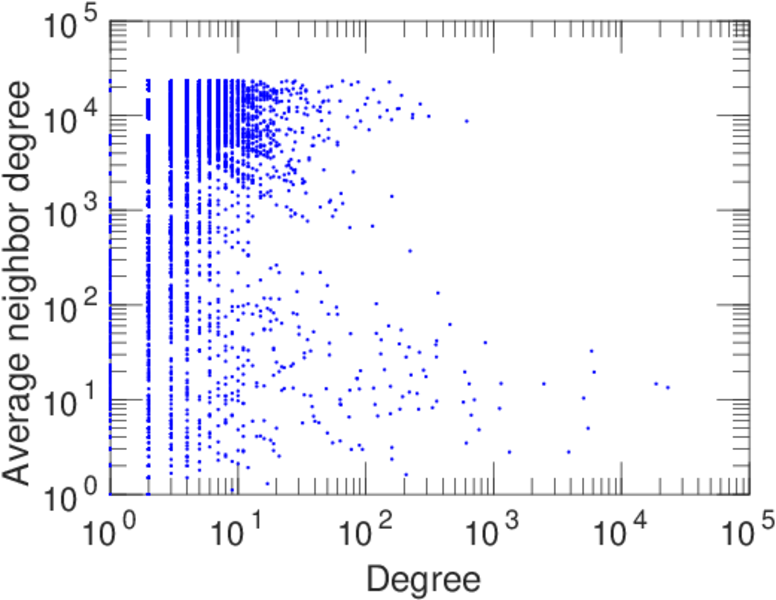
| Degree assortativity | ρ = | −0.164 050
|
| Degree assortativity p-value | pρ = | 0.000 00
|
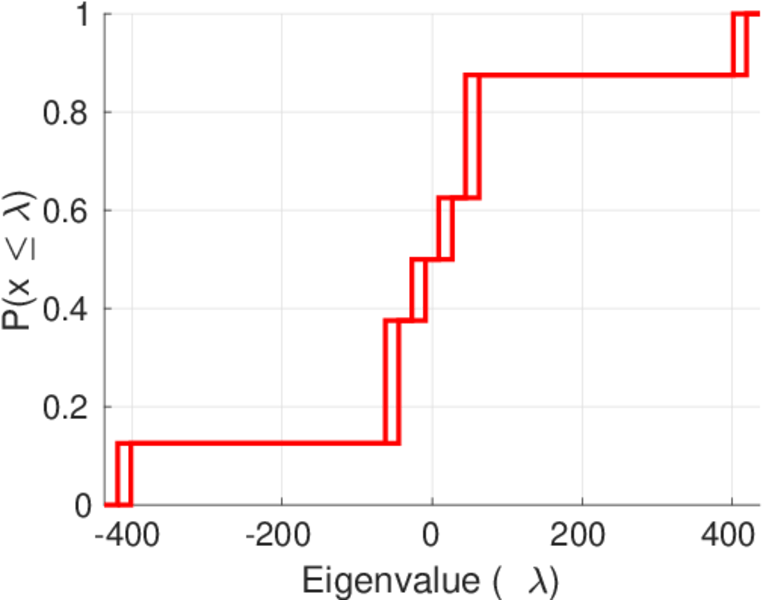
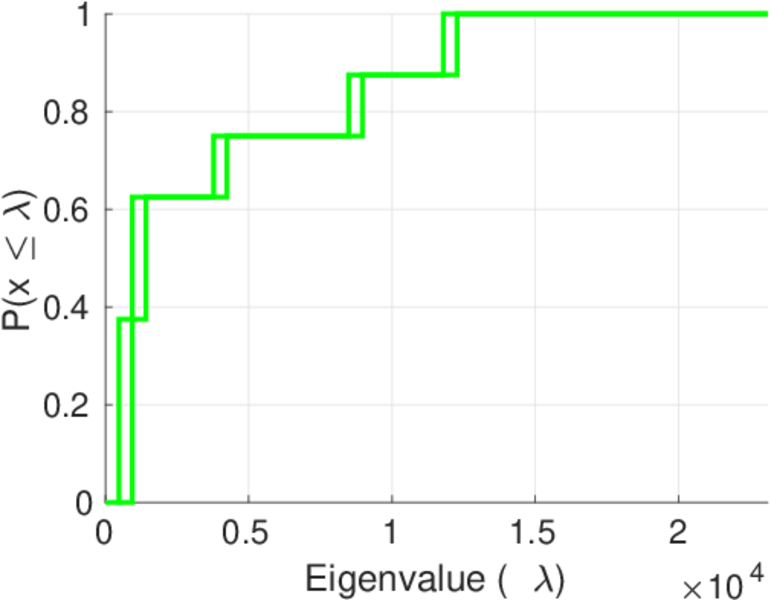
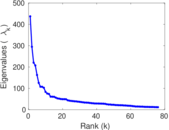
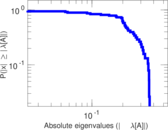
| Spectral norm | α = | 437.126
|
| Algebraic connectivity | a = | 0.023 619 0
|
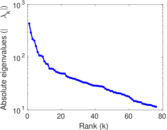
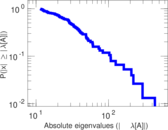
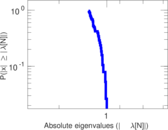
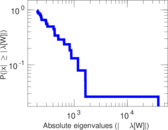
| Spectral separation | |λ1[A] / λ2[A]| = | 1.483 66
|
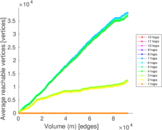
| Controllability | C = | 37,232
|
| Relative controllability | Cr = | 0.970 847
|
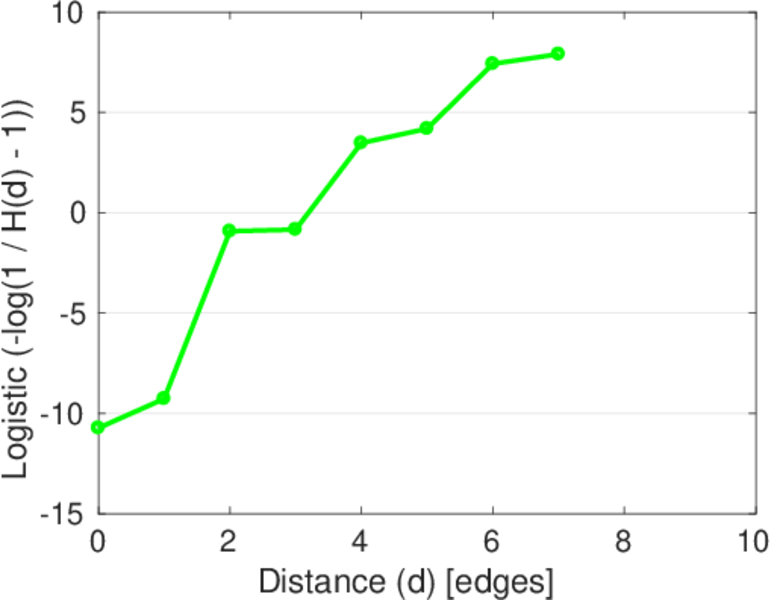
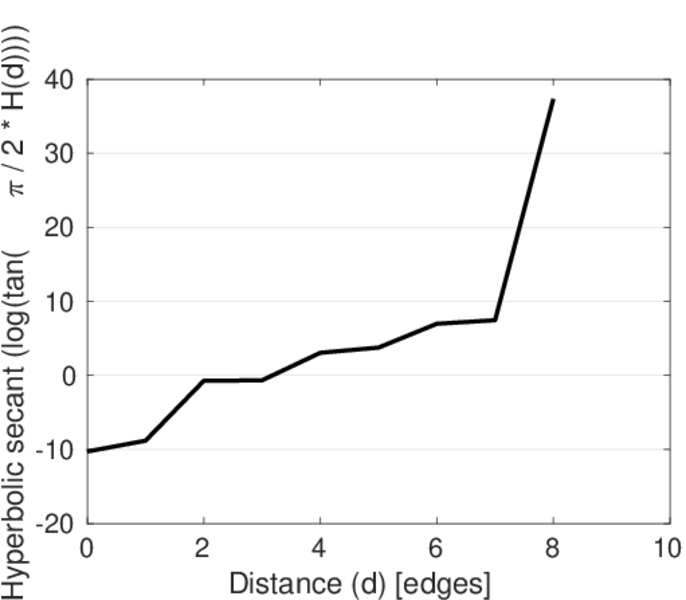
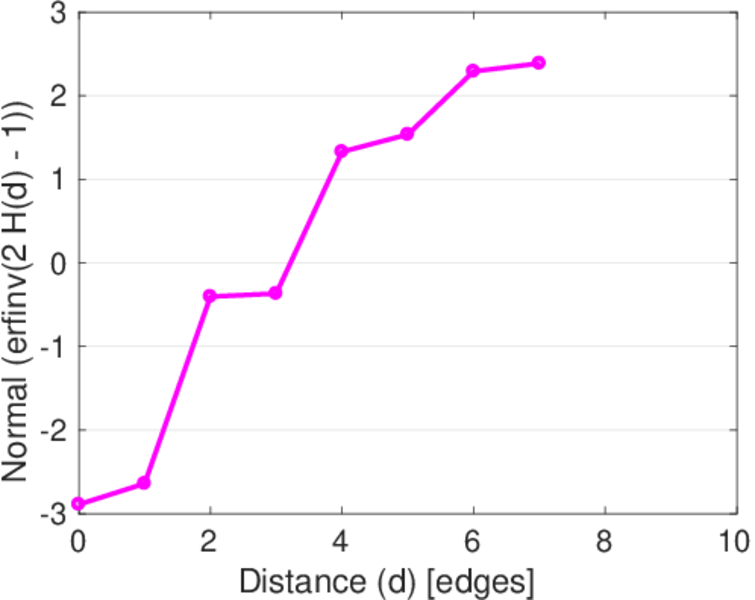
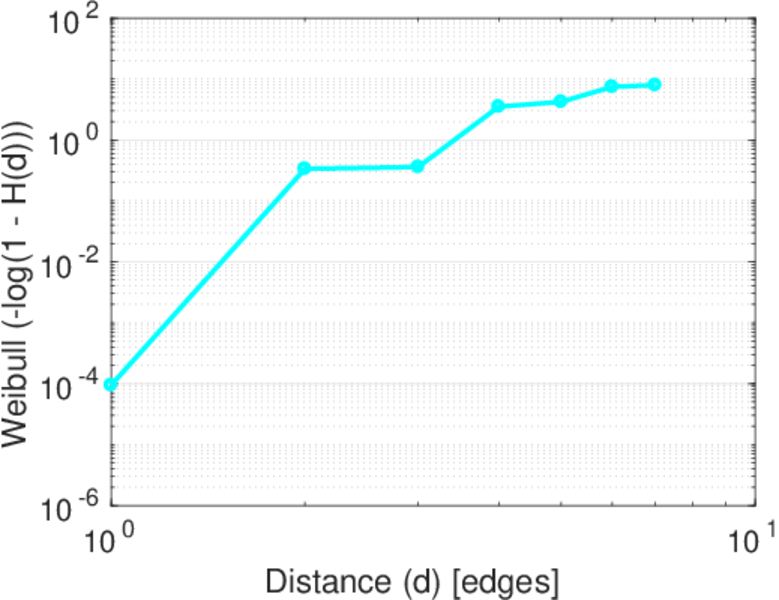
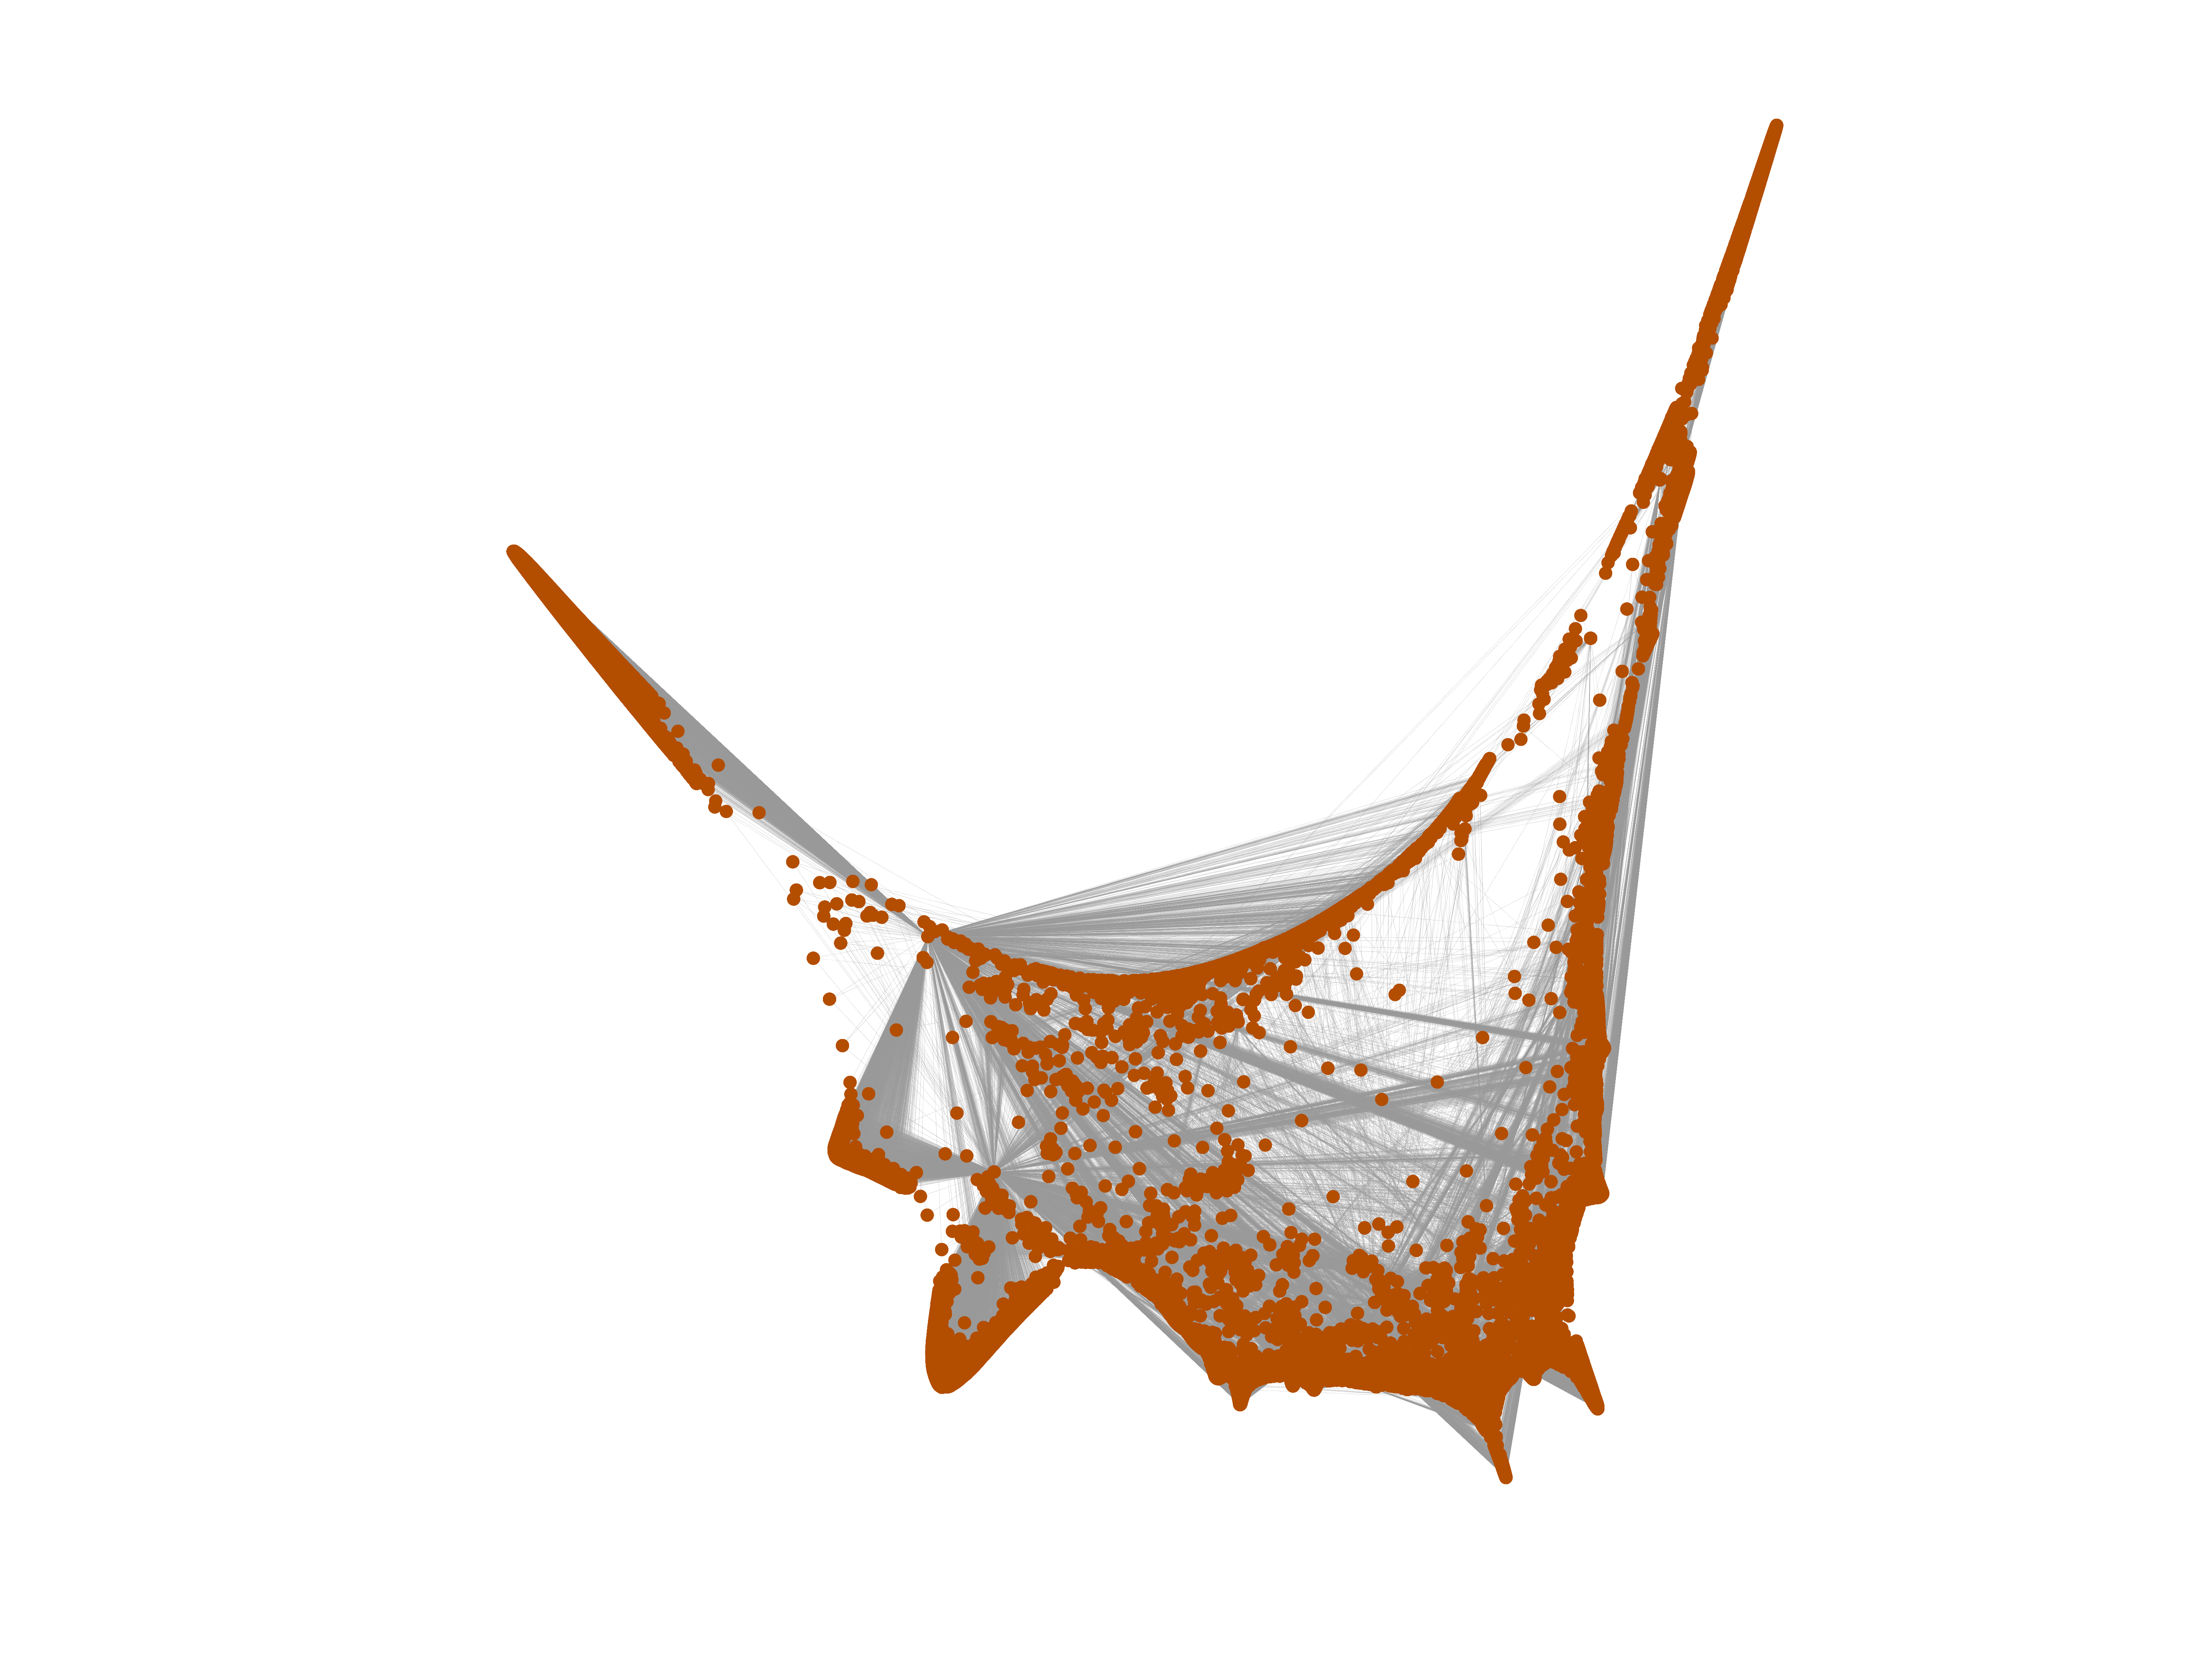
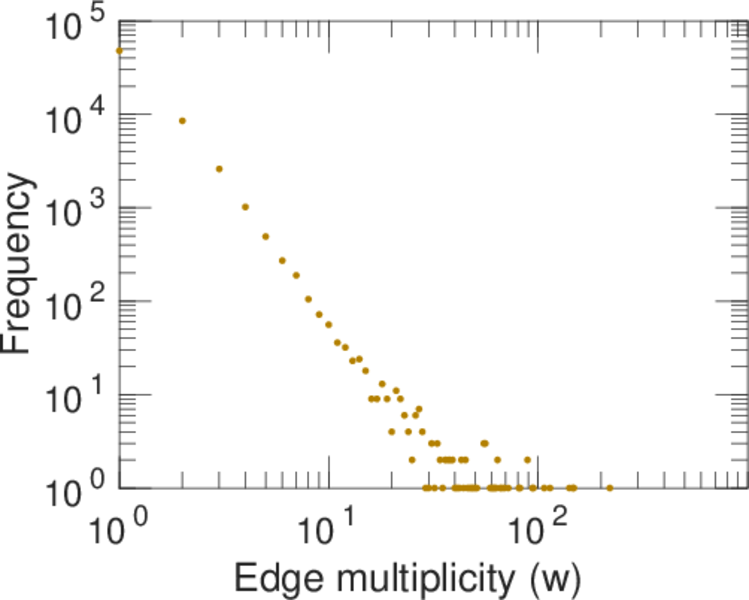
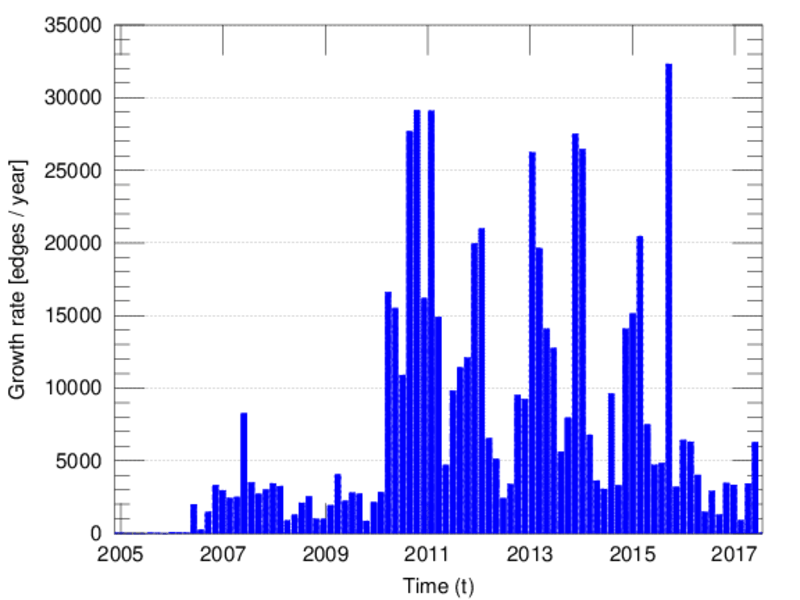
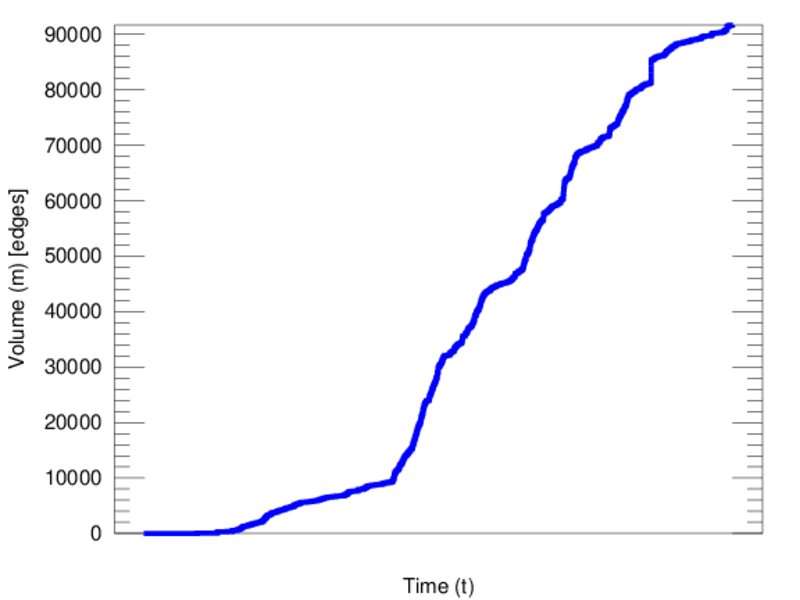
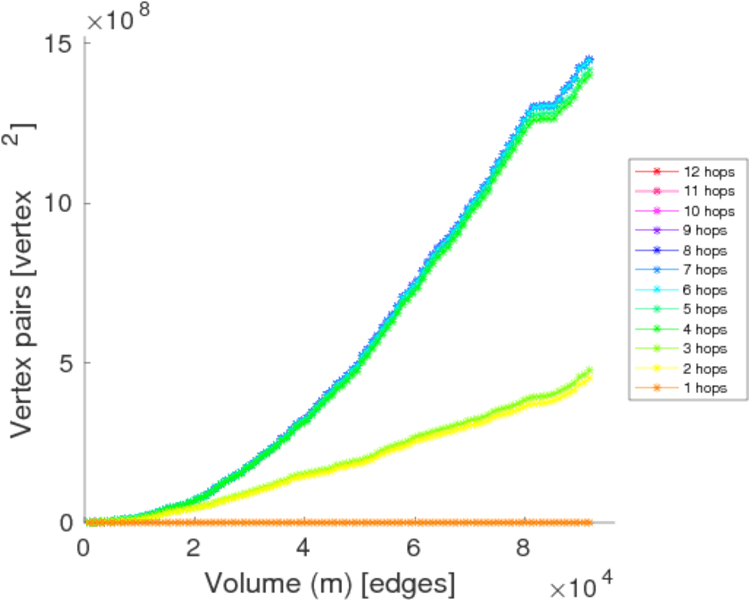
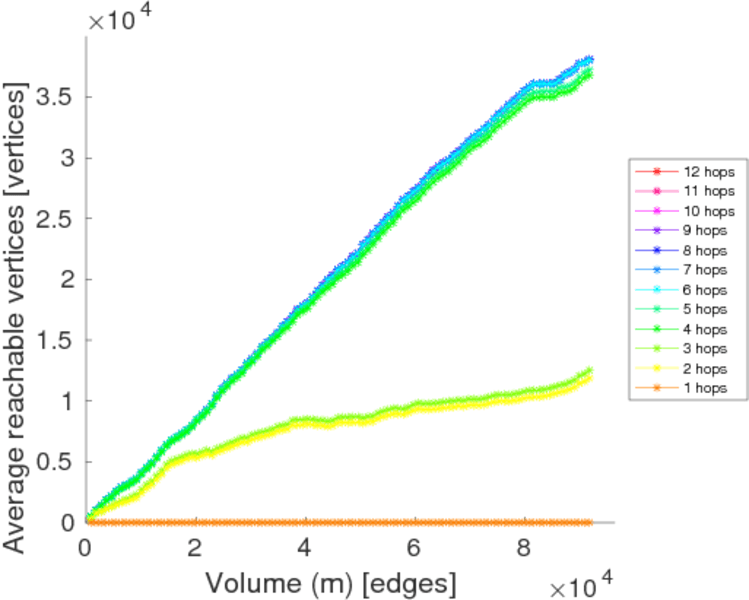
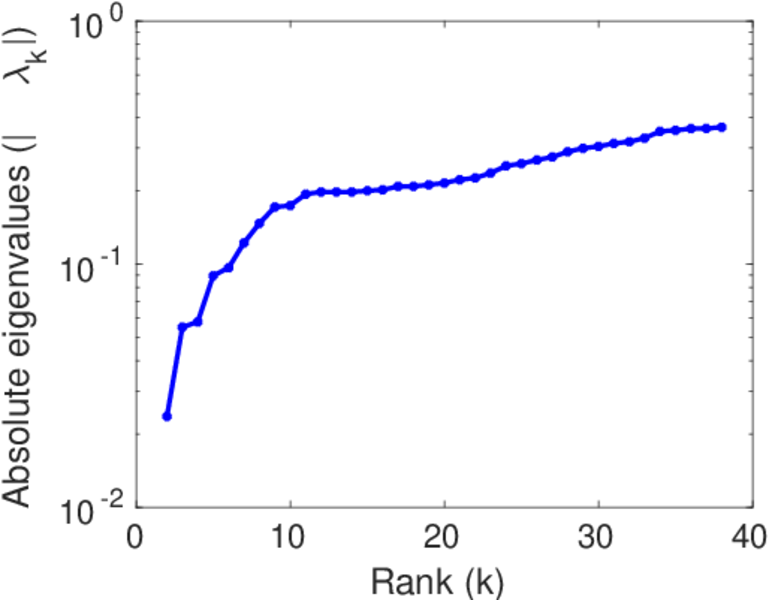
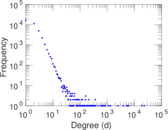
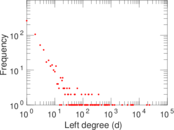
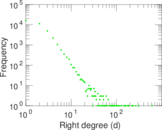
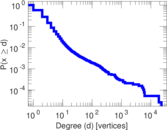
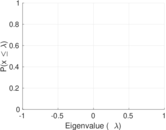
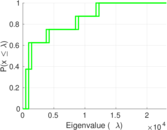
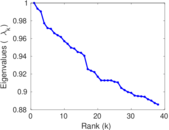
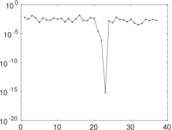
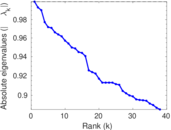
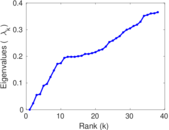
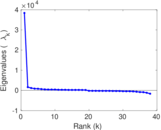
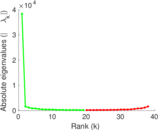
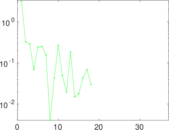
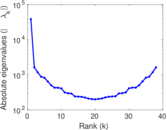
Plots


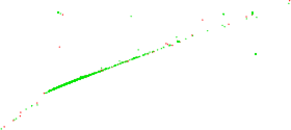
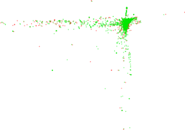


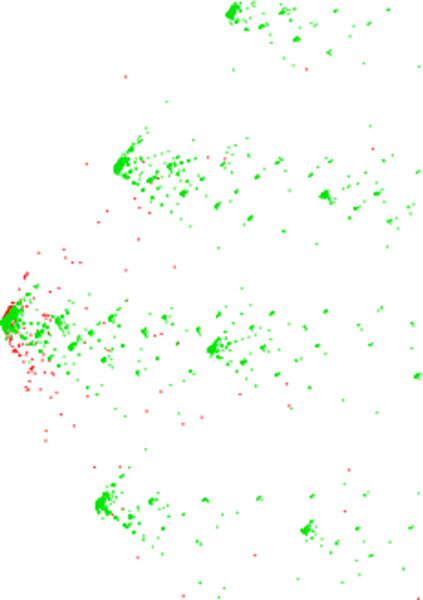
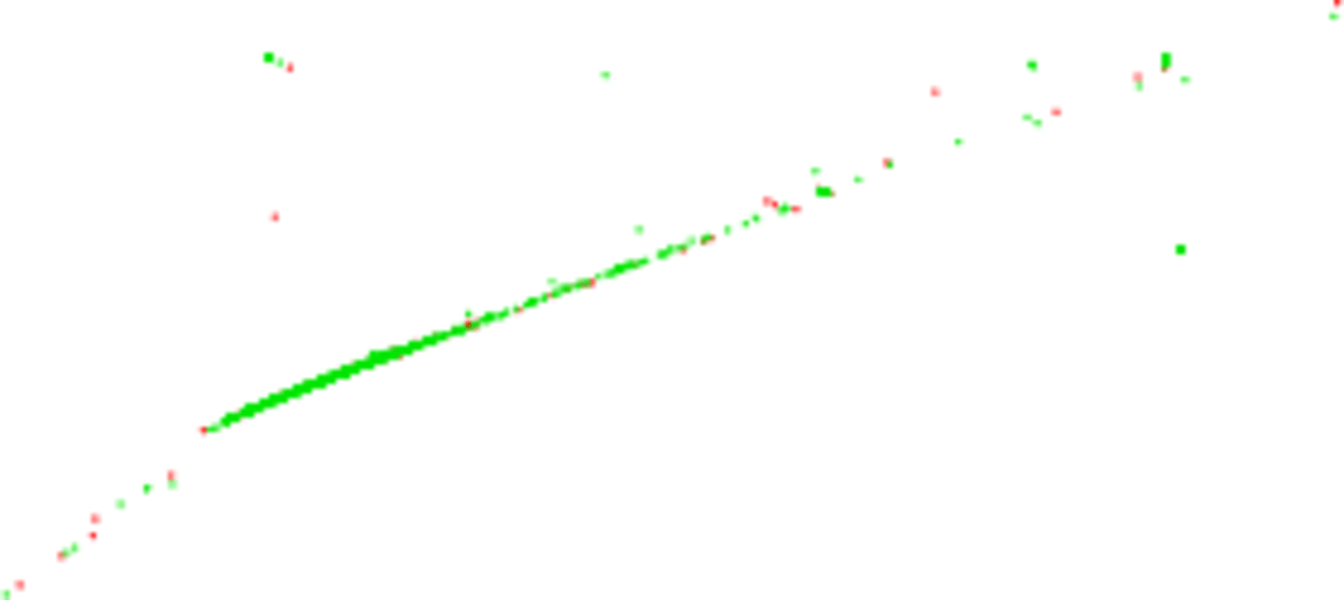
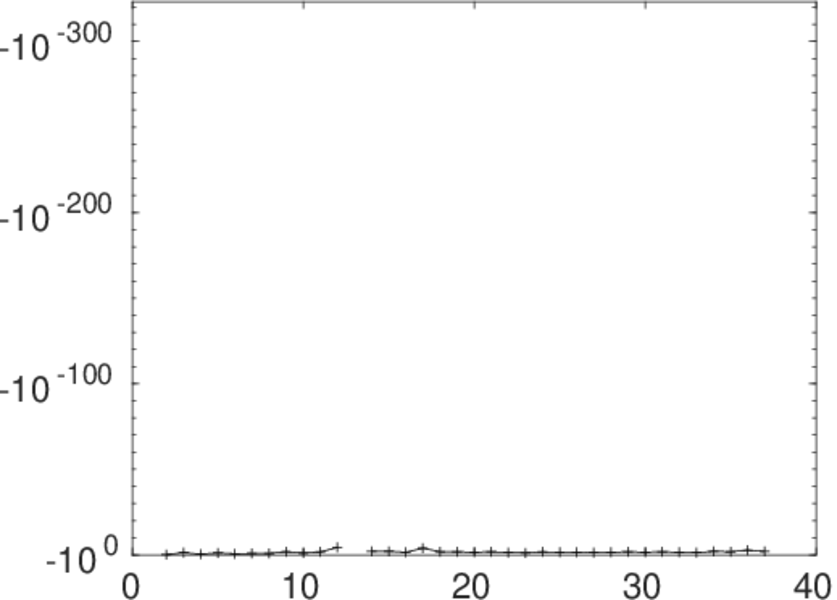
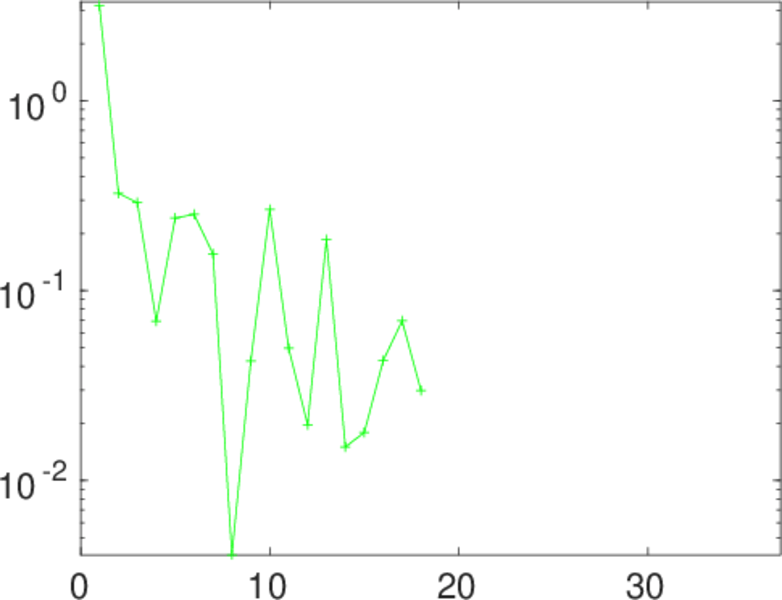
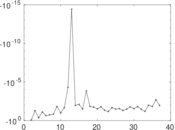
Matrix decompositions plots


Downloads
References
|
[1]
|
Jérôme Kunegis.
KONECT – The Koblenz Network Collection.
In Proc. Int. Conf. on World Wide Web Companion, pages
1343–1350, 2013.
[ http ]
|
|
[2]
|
Wikimedia Foundation.
Wikimedia downloads.
http://dumps.wikimedia.org/, January 2010.
|
 KONECT ‣ Networks ‣
Buy Me a Coffee
KONECT ‣ Networks ‣
Buy Me a Coffee