Wiktionary edits (ca)
This is the bipartite edit network of the Catalan Wiktionary. It contains users
and pages from the Catalan Wiktionary, connected by edit events. Each edge
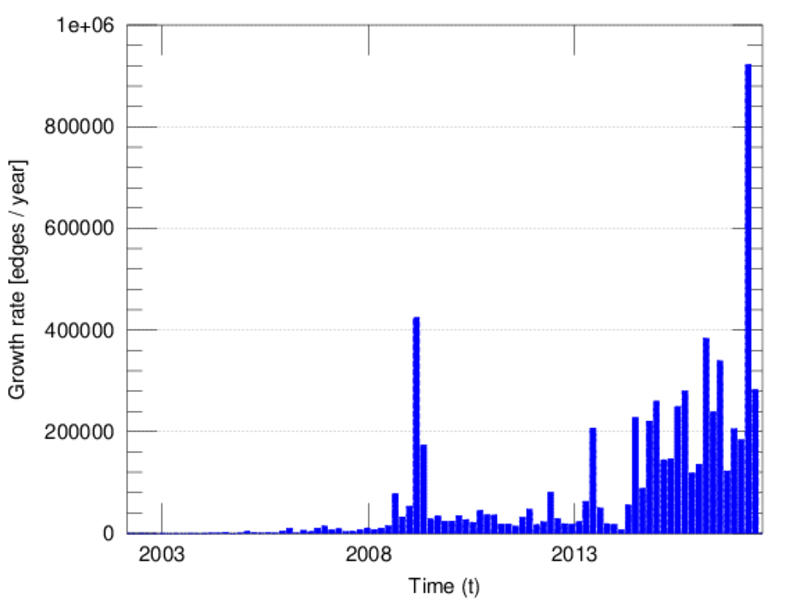
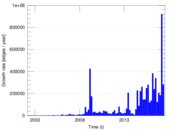
represents an edit. The dataset includes the timestamp of each edit.
Metadata
Statistics
| Size | n = | 278,969
|
| Left size | n1 = | 1,110
|
| Right size | n2 = | 277,859
|
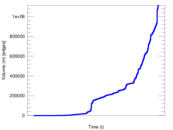
| Volume | m = | 1,113,834
|
| Unique edge count | m̿ = | 604,686
|
| Wedge count | s = | 41,267,484,302
|
| Claw count | z = | 2,893,276,590,393,907
|
| Cross count | x = | 1.688 94 × 1020
|
| Square count | q = | 10,500,171,279
|
| 4-Tour count | T4 = | 249,073,153,720
|
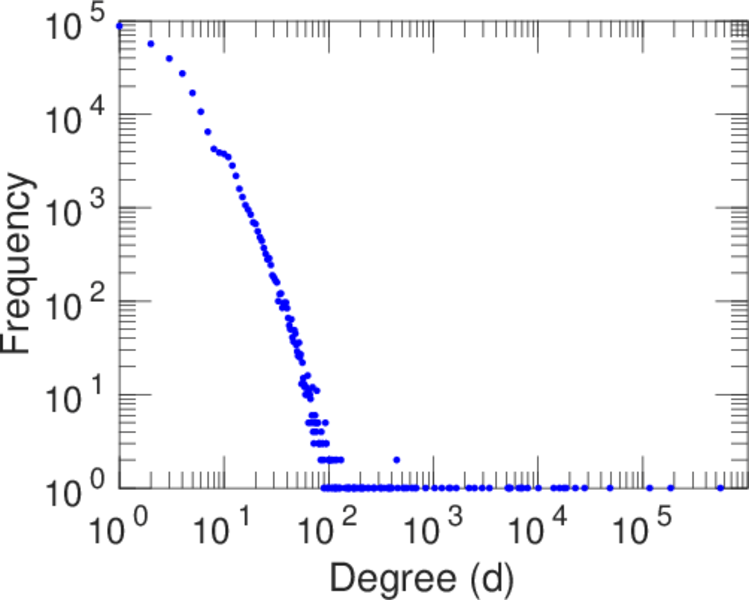
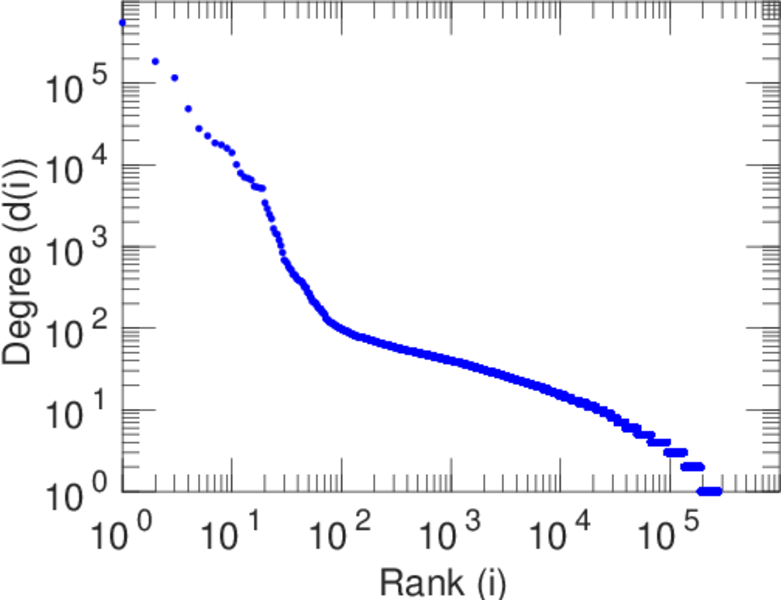
| Maximum degree | dmax = | 551,855
|
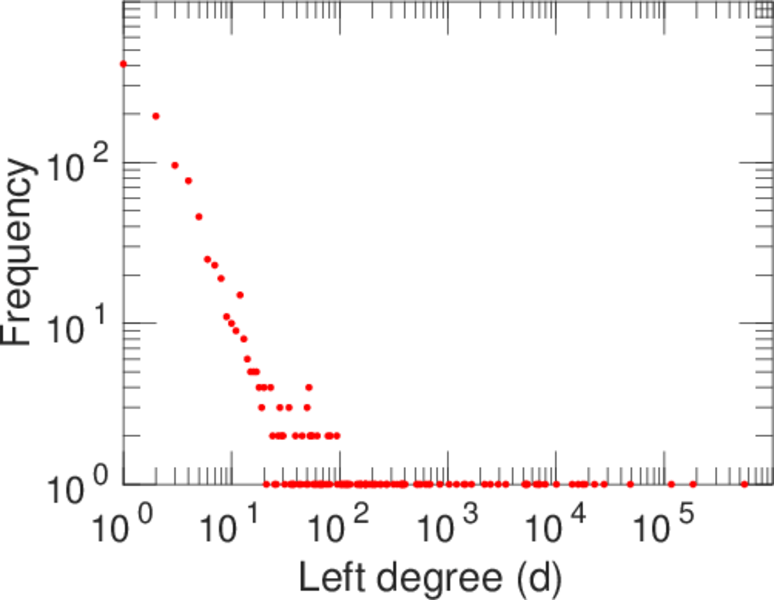
| Maximum left degree | d1max = | 551,855
|
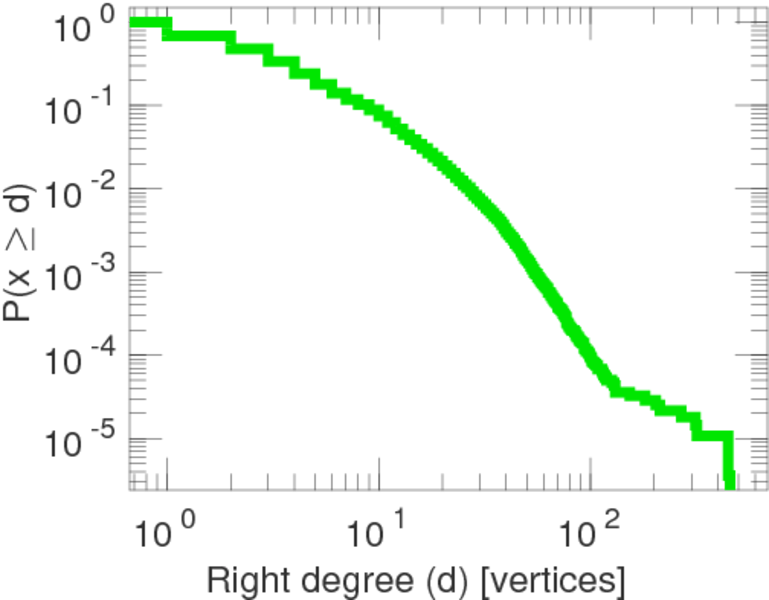
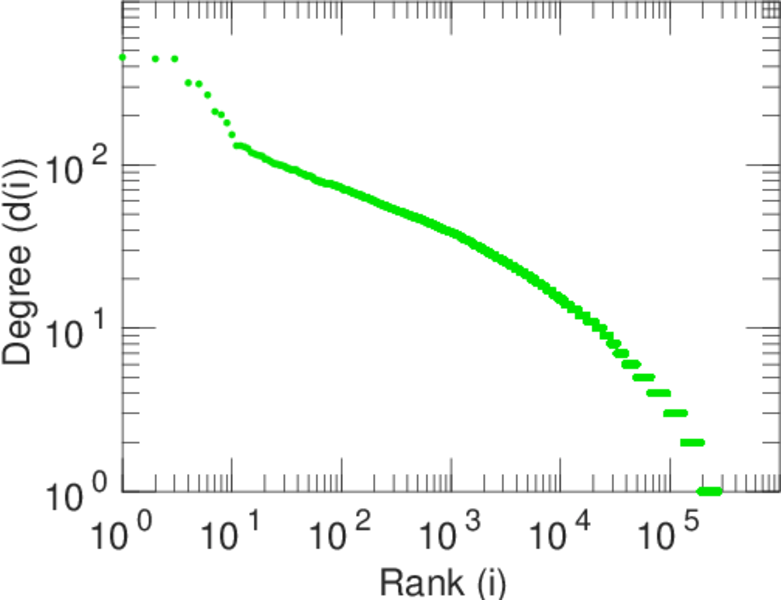
| Maximum right degree | d2max = | 456
|
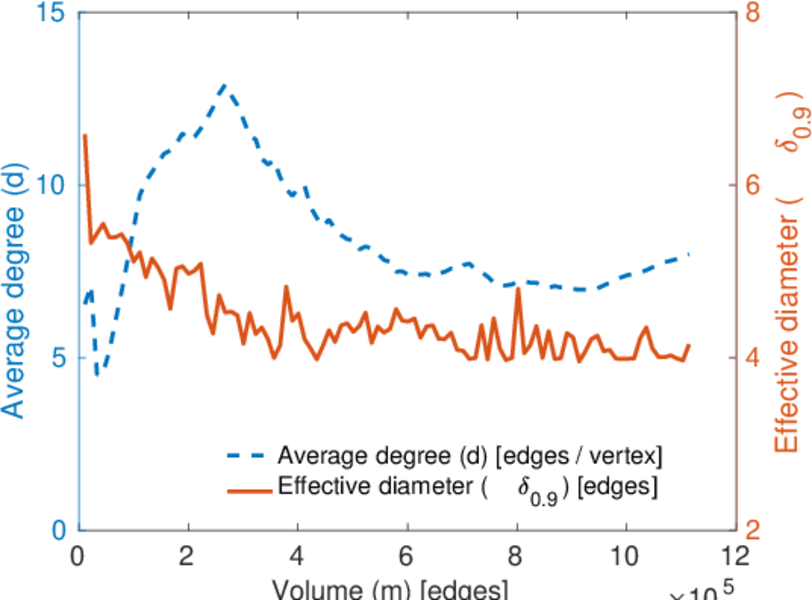
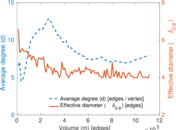
| Average degree | d = | 7.985 36
|
| Average left degree | d1 = | 1,003.45
|
| Average right degree | d2 = | 4.008 63
|
| Fill | p = | 0.001 960 57
|
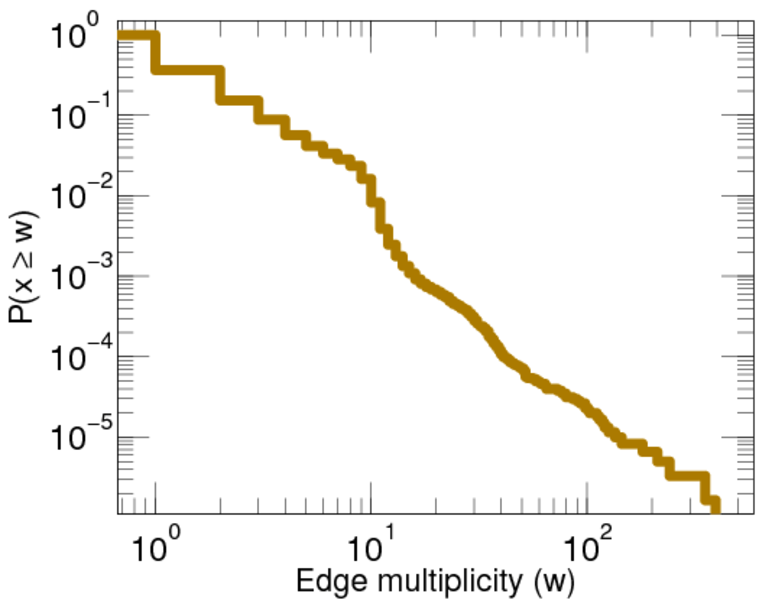
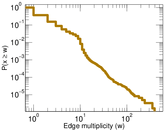
| Average edge multiplicity | m̃ = | 1.842 00
|
| Size of LCC | N = | 278,611
|
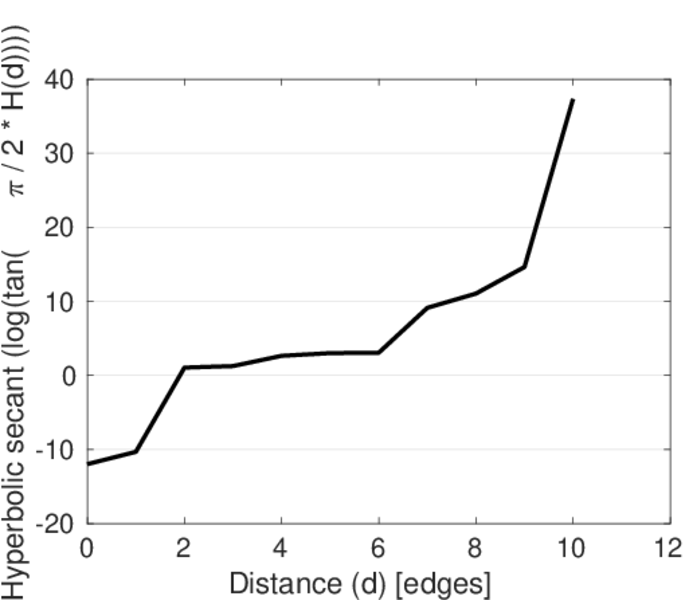
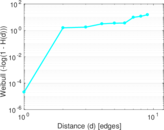
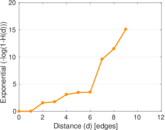
| Diameter | δ = | 11
|
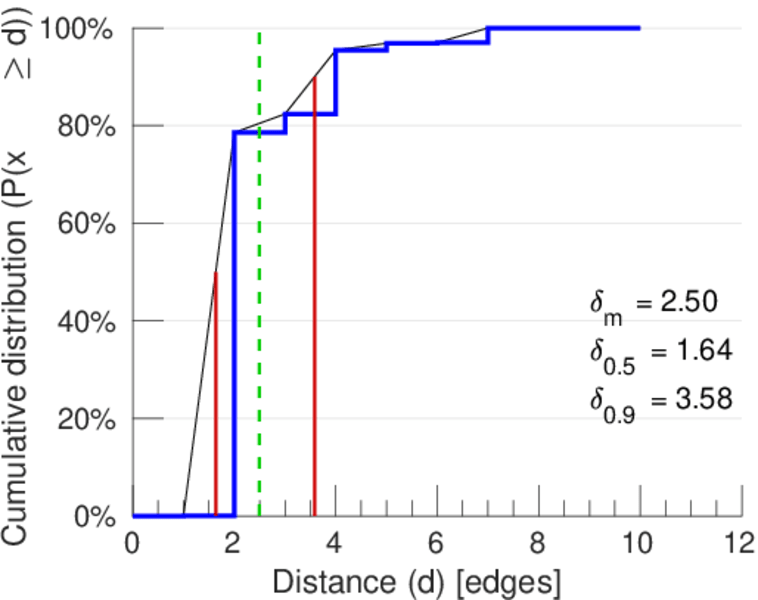
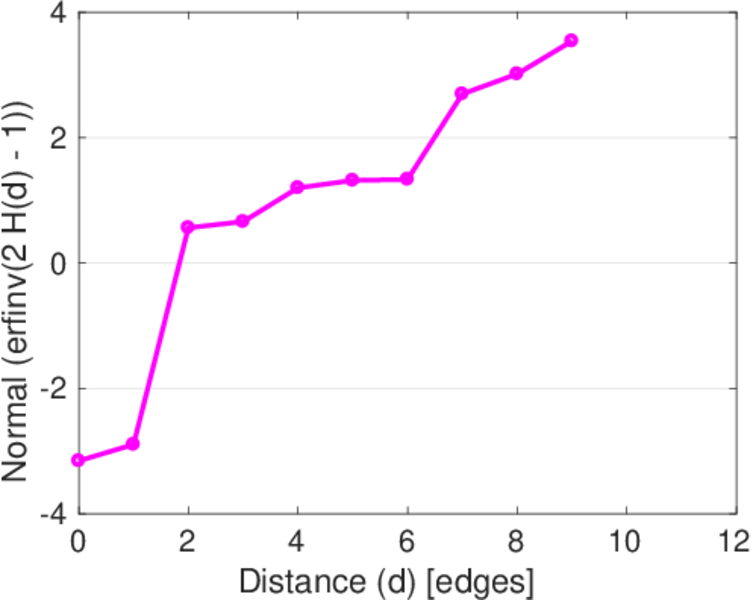
| 50-Percentile effective diameter | δ0.5 = | 1.636 38
|
| 90-Percentile effective diameter | δ0.9 = | 3.582 39
|
| Median distance | δM = | 2
|
| Mean distance | δm = | 2.497 27
|
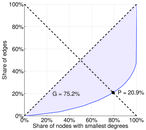
| Gini coefficient | G = | 0.753 144
|
| Balanced inequality ratio | P = | 0.208 153
|
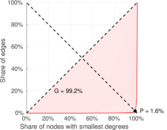
| Left balanced inequality ratio | P1 = | 0.016 392 9
|
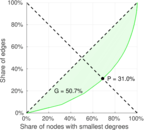
| Right balanced inequality ratio | P2 = | 0.310 086
|
| Relative edge distribution entropy | Her = | 0.631 548
|
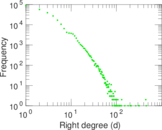
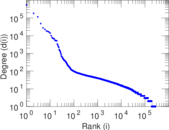
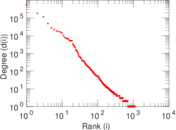
| Power law exponent | γ = | 2.822 96
|
| Tail power law exponent | γt = | 3.441 00
|
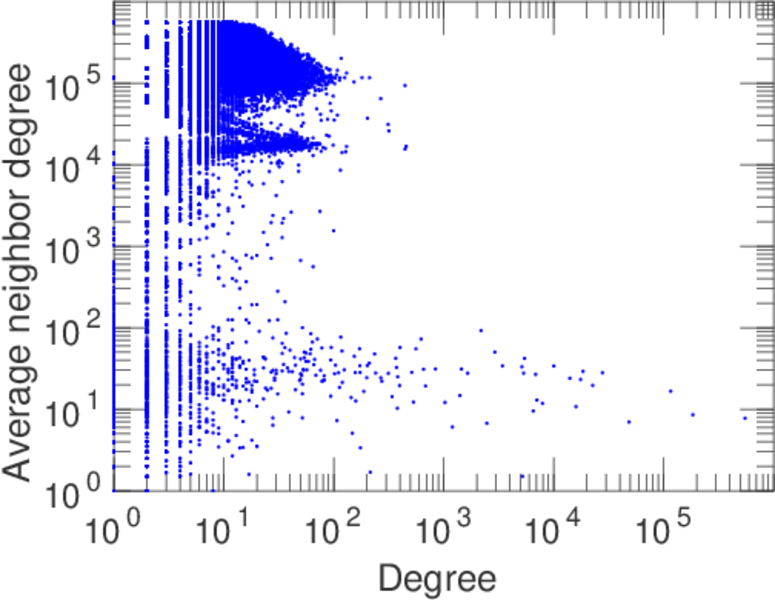
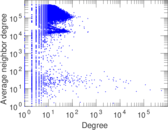
| Degree assortativity | ρ = | −0.489 883
|
| Degree assortativity p-value | pρ = | 0.000 00
|
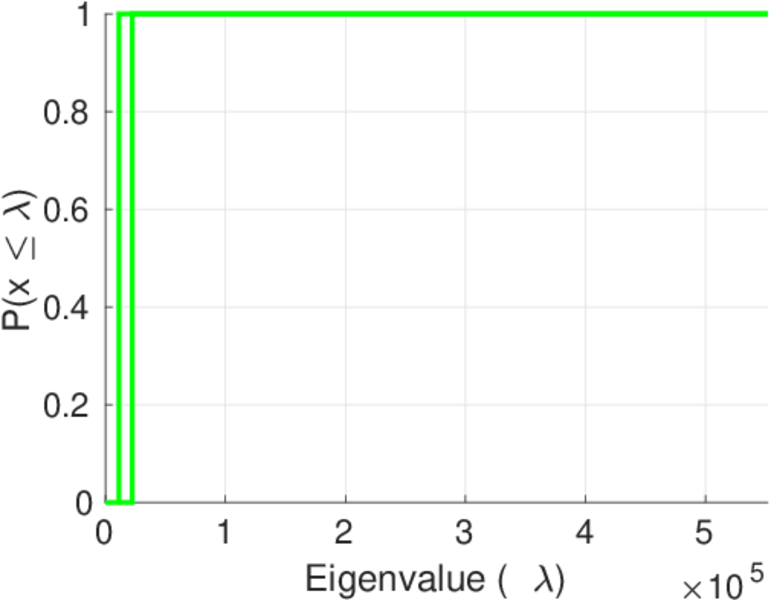
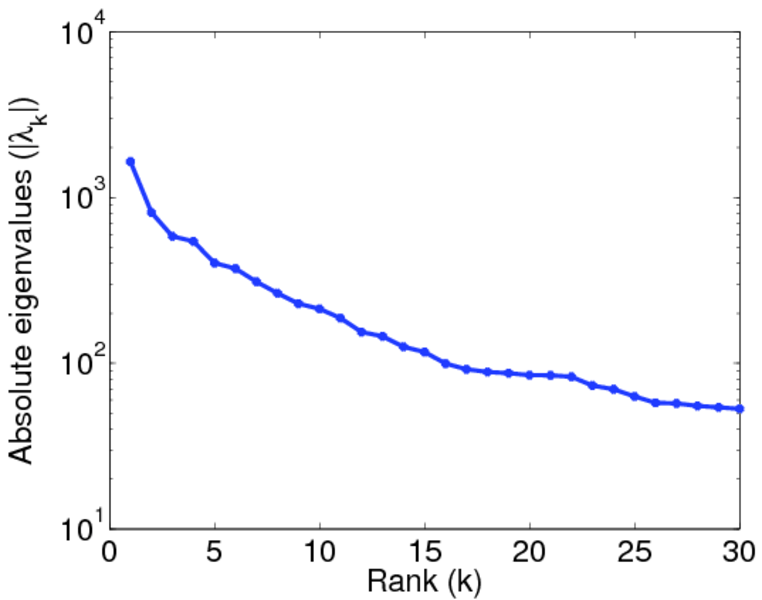
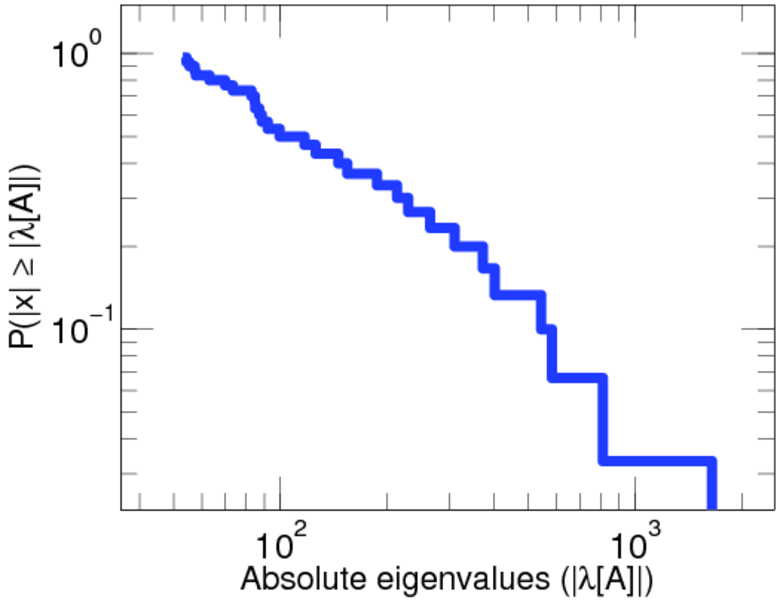
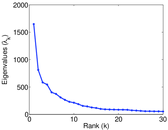
| Spectral norm | α = | 1,647.97
|
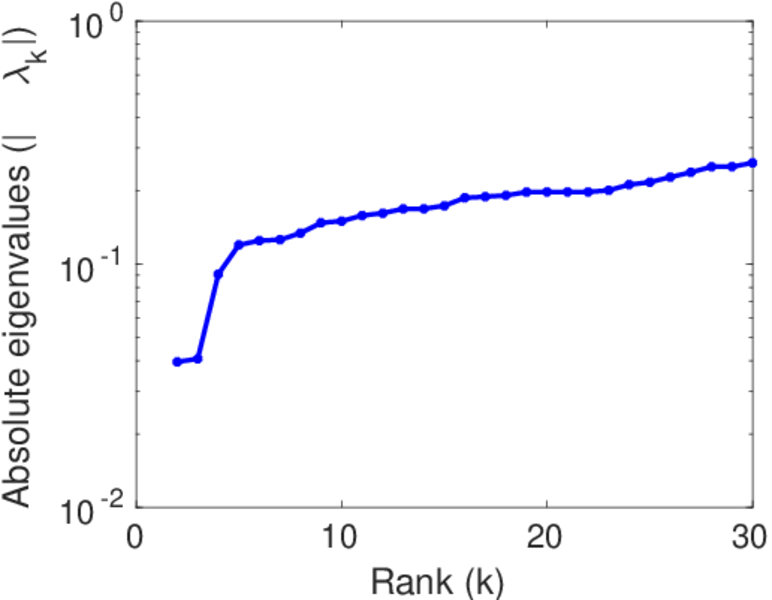
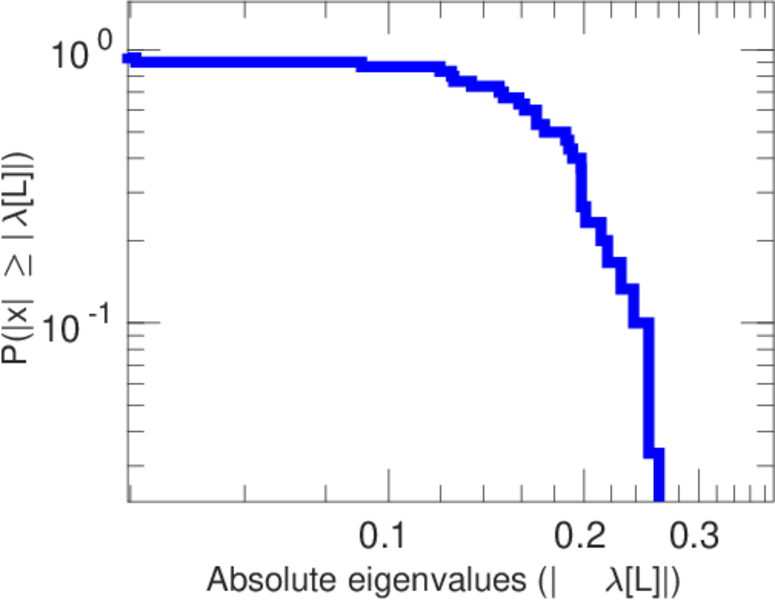
| Algebraic connectivity | a = | 0.039 601 4
|
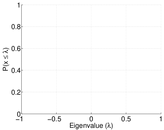
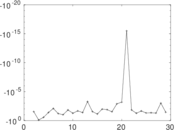
| Spectral separation | |λ1[A] / λ2[A]| = | 2.029 70
|
| Controllability | C = | 276,872
|
| Relative controllability | Cr = | 0.992 707
|
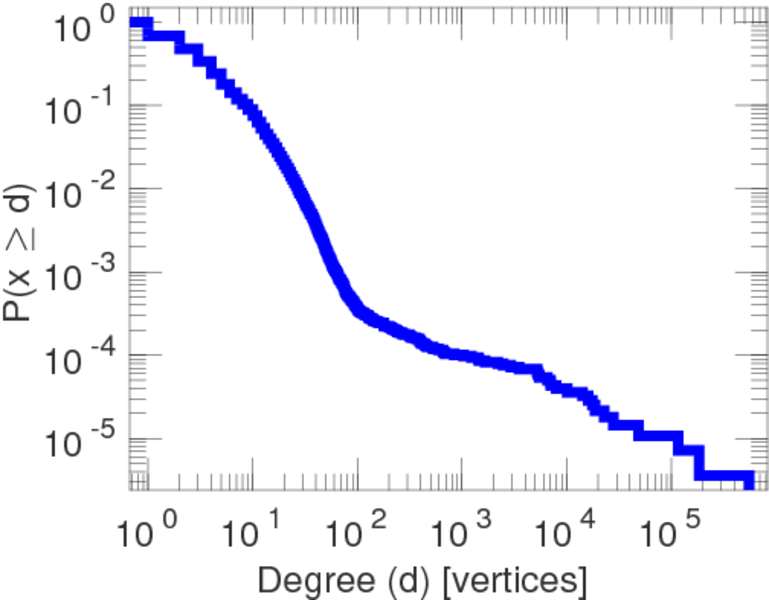
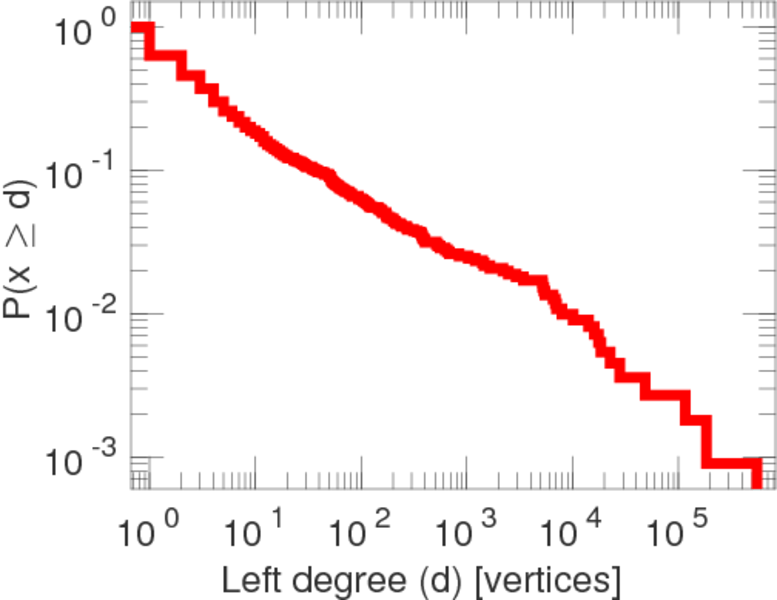
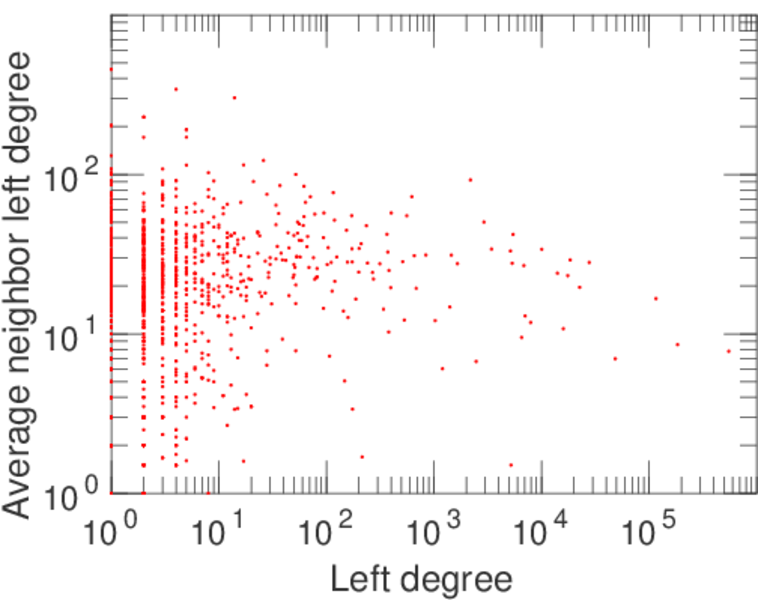
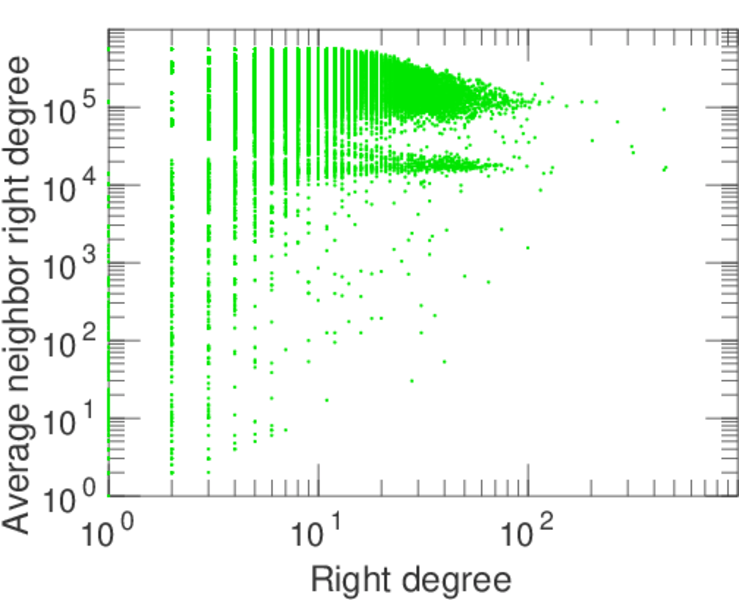
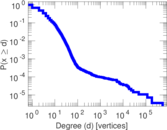
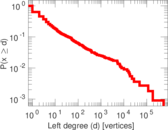
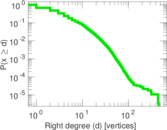
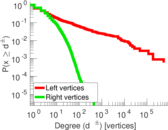
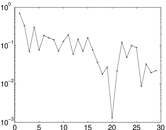
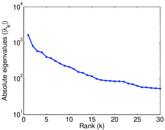
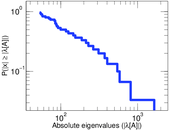
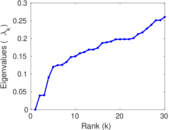
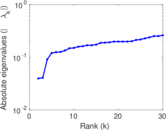
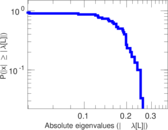
Plots


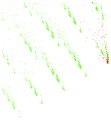


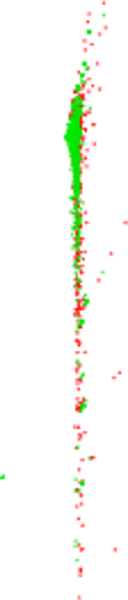
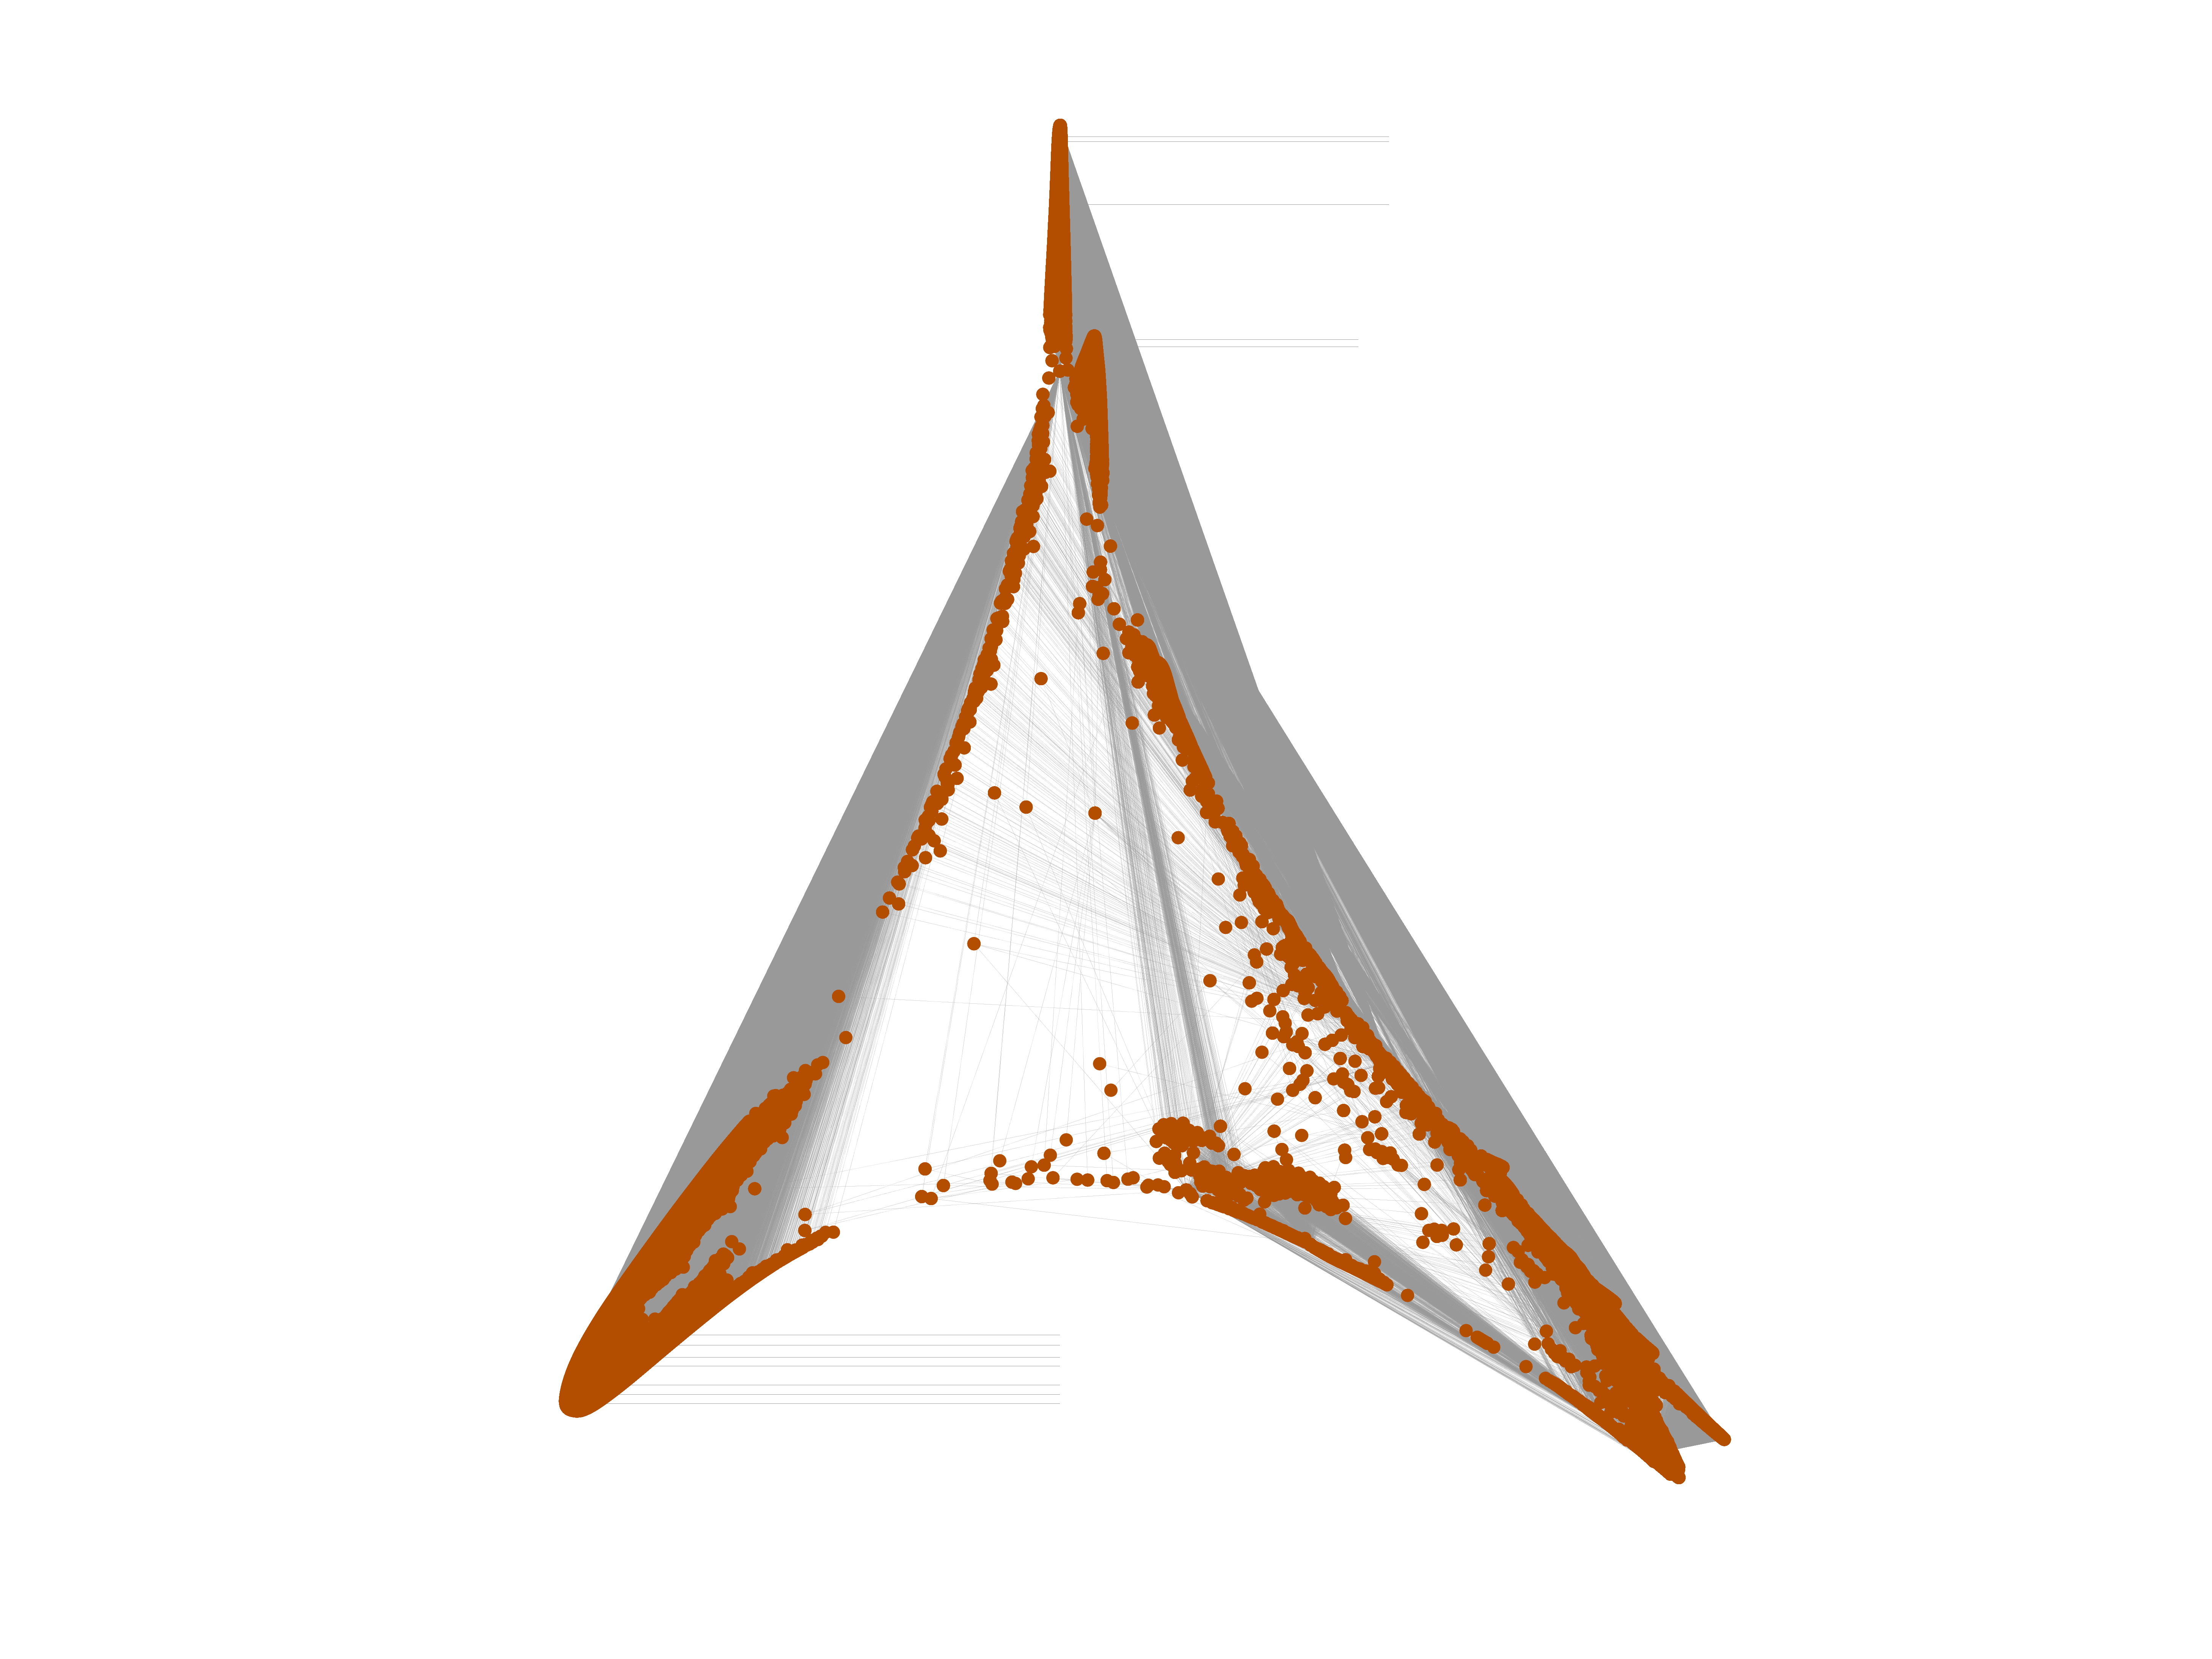
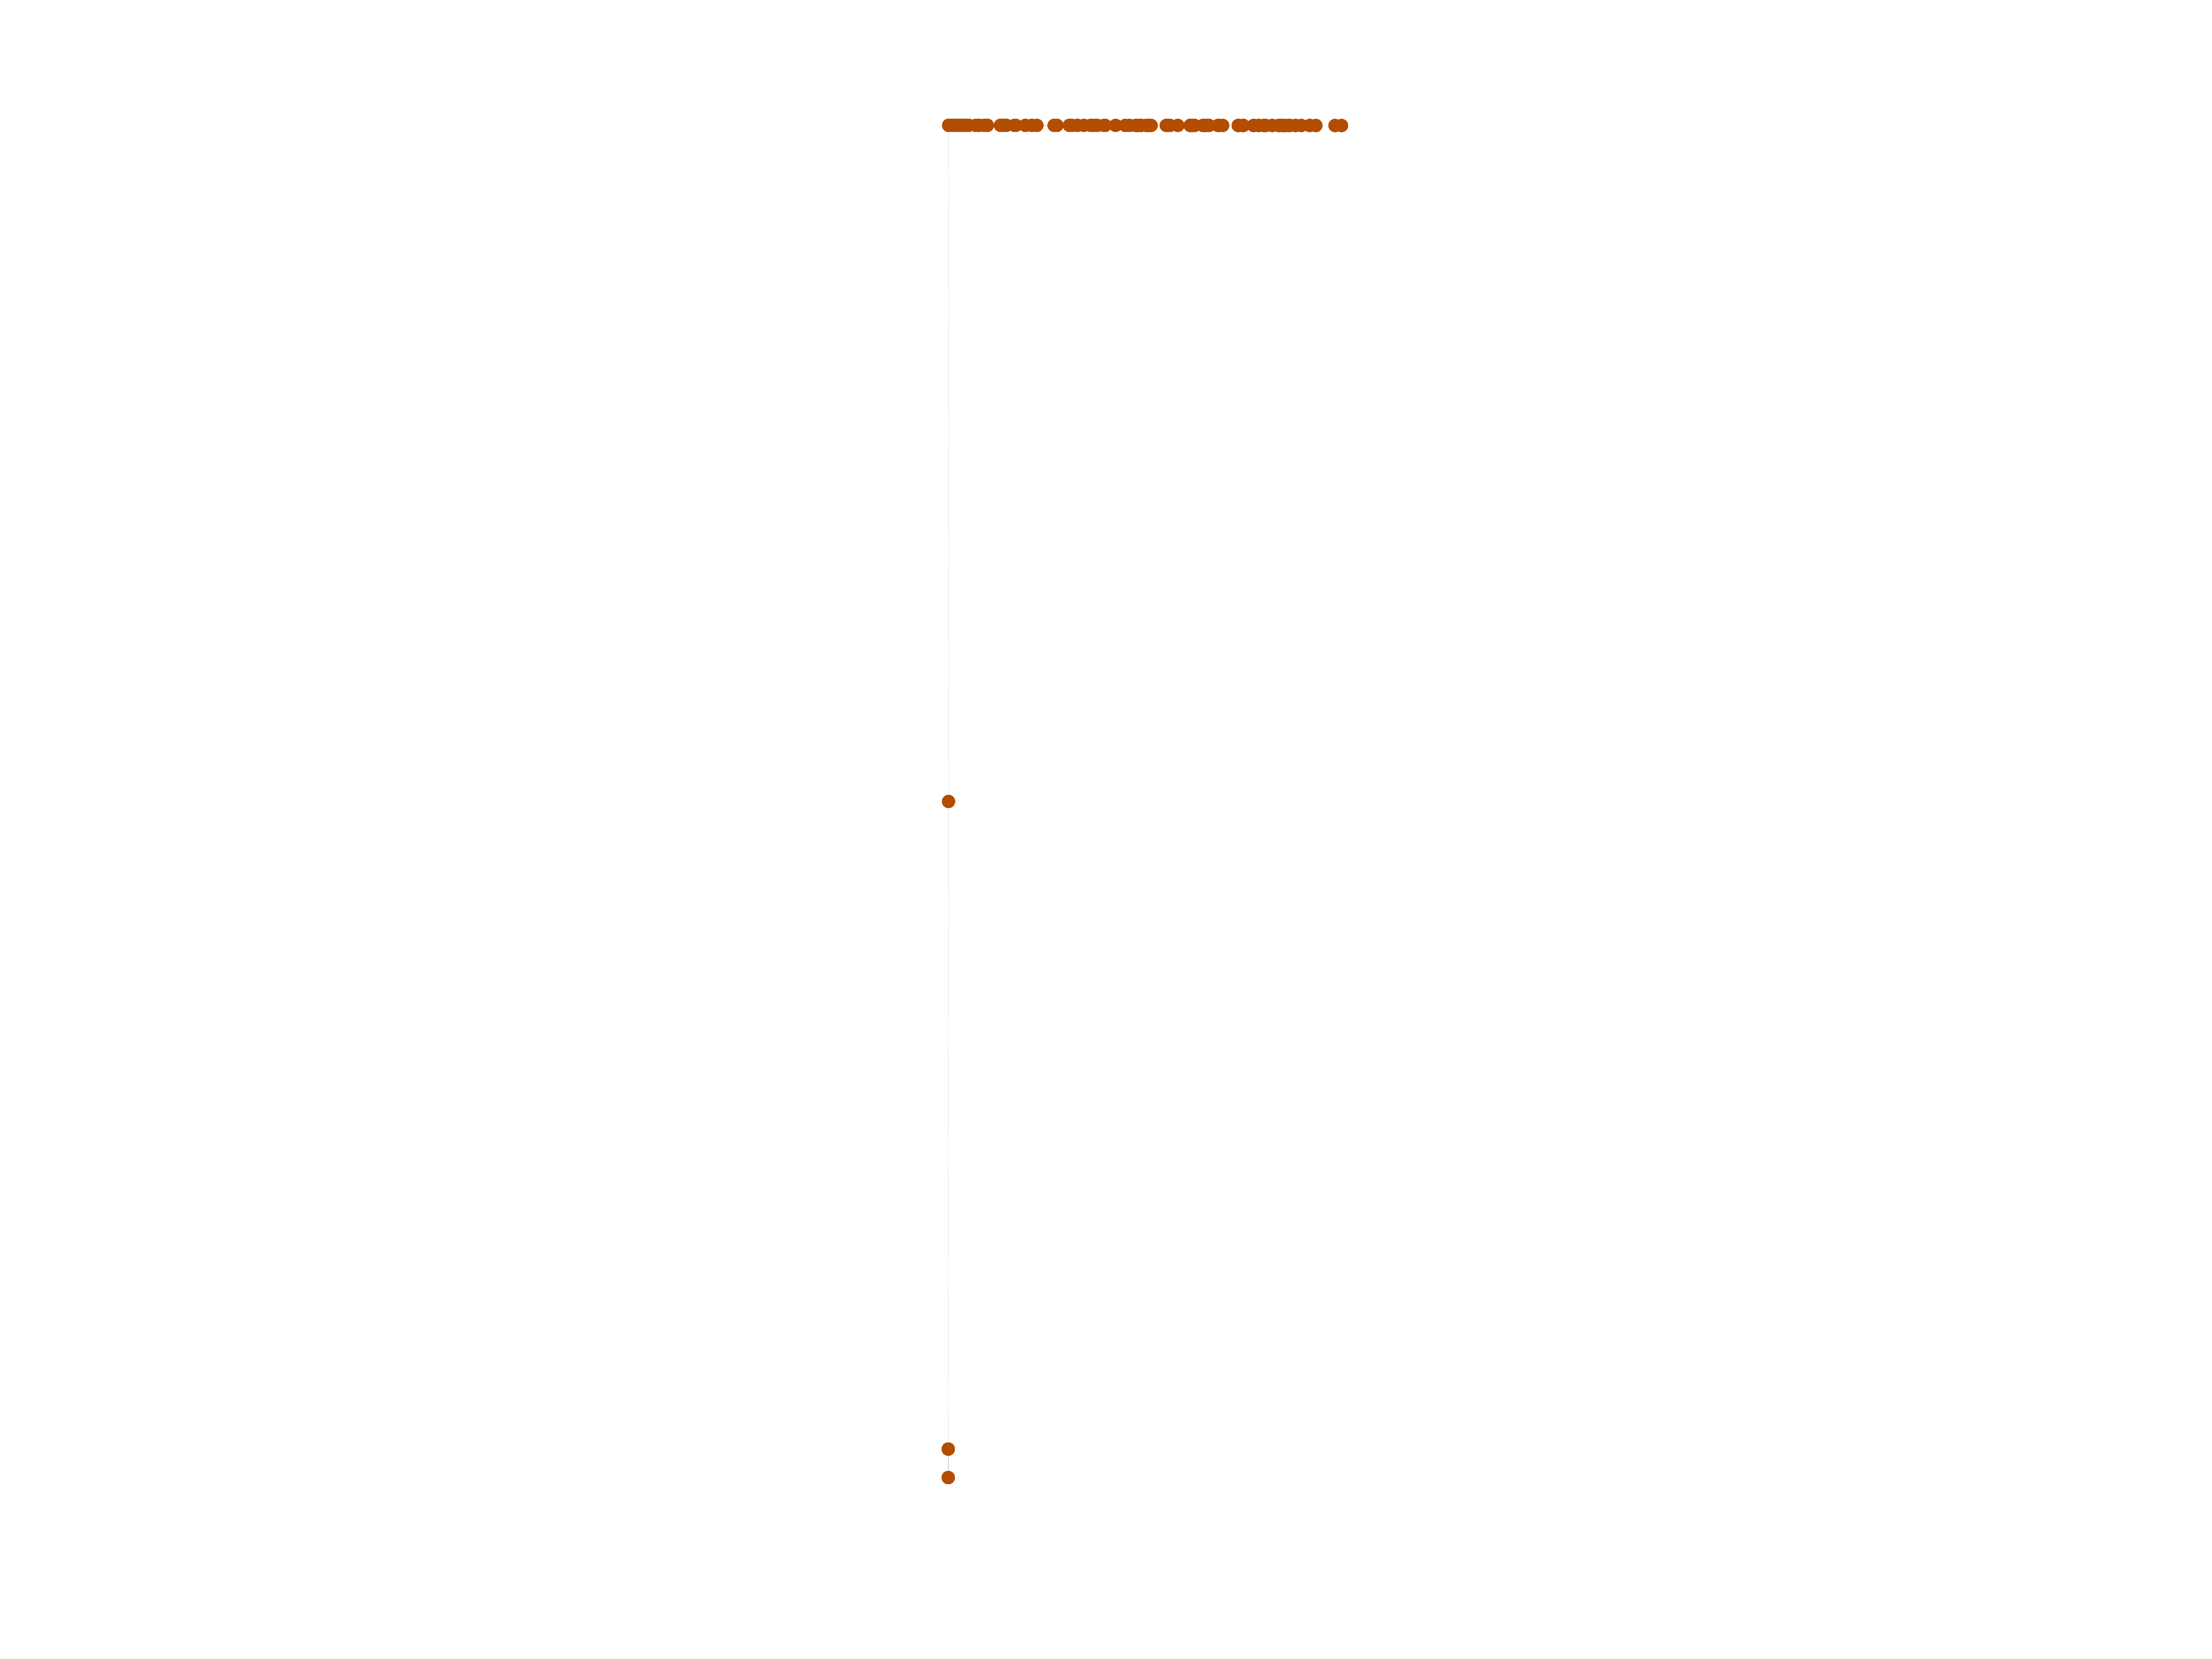
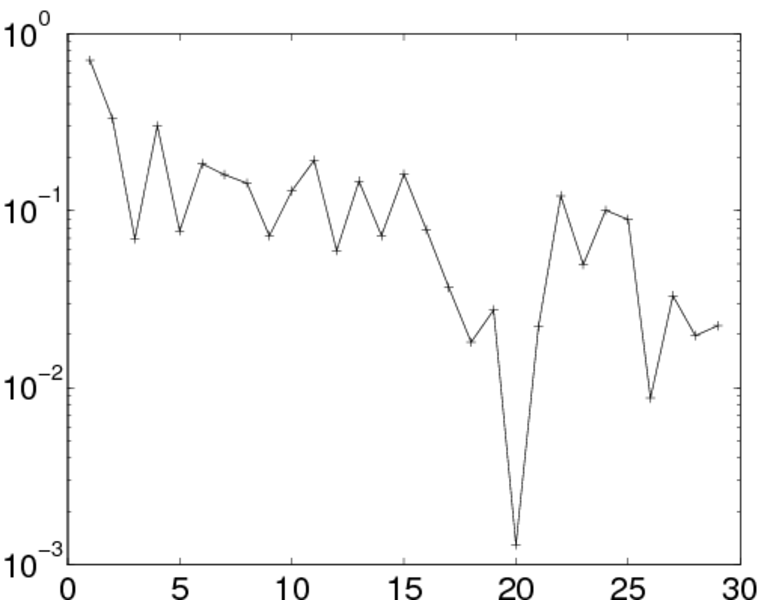
Matrix decompositions plots
Downloads
References
|
[1]
|
Jérôme Kunegis.
KONECT – The Koblenz Network Collection.
In Proc. Int. Conf. on World Wide Web Companion, pages
1343–1350, 2013.
[ http ]
|
|
[2]
|
Wikimedia Foundation.
Wikimedia downloads.
http://dumps.wikimedia.org/, January 2010.
|
 KONECT ‣ Networks ‣
Buy Me a Coffee
KONECT ‣ Networks ‣
Buy Me a Coffee