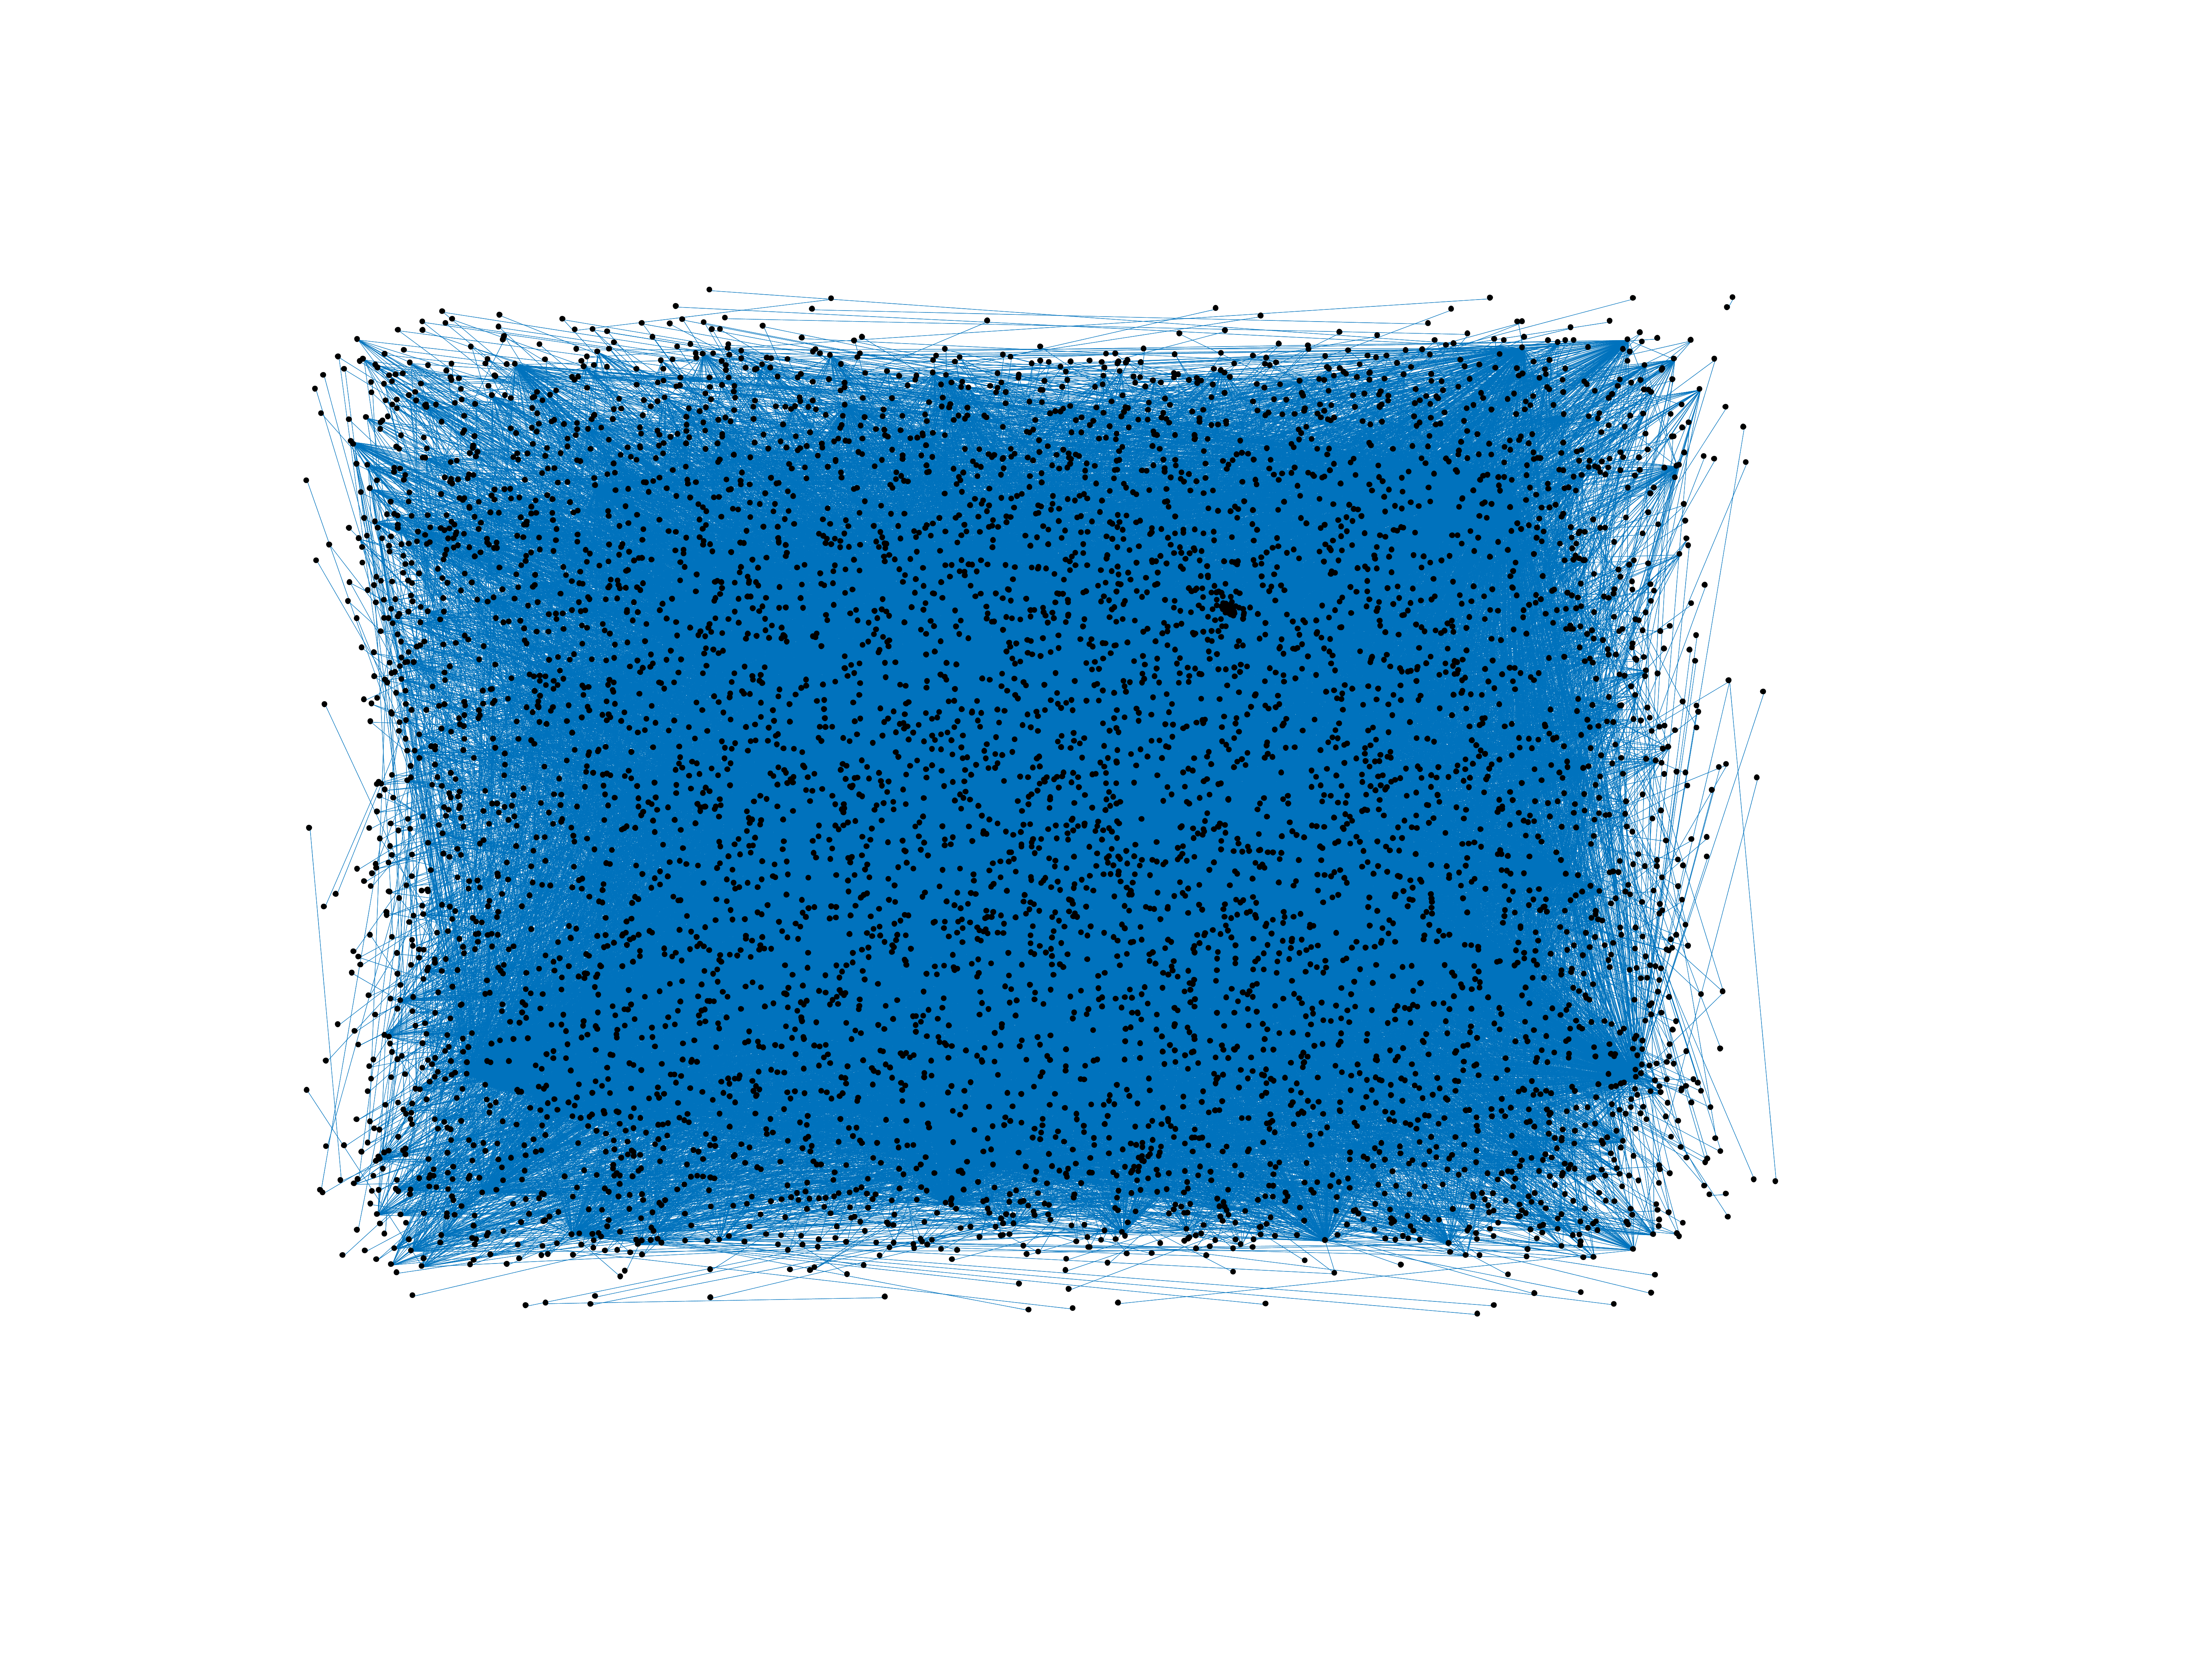
Wikipedia edits (cbk-zam)
This is the bipartite edit network of the Chavacano de Zamboanga Wikipedia. It
contains users and pages from the Chavacano de Zamboanga Wikipedia, connected
by edit events. Each edge represents an edit. The dataset includes the
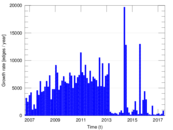
timestamp of each edit.
Metadata
Statistics
| Size | n = | 6,230
|
| Left size | n1 = | 1,057
|
| Right size | n2 = | 5,173
|
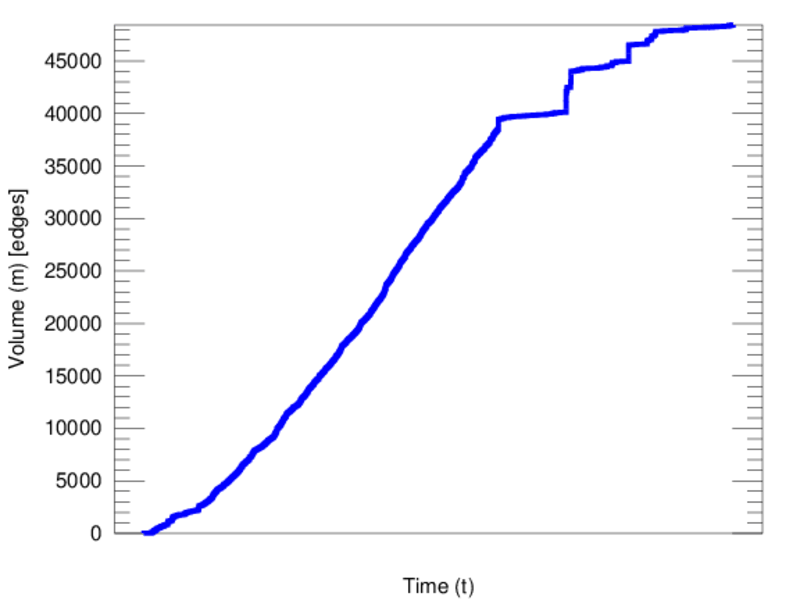
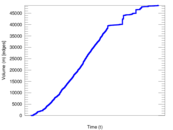
| Volume | m = | 48,432
|
| Unique edge count | m̿ = | 23,319
|
| Wedge count | s = | 6,077,385
|
| Claw count | z = | 2,101,878,237
|
| Cross count | x = | 737,641,207,744
|
| Square count | q = | 11,920,978
|
| 4-Tour count | T4 = | 119,730,778
|
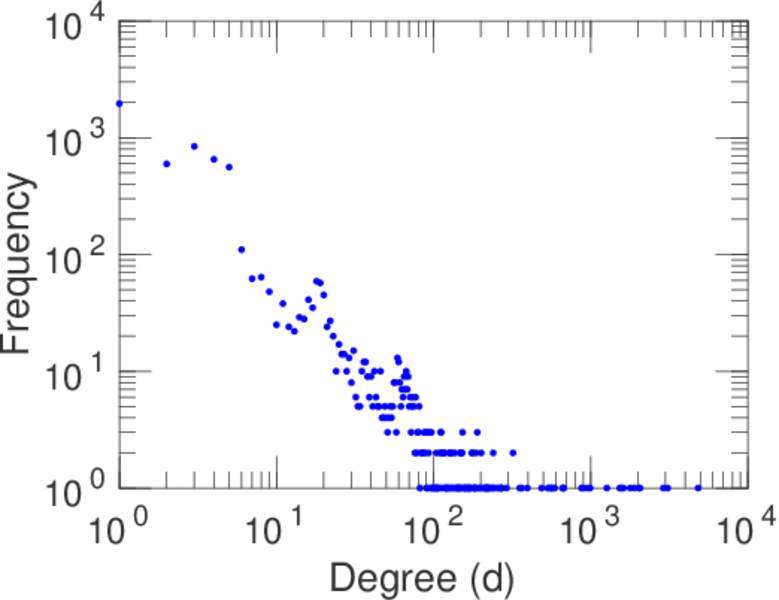
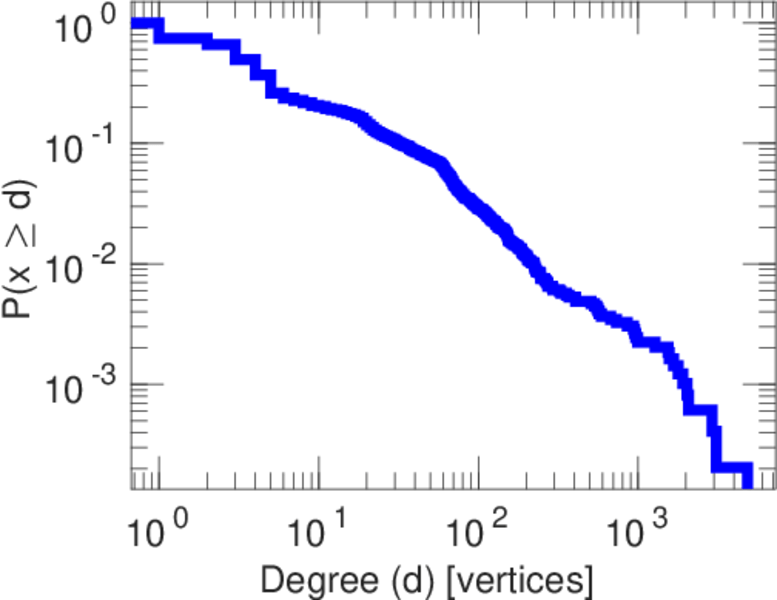
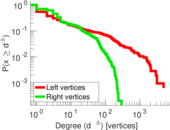
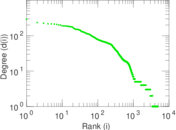
| Maximum degree | dmax = | 4,846
|
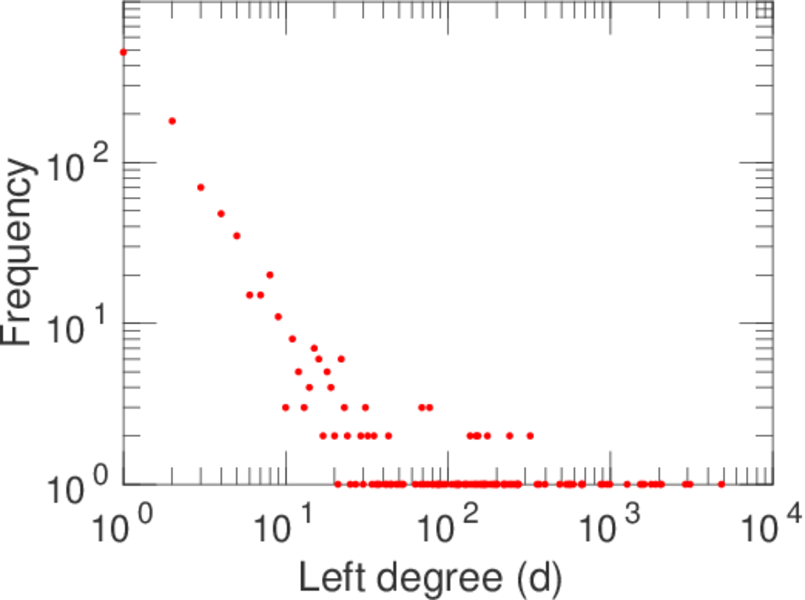
| Maximum left degree | d1max = | 4,846
|
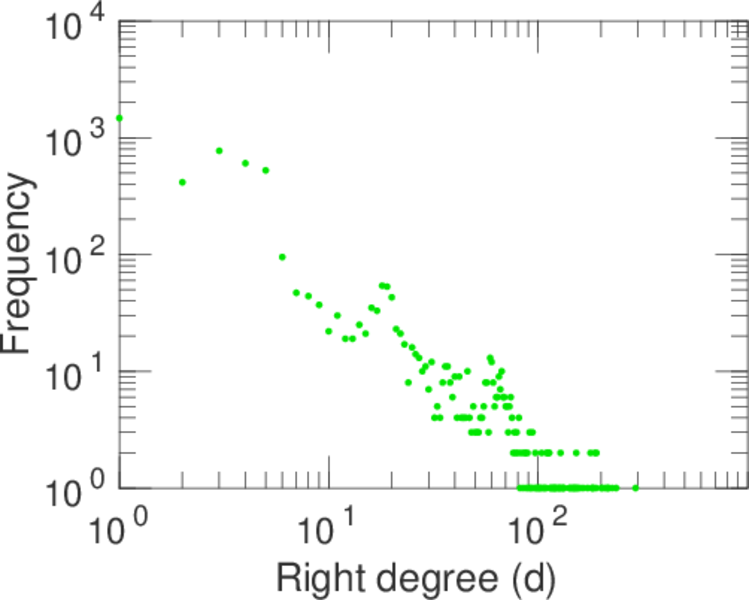
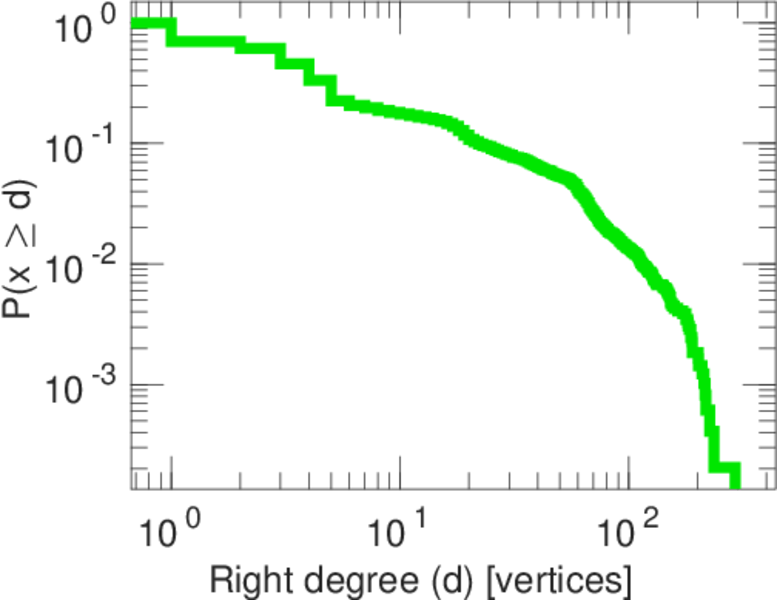
| Maximum right degree | d2max = | 292
|
| Average degree | d = | 15.548 0
|
| Average left degree | d1 = | 45.820 2
|
| Average right degree | d2 = | 9.362 46
|
| Fill | p = | 0.004 264 74
|
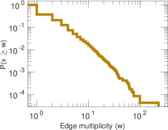
| Average edge multiplicity | m̃ = | 2.076 93
|
| Size of LCC | N = | 5,307
|
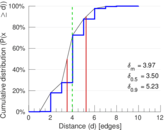
| Diameter | δ = | 12
|
| 50-Percentile effective diameter | δ0.5 = | 3.497 80
|
| 90-Percentile effective diameter | δ0.9 = | 5.227 31
|
| Median distance | δM = | 4
|
| Mean distance | δm = | 3.967 35
|
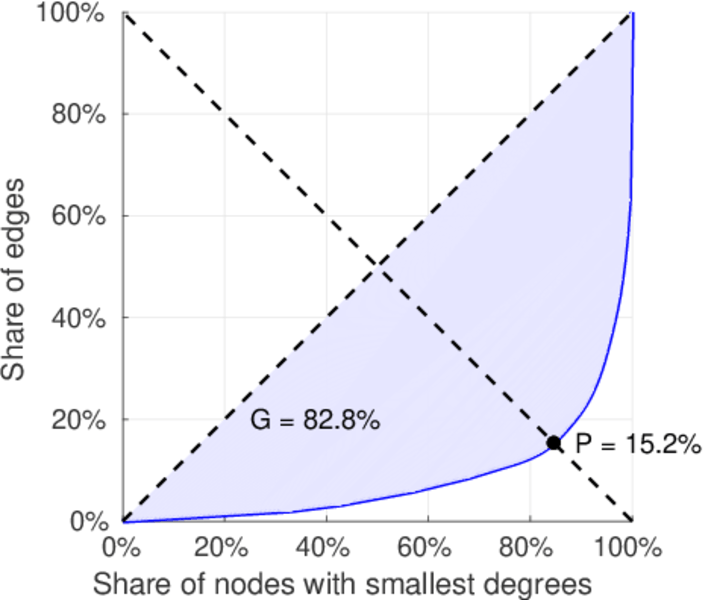
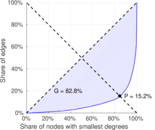
| Gini coefficient | G = | 0.825 786
|
| Balanced inequality ratio | P = | 0.152 523
|
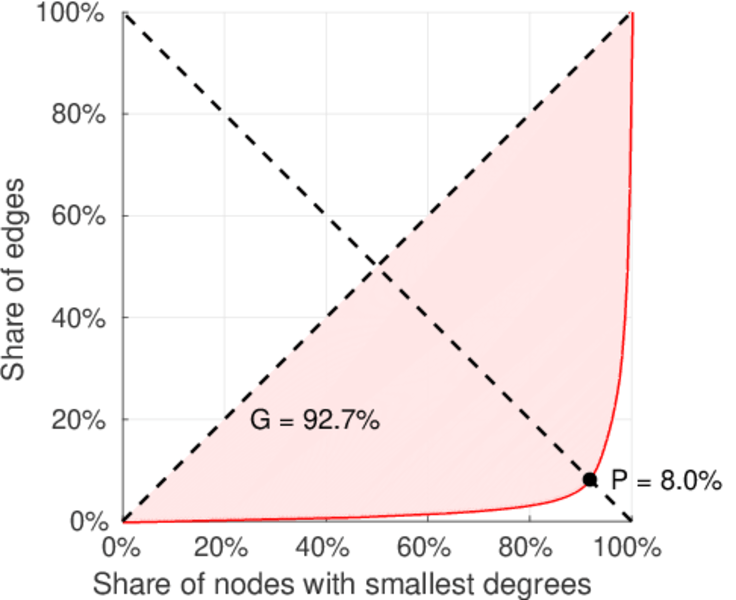
| Left balanced inequality ratio | P1 = | 0.080 463 3
|
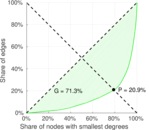
| Right balanced inequality ratio | P2 = | 0.209 097
|
| Relative edge distribution entropy | Her = | 0.790 316
|
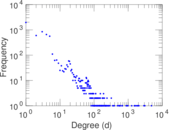
| Power law exponent | γ = | 2.156 15
|
| Tail power law exponent | γt = | 2.201 00
|
| Tail power law exponent with p | γ3 = | 2.201 00
|
| p-value | p = | 0.000 00
|
| Left tail power law exponent with p | γ3,1 = | 1.731 00
|
| Left p-value | p1 = | 0.000 00
|
| Right tail power law exponent with p | γ3,2 = | 5.771 00
|
| Right p-value | p2 = | 0.471 000
|
| Degree assortativity | ρ = | −0.402 984
|
| Degree assortativity p-value | pρ = | 0.000 00
|
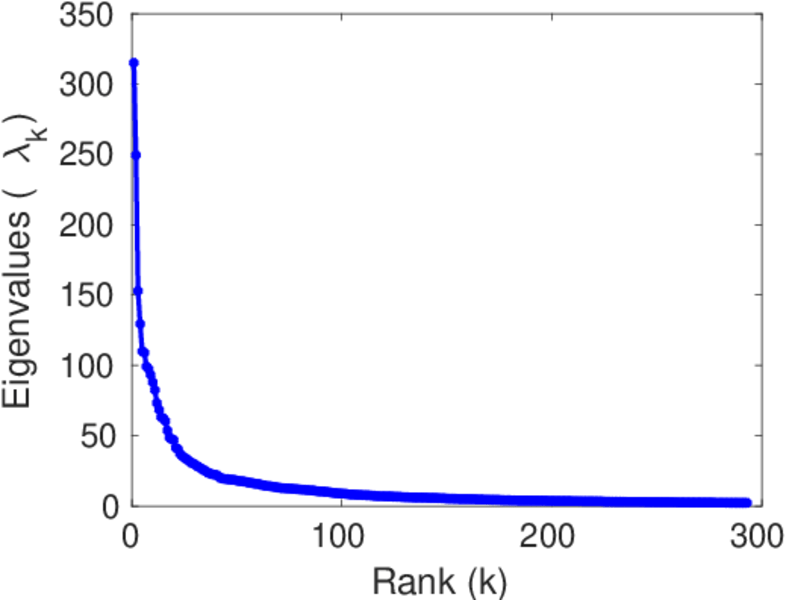
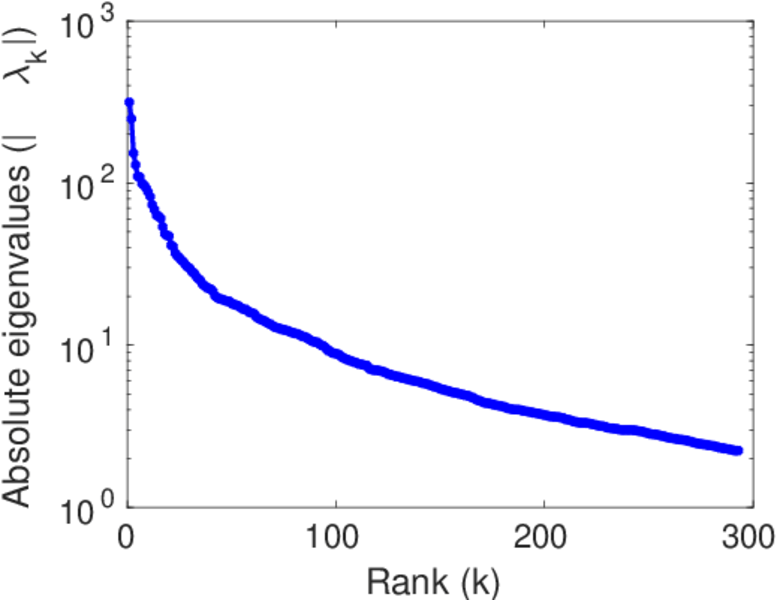
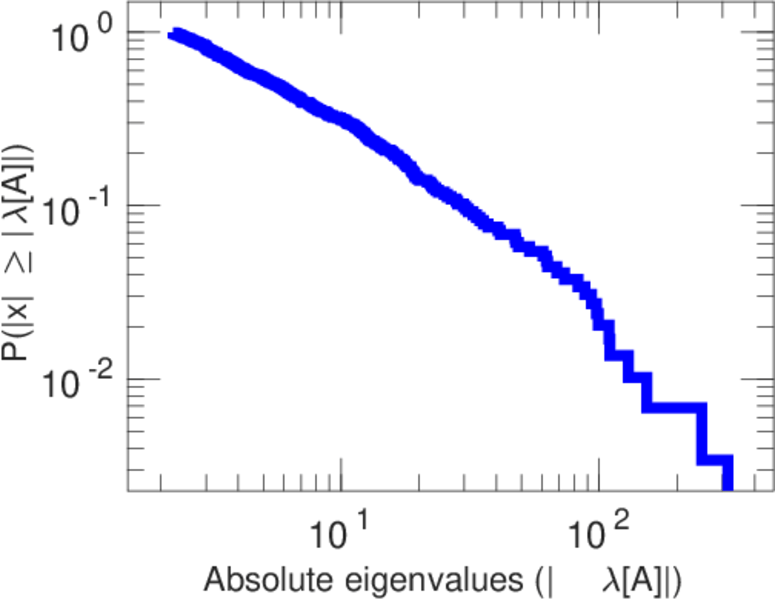
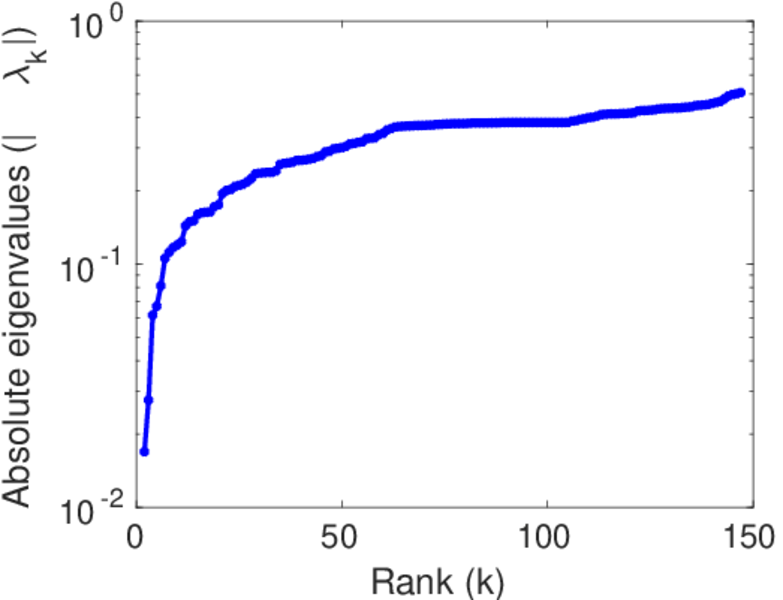
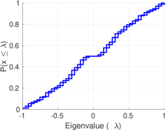
| Spectral norm | α = | 315.094
|
| Algebraic connectivity | a = | 0.016 913 9
|
| Spectral separation | |λ1[A] / λ2[A]| = | 1.262 83
|
| Controllability | C = | 4,199
|
| Relative controllability | Cr = | 0.705 596
|
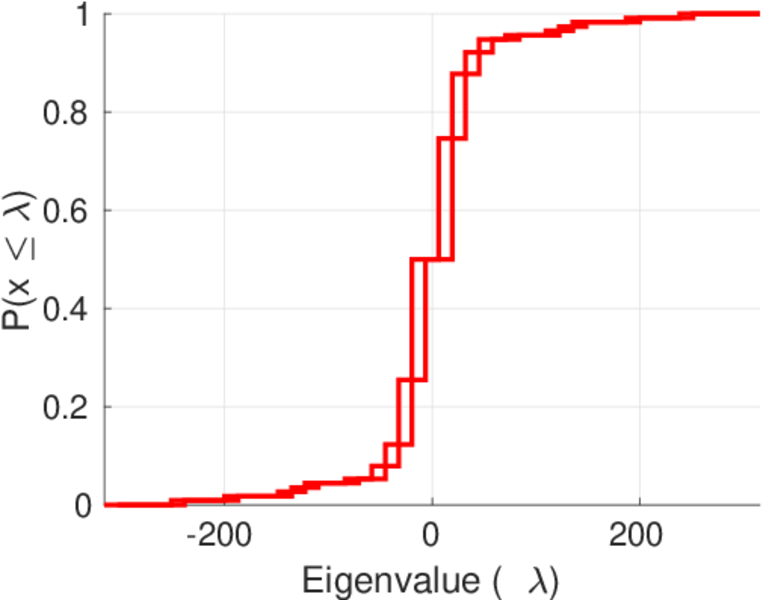
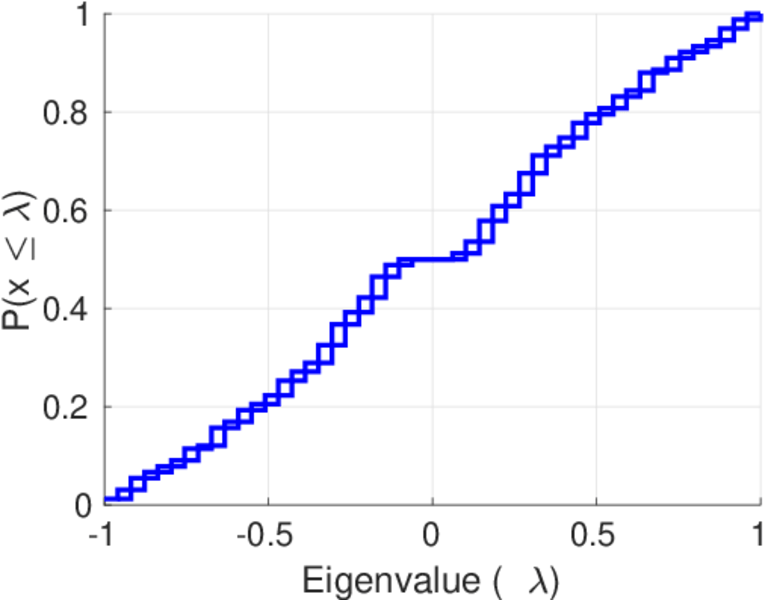
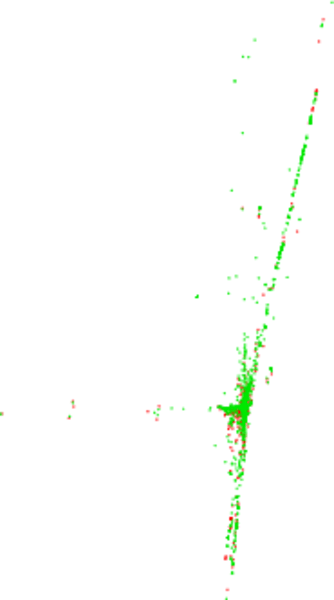
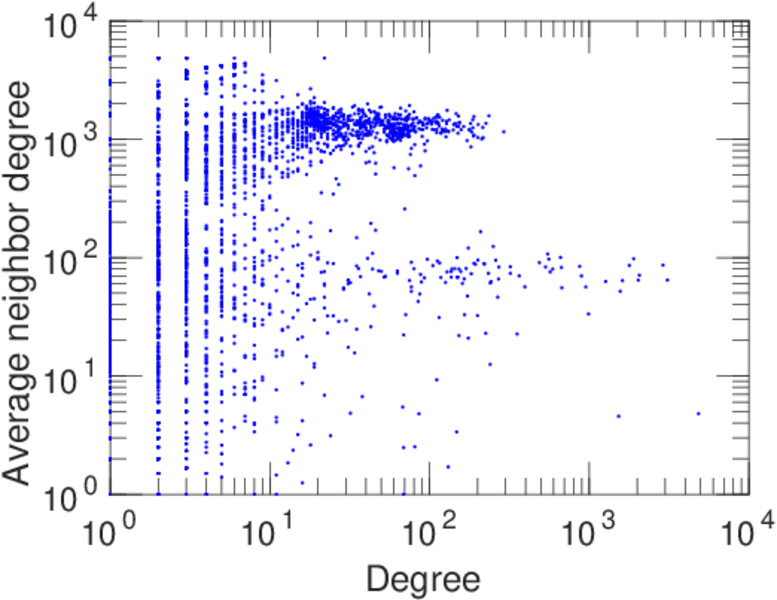
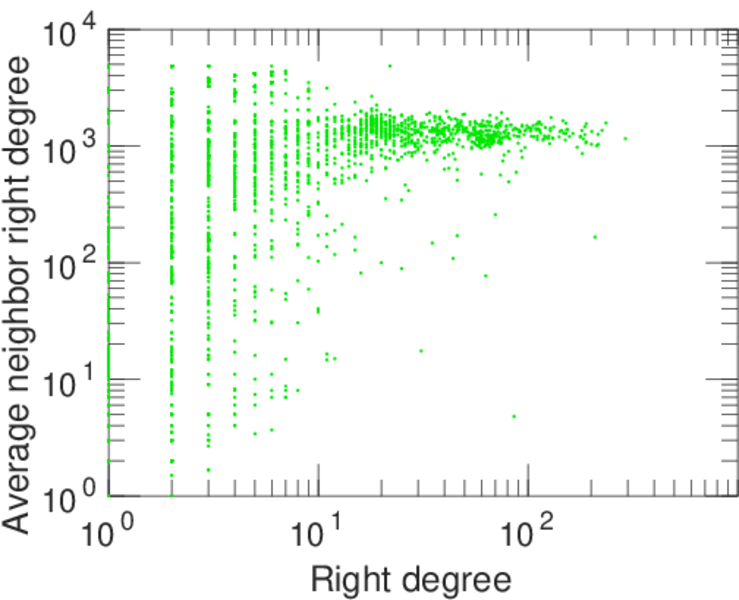
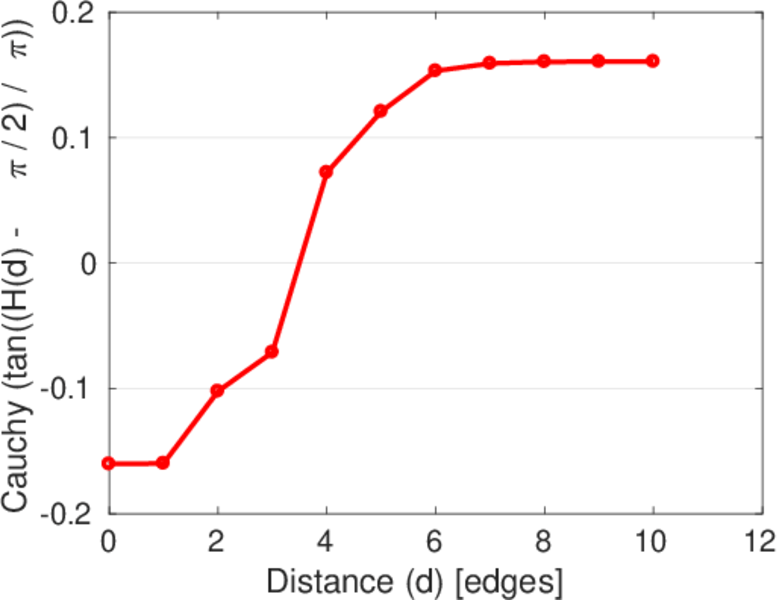
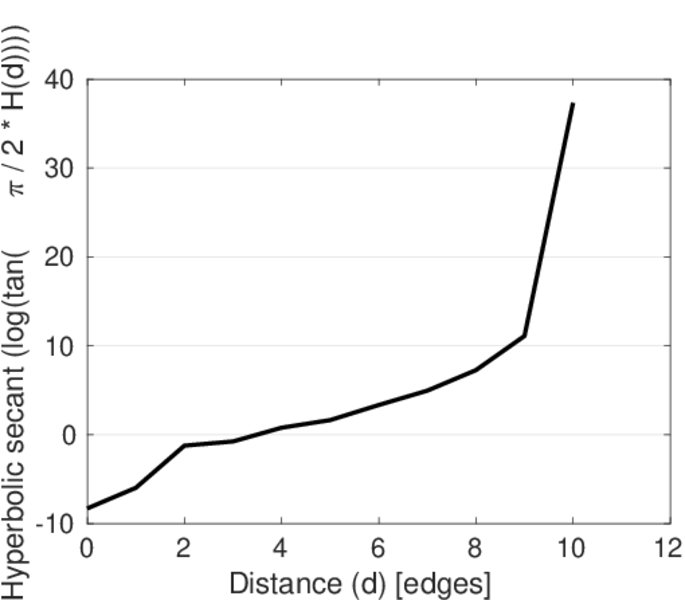
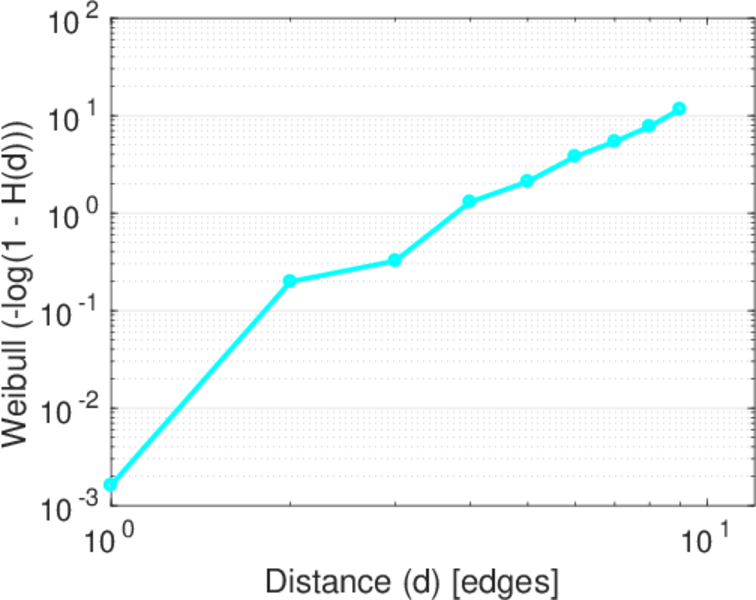
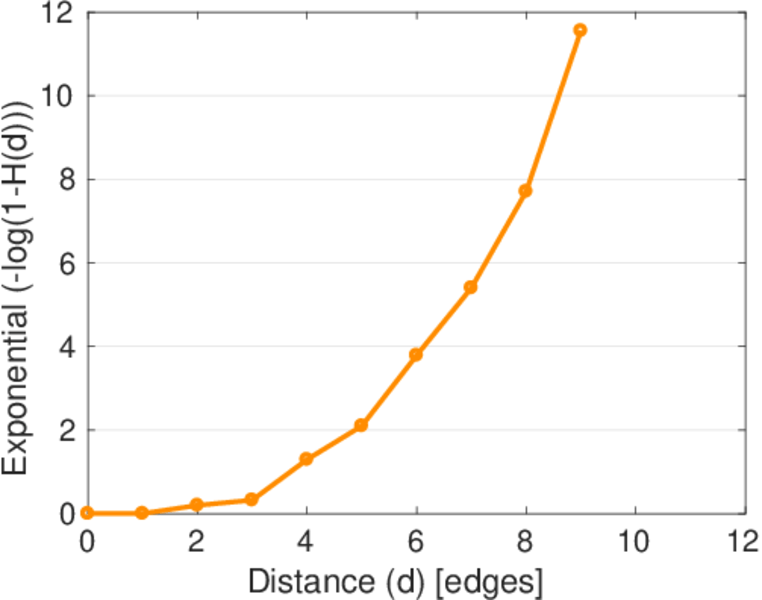
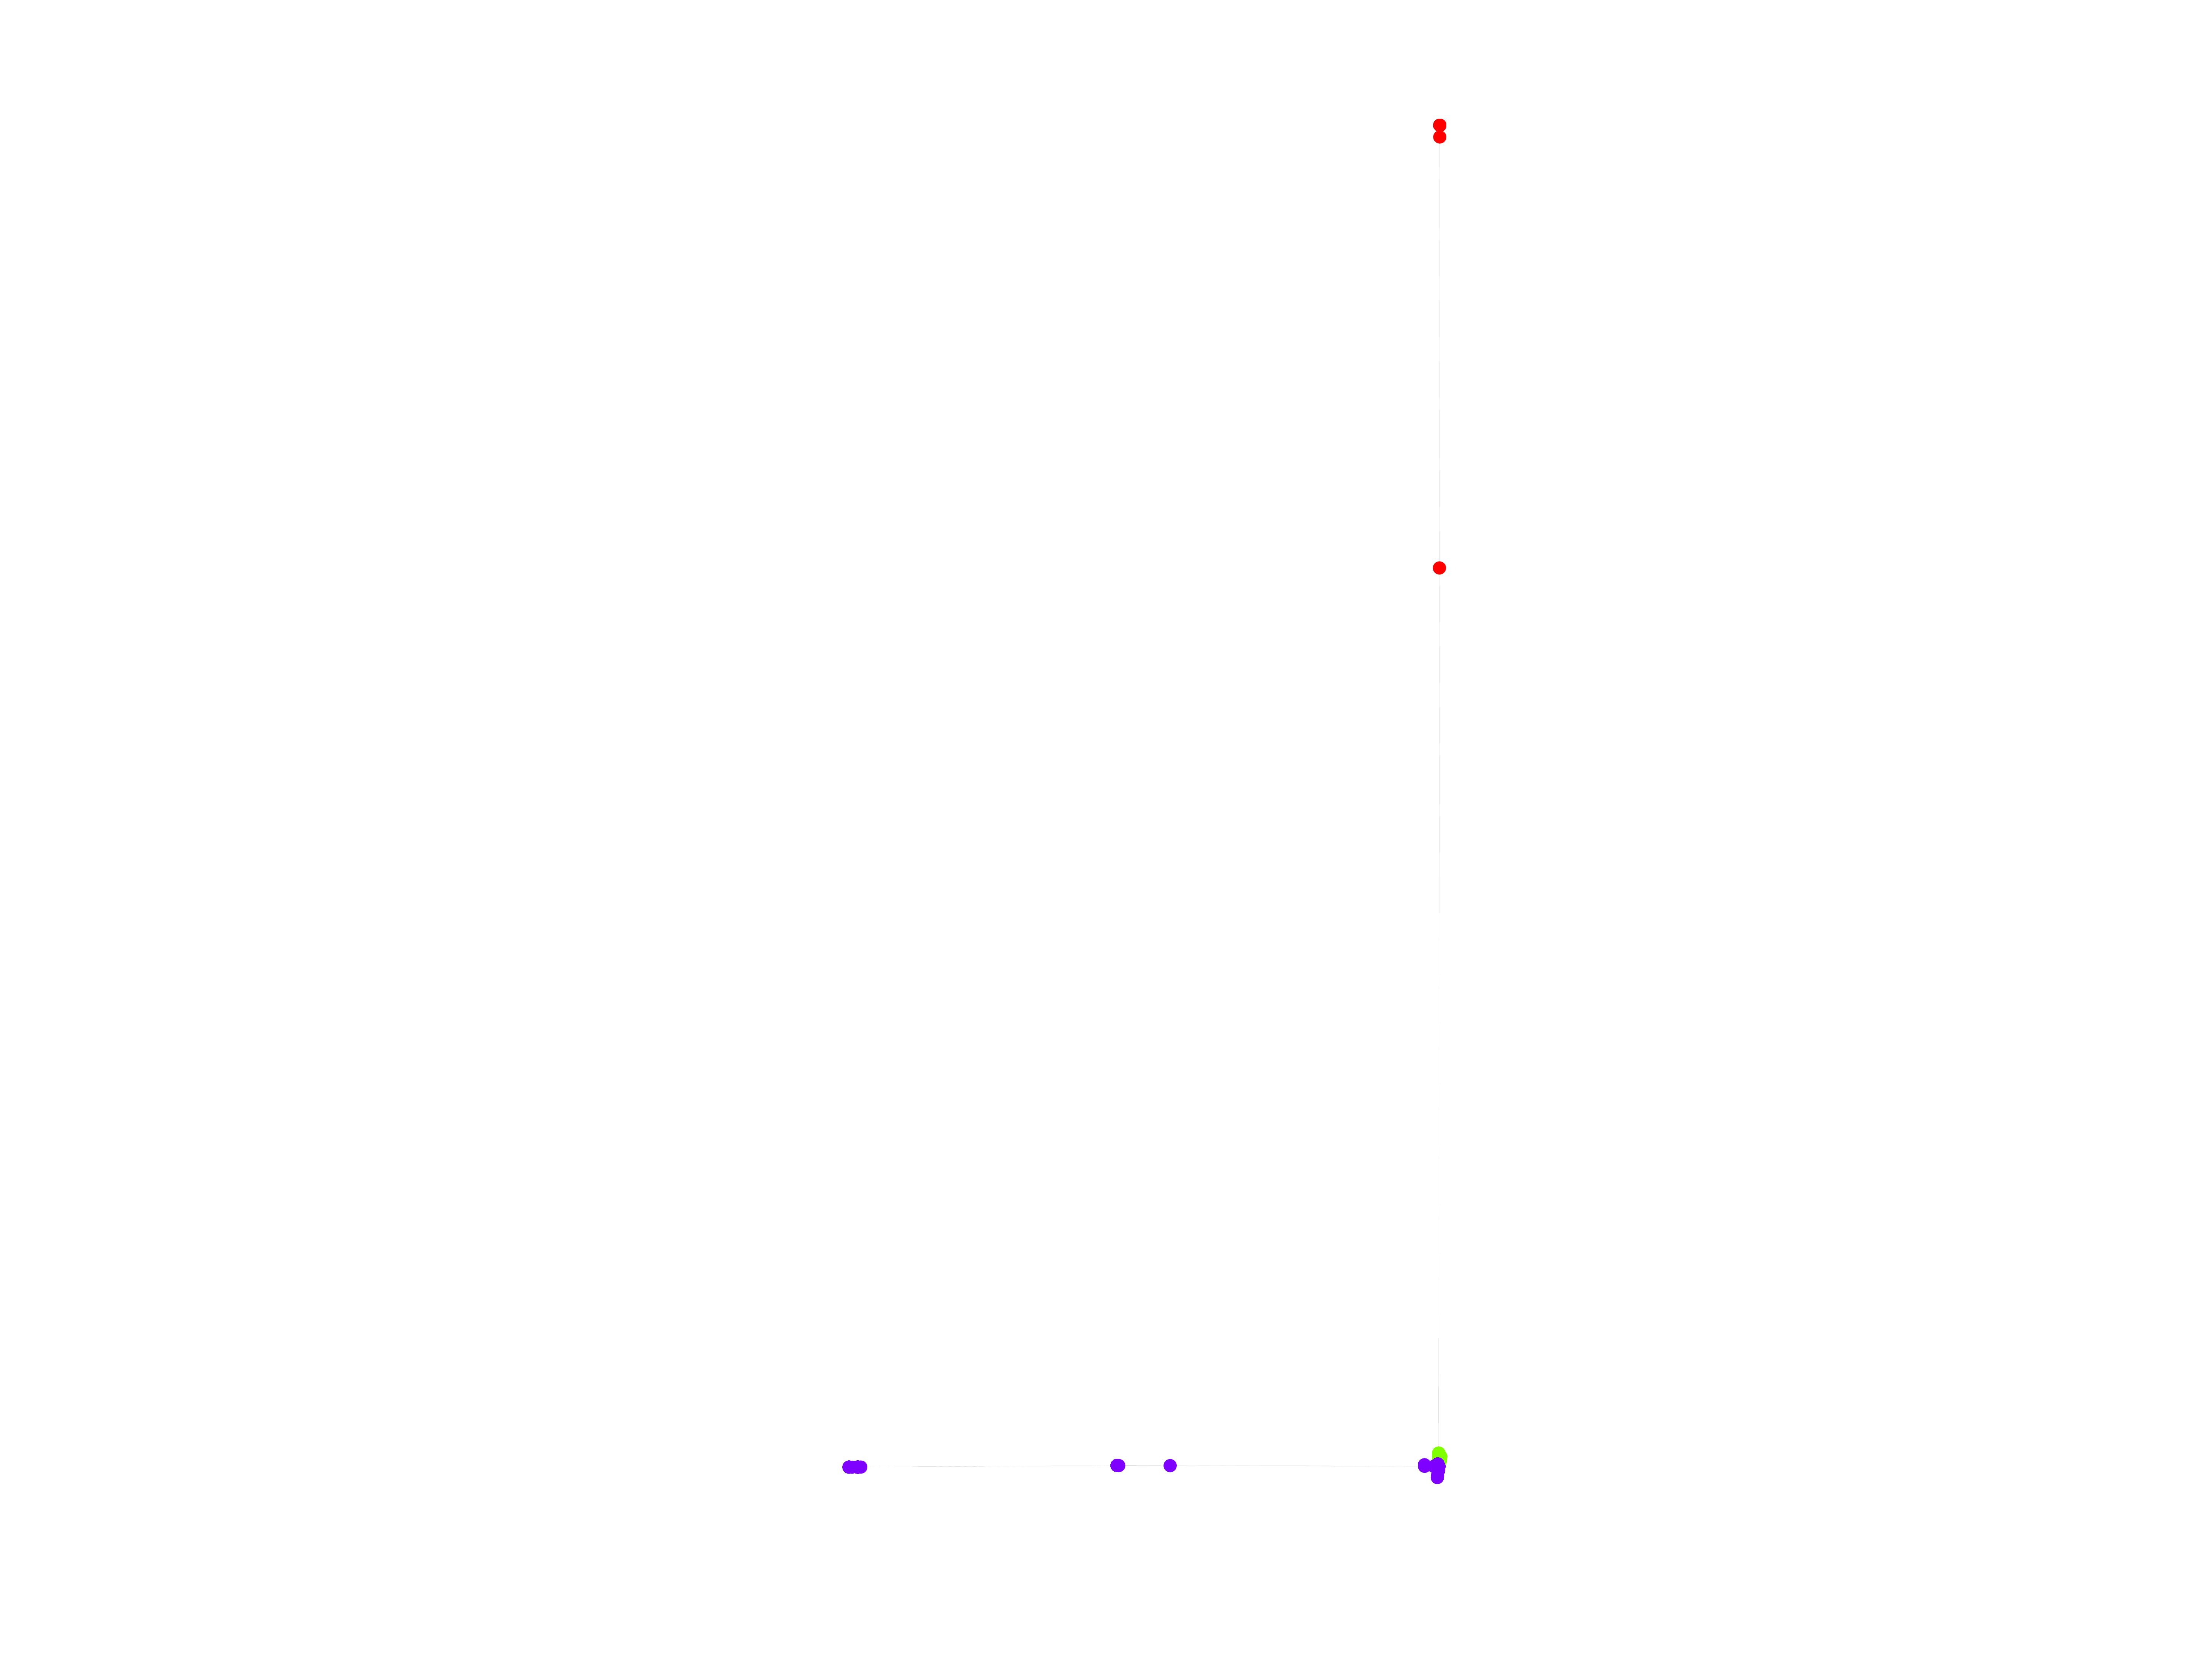
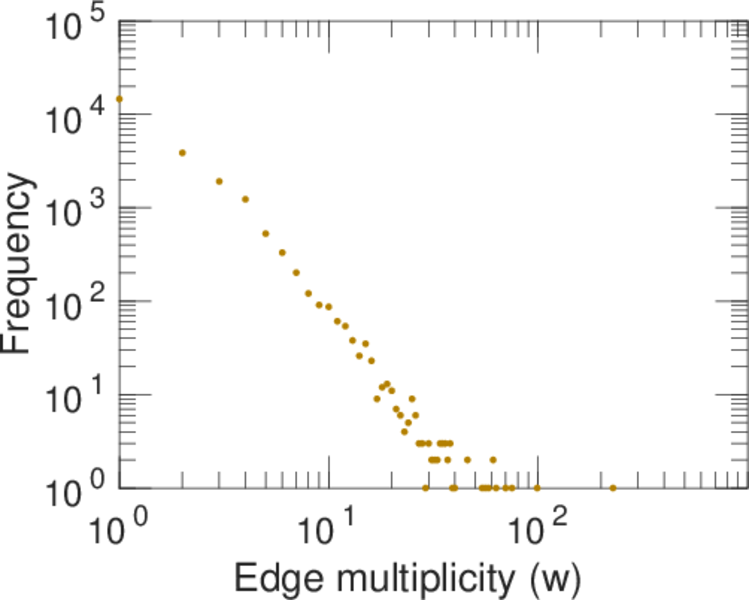
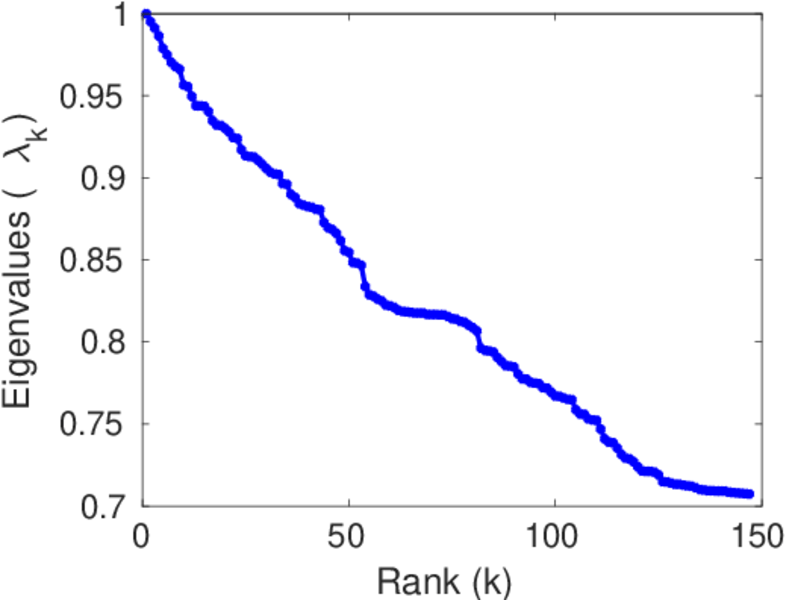
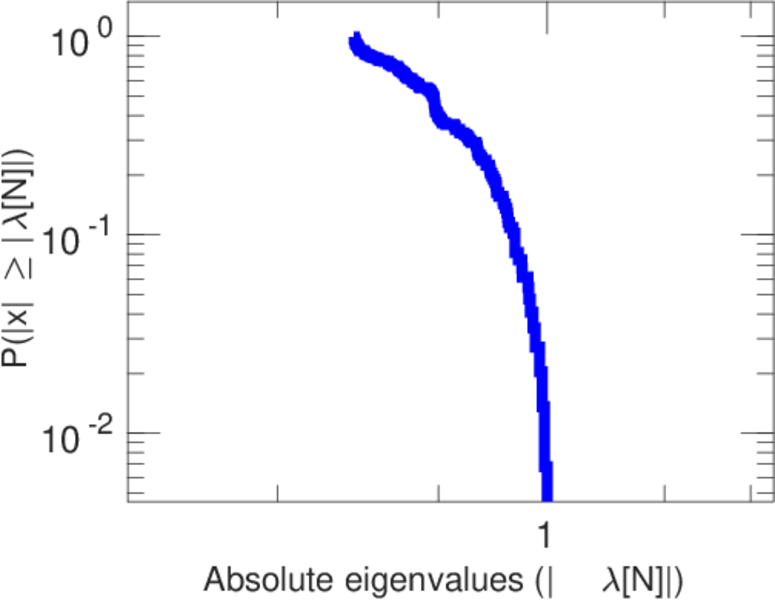
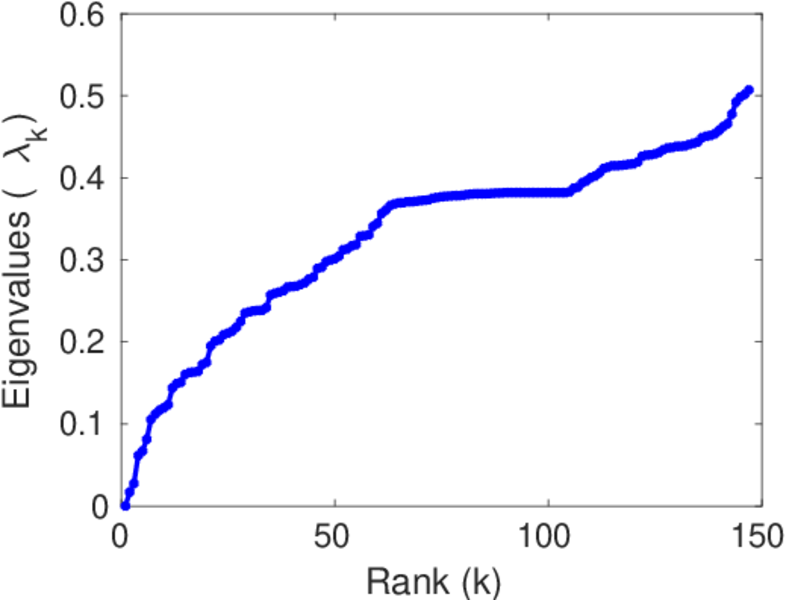
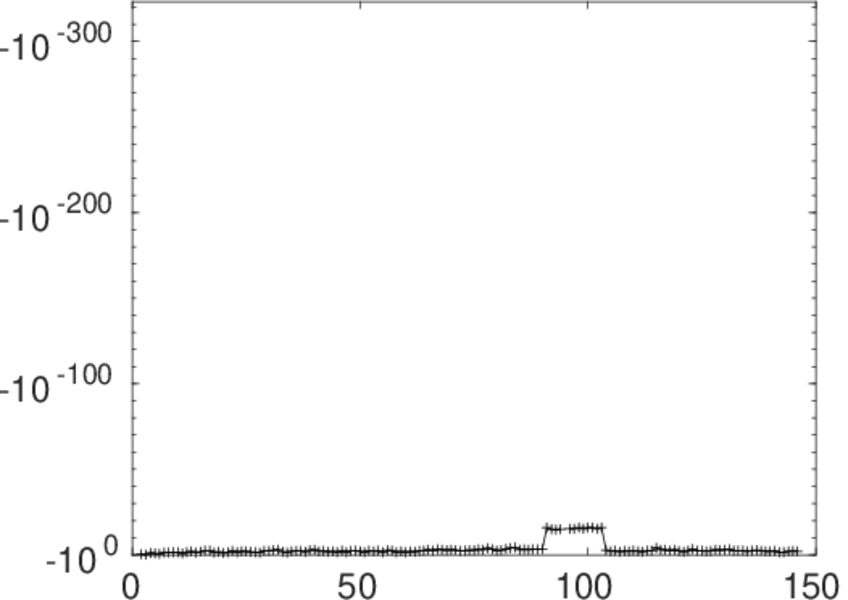
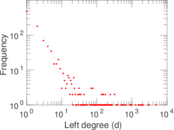
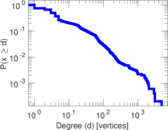
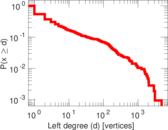
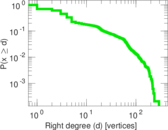
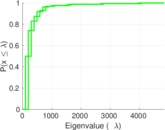
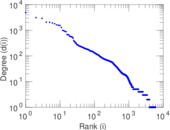
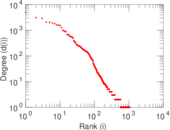
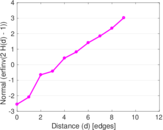
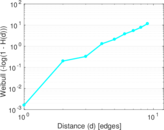
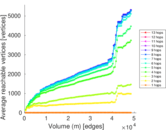
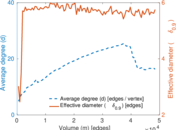
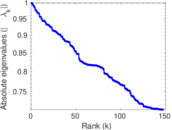
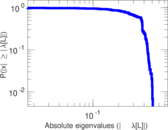
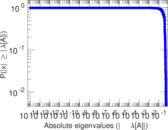
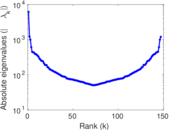
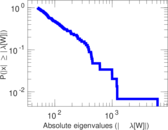
Plots


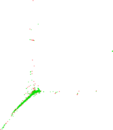


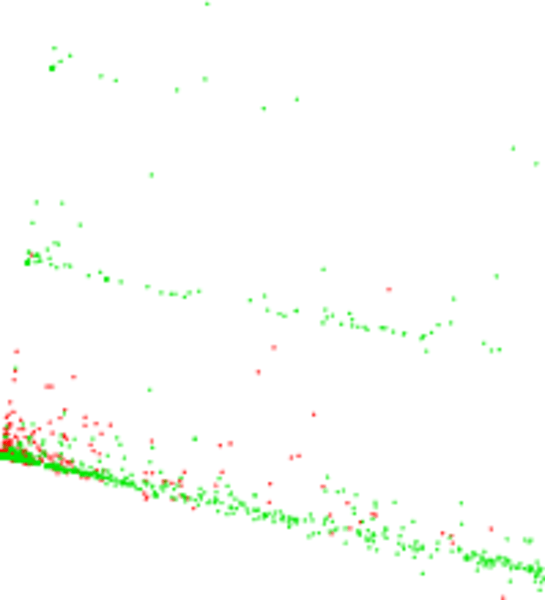
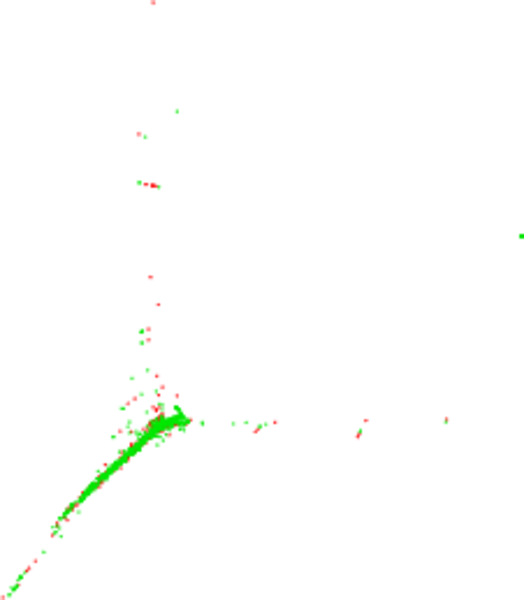
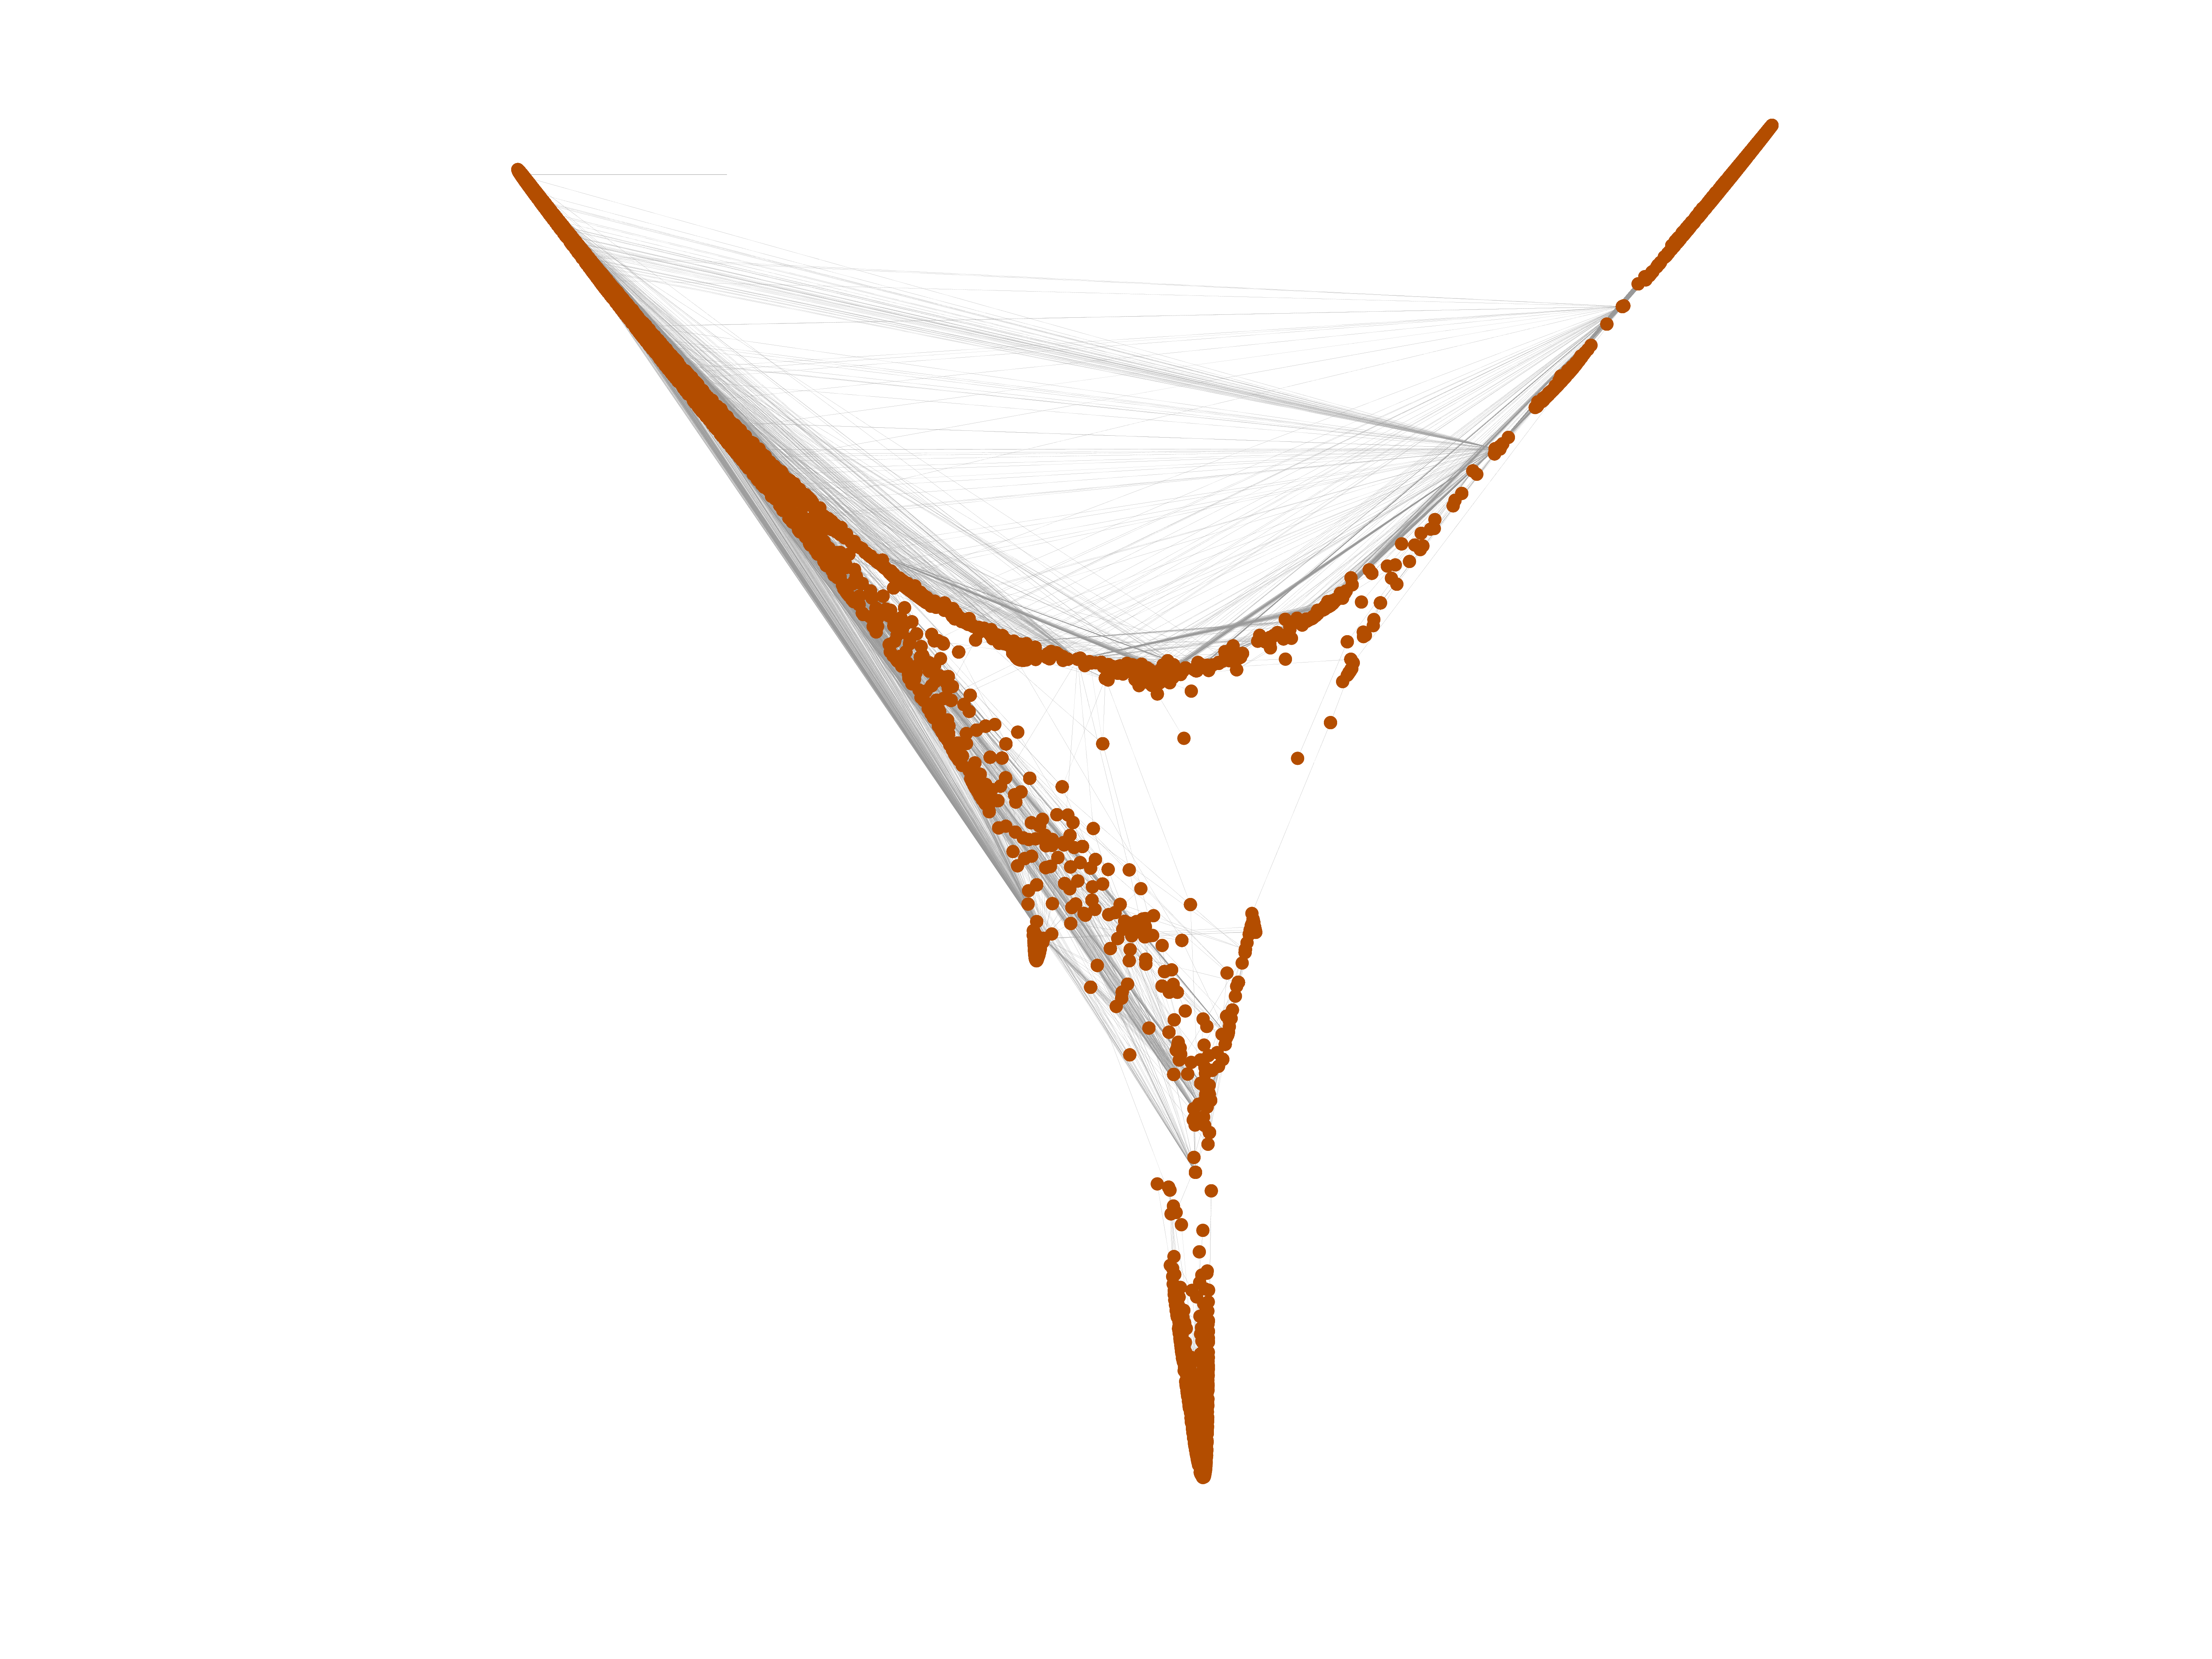
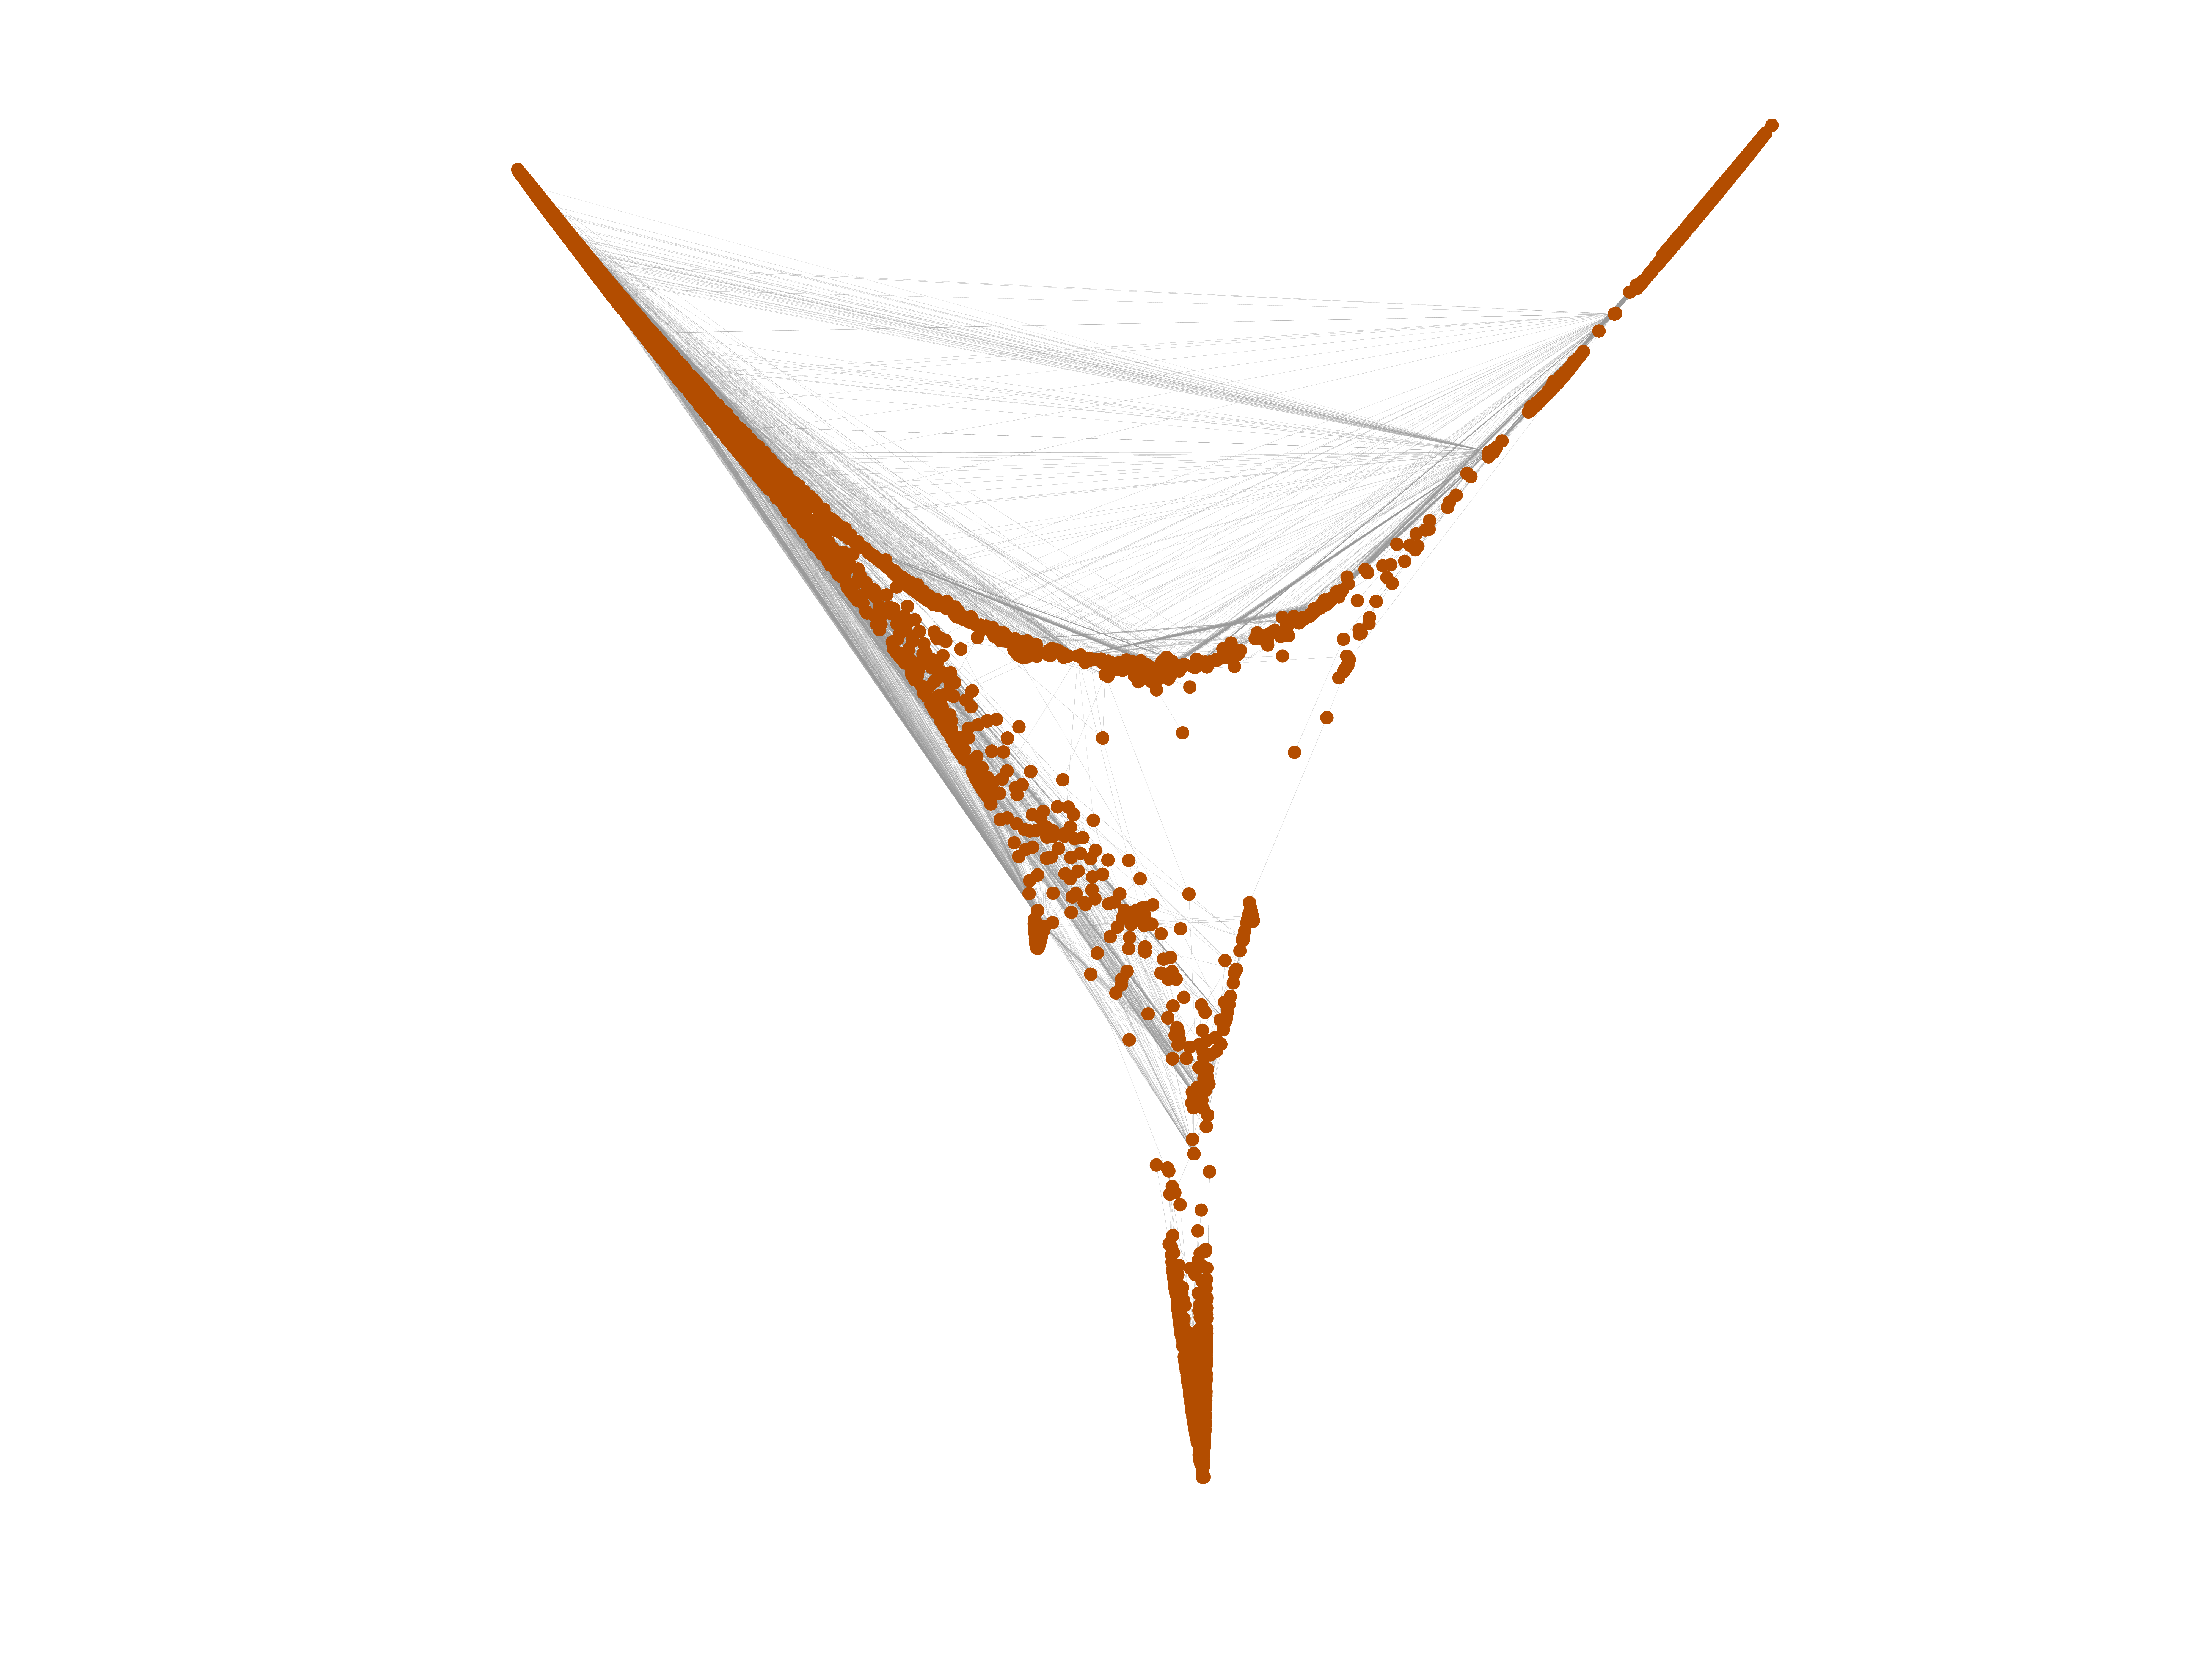
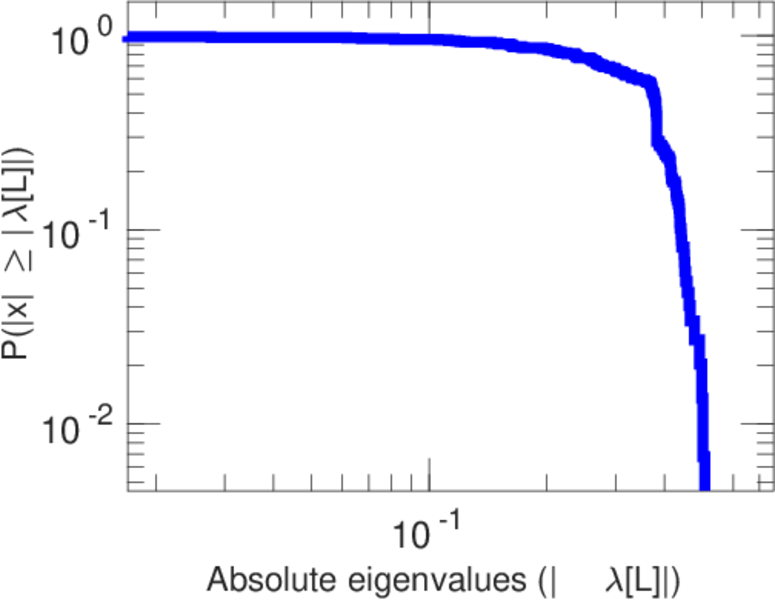
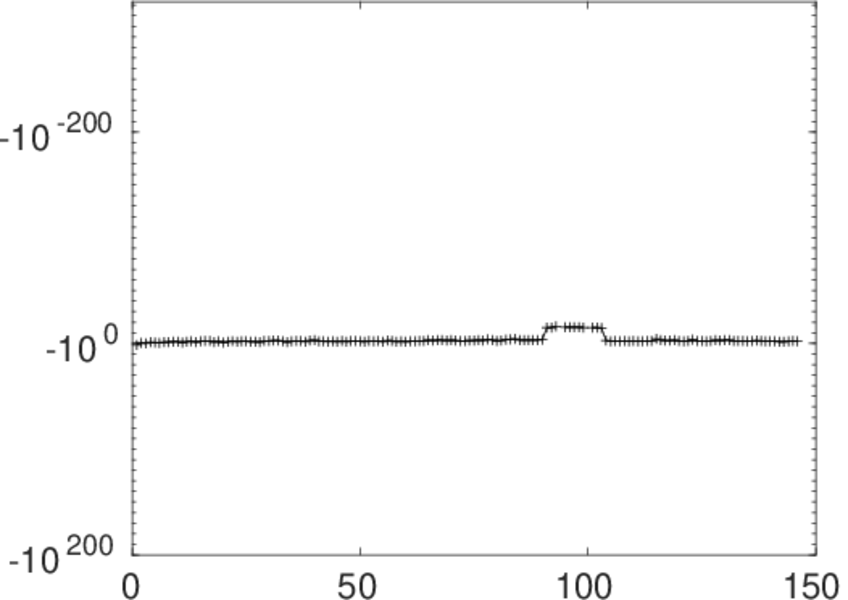
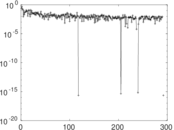
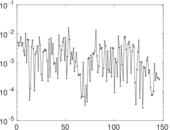
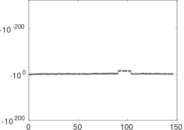
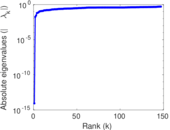
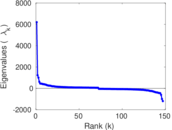
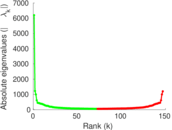
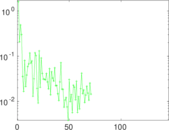
Matrix decompositions plots


Downloads
References
|
[1]
|
Jérôme Kunegis.
KONECT – The Koblenz Network Collection.
In Proc. Int. Conf. on World Wide Web Companion, pages
1343–1350, 2013.
[ http ]
|
|
[2]
|
Wikimedia Foundation.
Wikimedia downloads.
http://dumps.wikimedia.org/, January 2010.
|
 KONECT ‣ Networks ‣
Buy Me a Coffee
KONECT ‣ Networks ‣
Buy Me a Coffee