Wikipedia edits (ce)
This is the bipartite edit network of the Chechen Wikipedia. It contains users
and pages from the Chechen Wikipedia, connected by edit events. Each edge
represents an edit. The dataset includes the timestamp of each edit.
Metadata
Statistics
| Size | n = | 187,459
|
| Left size | n1 = | 1,416
|
| Right size | n2 = | 186,043
|
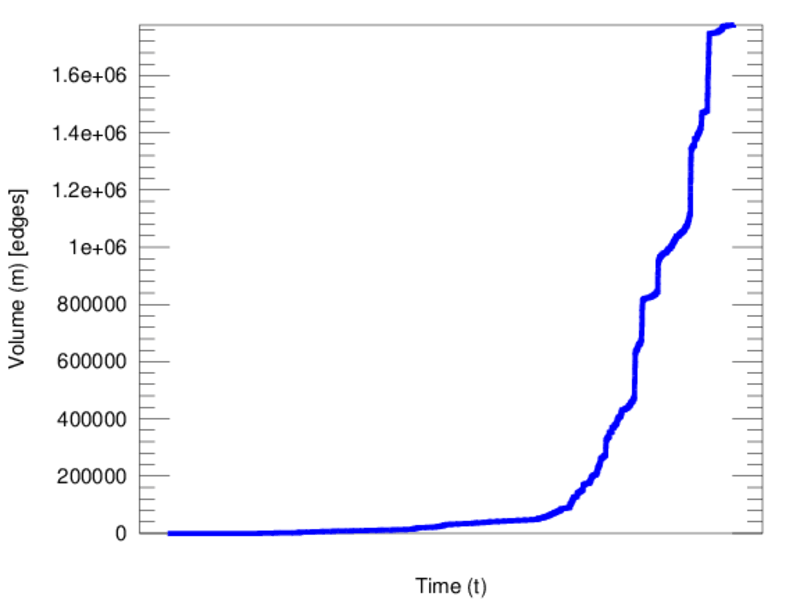
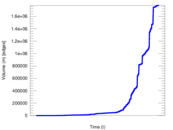
| Volume | m = | 1,776,311
|
| Unique edge count | m̿ = | 601,347
|
| Wedge count | s = | 35,361,004,668
|
| Cross count | x = | 6.594 × 10¹⁹
|
| Square count | q = | 29,210,491,286
|
| 4-Tour count | T4 = | 375,129,672,218
|
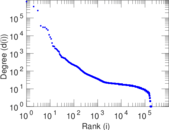
| Maximum degree | dmax = | 846,382
|
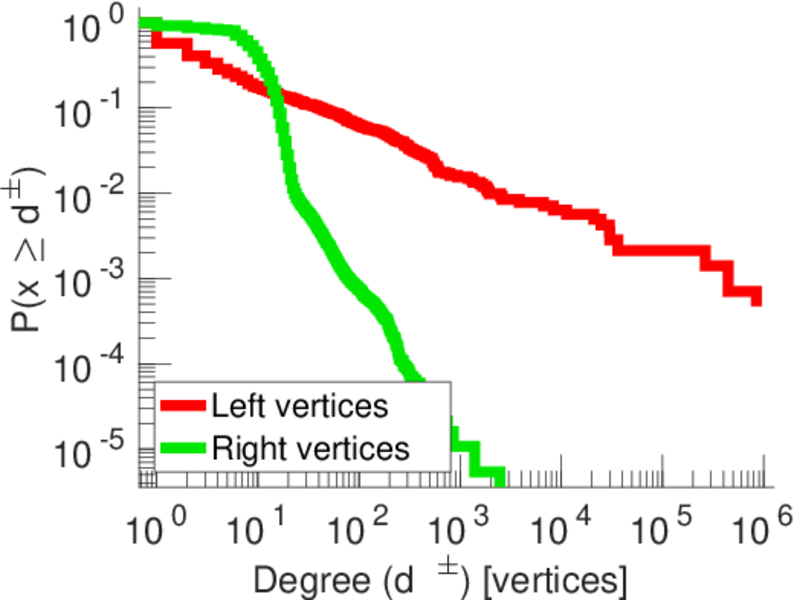
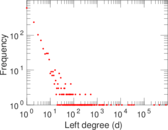
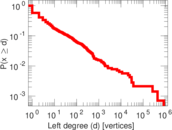
| Maximum left degree | d1max = | 846,382
|
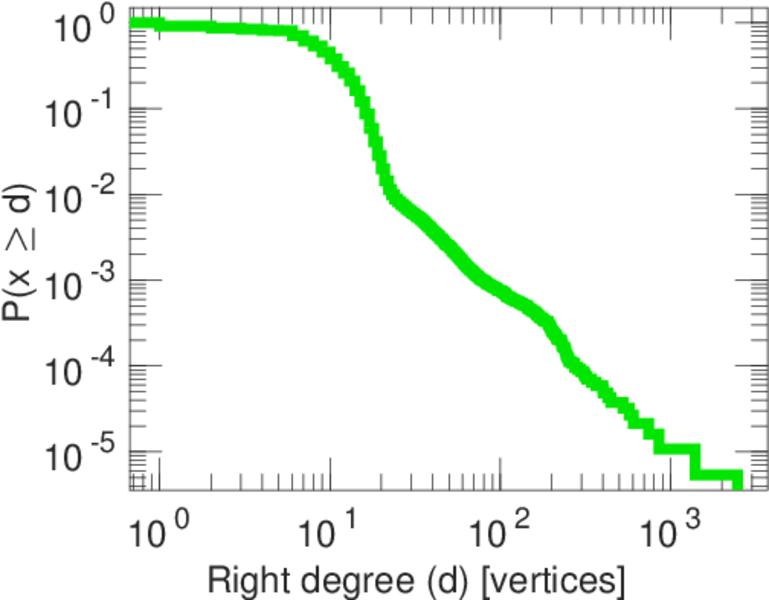
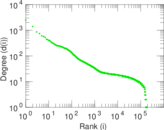
| Maximum right degree | d2max = | 2,469
|
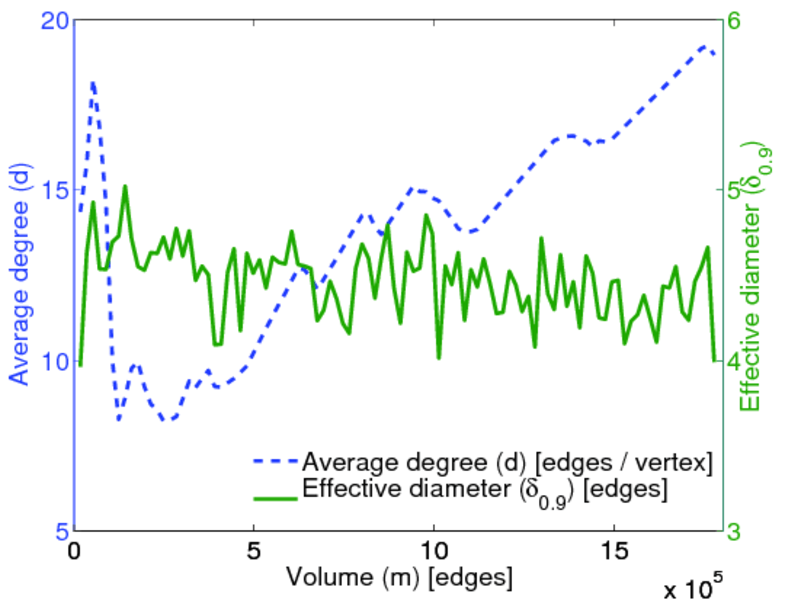
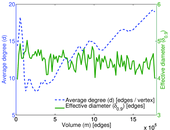
| Average degree | d = | 18.951 5
|
| Average left degree | d1 = | 1,254.46
|
| Average right degree | d2 = | 9.547 85
|
| Fill | p = | 0.002 282 70
|
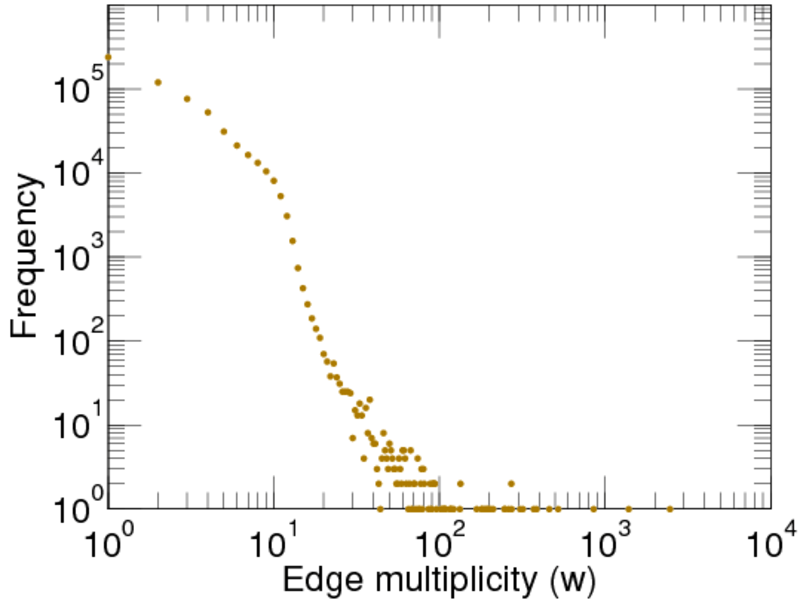
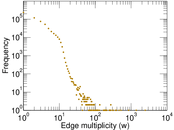
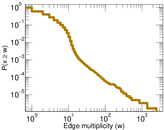
| Average edge multiplicity | m̃ = | 2.953 89
|
| Size of LCC | N = | 186,763
|
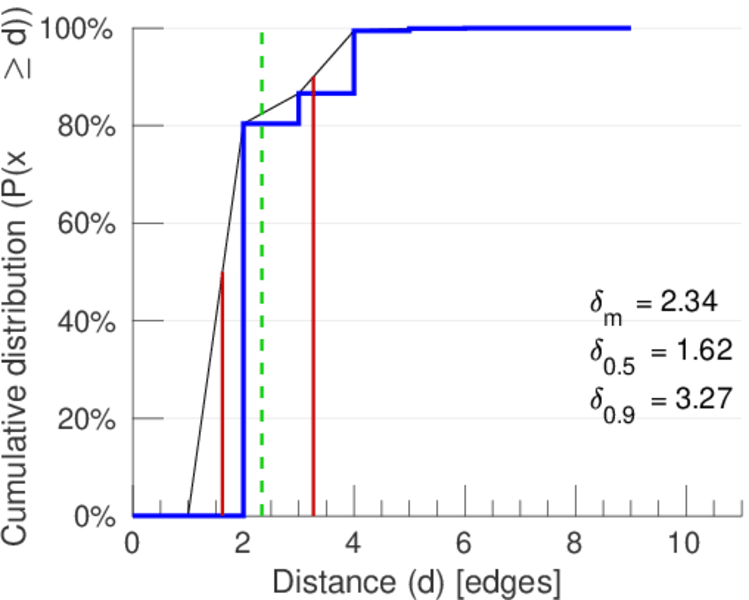
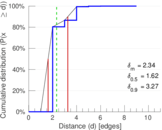
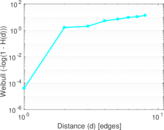
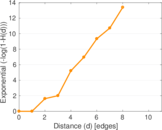
| Diameter | δ = | 12
|
| 50-Percentile effective diameter | δ0.5 = | 1.622 06
|
| 90-Percentile effective diameter | δ0.9 = | 3.265 44
|
| Median distance | δM = | 2
|
| Mean distance | δm = | 2.336 85
|
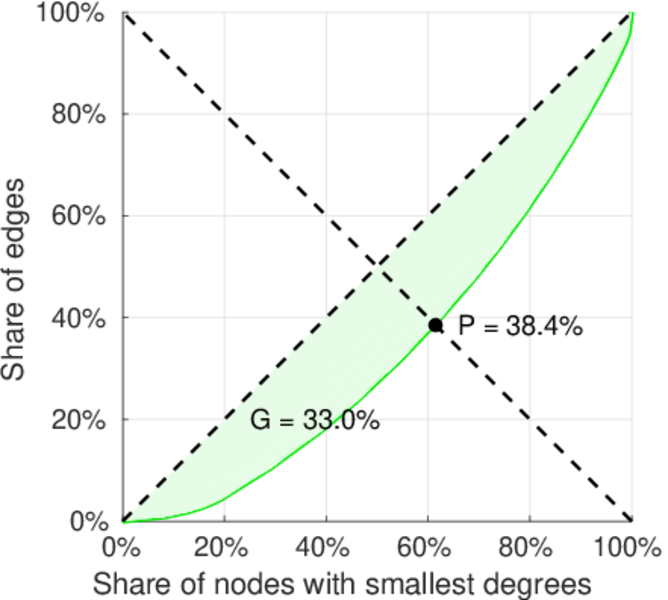
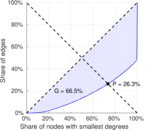
| Gini coefficient | G = | 0.663 637
|
| Balanced inequality ratio | P = | 0.263 162
|
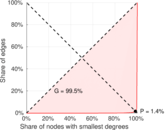
| Left balanced inequality ratio | P1 = | 0.014 040 3
|
| Right balanced inequality ratio | P2 = | 0.383 721
|
| Relative edge distribution entropy | Her = | 0.638 127
|
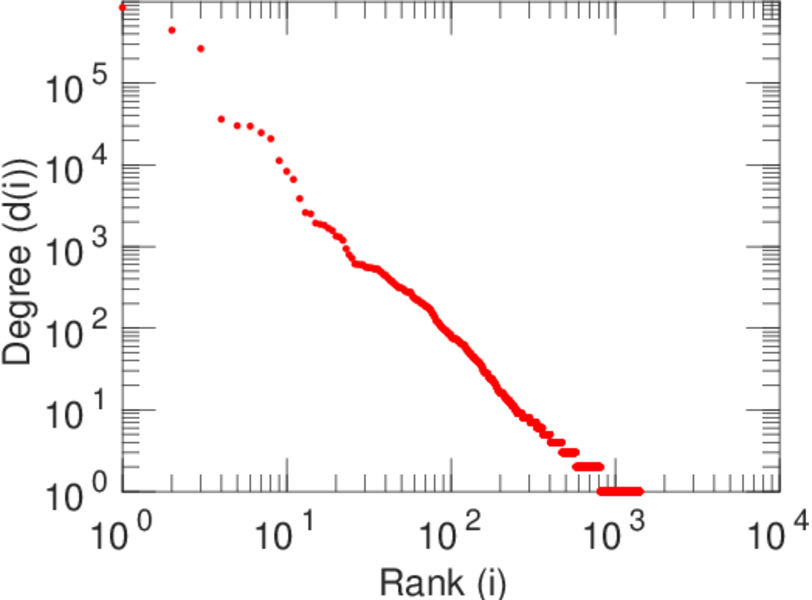
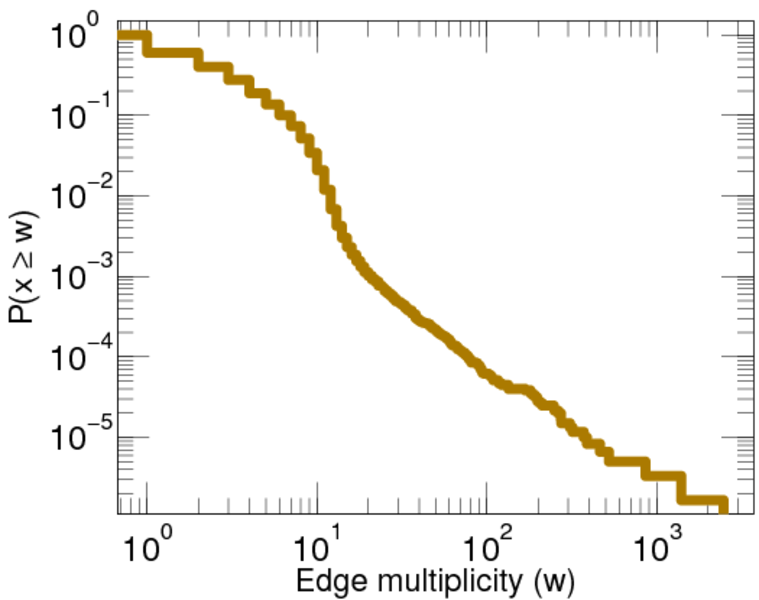
| Power law exponent | γ = | 1.937 03
|
| Tail power law exponent | γt = | 2.151 00
|
| Tail power law exponent with p | γ3 = | 2.151 00
|
| p-value | p = | 0.000 00
|
| Left tail power law exponent with p | γ3,1 = | 1.511 00
|
| Left p-value | p1 = | 0.013 000 0
|
| Right tail power law exponent with p | γ3,2 = | 6.191 00
|
| Right p-value | p2 = | 0.000 00
|
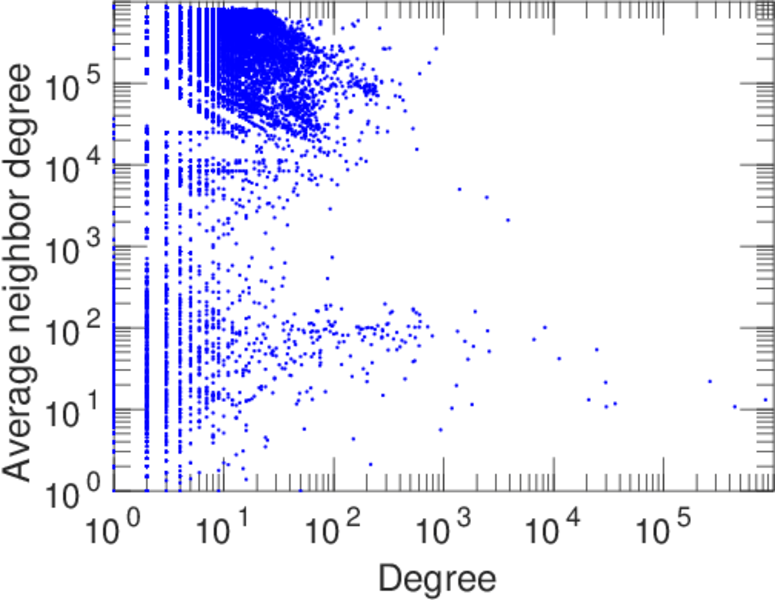
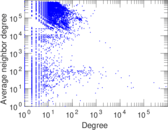
| Degree assortativity | ρ = | −0.307 204
|
| Degree assortativity p-value | pρ = | 0.000 00
|
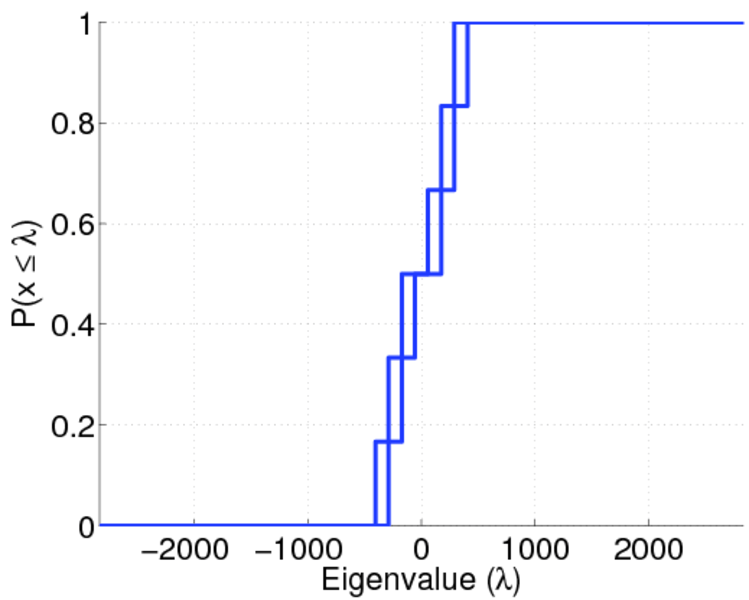
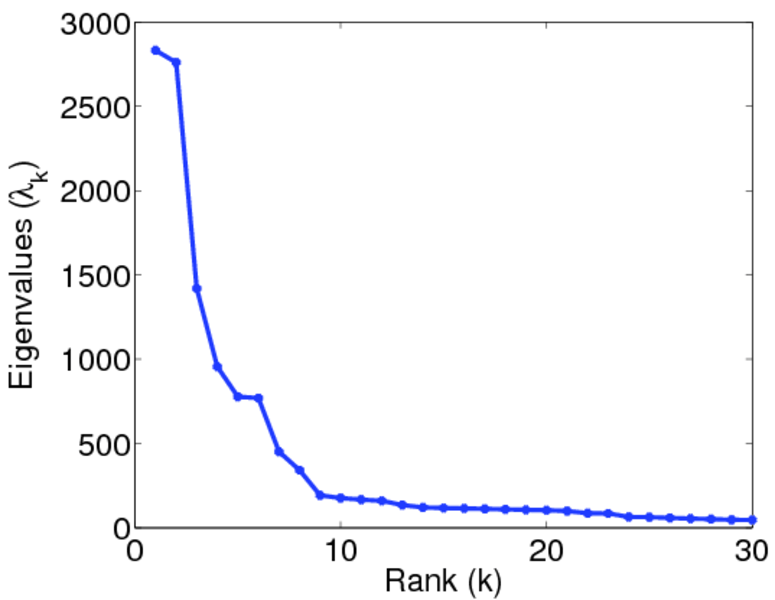
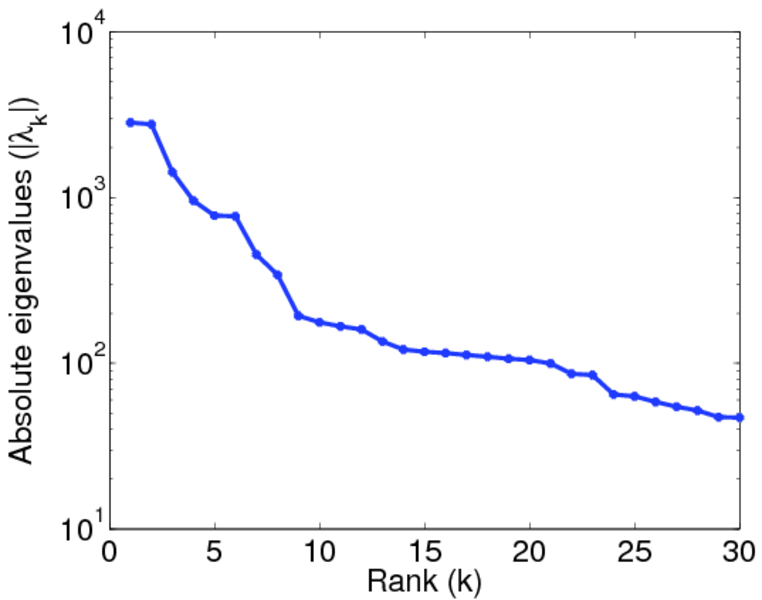
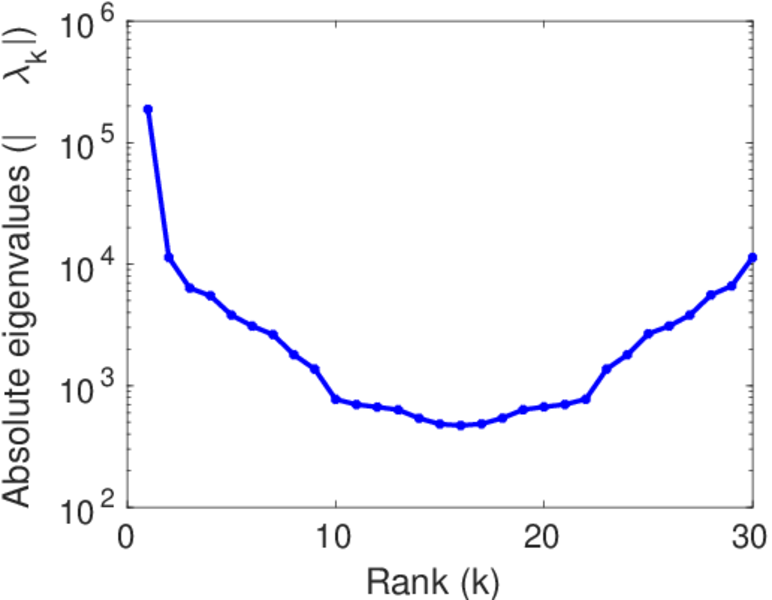
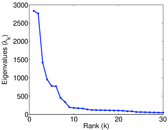
| Spectral norm | α = | 2,832.52
|
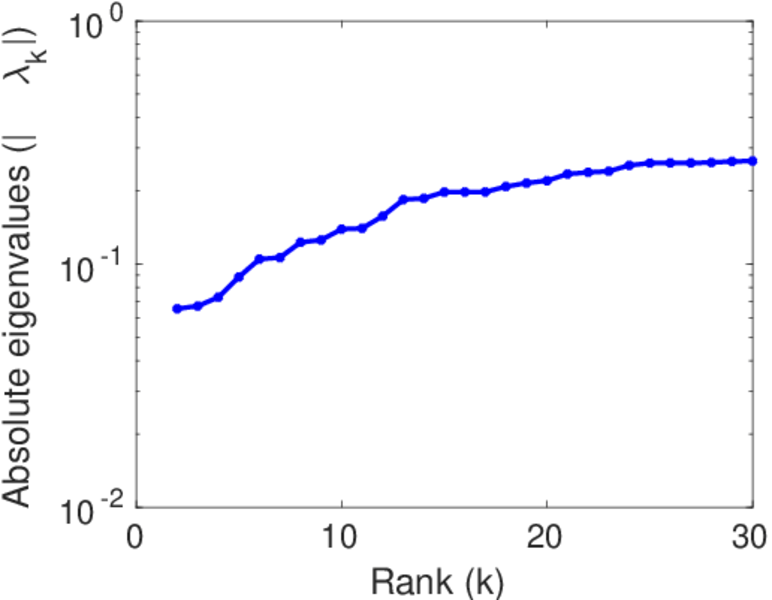
| Algebraic connectivity | a = | 0.065 521 7
|
| Spectral separation | |λ1[A] / λ2[A]| = | 1.025 94
|
| Controllability | C = | 184,780
|
| Relative controllability | Cr = | 0.986 151
|
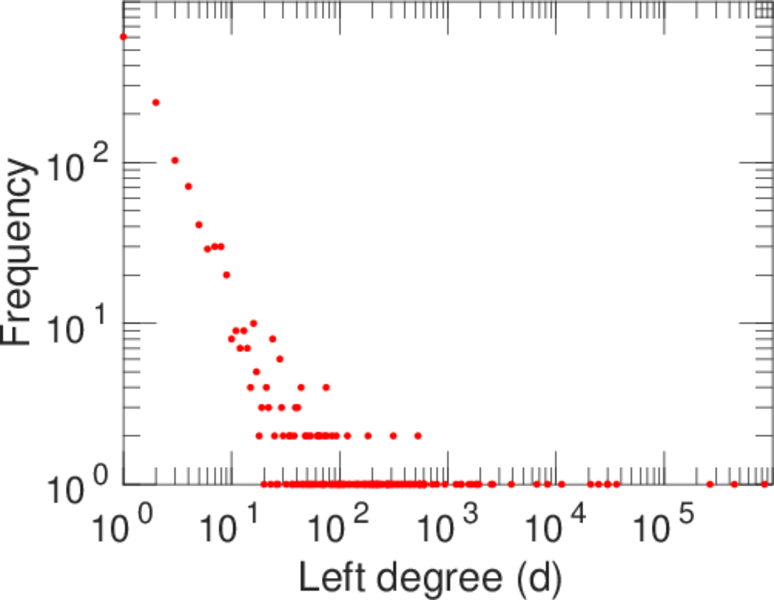
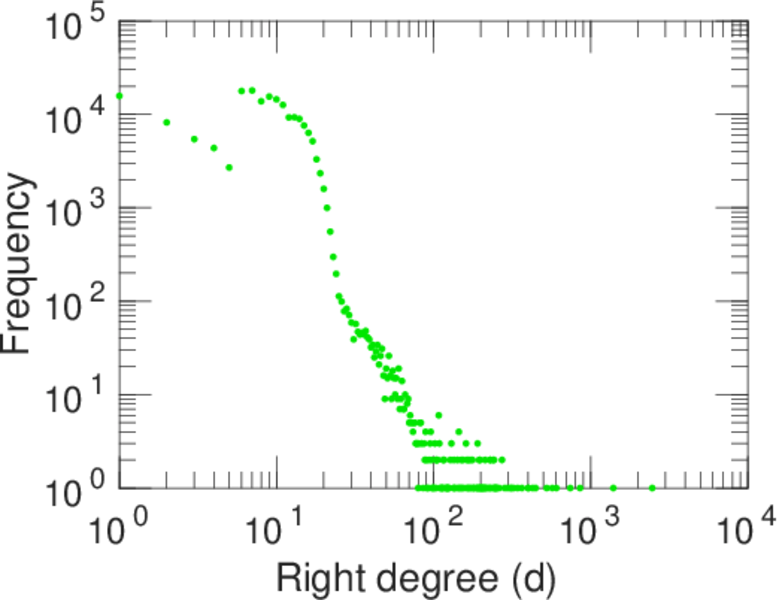
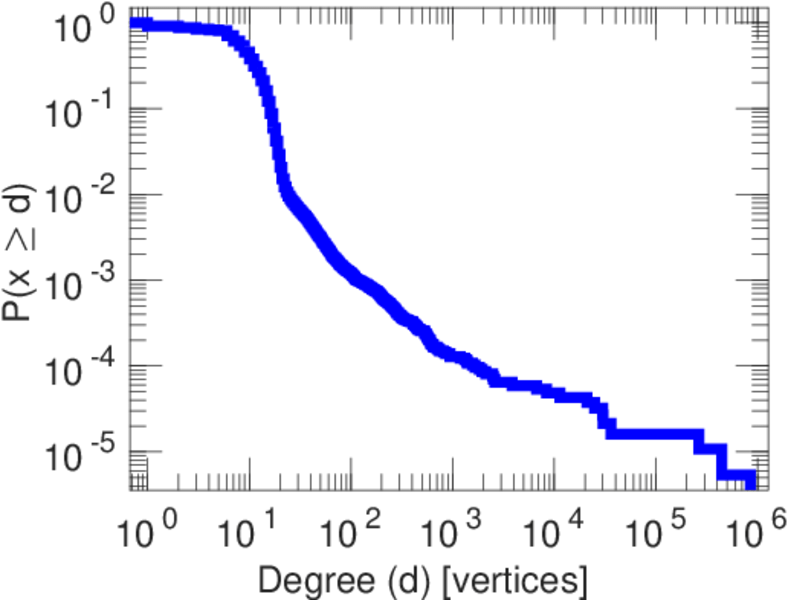
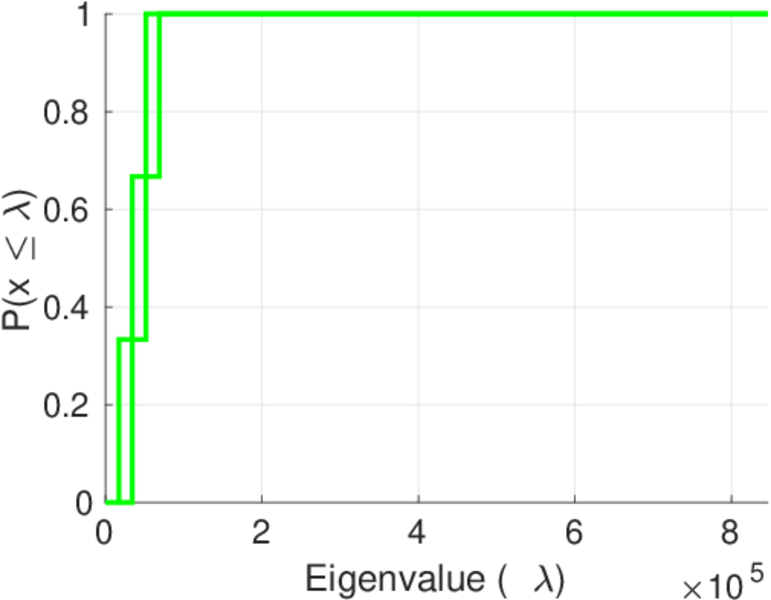
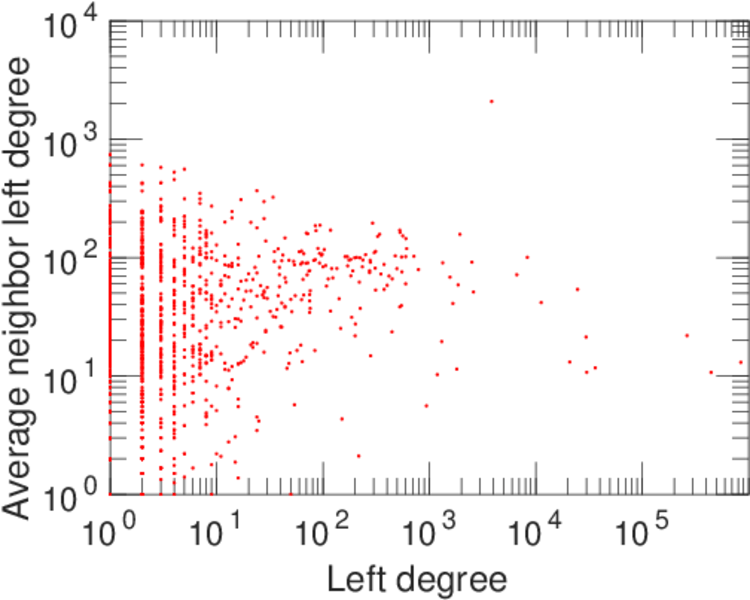
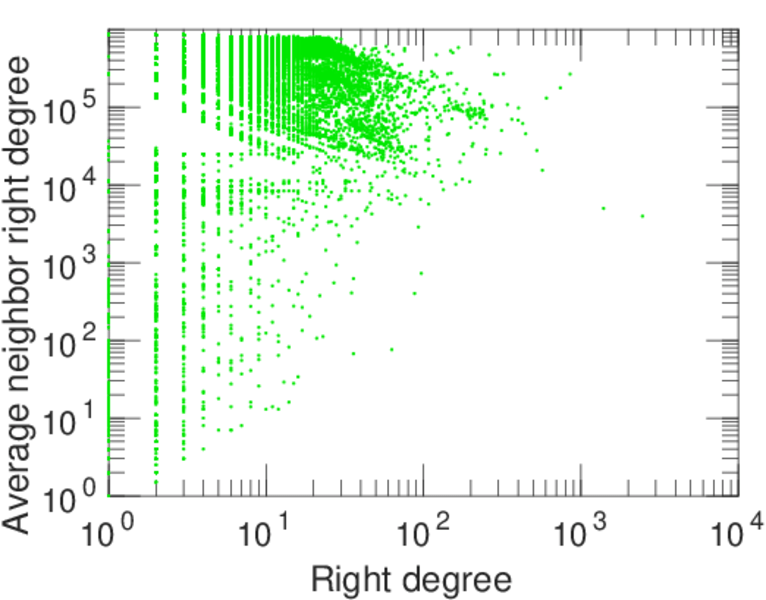
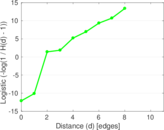
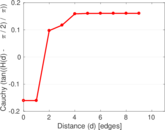
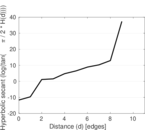
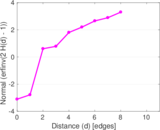
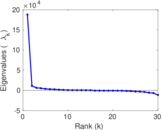
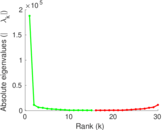
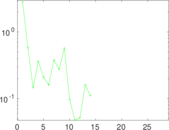
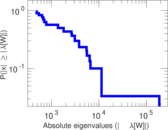
Plots


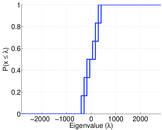


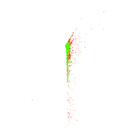


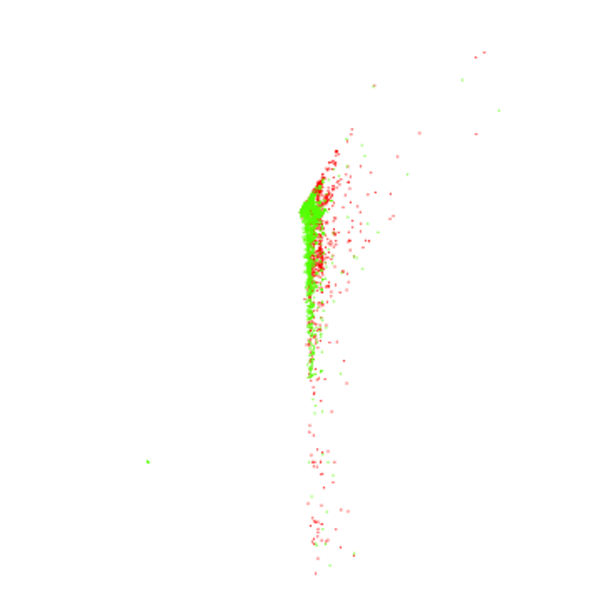
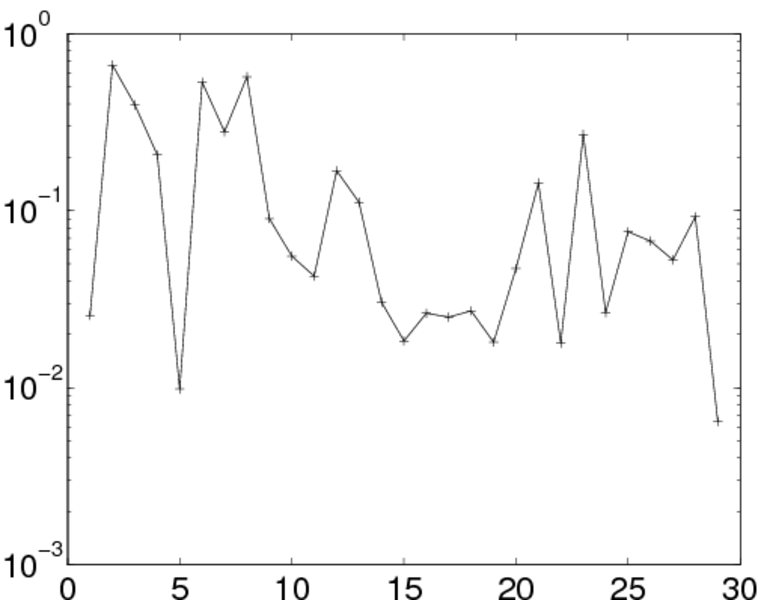
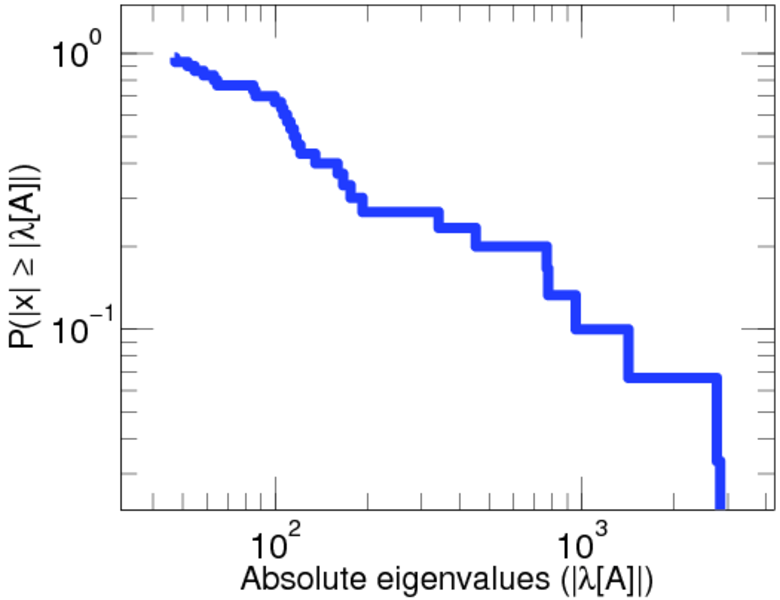
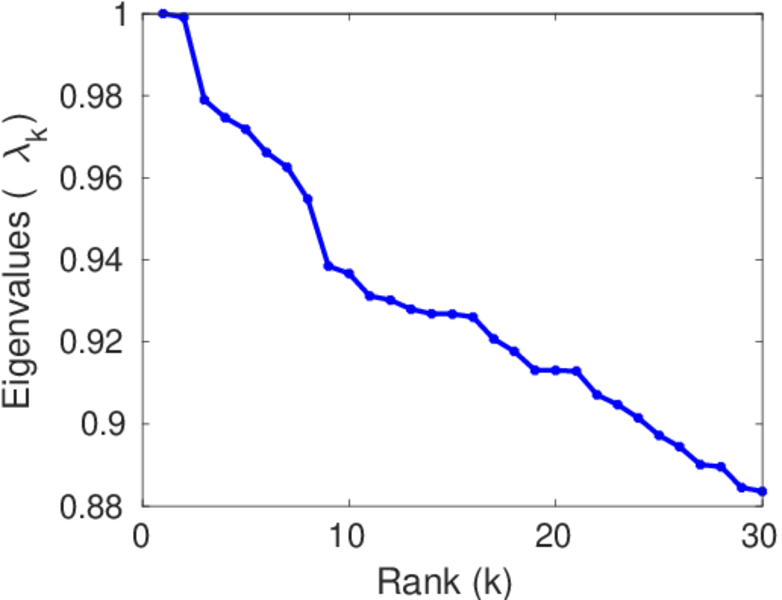
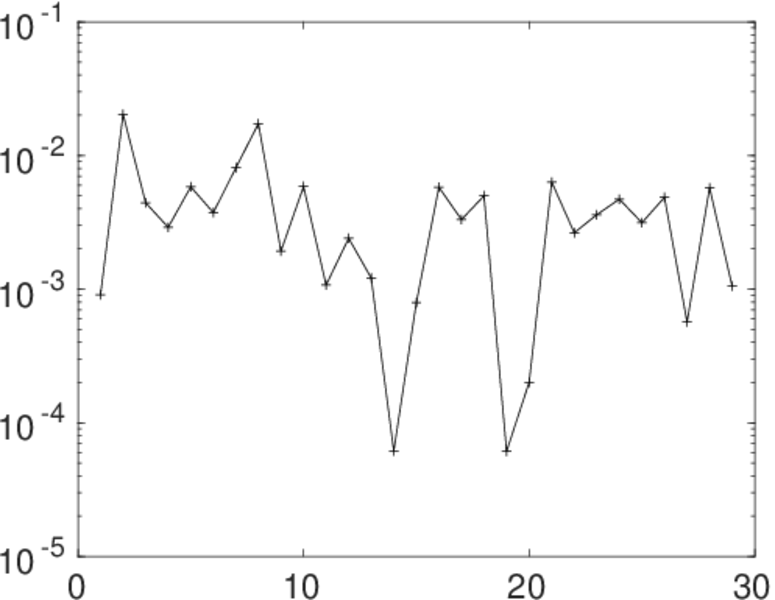
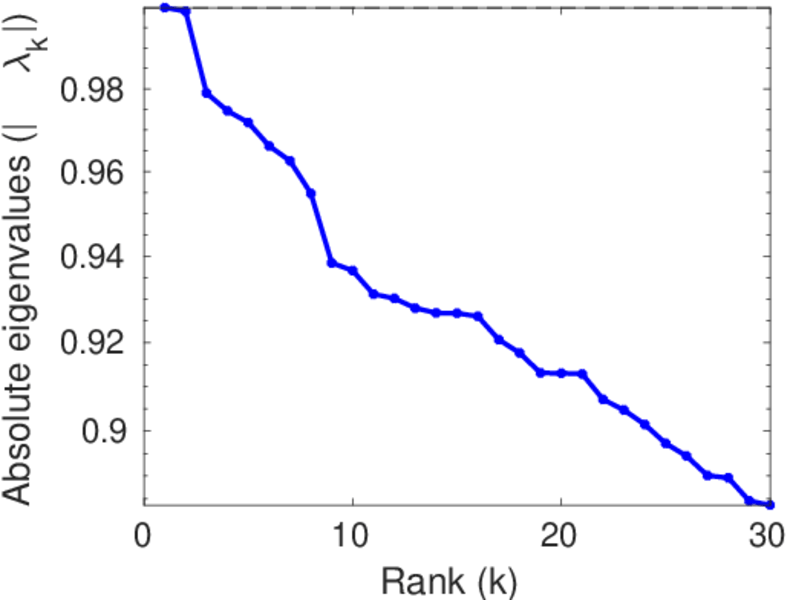
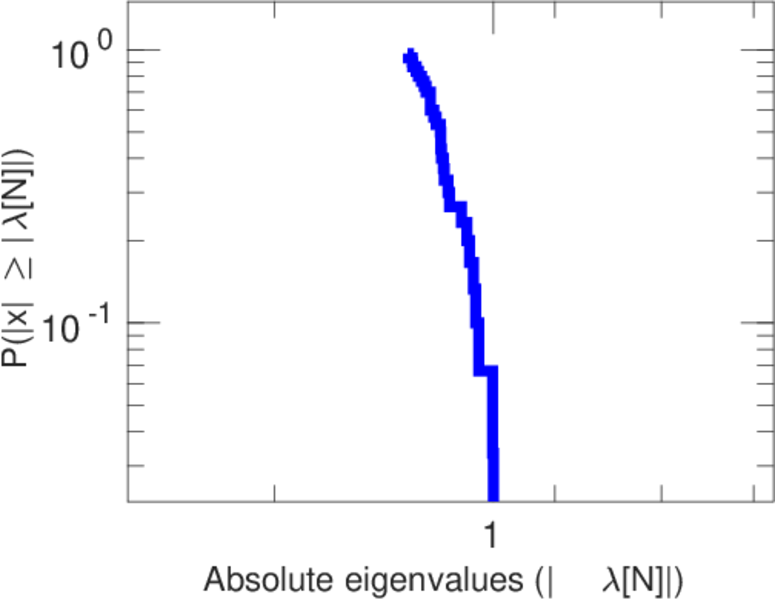
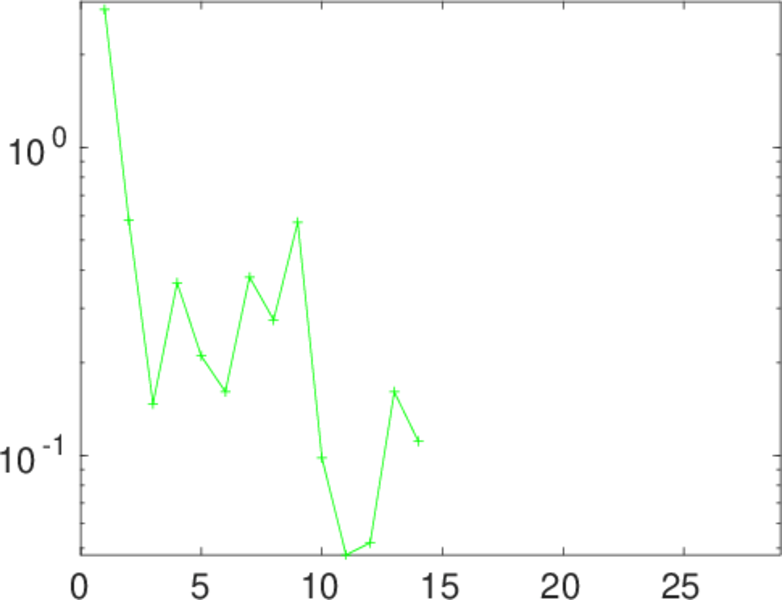
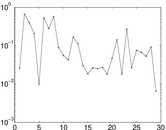
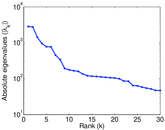
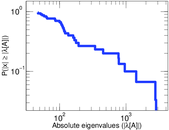
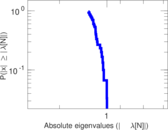
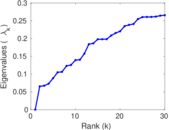
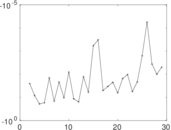
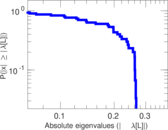
Matrix decompositions plots


Downloads
References
|
[1]
|
Jérôme Kunegis.
KONECT – The Koblenz Network Collection.
In Proc. Int. Conf. on World Wide Web Companion, pages
1343–1350, 2013.
[ http ]
|
|
[2]
|
Wikimedia Foundation.
Wikimedia downloads.
http://dumps.wikimedia.org/, January 2010.
|
 KONECT ‣ Networks ‣
Buy Me a Coffee
KONECT ‣ Networks ‣
Buy Me a Coffee