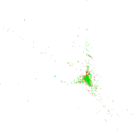
Wikipedia edits (chr)
This is the bipartite edit network of the Cherokee Wikipedia. It contains users
and pages from the Cherokee Wikipedia, connected by edit events. Each edge
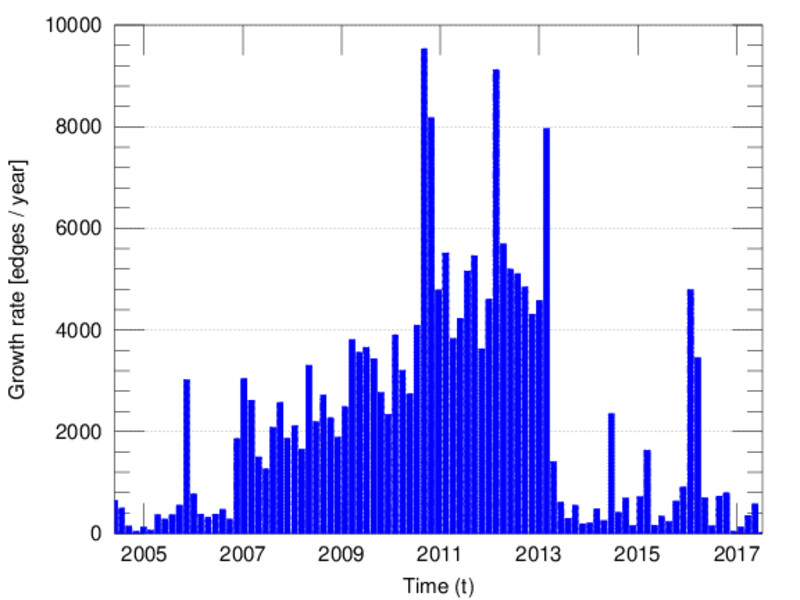
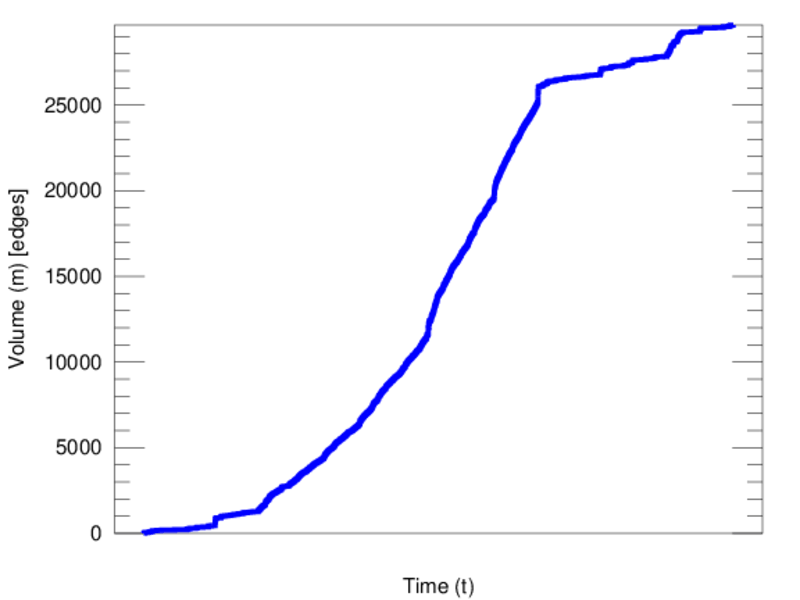
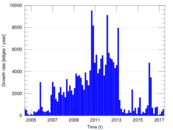
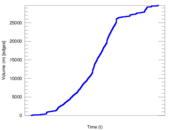
represents an edit. The dataset includes the timestamp of each edit.
Metadata
Statistics
| Size | n = | 4,273
|
| Left size | n1 = | 864
|
| Right size | n2 = | 3,409
|
| Volume | m = | 29,664
|
| Unique edge count | m̿ = | 13,542
|
| Wedge count | s = | 1,863,783
|
| Claw count | z = | 299,584,922
|
| Cross count | x = | 48,470,243,197
|
| Square count | q = | 3,991,489
|
| 4-Tour count | T4 = | 39,419,008
|
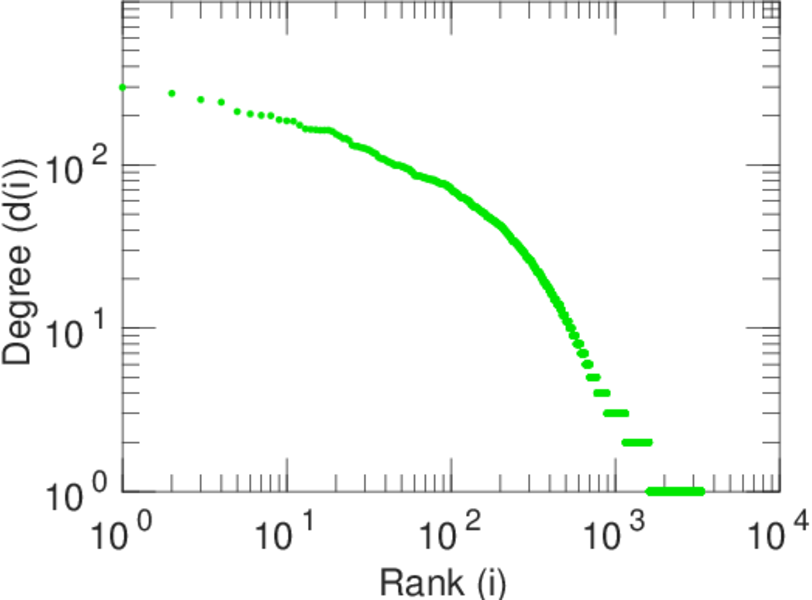
| Maximum degree | dmax = | 1,799
|
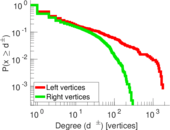
| Maximum left degree | d1max = | 1,799
|
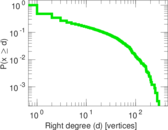
| Maximum right degree | d2max = | 298
|
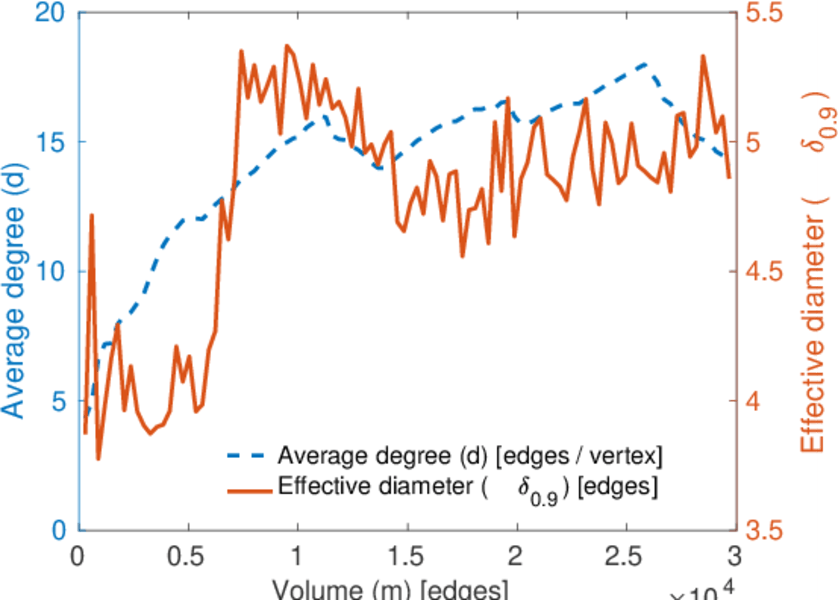
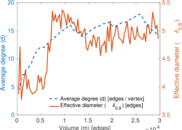
| Average degree | d = | 13.884 4
|
| Average left degree | d1 = | 34.333 3
|
| Average right degree | d2 = | 8.701 67
|
| Fill | p = | 0.004 597 72
|
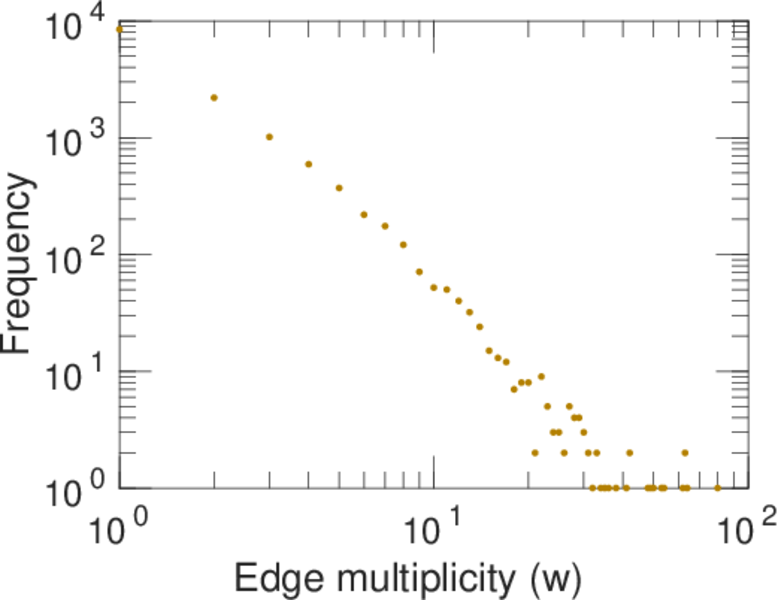
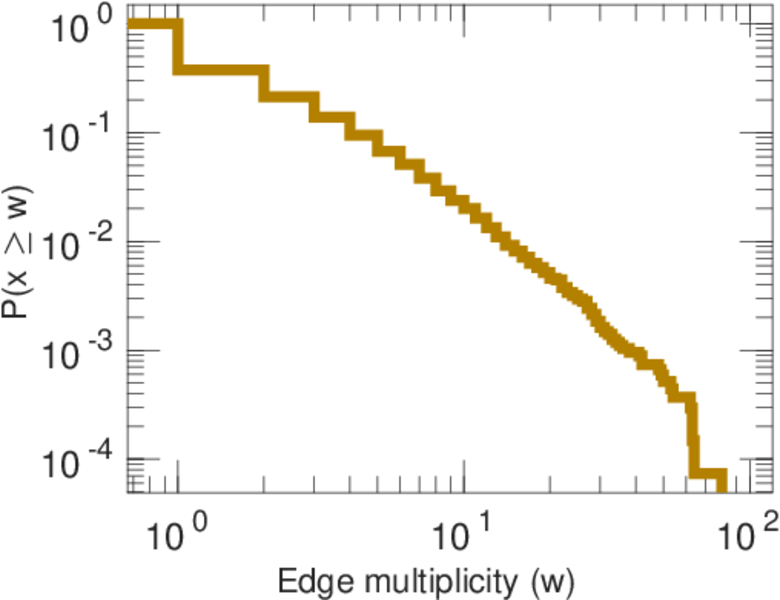
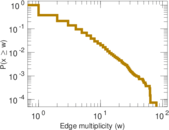
| Average edge multiplicity | m̃ = | 2.190 52
|
| Size of LCC | N = | 3,615
|
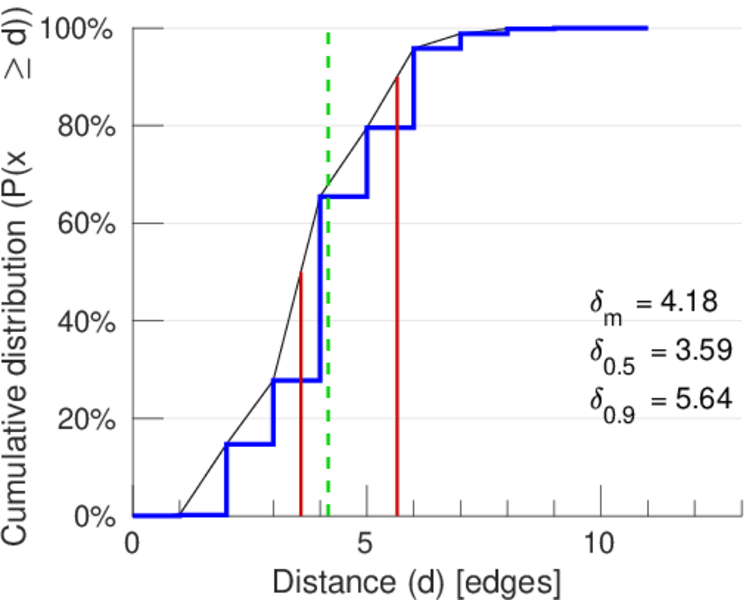
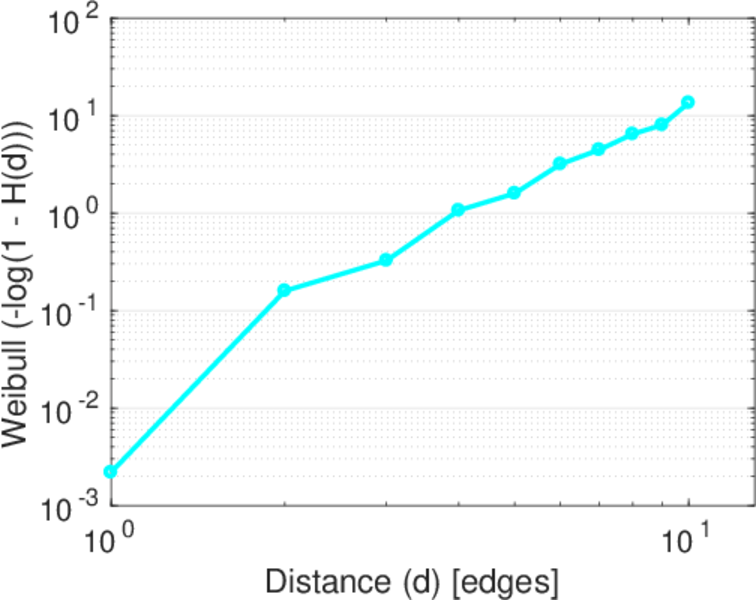
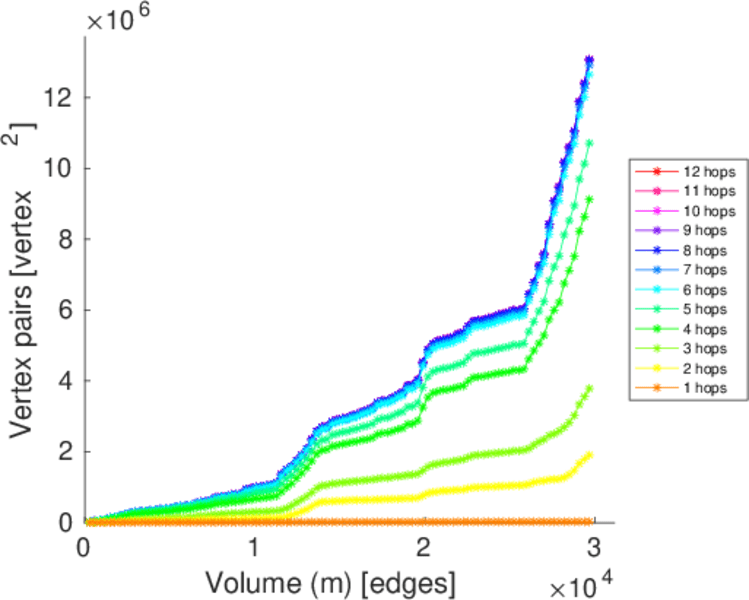
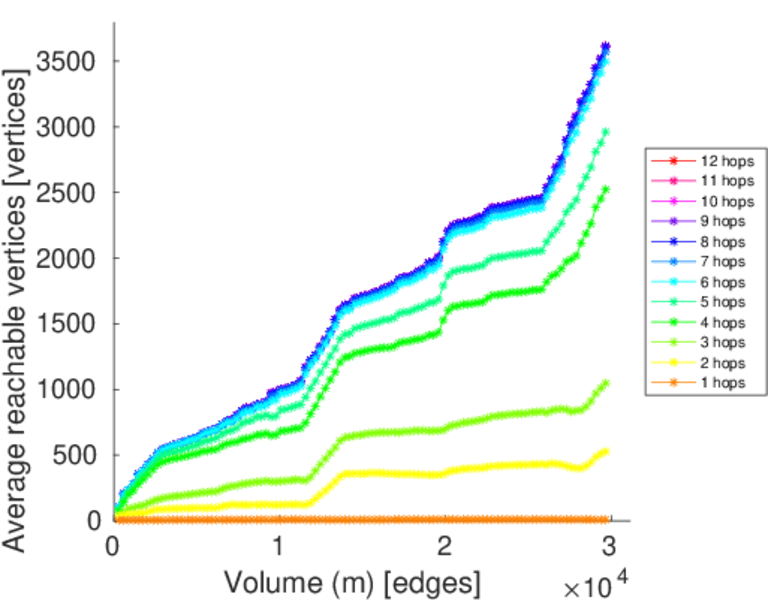
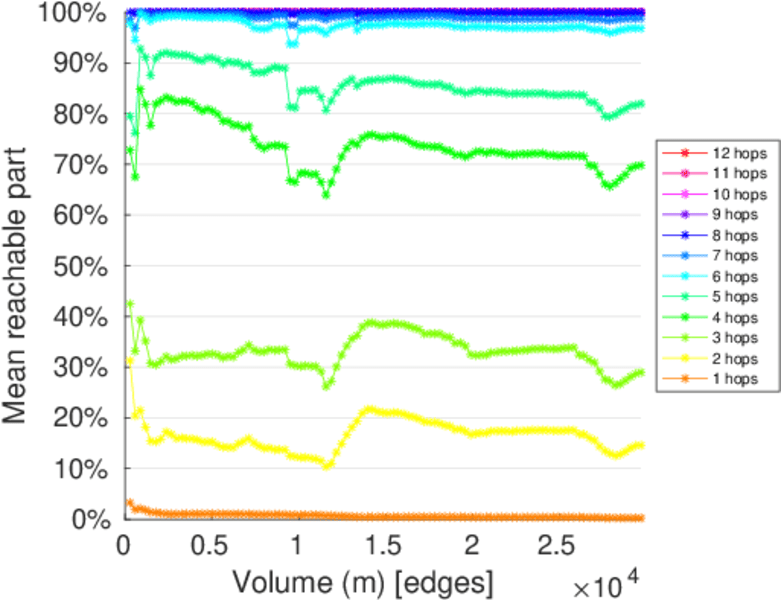
| Diameter | δ = | 12
|
| 50-Percentile effective diameter | δ0.5 = | 3.589 69
|
| 90-Percentile effective diameter | δ0.9 = | 5.643 18
|
| Median distance | δM = | 4
|
| Mean distance | δm = | 4.178 47
|
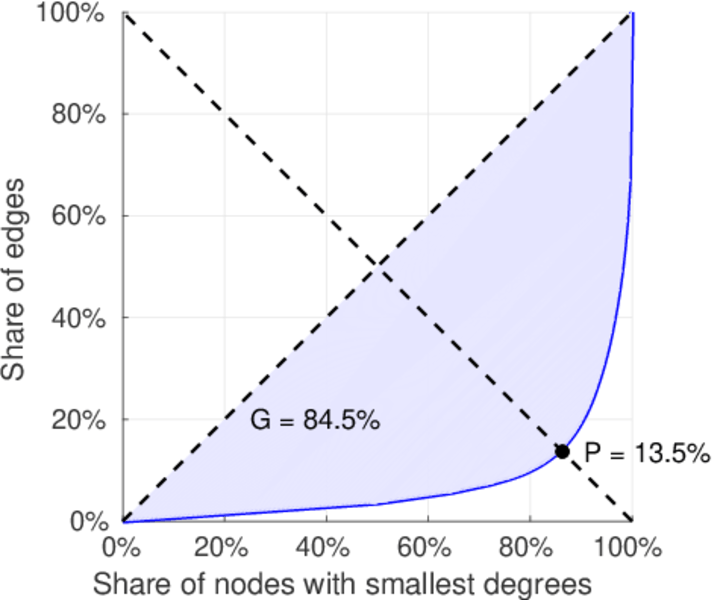
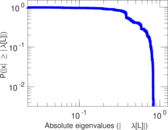
| Gini coefficient | G = | 0.847 539
|
| Balanced inequality ratio | P = | 0.138 484
|
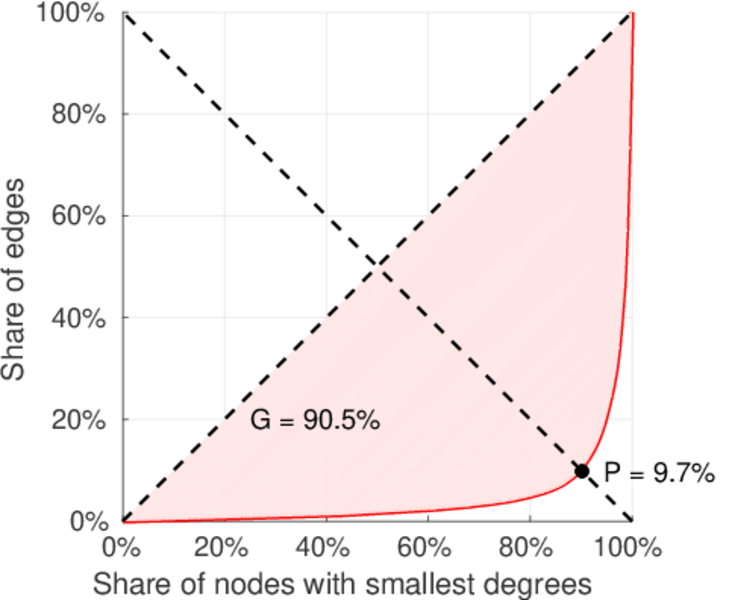
| Left balanced inequality ratio | P1 = | 0.096 615 4
|
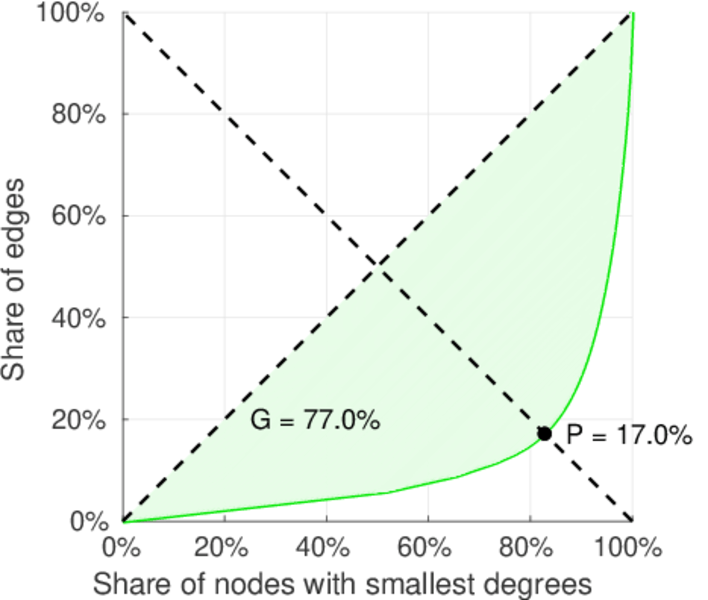
| Right balanced inequality ratio | P2 = | 0.170 341
|
| Relative edge distribution entropy | Her = | 0.801 019
|
| Power law exponent | γ = | 2.442 71
|
| Tail power law exponent | γt = | 1.881 00
|
| Tail power law exponent with p | γ3 = | 1.881 00
|
| p-value | p = | 0.000 00
|
| Left tail power law exponent with p | γ3,1 = | 1.701 00
|
| Left p-value | p1 = | 0.000 00
|
| Right tail power law exponent with p | γ3,2 = | 5.051 00
|
| Right p-value | p2 = | 0.609 000
|
| Degree assortativity | ρ = | −0.212 577
|
| Degree assortativity p-value | pρ = | 3.543 62 × 10−138
|
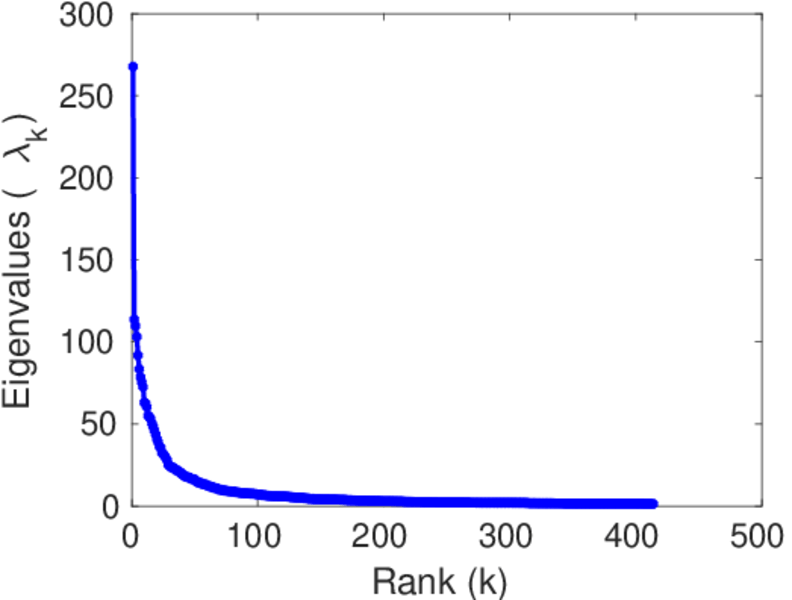
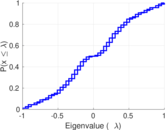
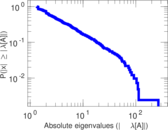
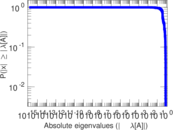
| Spectral norm | α = | 267.741
|
| Algebraic connectivity | a = | 0.022 745 4
|
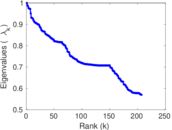
| Spectral separation | |λ1[A] / λ2[A]| = | 2.356 17
|
| Controllability | C = | 2,642
|
| Relative controllability | Cr = | 0.626 958
|
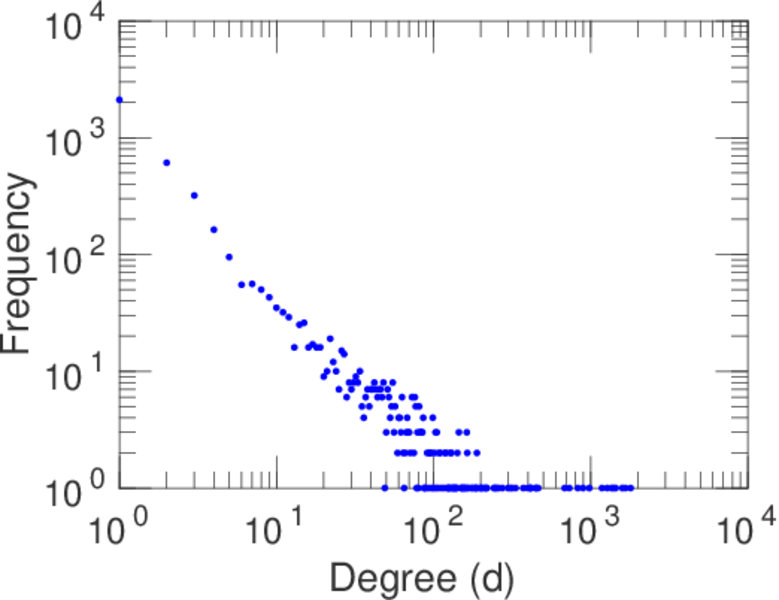
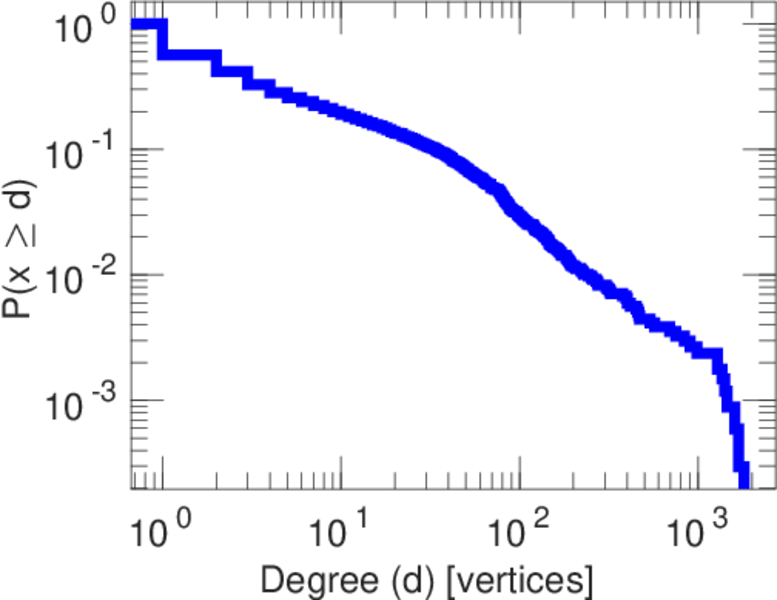
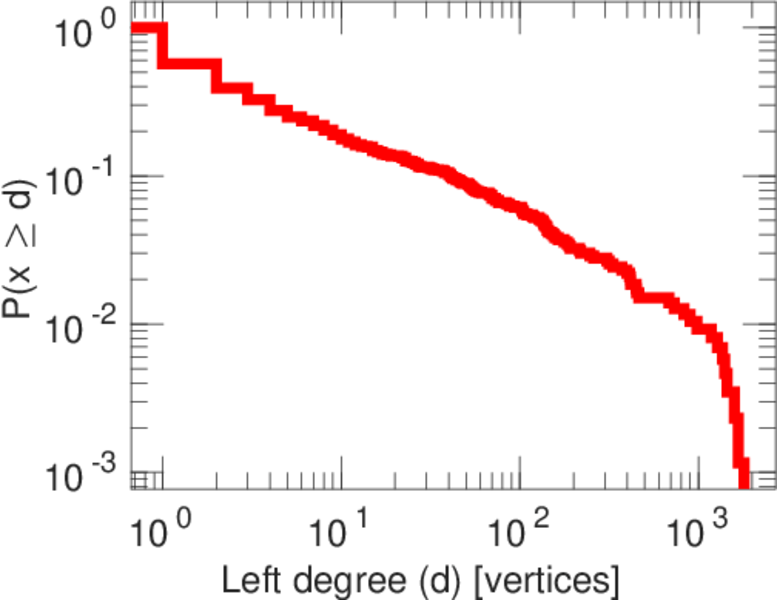
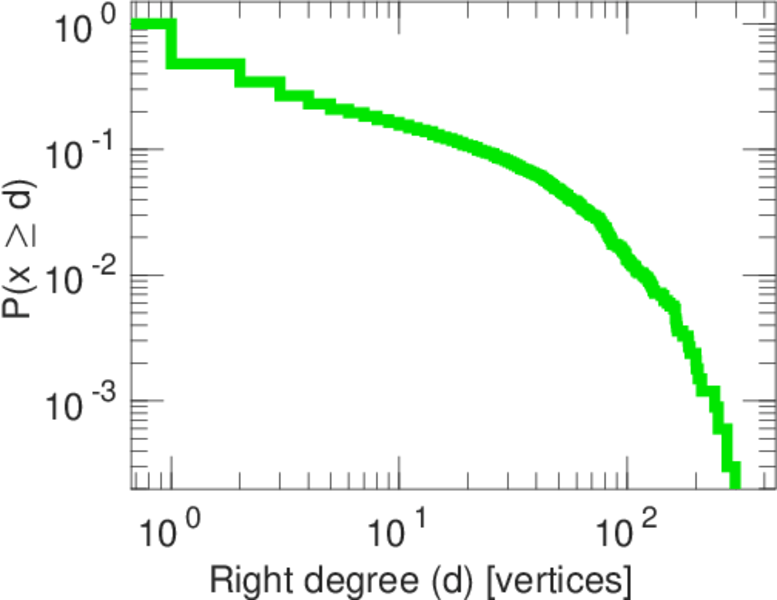
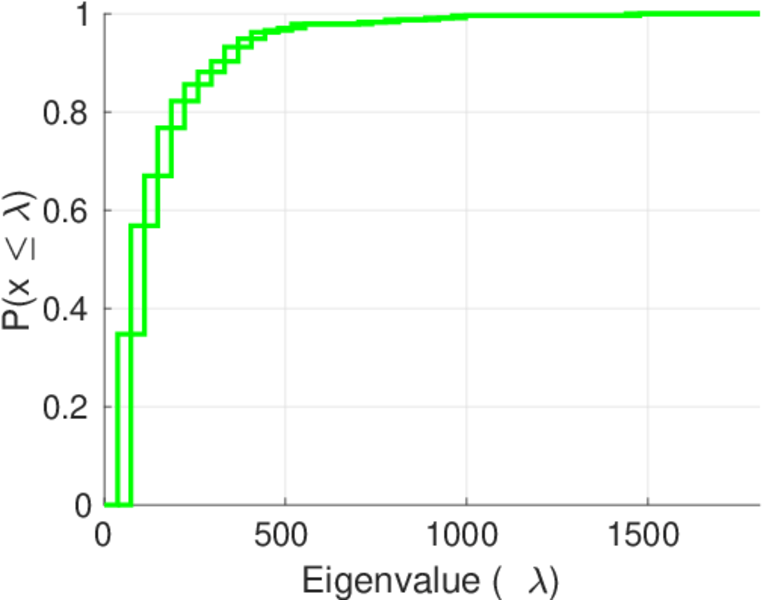
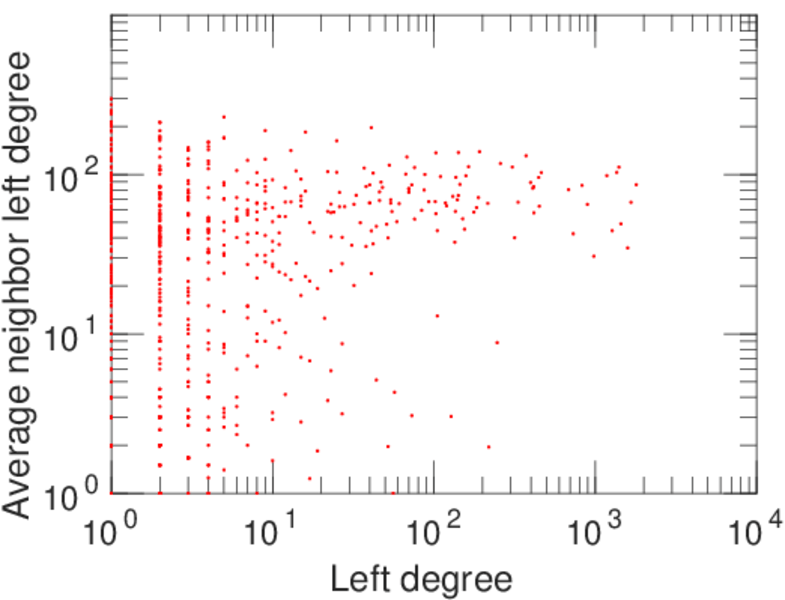
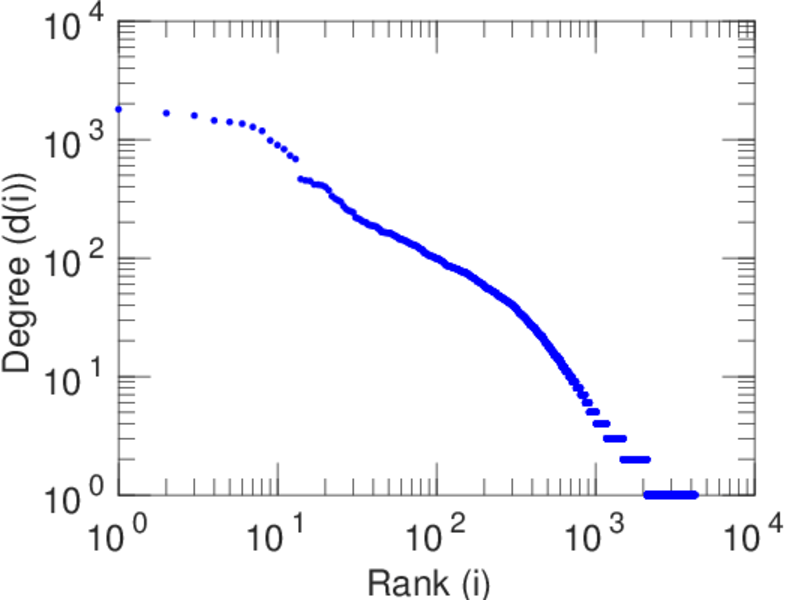
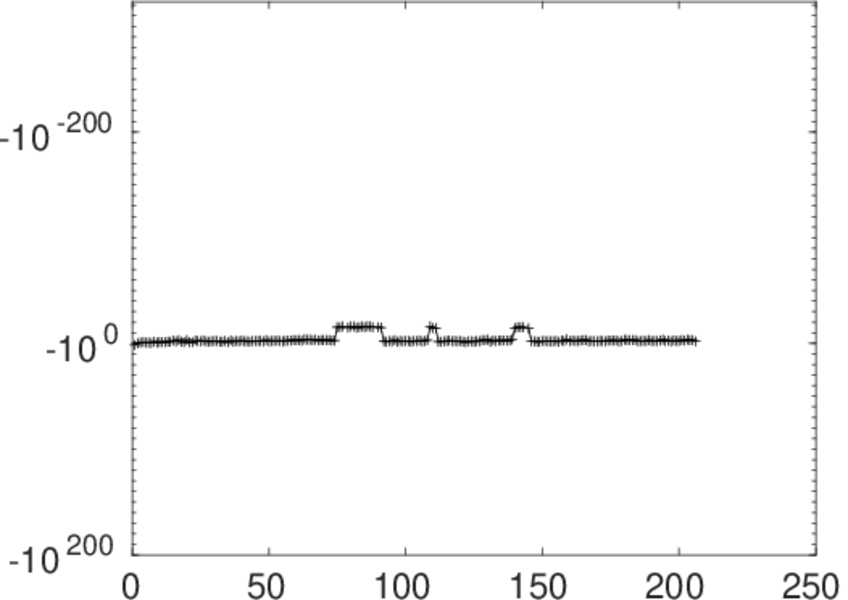
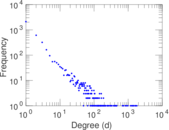
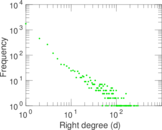
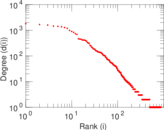
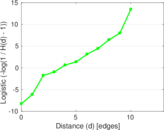
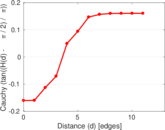
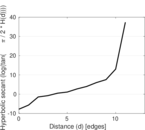
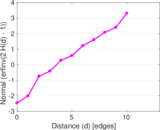
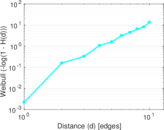
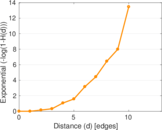
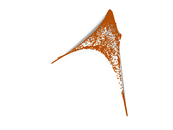
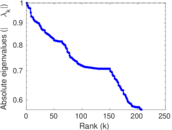
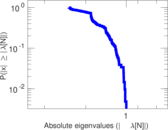
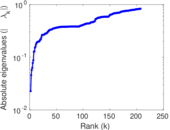
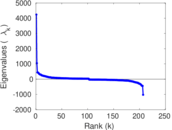
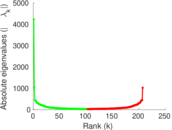
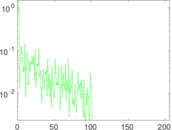
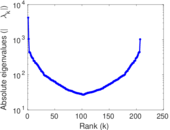
Plots


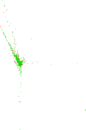


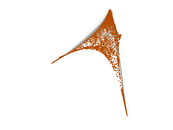


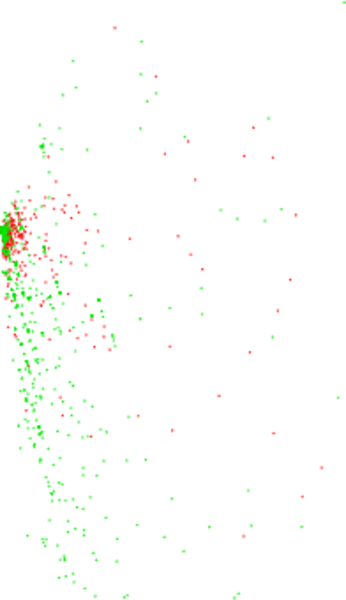
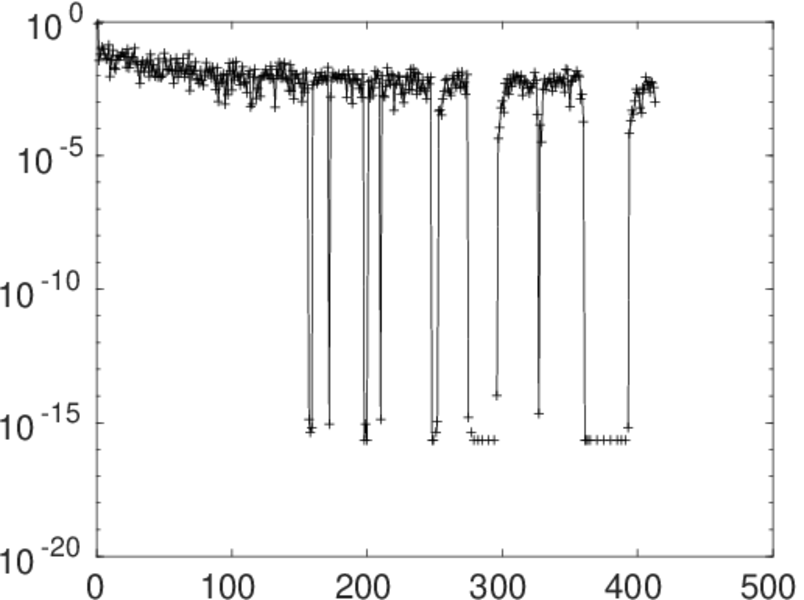
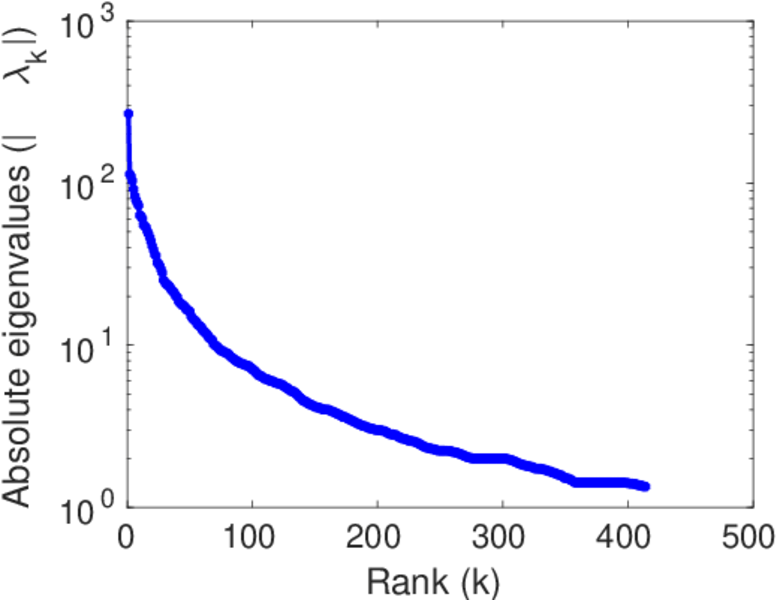
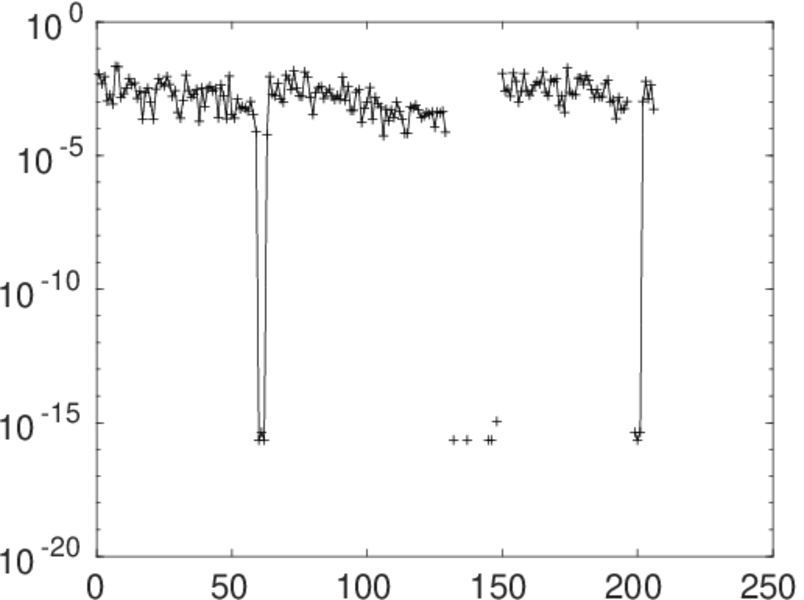
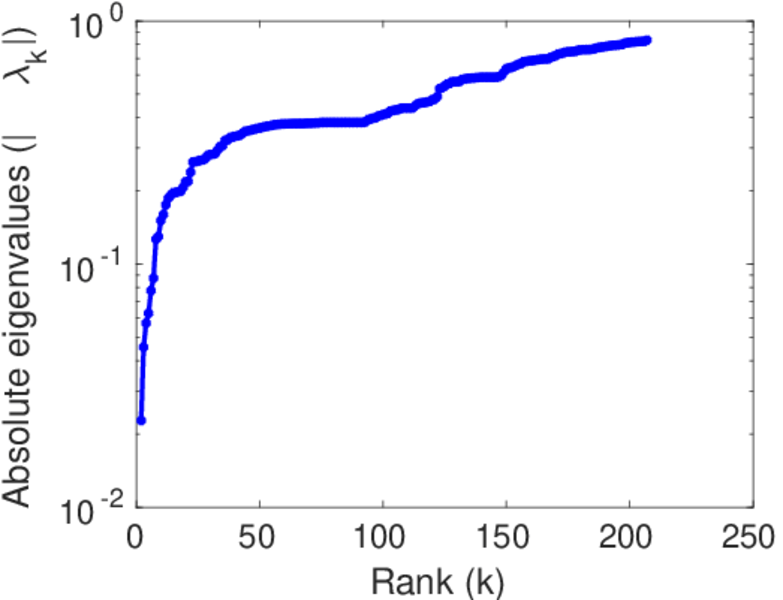
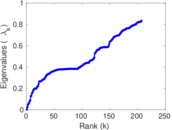
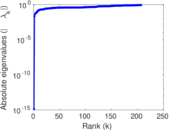
Matrix decompositions plots


Downloads
References
|
[1]
|
Jérôme Kunegis.
KONECT – The Koblenz Network Collection.
In Proc. Int. Conf. on World Wide Web Companion, pages
1343–1350, 2013.
[ http ]
|
|
[2]
|
Wikimedia Foundation.
Wikimedia downloads.
http://dumps.wikimedia.org/, January 2010.
|
 KONECT ‣ Networks ‣
Buy Me a Coffee
KONECT ‣ Networks ‣
Buy Me a Coffee