Wiktionary edits (chr)
This is the bipartite edit network of the Cherokee Wiktionary. It contains
users and pages from the Cherokee Wiktionary, connected by edit events. Each
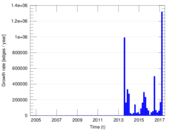
edge represents an edit. The dataset includes the timestamp of each edit.
Metadata
Statistics
| Size | n = | 195,678
|
| Left size | n1 = | 292
|
| Right size | n2 = | 195,386
|
| Volume | m = | 772,131
|
| Unique edge count | m̿ = | 596,665
|
| Wedge count | s = | 44,160,546,583
|
| Square count | q = | 33,493,483,798
|
| 4-Tour count | T4 = | 444,591,250,046
|
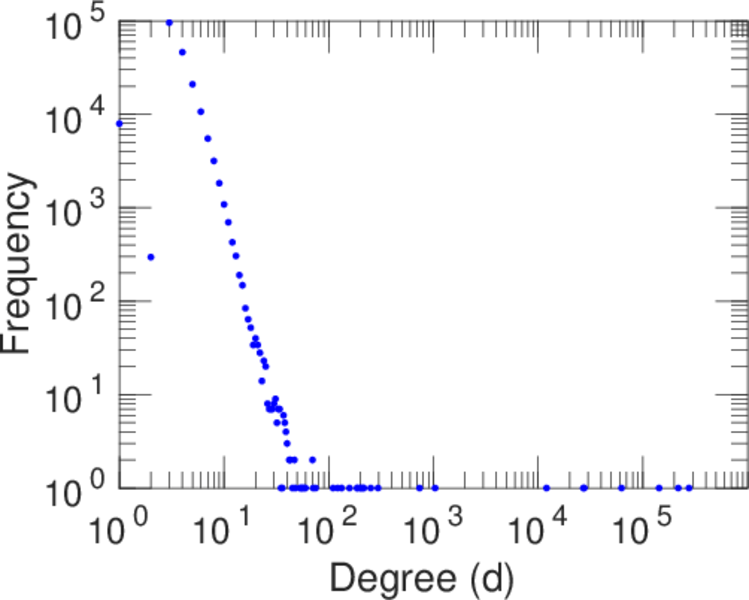
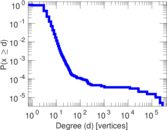
| Maximum degree | dmax = | 276,242
|
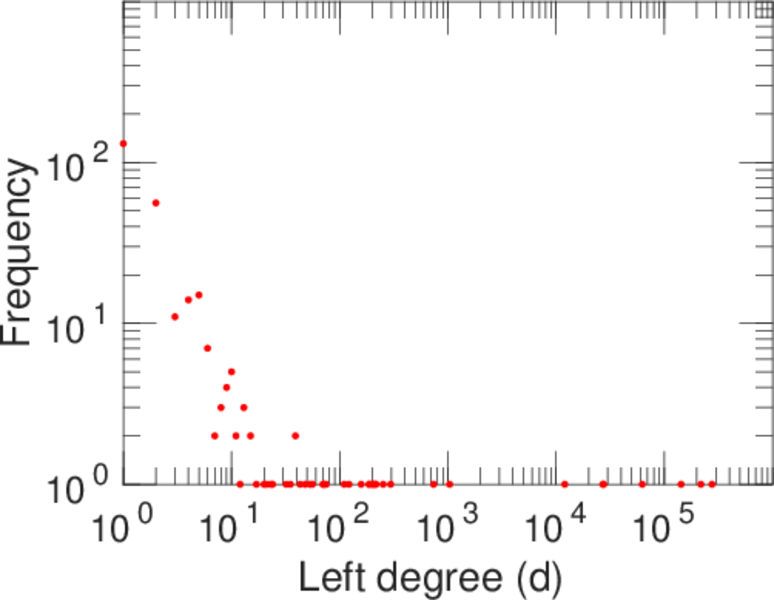
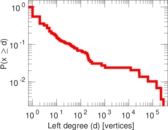
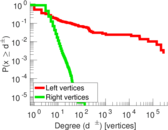
| Maximum left degree | d1max = | 276,242
|
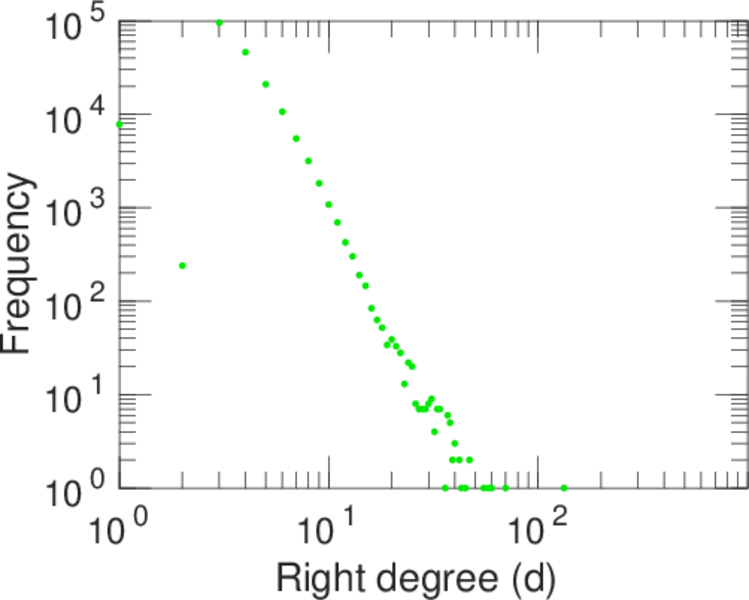
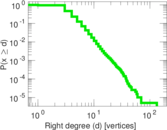
| Maximum right degree | d2max = | 133
|
| Average degree | d = | 7.891 85
|
| Average left degree | d1 = | 2,644.28
|
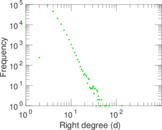
| Average right degree | d2 = | 3.951 82
|
| Fill | p = | 0.010 458 1
|
| Average edge multiplicity | m̃ = | 1.294 08
|
| Size of LCC | N = | 195,361
|
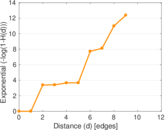
| Diameter | δ = | 13
|
| 50-Percentile effective diameter | δ0.5 = | 1.517 48
|
| 90-Percentile effective diameter | δ0.9 = | 1.931 49
|
| Median distance | δM = | 2
|
| Mean distance | δm = | 2.119 06
|
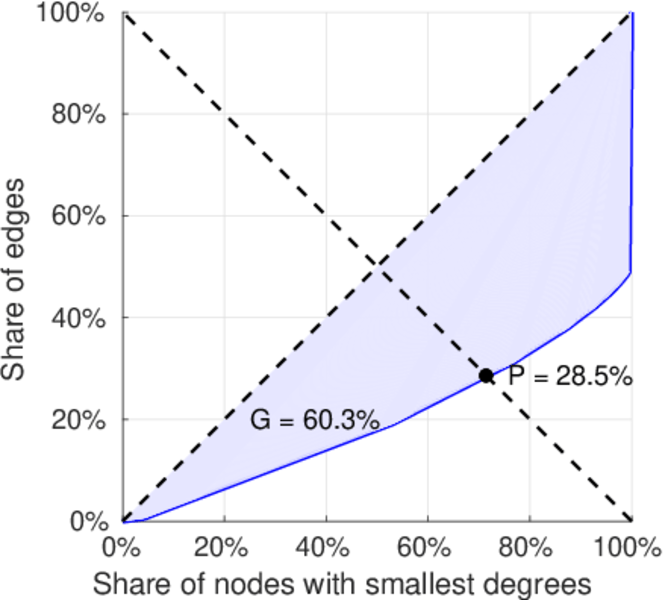
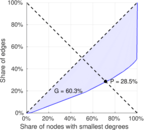
| Gini coefficient | G = | 0.602 546
|
| Balanced inequality ratio | P = | 0.284 575
|
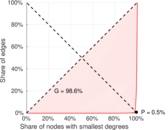
| Left balanced inequality ratio | P1 = | 0.005 469 28
|
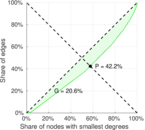
| Right balanced inequality ratio | P2 = | 0.421 993
|
| Relative edge distribution entropy | Her = | 0.620 774
|
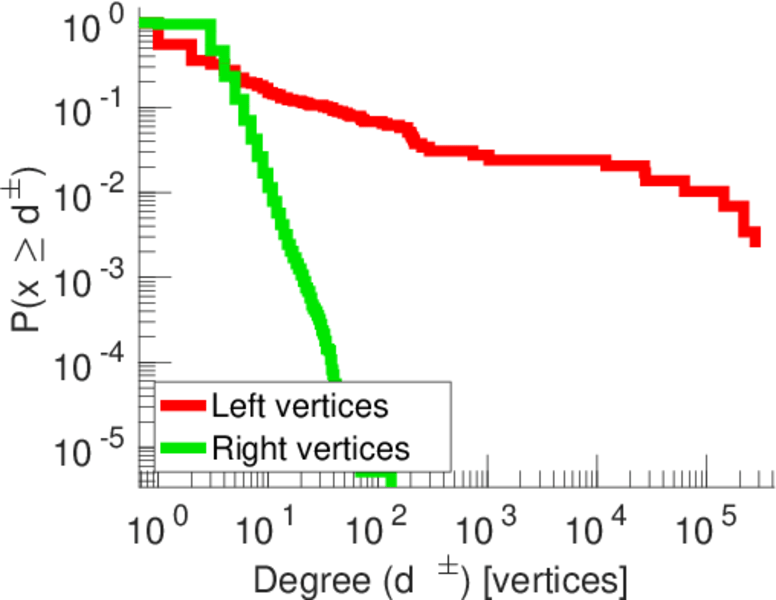
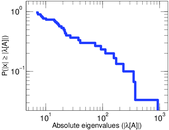
| Tail power law exponent | γt = | 8.271 00
|
| Tail power law exponent with p | γ3 = | 8.271 00
|
| p-value | p = | 0.000 00
|
| Left tail power law exponent with p | γ3,1 = | 1.641 00
|
| Left p-value | p1 = | 0.000 00
|
| Right tail power law exponent with p | γ3,2 = | 8.931 00
|
| Right p-value | p2 = | 0.000 00
|
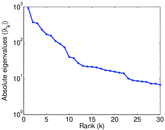
| Spectral norm | α = | 928.590
|
| Algebraic connectivity | a = | 0.020 803 3
|
| Spectral separation | |λ1[A] / λ2[A]| = | 2.484 04
|
| Controllability | C = | 195,108
|
| Relative controllability | Cr = | 0.997 169
|
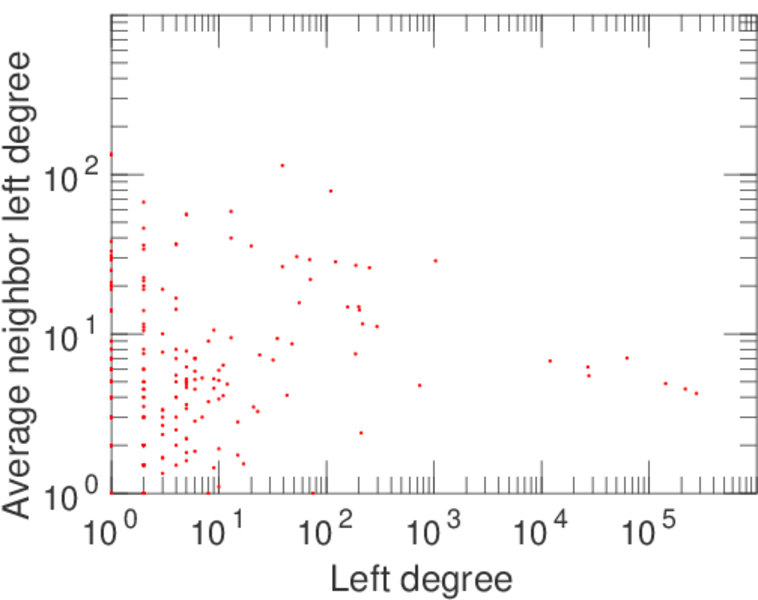
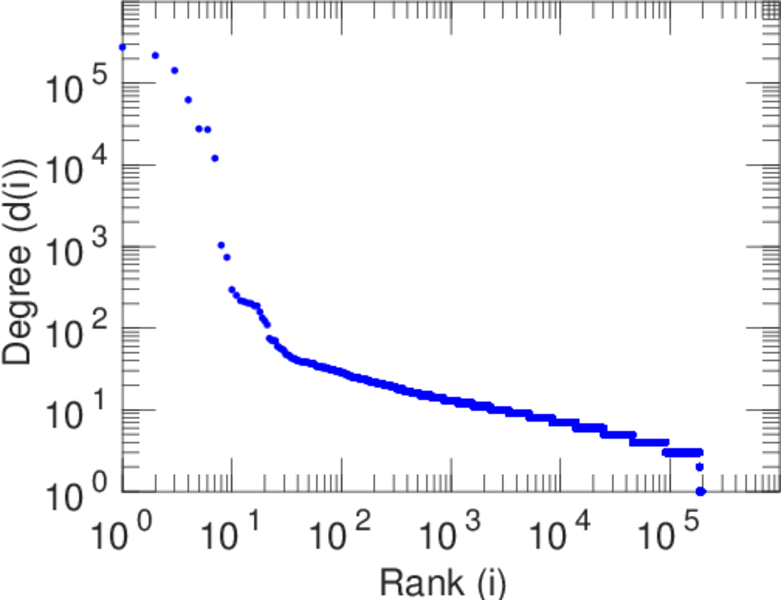
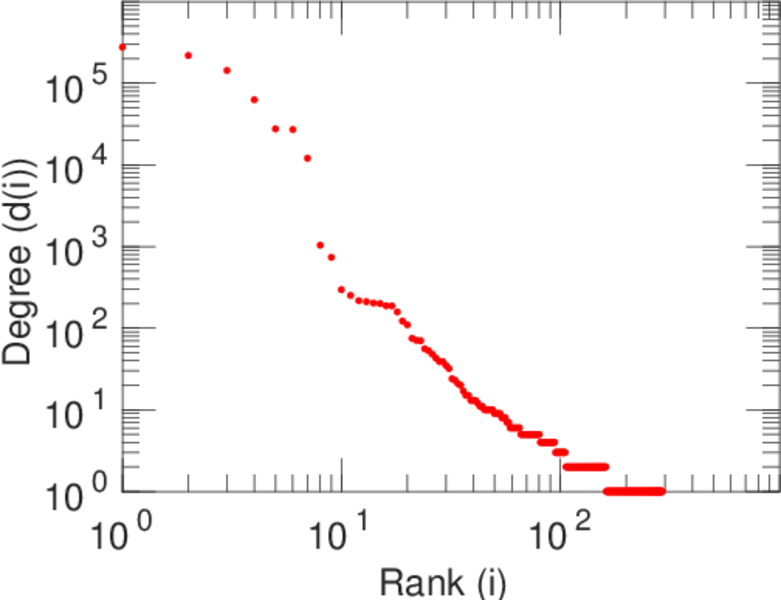
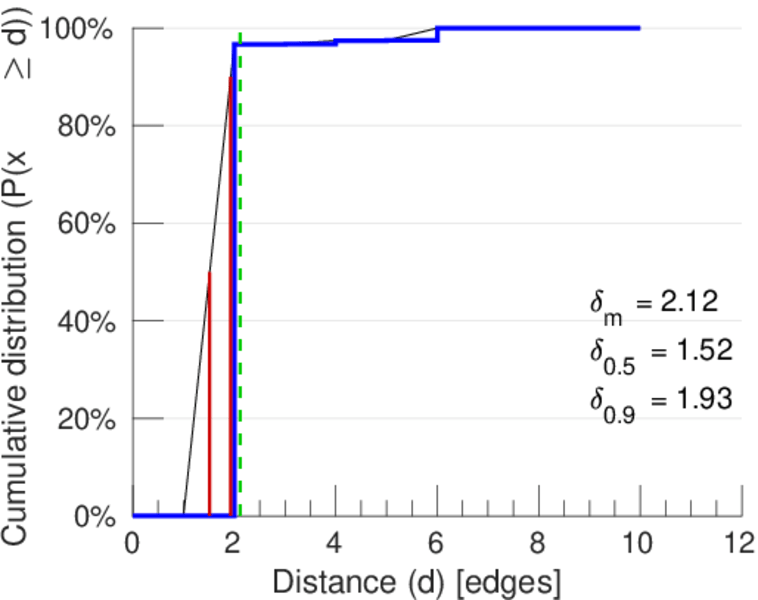
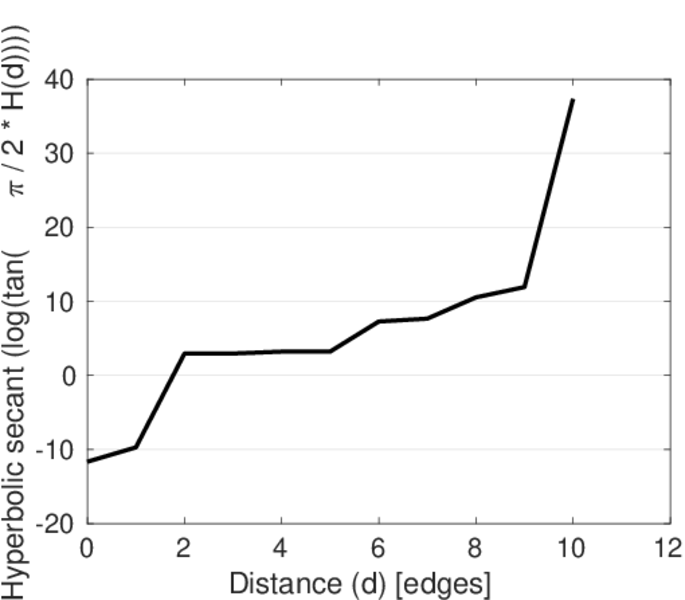
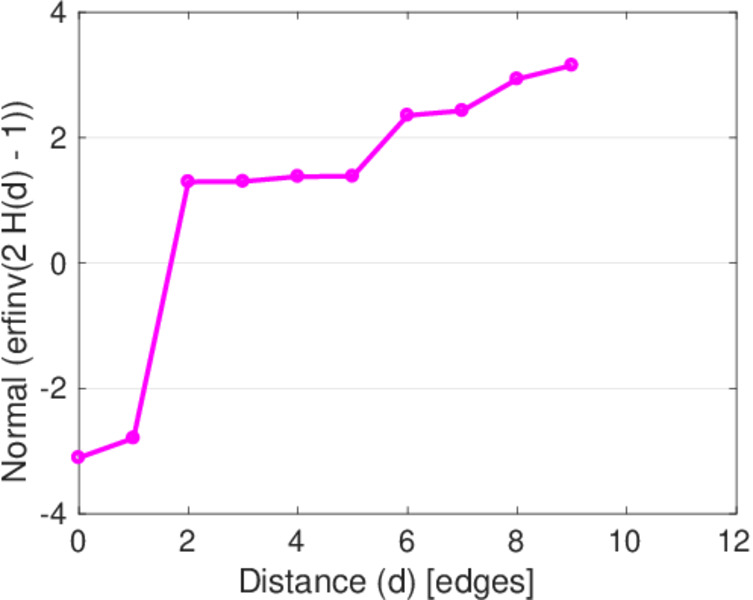
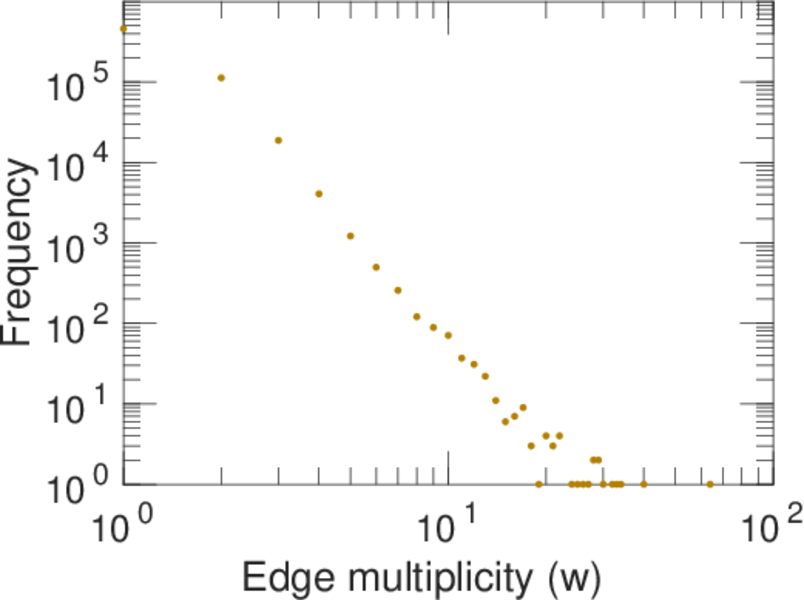
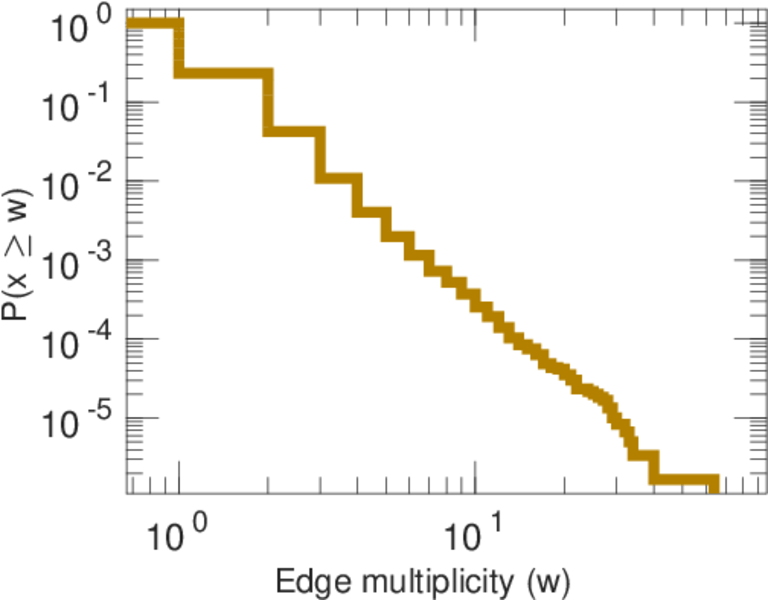
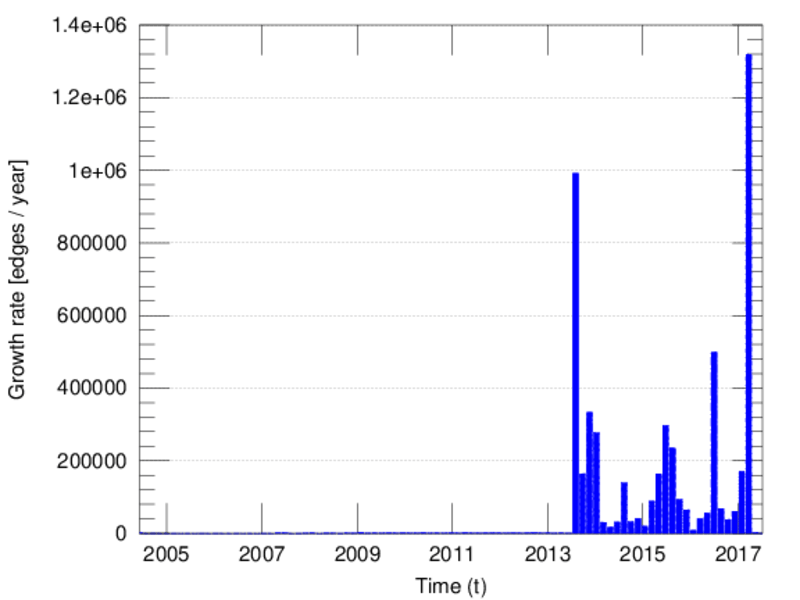
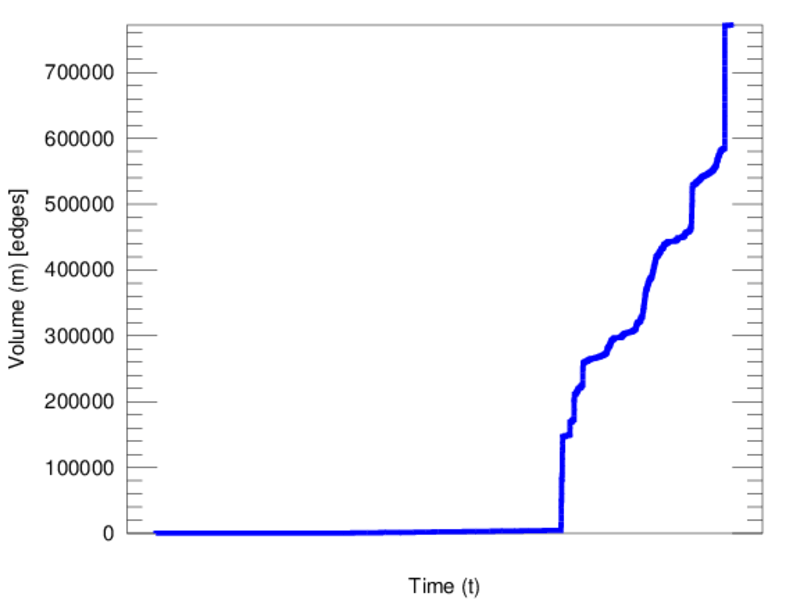
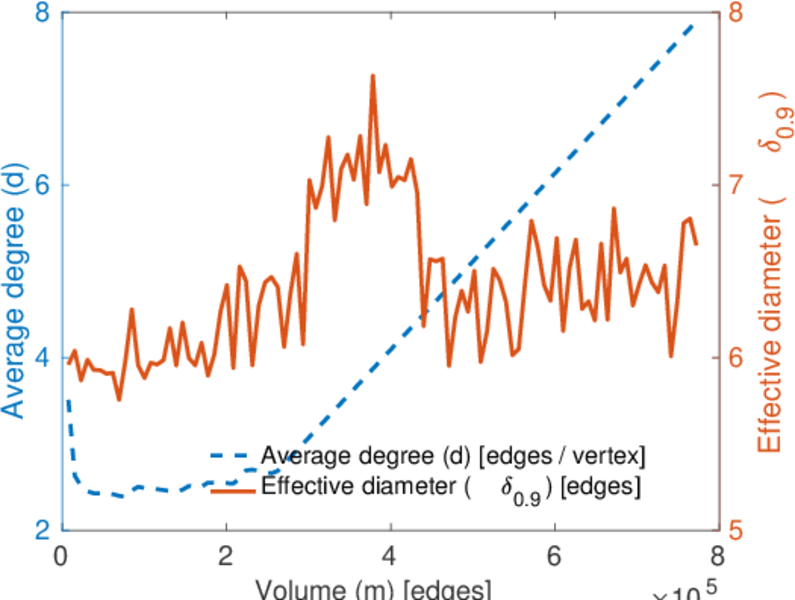
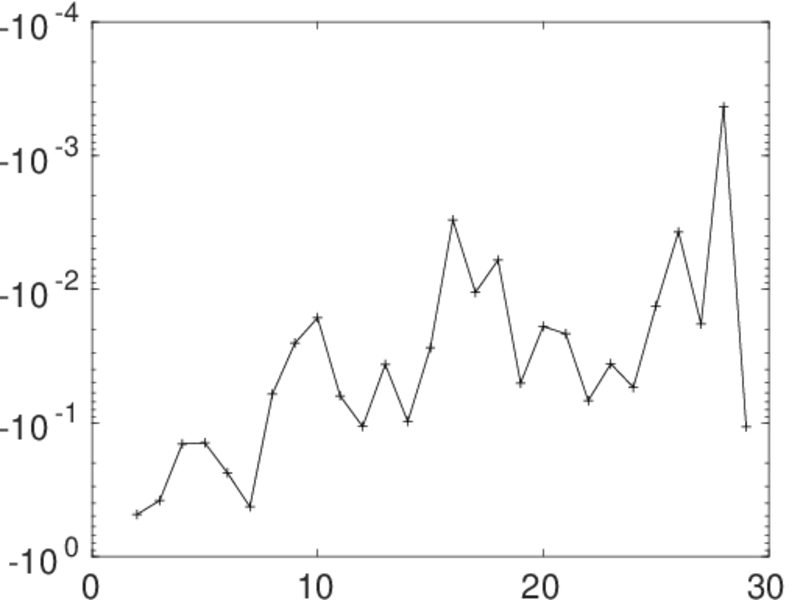
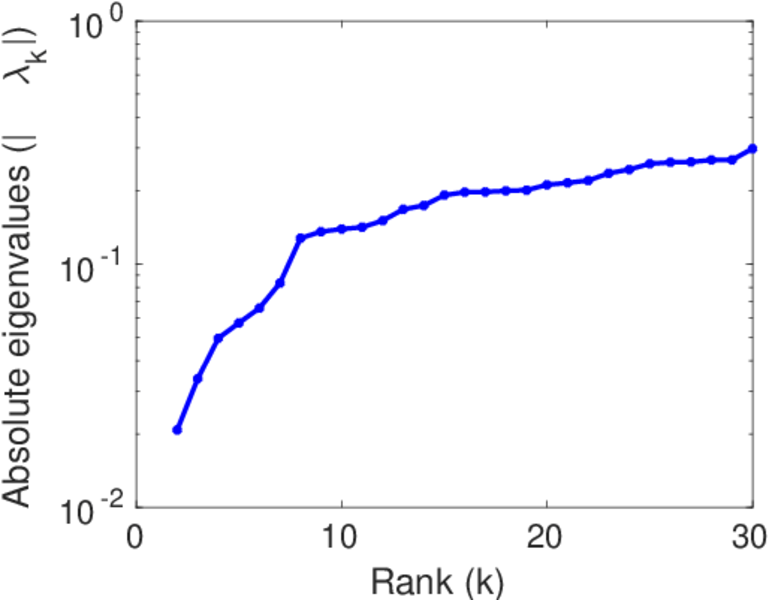
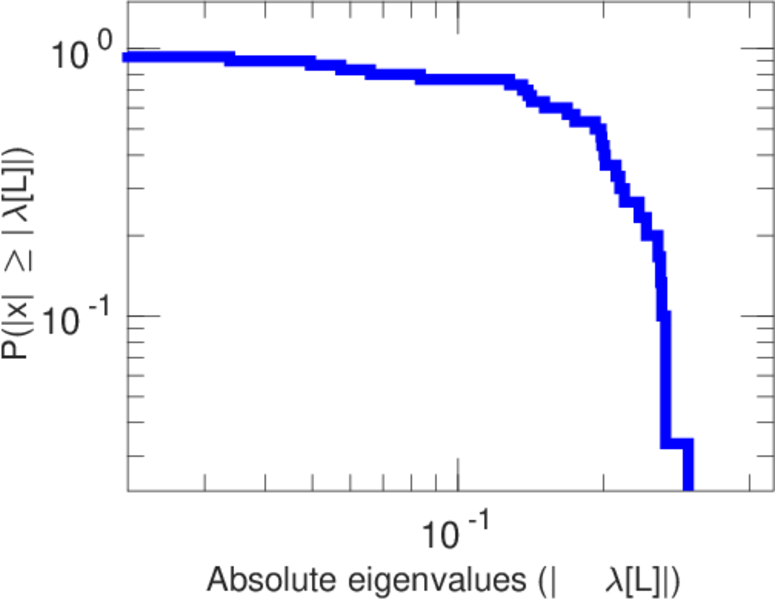
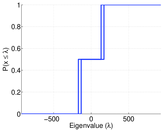
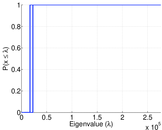
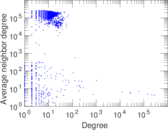
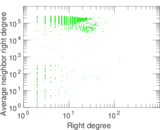
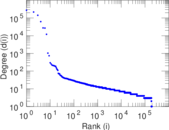
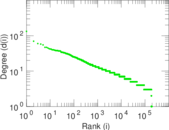
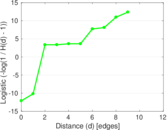
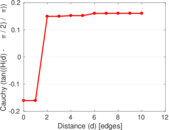
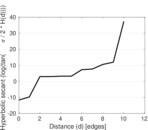
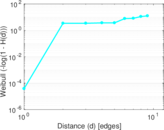
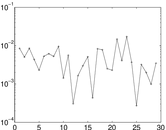
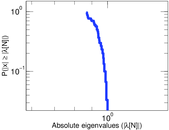
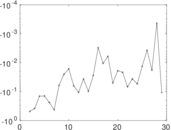
Plots


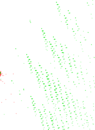

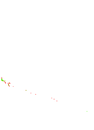


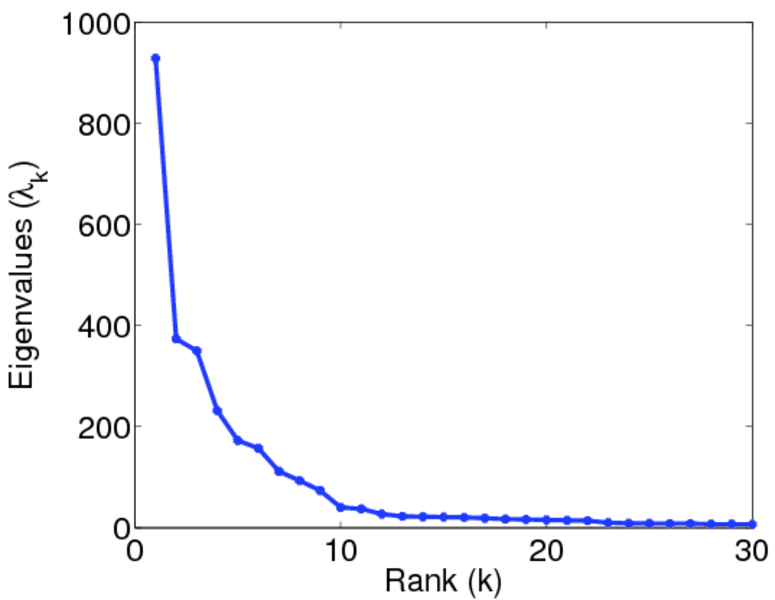
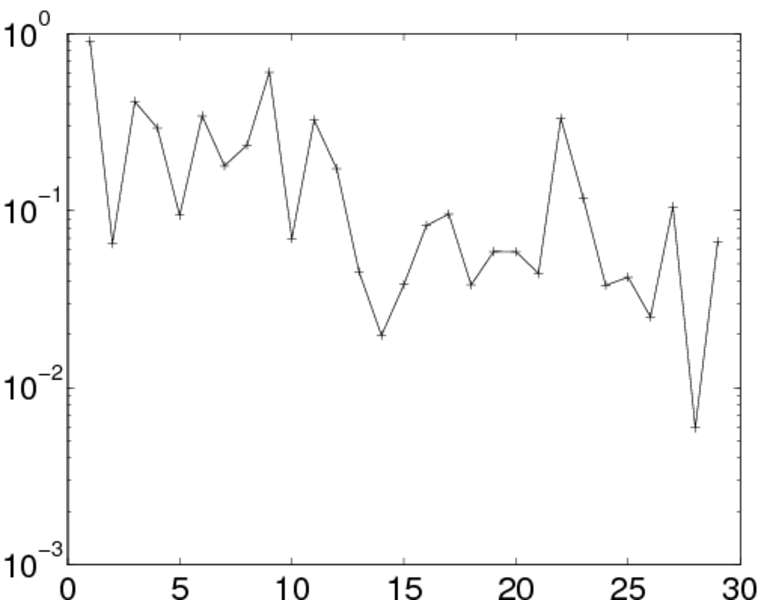
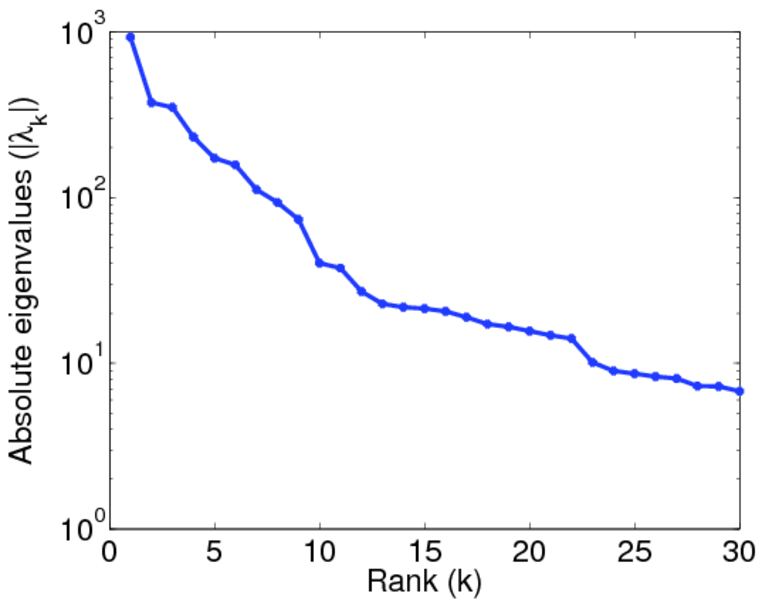
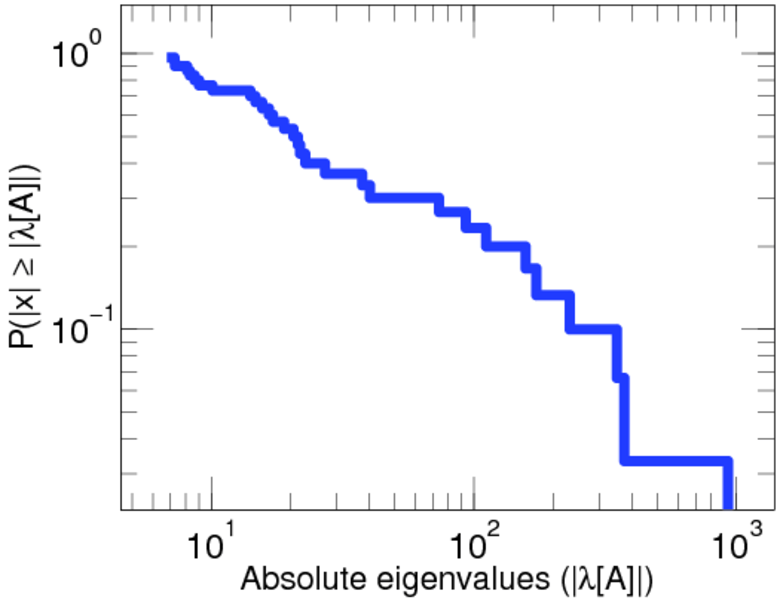
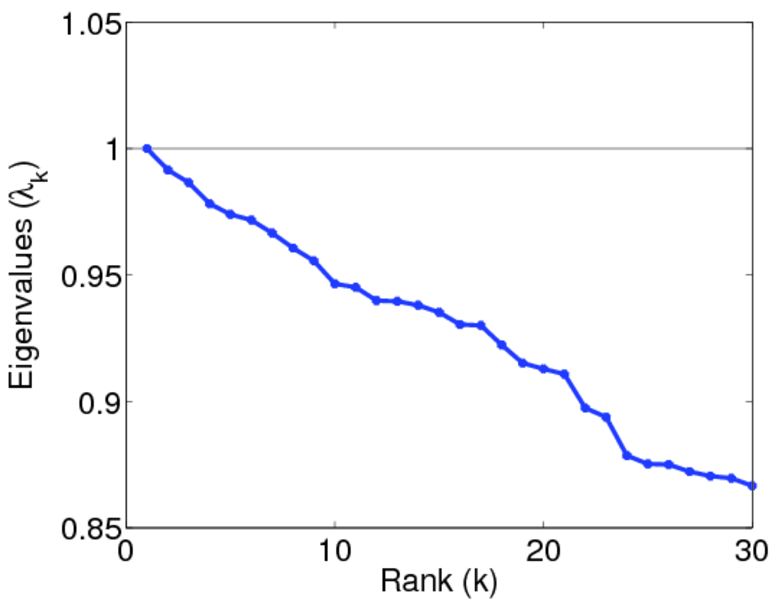
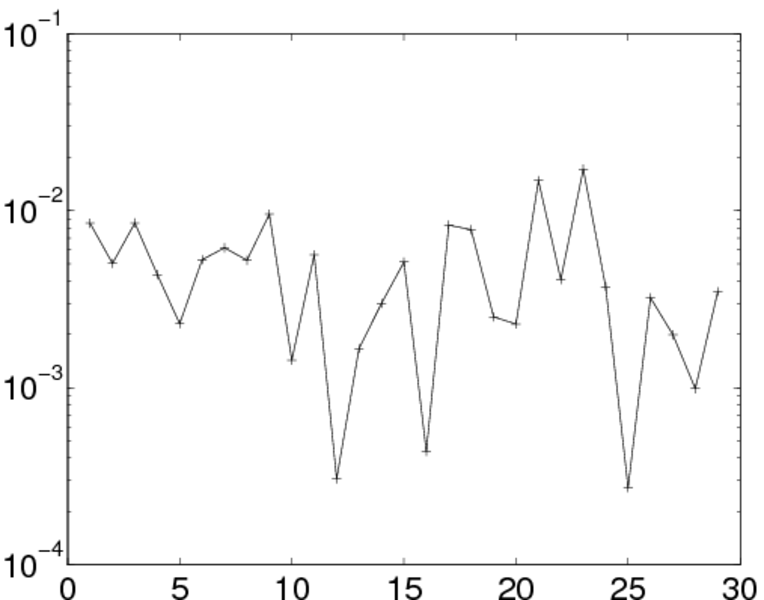
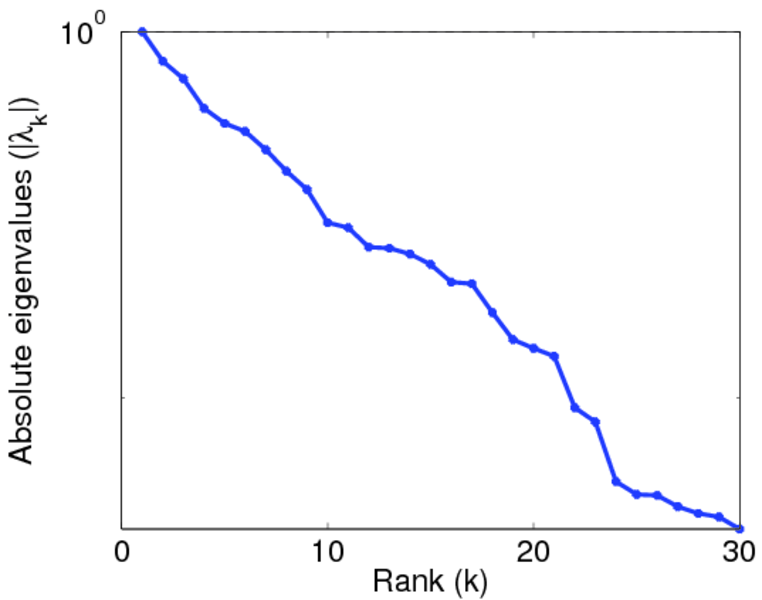
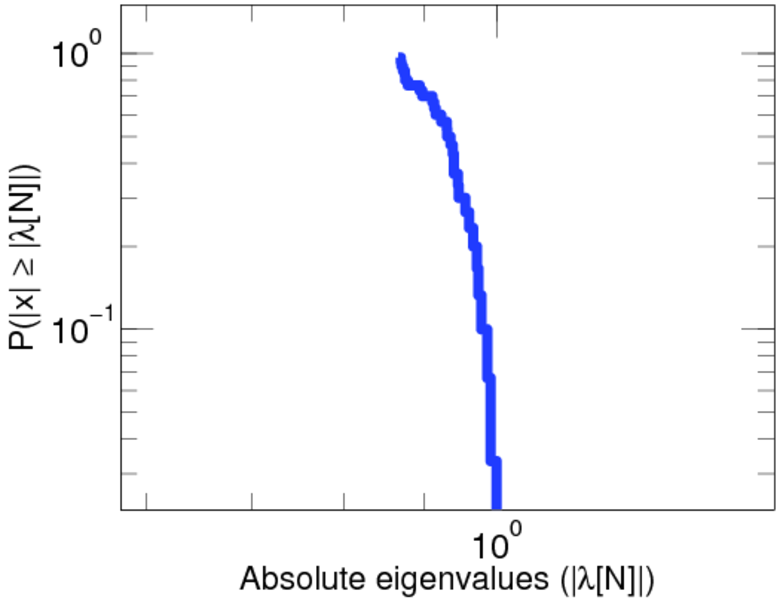
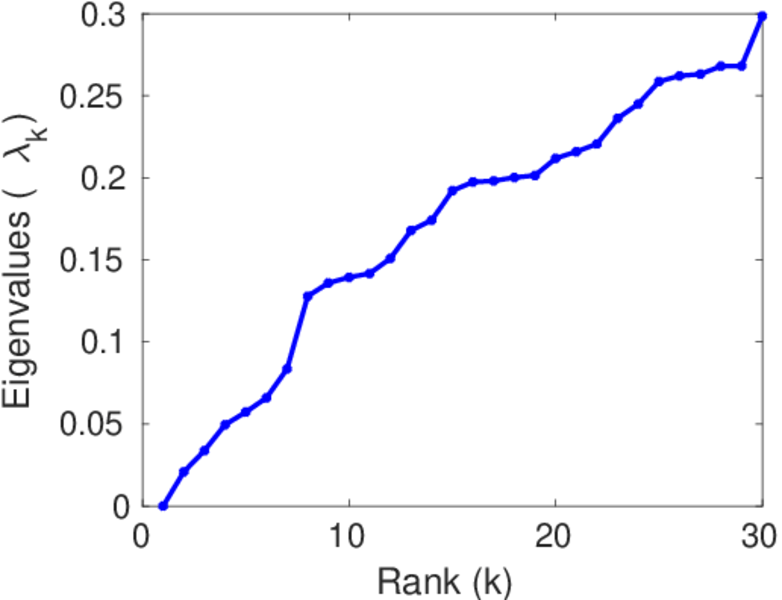
Matrix decompositions plots


Downloads
References
|
[1]
|
Jérôme Kunegis.
KONECT – The Koblenz Network Collection.
In Proc. Int. Conf. on World Wide Web Companion, pages
1343–1350, 2013.
[ http ]
|
|
[2]
|
Wikimedia Foundation.
Wikimedia downloads.
http://dumps.wikimedia.org/, January 2010.
|
 KONECT ‣ Networks ‣
Buy Me a Coffee
KONECT ‣ Networks ‣
Buy Me a Coffee