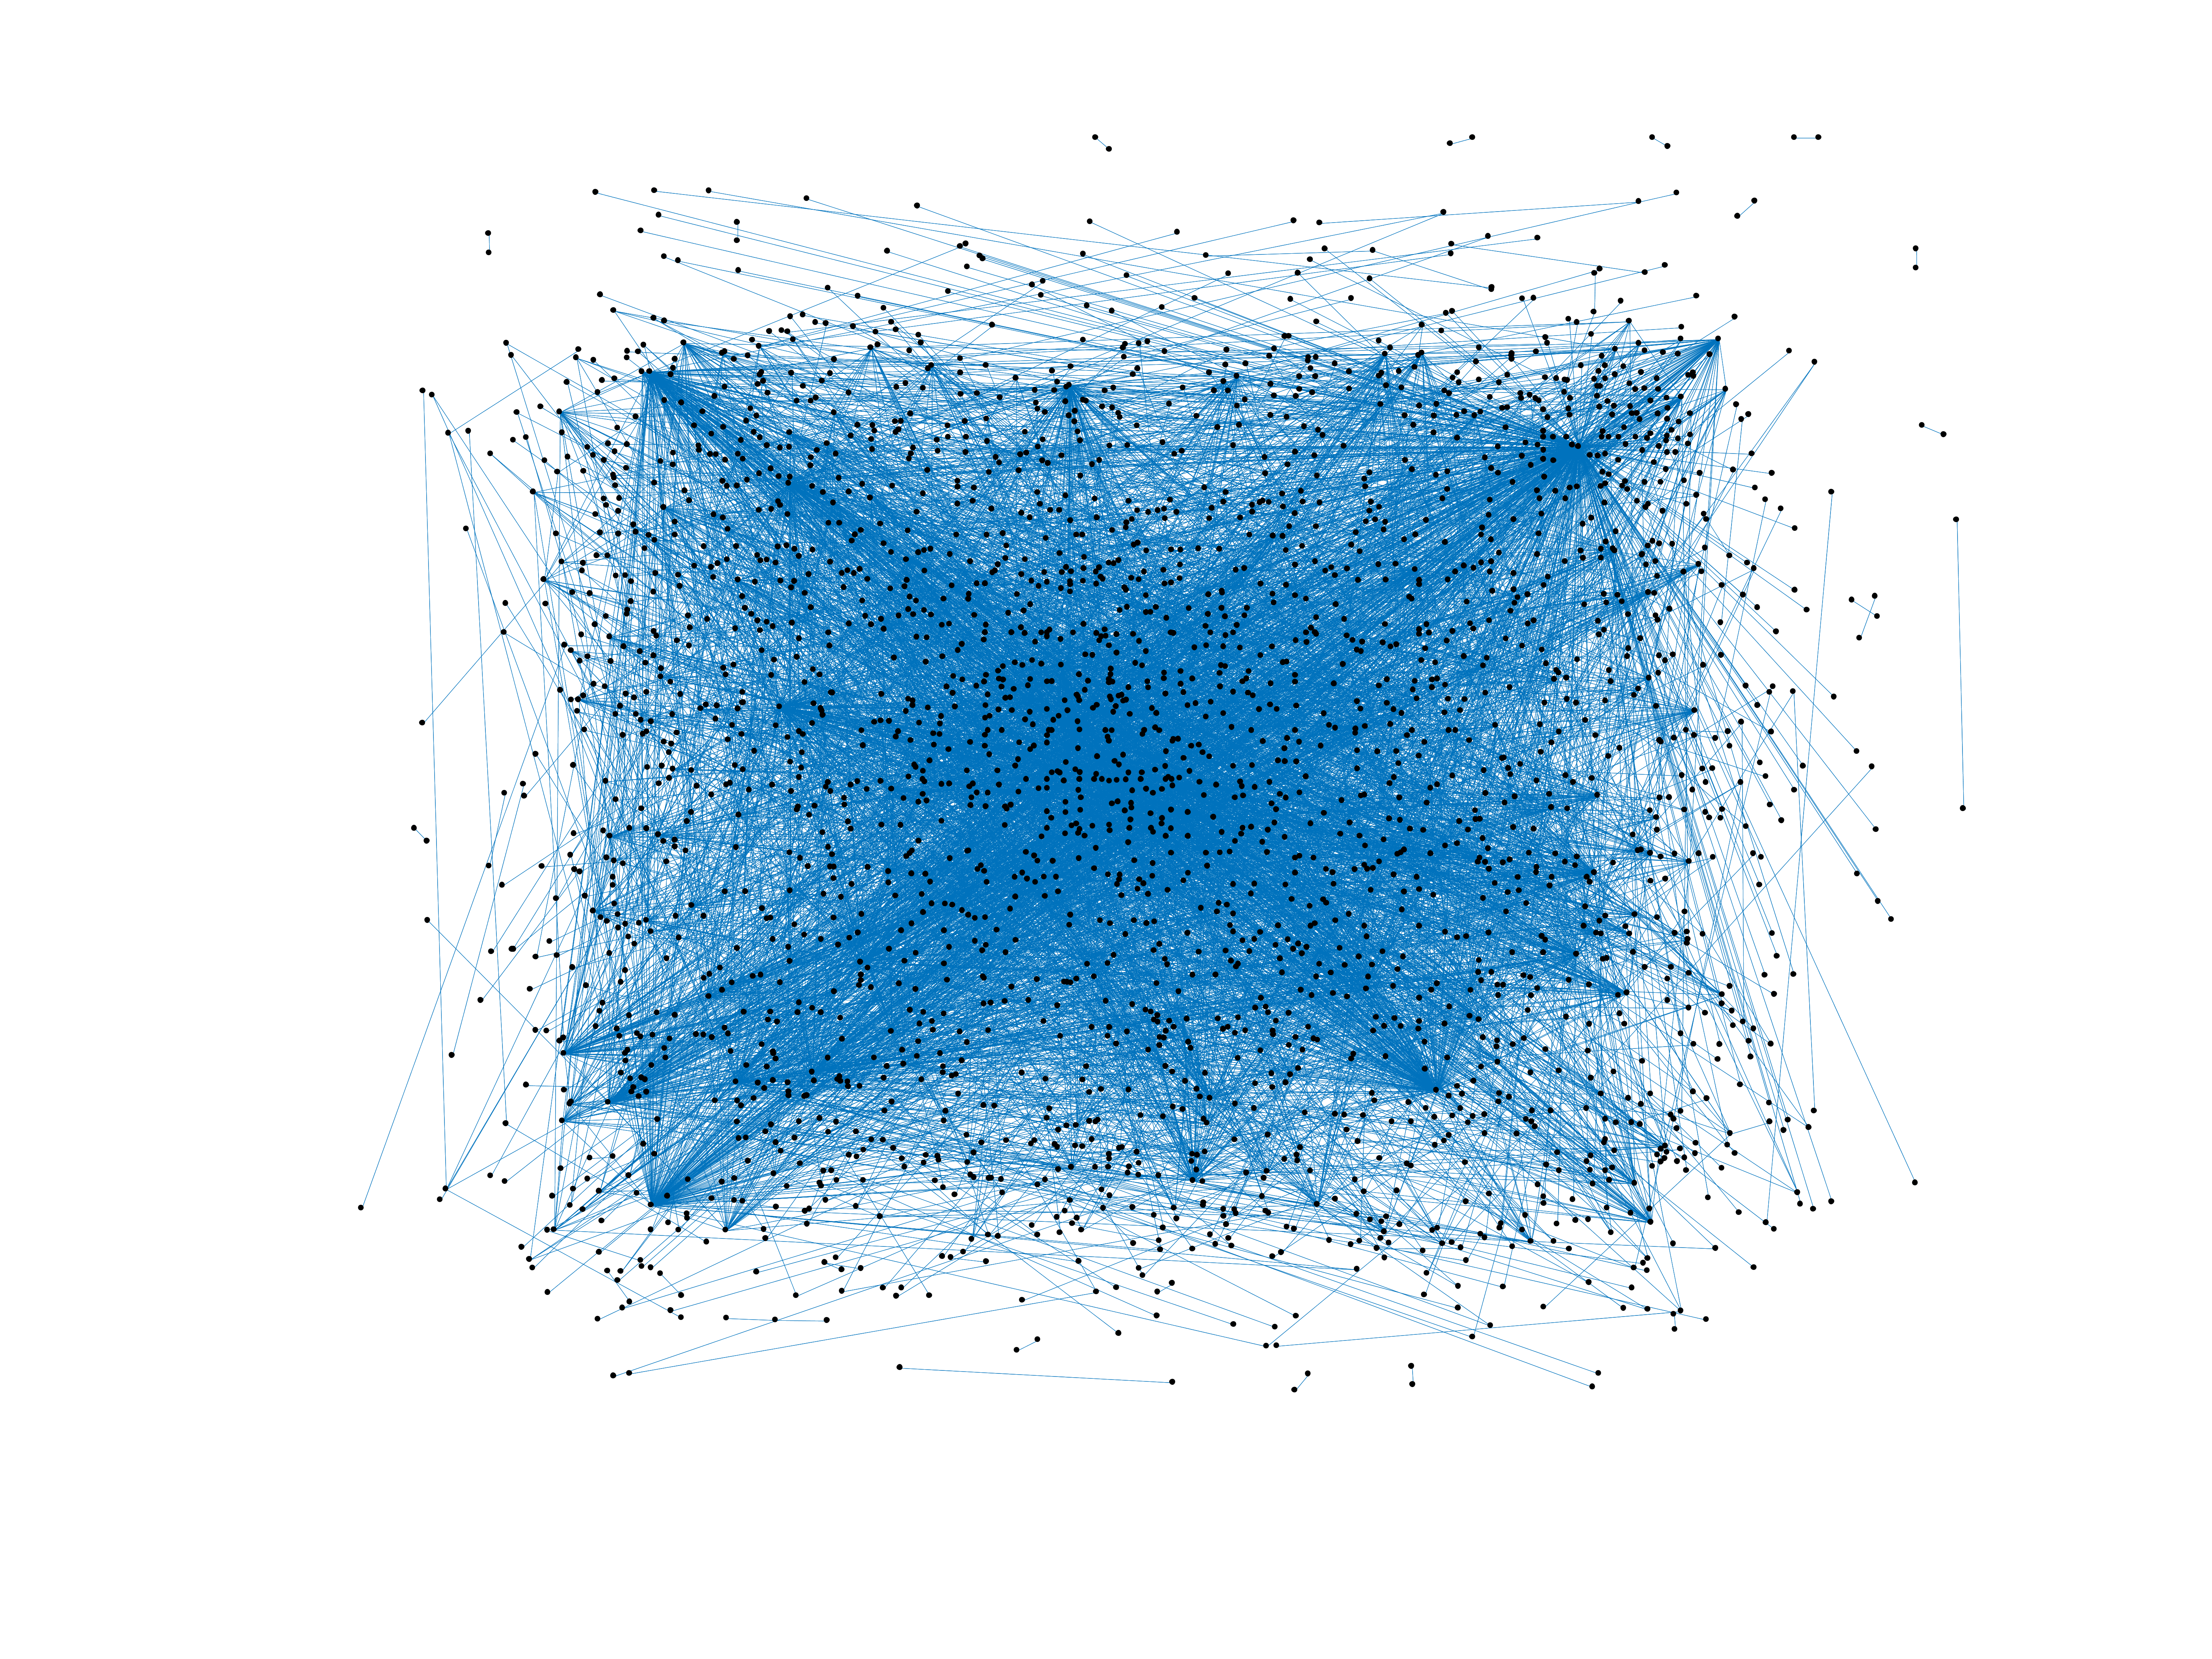
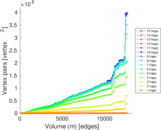
Wikipedia edits (ch)
This is the bipartite edit network of the Chamorro Wikipedia. It contains users
and pages from the Chamorro Wikipedia, connected by edit events. Each edge
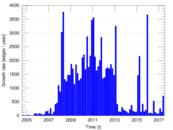
represents an edit. The dataset includes the timestamp of each edit.
Metadata
Statistics
| Size | n = | 2,943
|
| Left size | n1 = | 708
|
| Right size | n2 = | 2,235
|
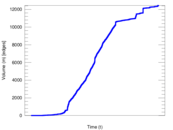
| Volume | m = | 12,452
|
| Unique edge count | m̿ = | 5,960
|
| Wedge count | s = | 317,943
|
| Claw count | z = | 22,075,192
|
| Cross count | x = | 1,920,950,028
|
| Square count | q = | 476,291
|
| 4-Tour count | T4 = | 5,095,232
|
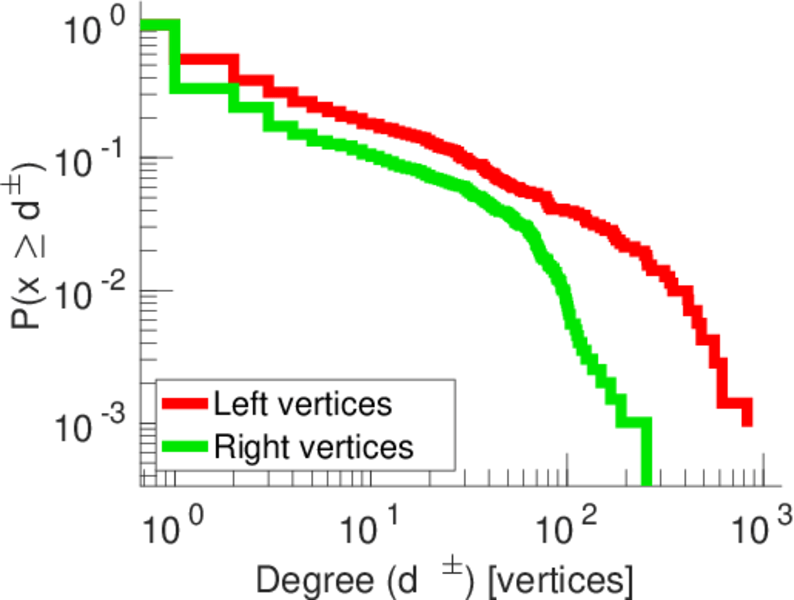
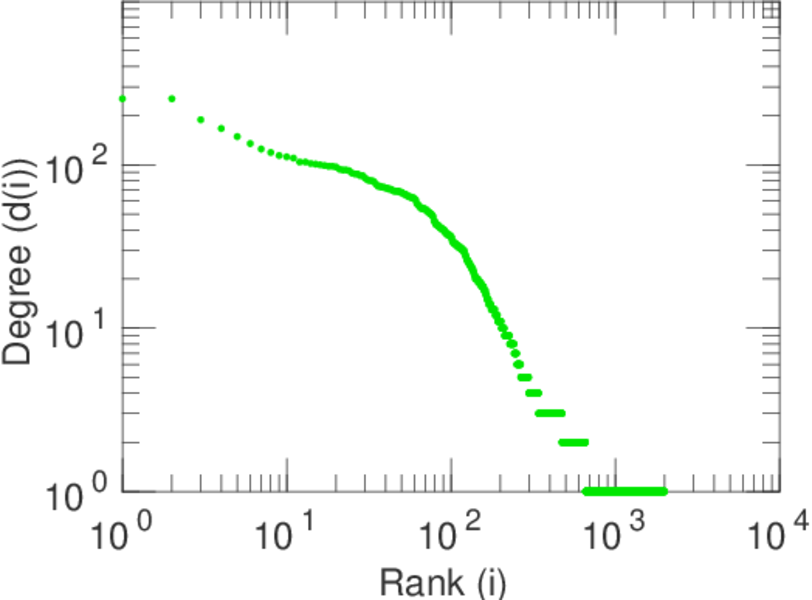
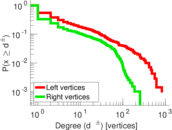
| Maximum degree | dmax = | 828
|
| Maximum left degree | d1max = | 828
|
| Maximum right degree | d2max = | 254
|
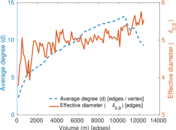
| Average degree | d = | 8.462 11
|
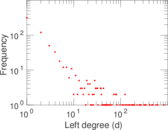
| Average left degree | d1 = | 17.587 6
|
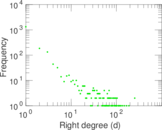
| Average right degree | d2 = | 5.571 36
|
| Fill | p = | 0.003 766 48
|
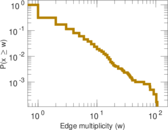
| Average edge multiplicity | m̃ = | 2.089 26
|
| Size of LCC | N = | 1,997
|
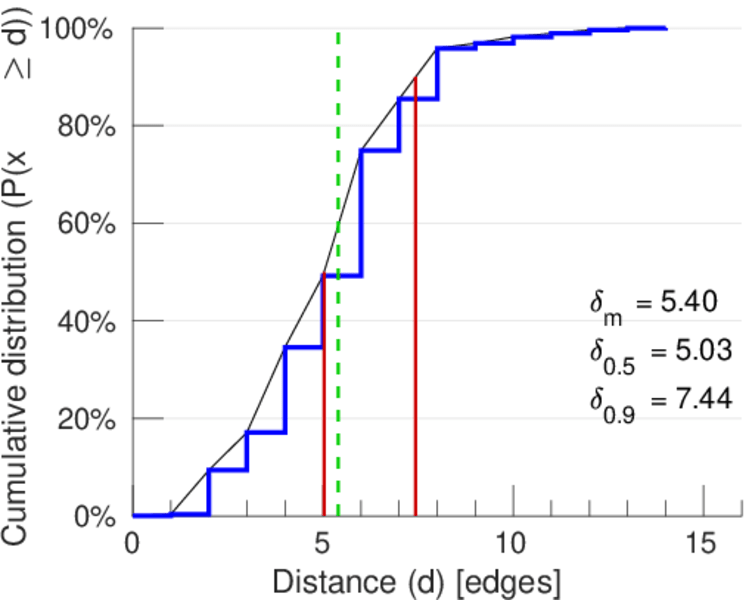
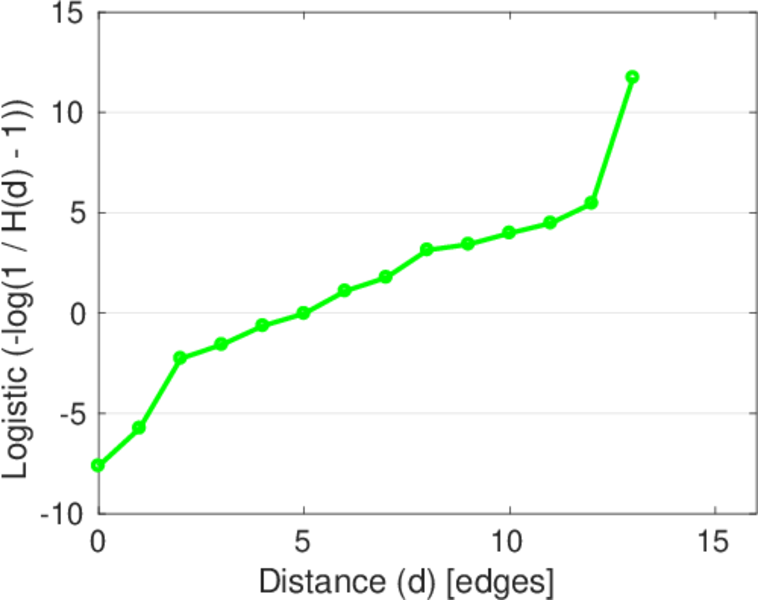
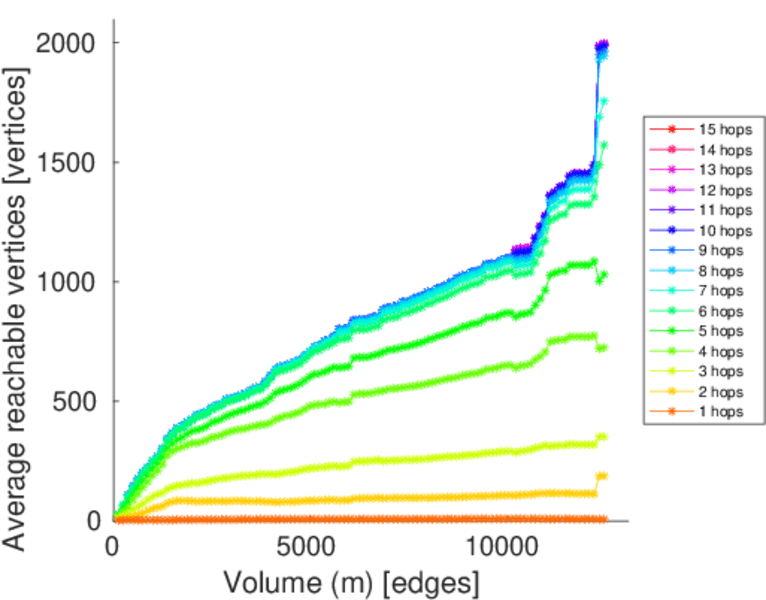
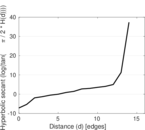
| Diameter | δ = | 14
|
| 50-Percentile effective diameter | δ0.5 = | 5.029 61
|
| 90-Percentile effective diameter | δ0.9 = | 7.438 16
|
| Median distance | δM = | 6
|
| Mean distance | δm = | 5.397 56
|
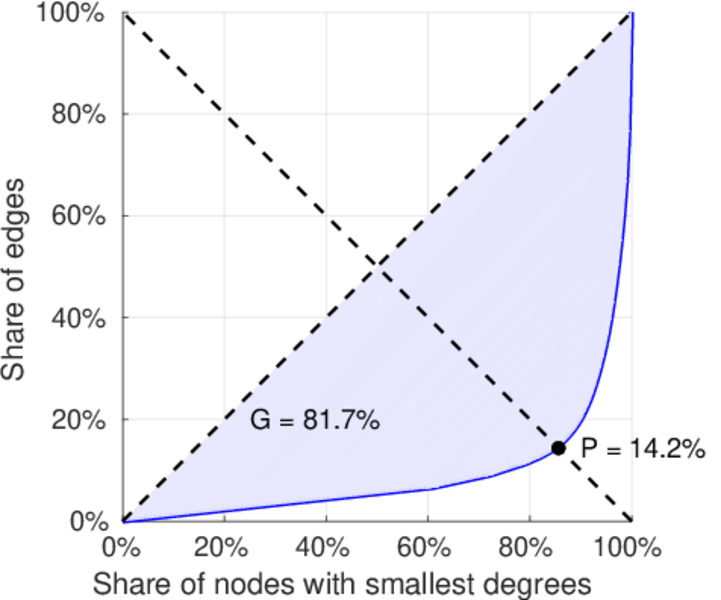
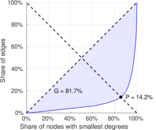
| Gini coefficient | G = | 0.820 300
|
| Balanced inequality ratio | P = | 0.146 201
|
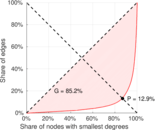
| Left balanced inequality ratio | P1 = | 0.129 056
|
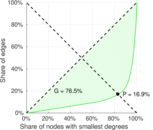
| Right balanced inequality ratio | P2 = | 0.169 210
|
| Relative edge distribution entropy | Her = | 0.827 823
|
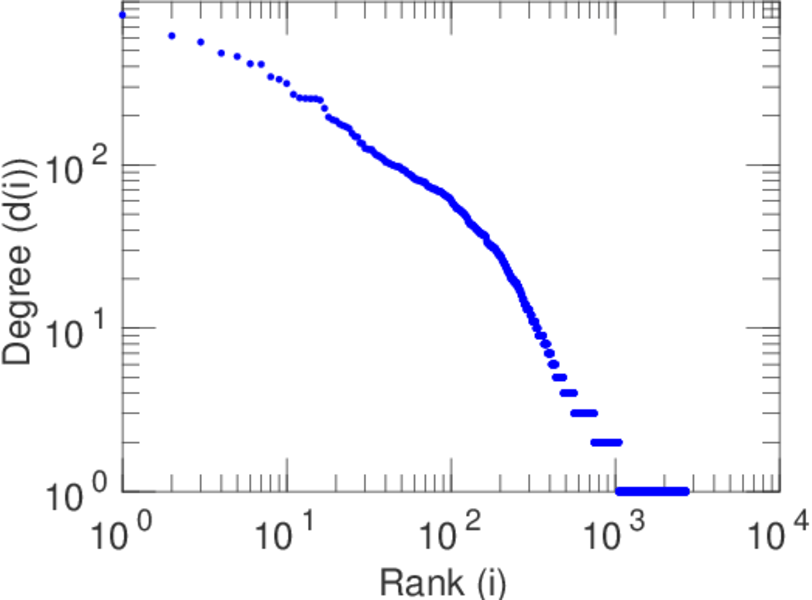
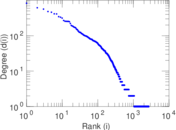
| Power law exponent | γ = | 2.924 49
|
| Tail power law exponent | γt = | 2.851 00
|
| Tail power law exponent with p | γ3 = | 2.851 00
|
| p-value | p = | 0.276 000
|
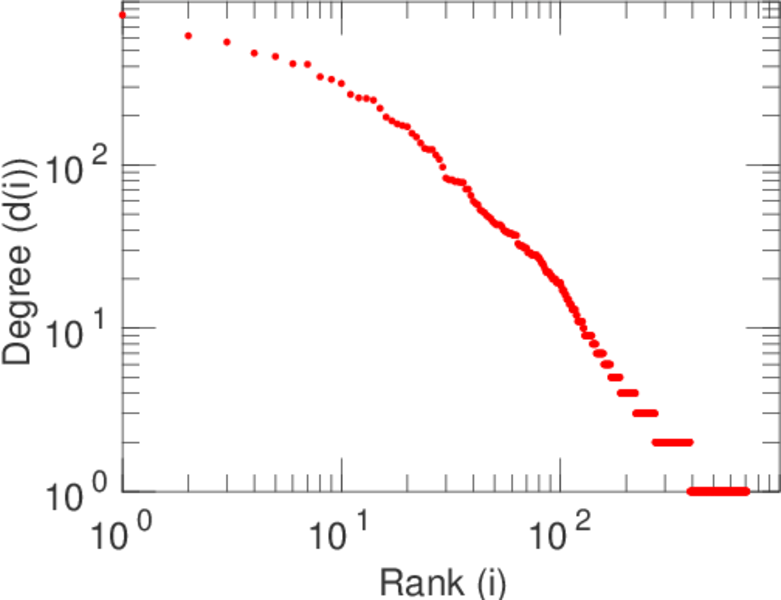
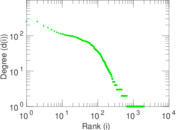
| Left tail power law exponent with p | γ3,1 = | 1.771 00
|
| Left p-value | p1 = | 0.001 000 00
|
| Right tail power law exponent with p | γ3,2 = | 2.241 00
|
| Right p-value | p2 = | 0.000 00
|
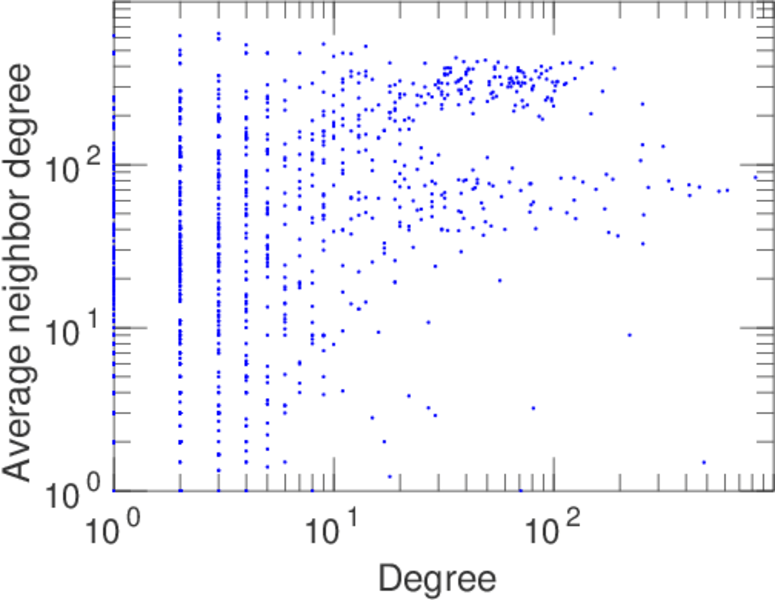
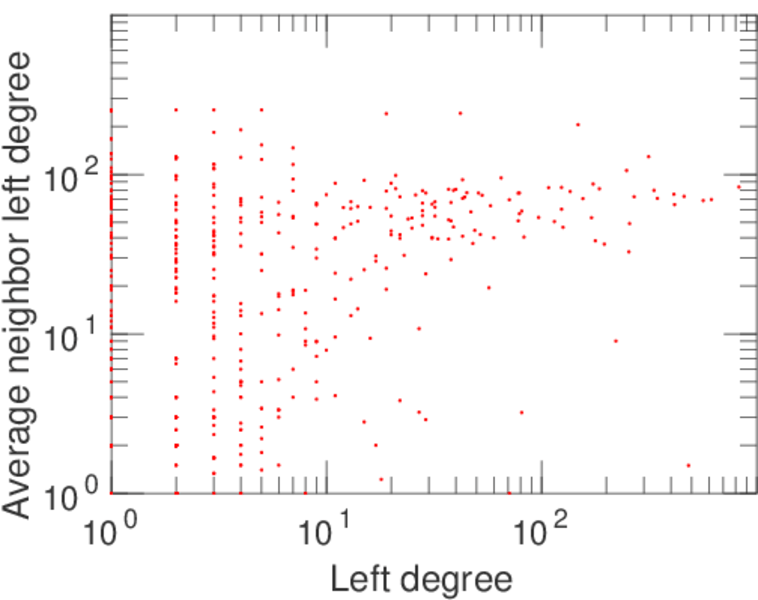
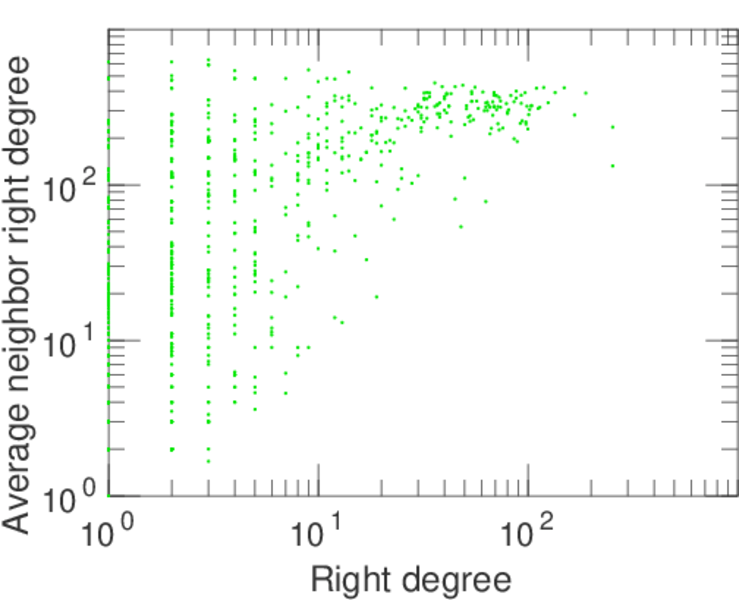
| Degree assortativity | ρ = | −0.268 541
|
| Degree assortativity p-value | pρ = | 5.628 18 × 10−99
|
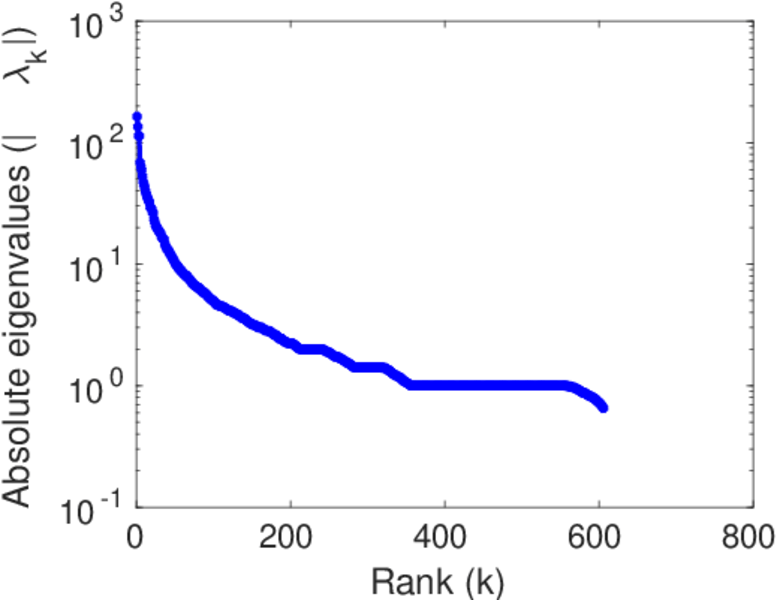
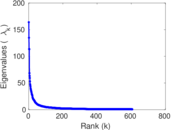
| Spectral norm | α = | 163.863
|
| Algebraic connectivity | a = | 0.004 366 72
|
| Spectral separation | |λ1[A] / λ2[A]| = | 1.215 70
|
| Controllability | C = | 1,393
|
| Relative controllability | Cr = | 0.518 036
|
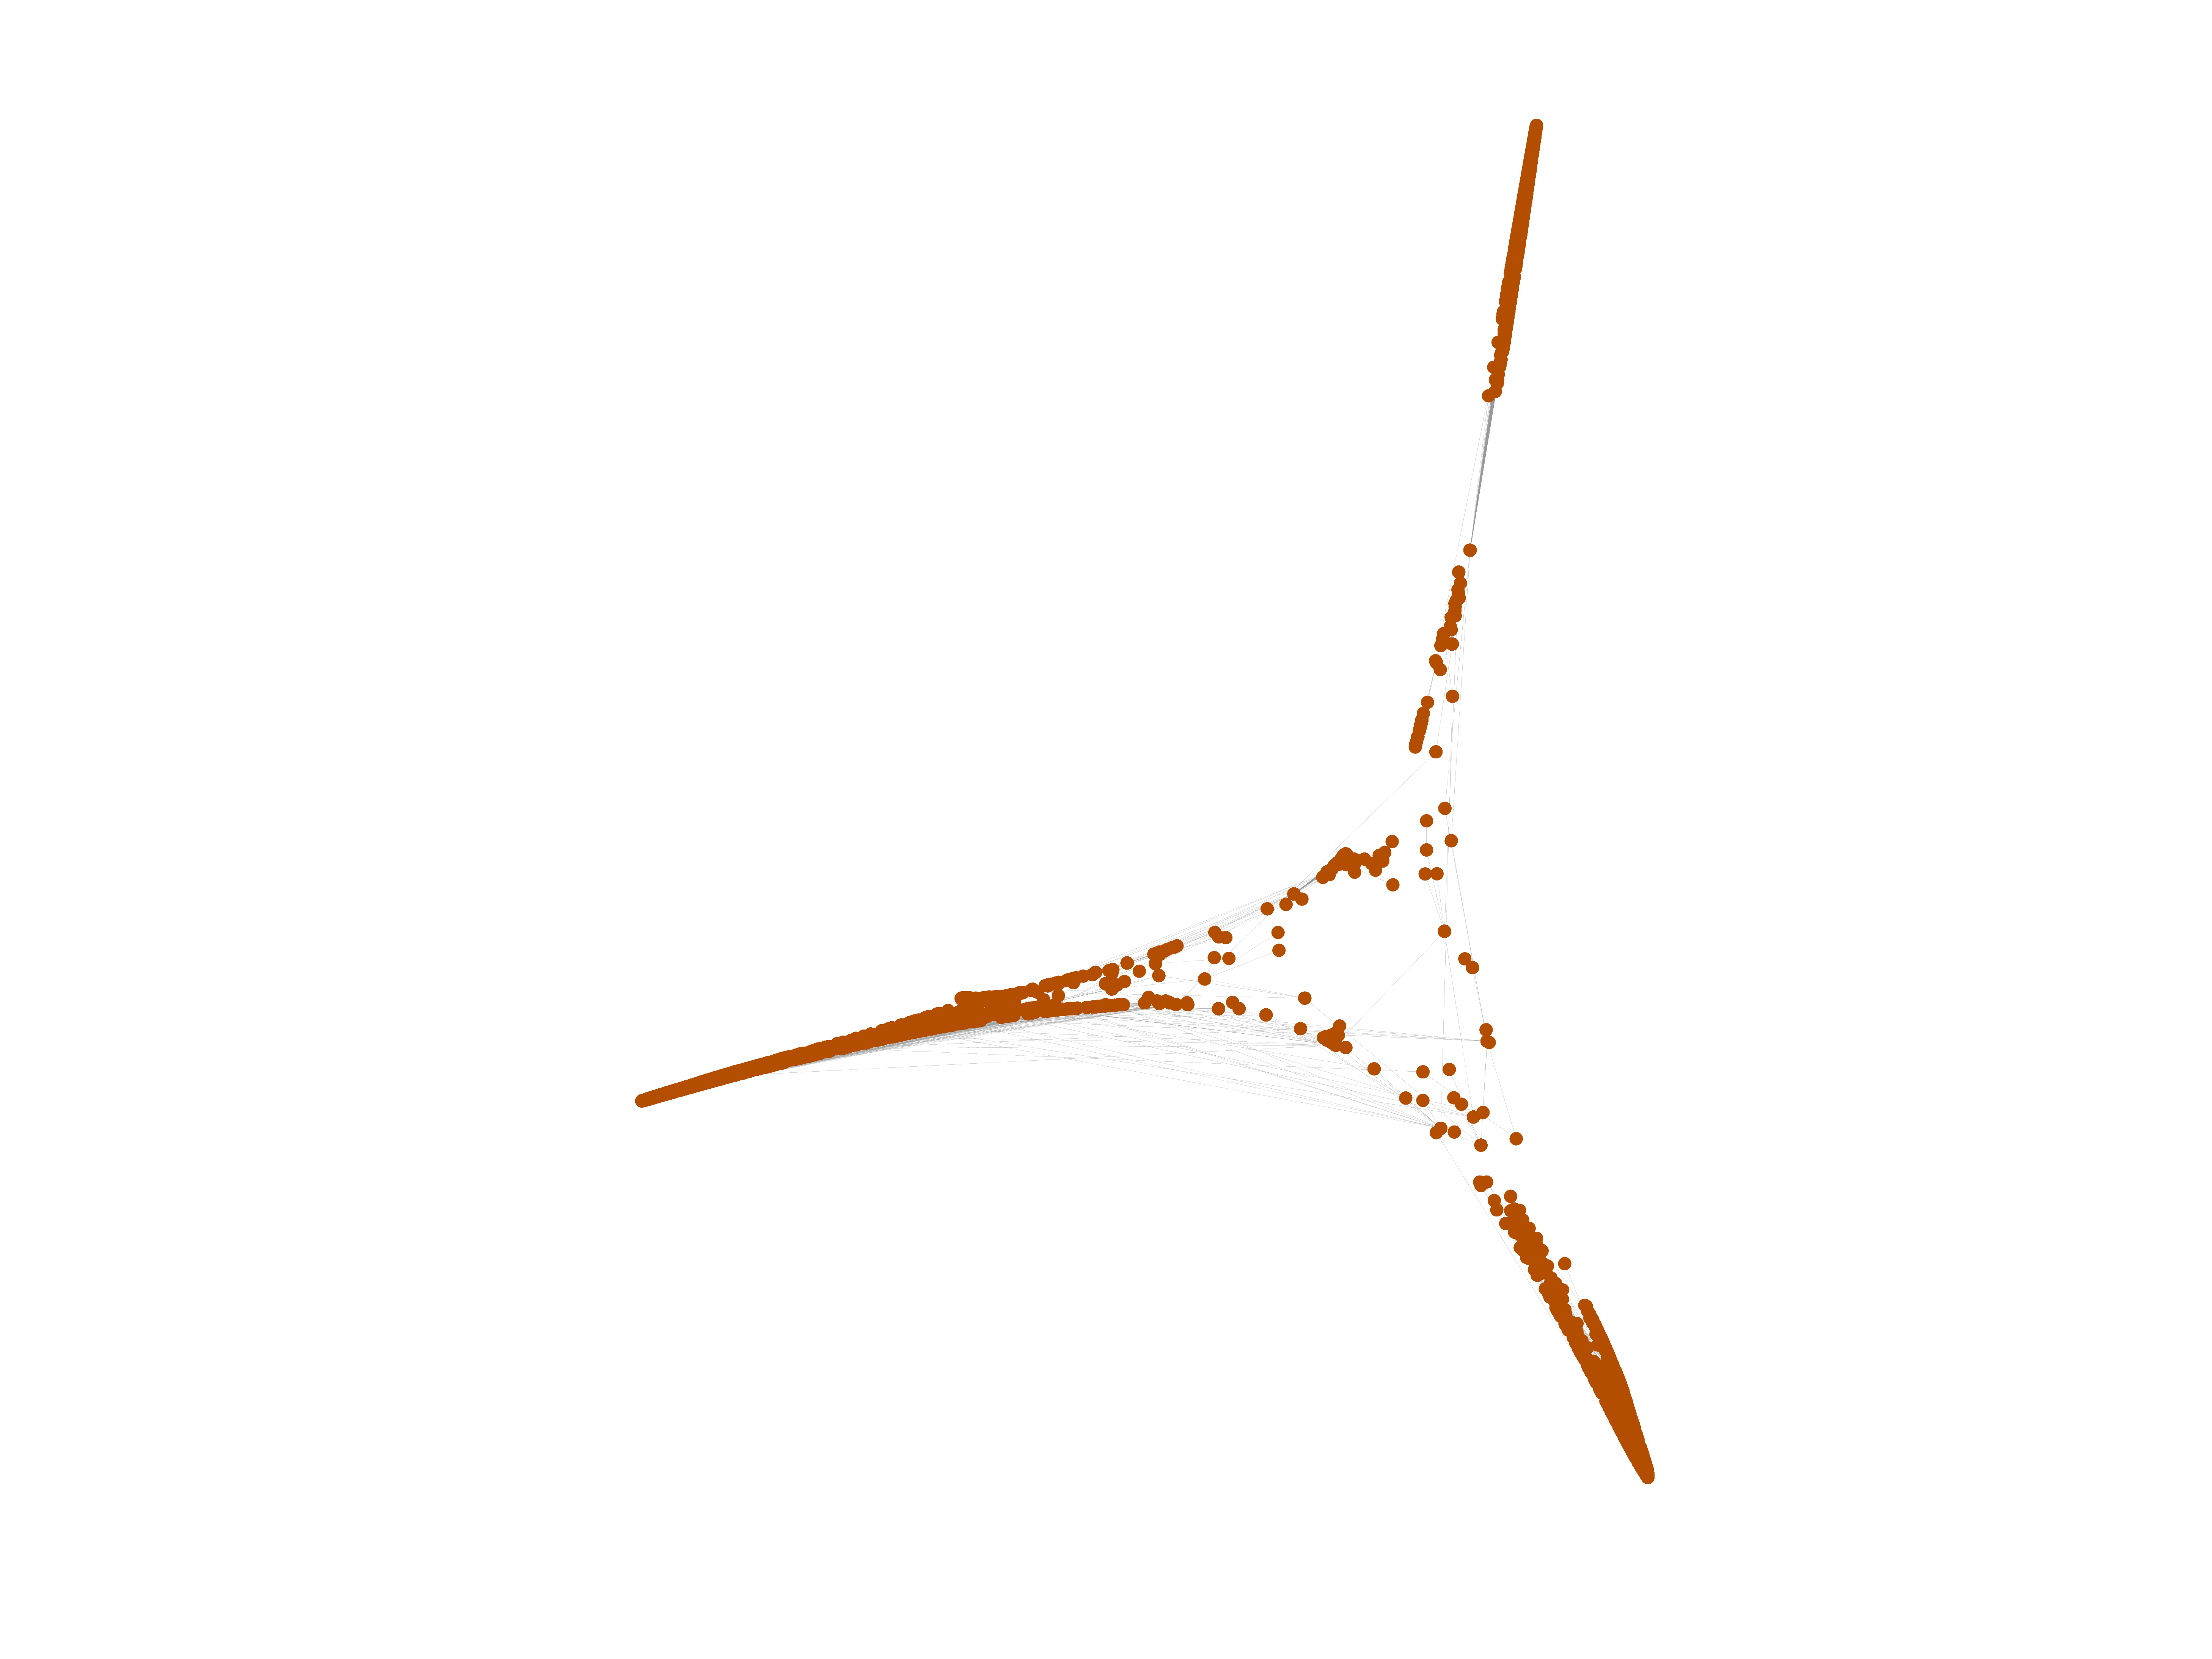
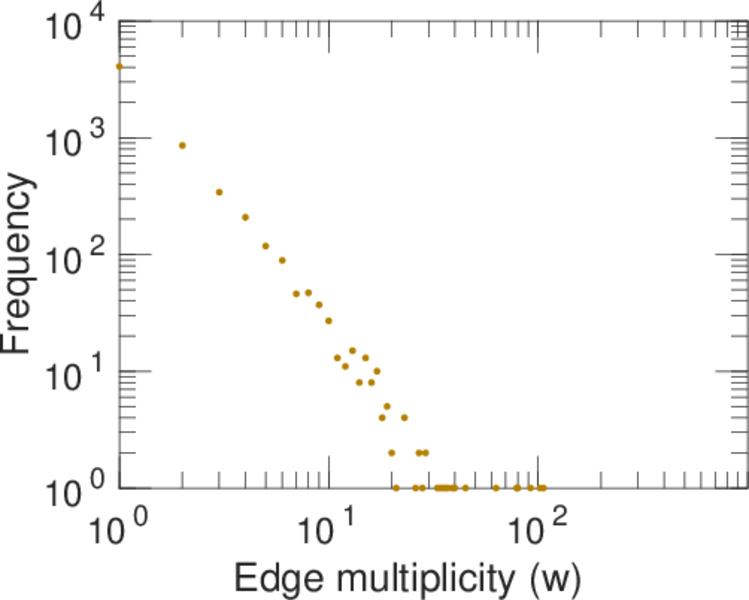
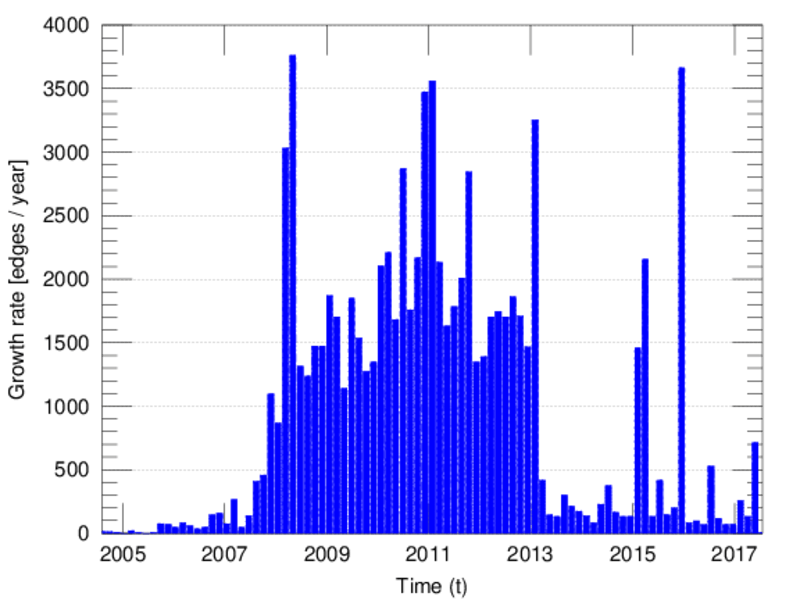
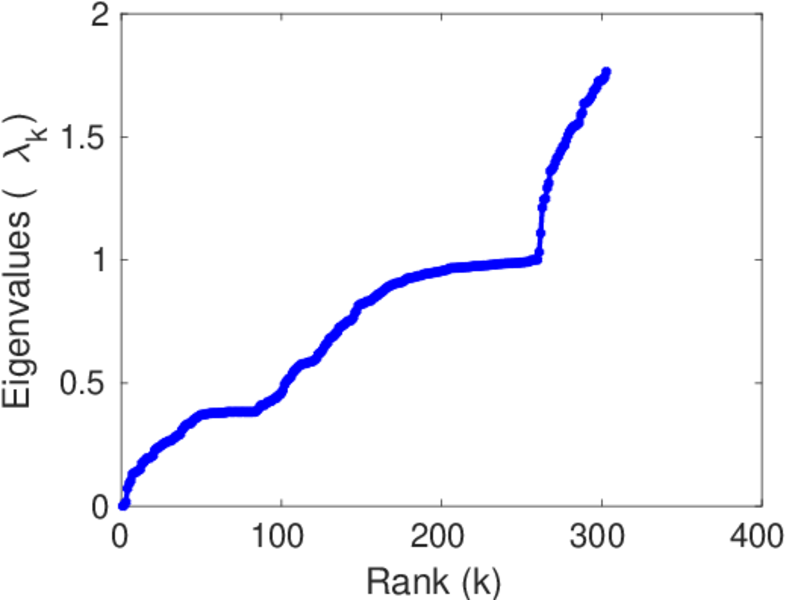
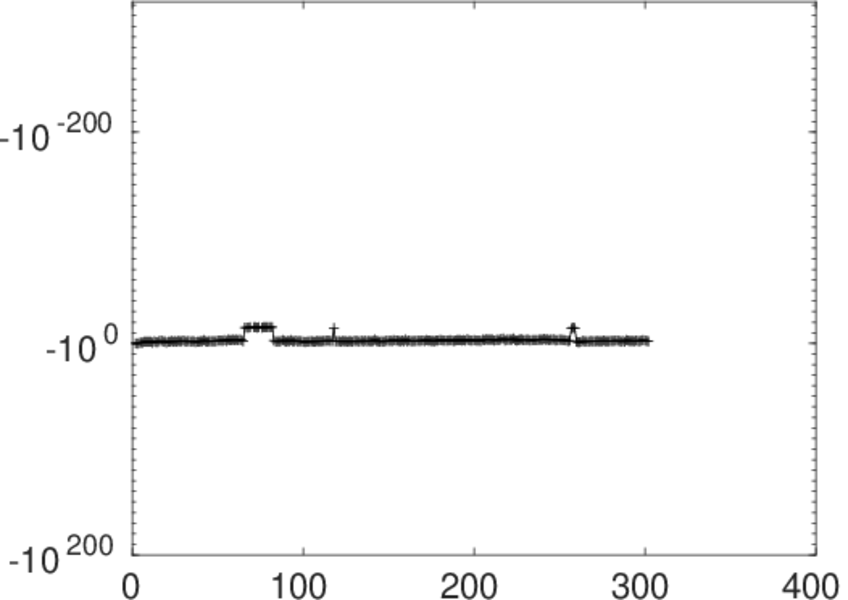
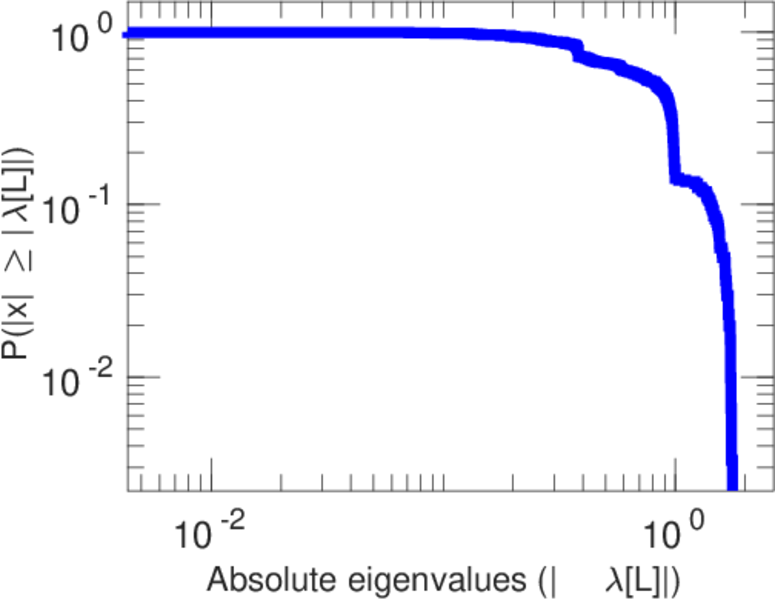
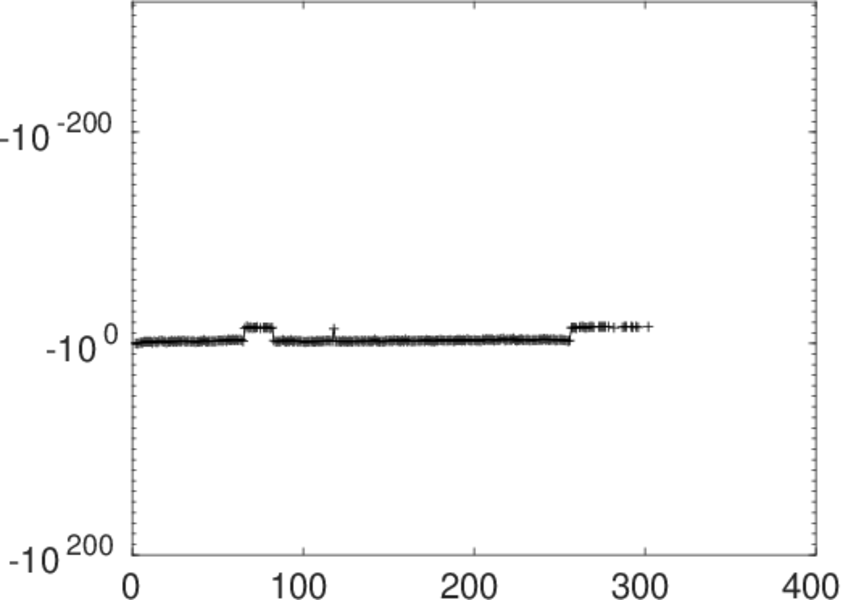
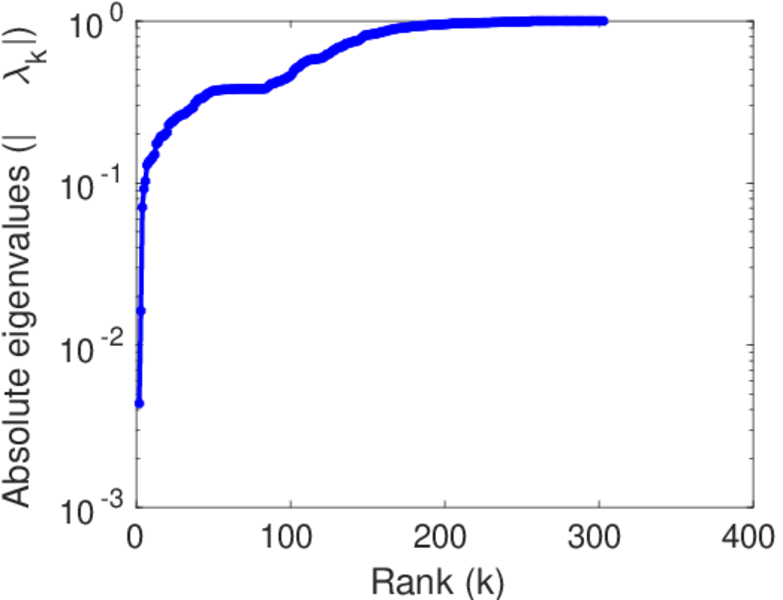
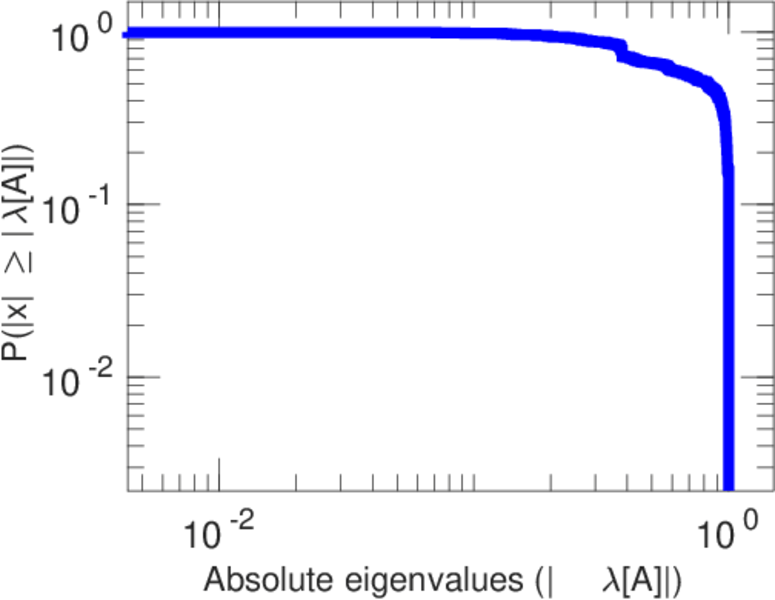
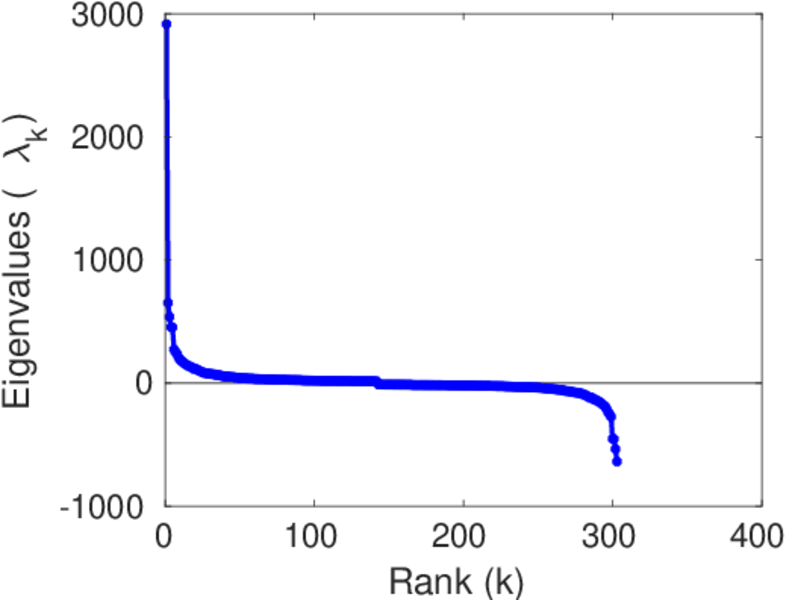
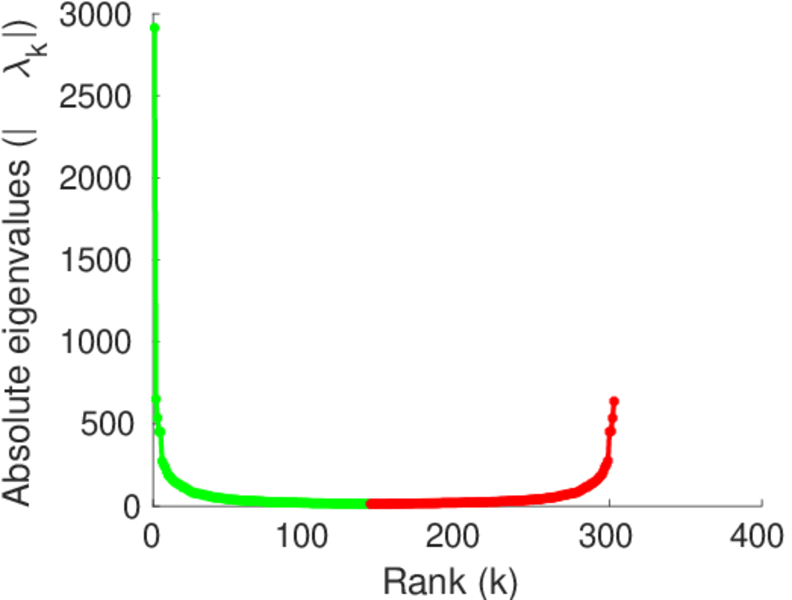
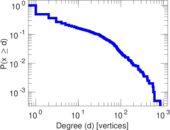
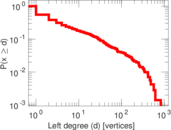
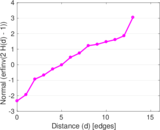
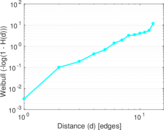
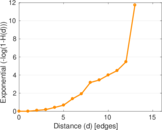
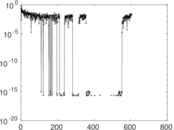
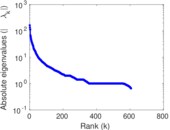
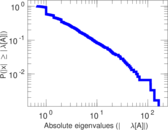
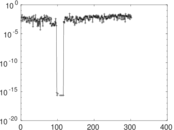
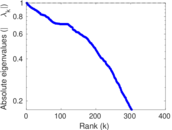
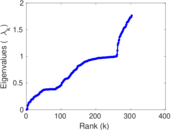
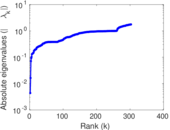
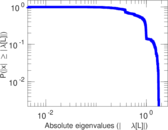
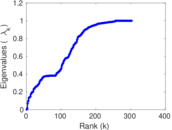
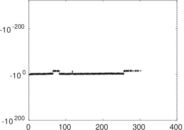
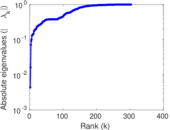
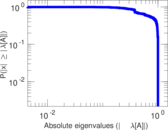
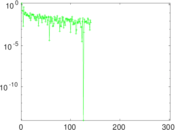
Plots


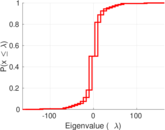
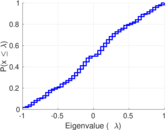
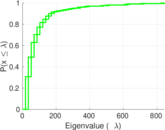


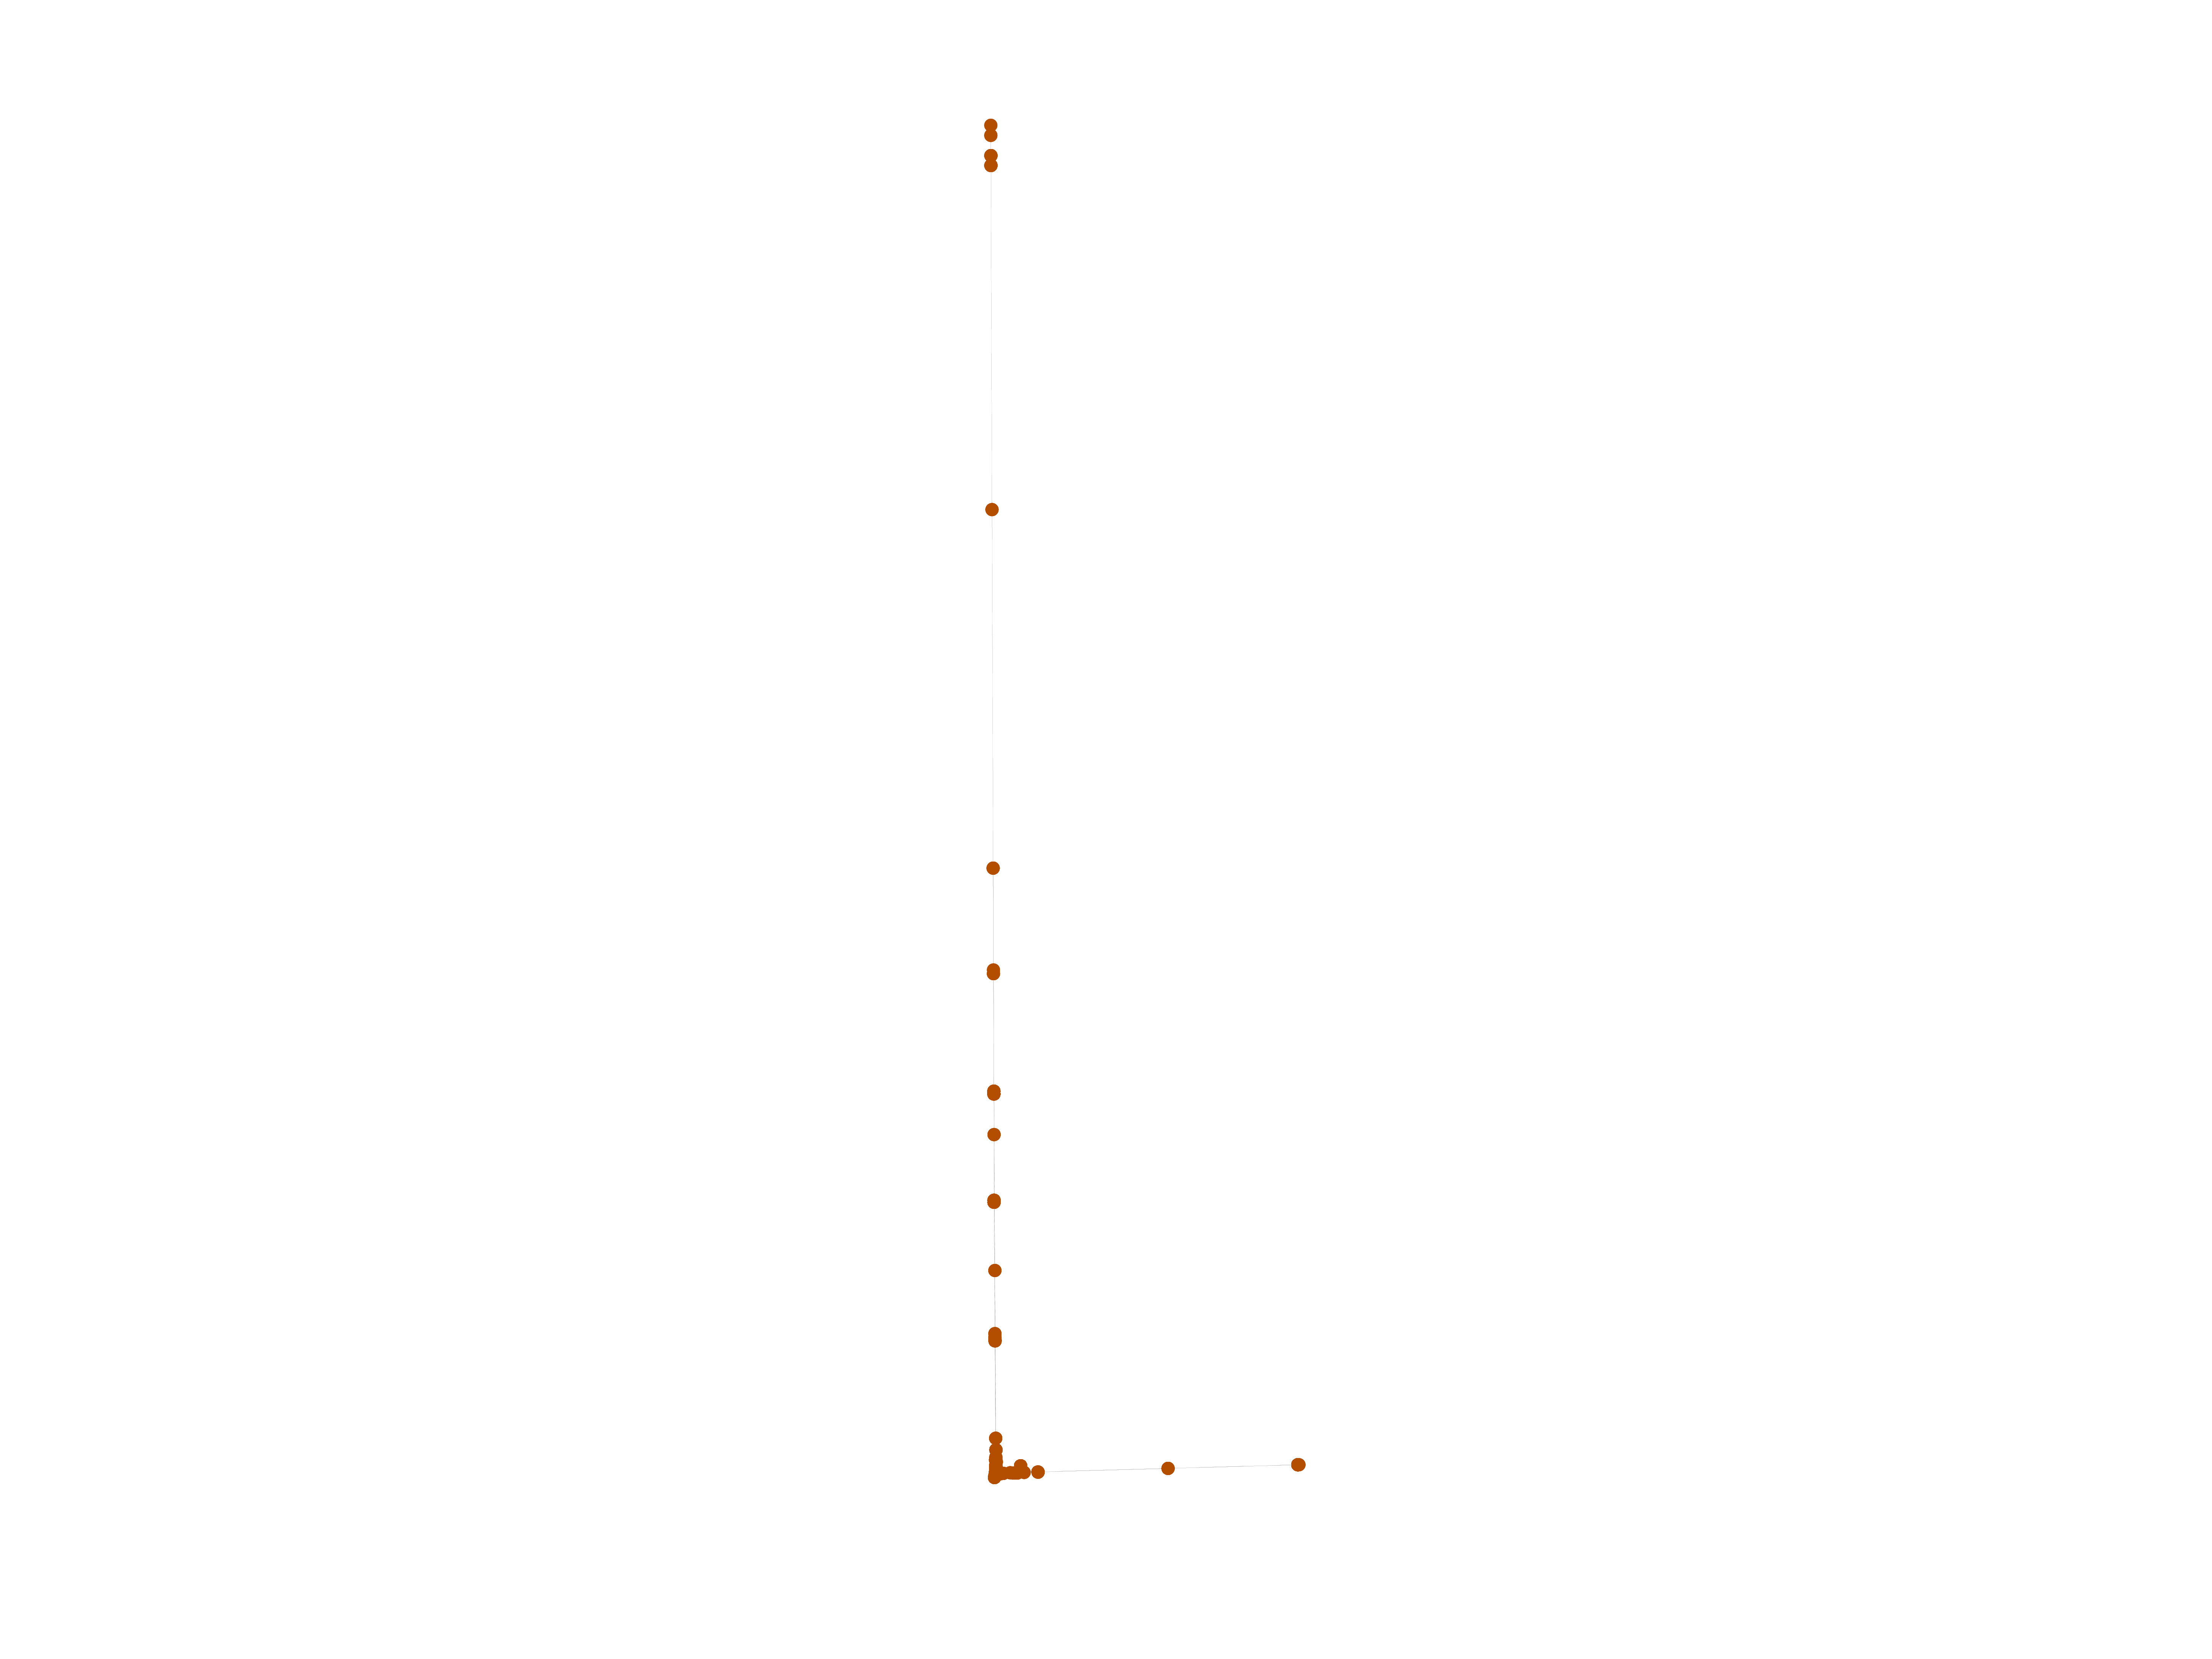
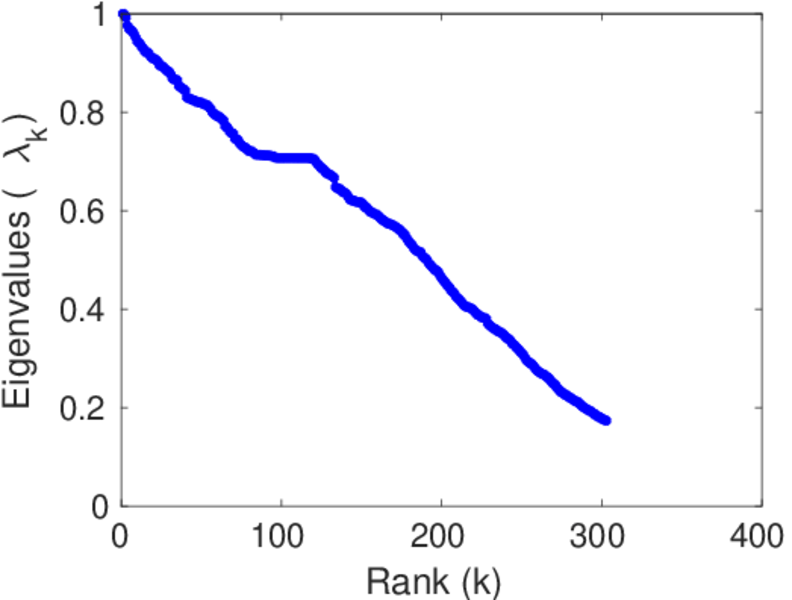
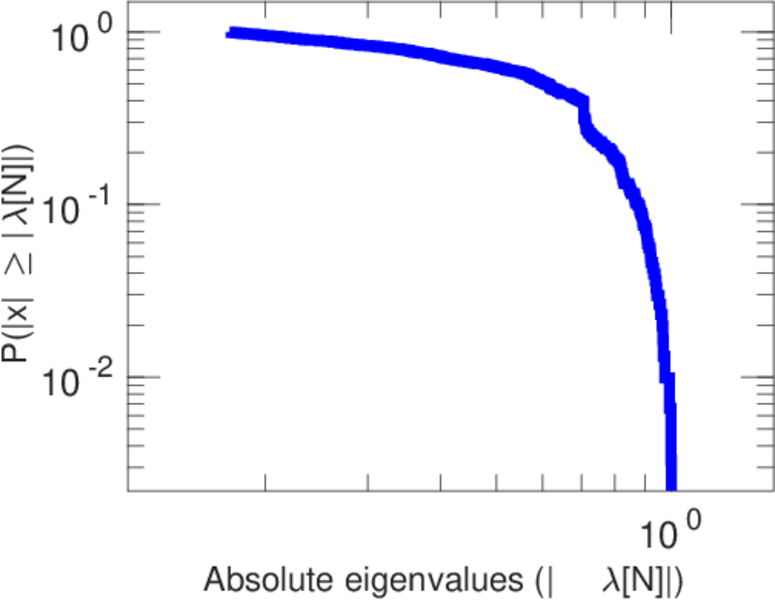
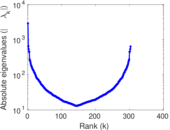
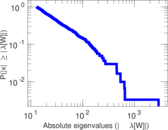
Matrix decompositions plots


Downloads
References
|
[1]
|
Jérôme Kunegis.
KONECT – The Koblenz Network Collection.
In Proc. Int. Conf. on World Wide Web Companion, pages
1343–1350, 2013.
[ http ]
|
|
[2]
|
Wikimedia Foundation.
Wikimedia downloads.
http://dumps.wikimedia.org/, January 2010.
|
 KONECT ‣ Networks ‣
Buy Me a Coffee
KONECT ‣ Networks ‣
Buy Me a Coffee