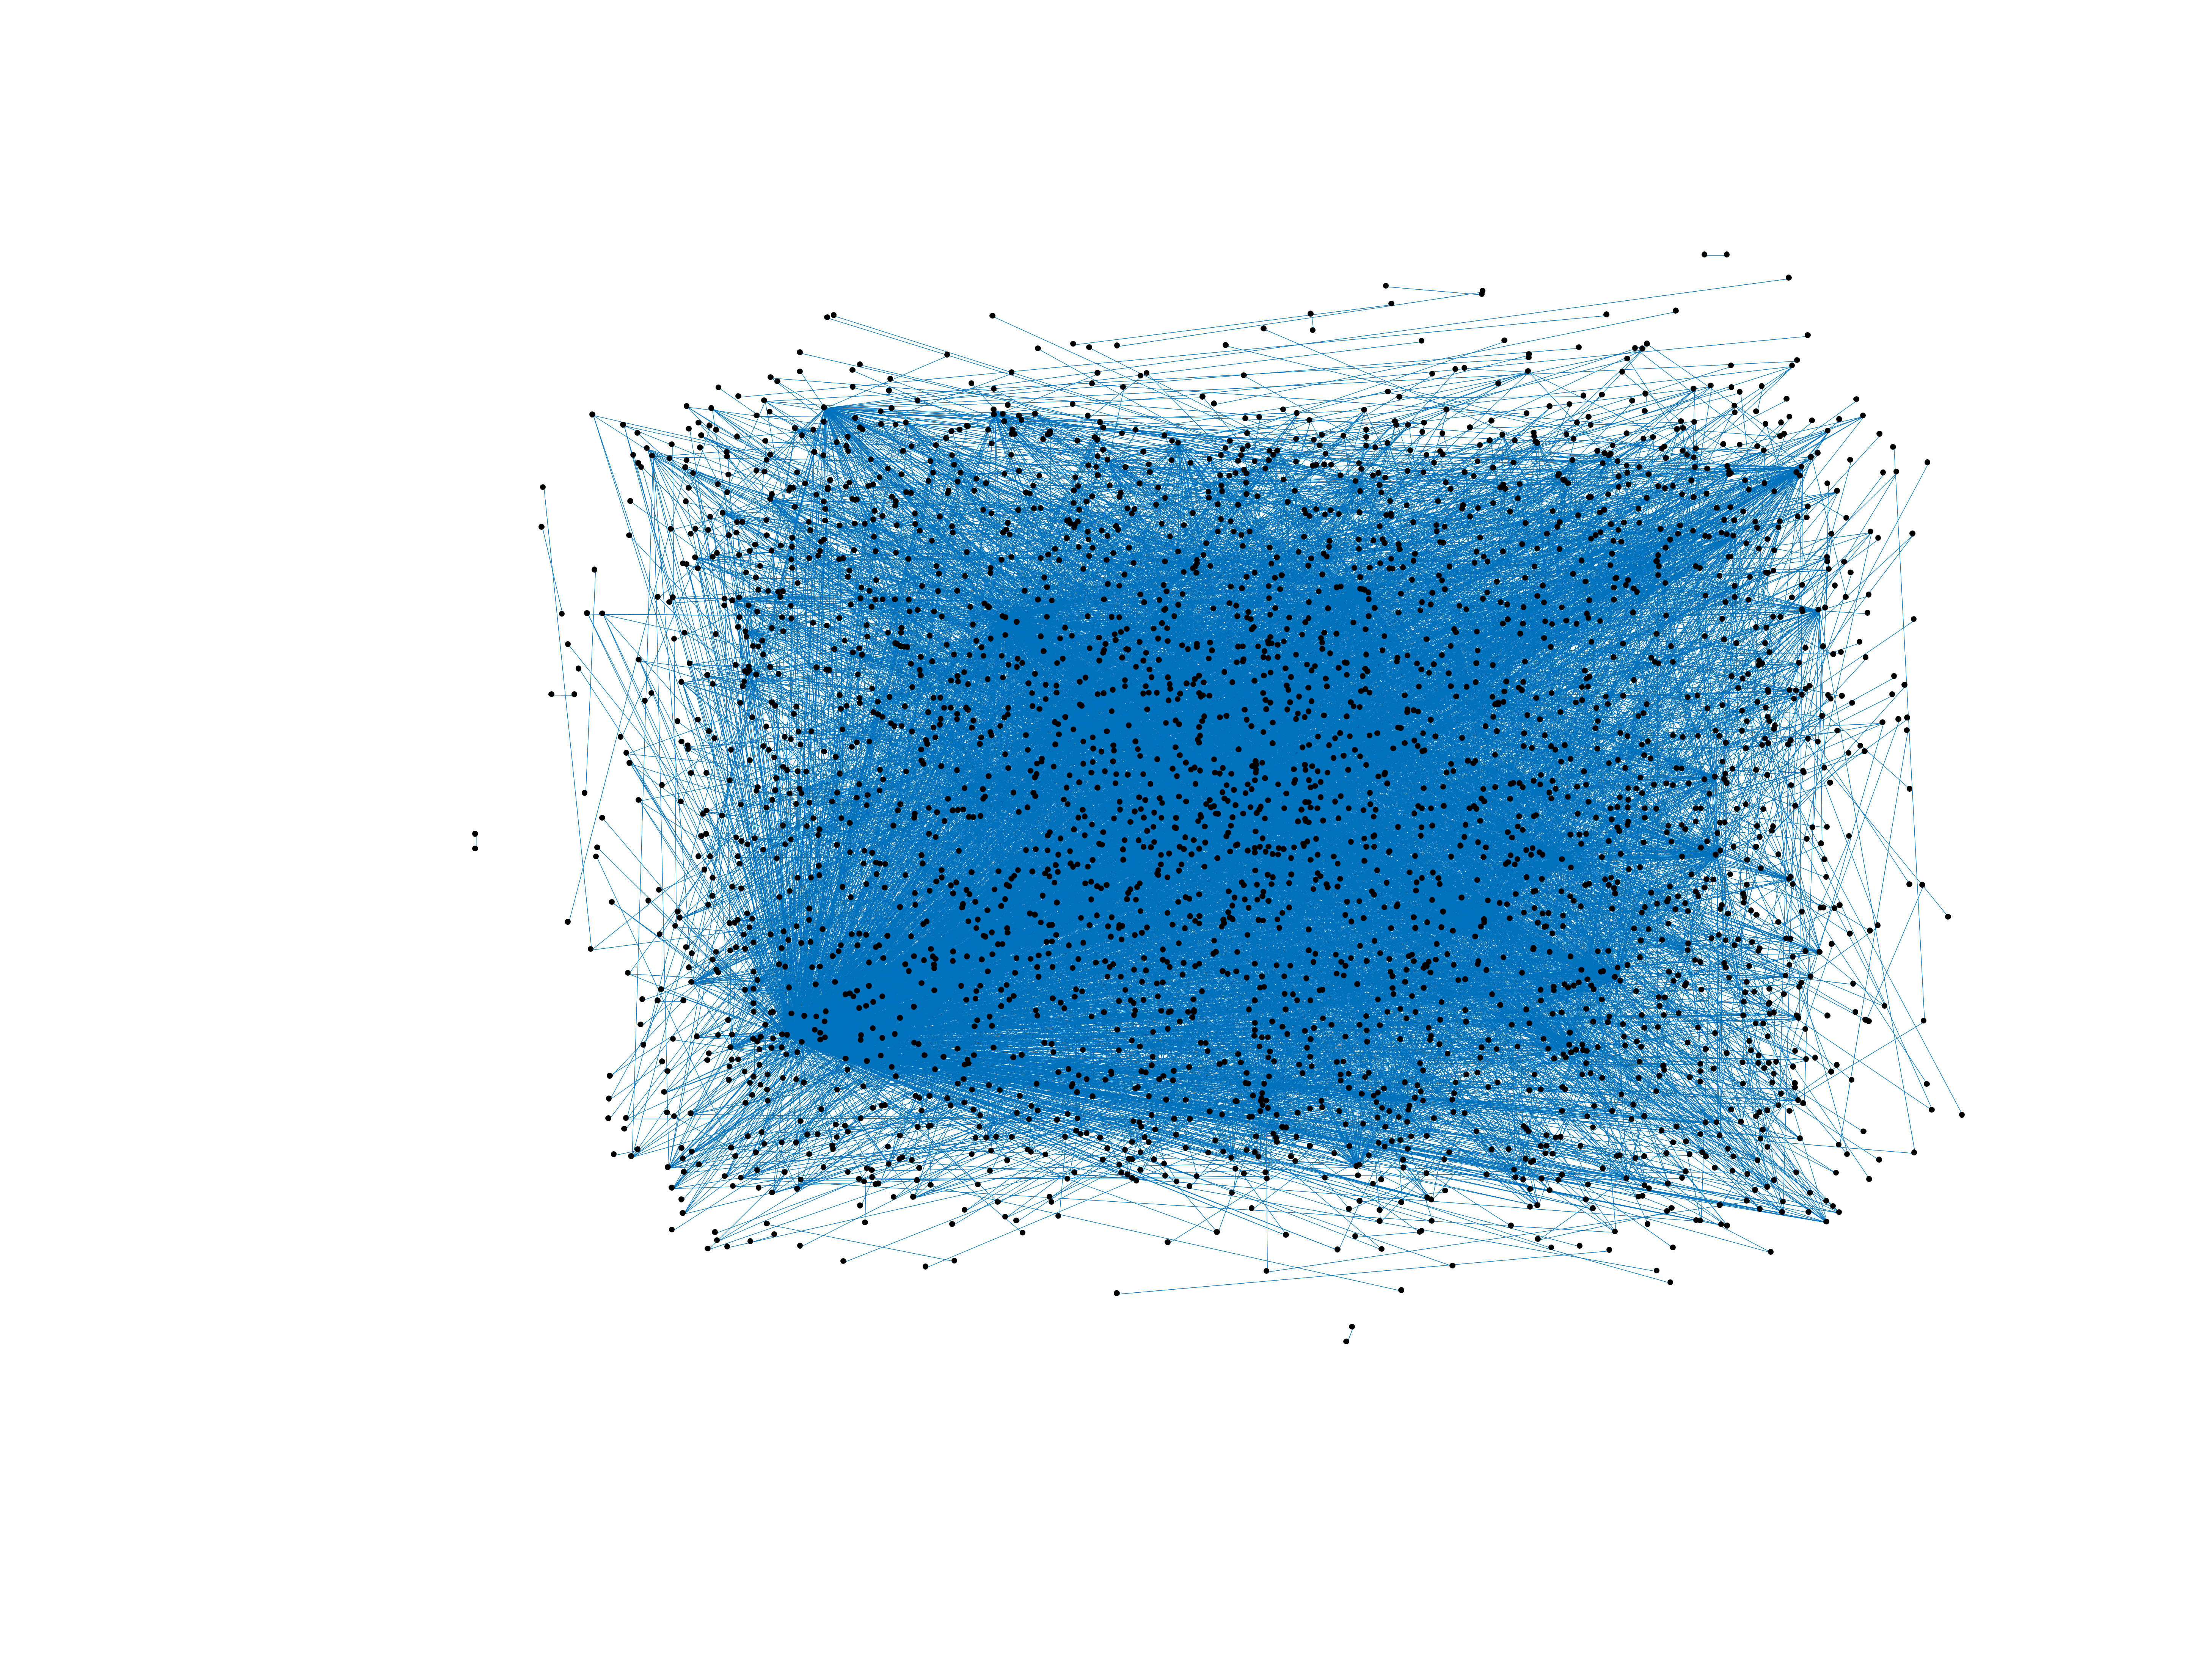
Wikipedia edits (chy)
This is the bipartite edit network of the Cheyenne Wikipedia. It contains users
and pages from the Cheyenne Wikipedia, connected by edit events. Each edge
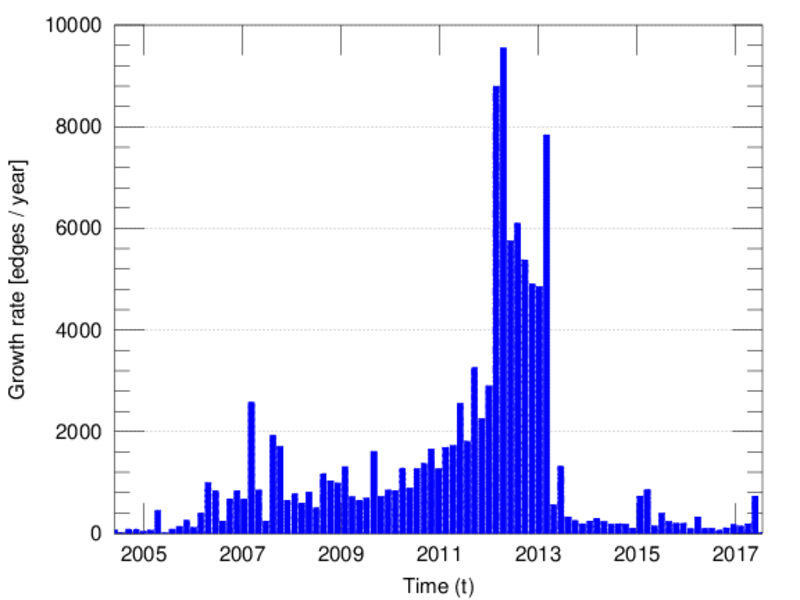
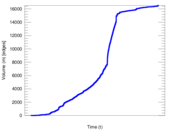
represents an edit. The dataset includes the timestamp of each edit.
Metadata
Statistics
| Size | n = | 3,229
|
| Left size | n1 = | 1,099
|
| Right size | n2 = | 2,130
|
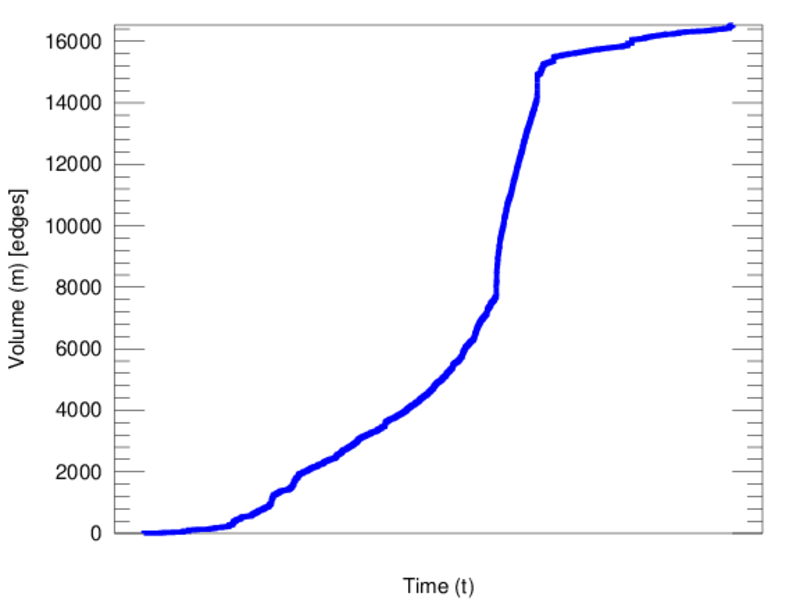
| Volume | m = | 16,528
|
| Unique edge count | m̿ = | 8,630
|
| Wedge count | s = | 988,282
|
| Claw count | z = | 157,621,348
|
| Cross count | x = | 23,535,864,936
|
| Square count | q = | 1,087,310
|
| 4-Tour count | T4 = | 12,669,320
|
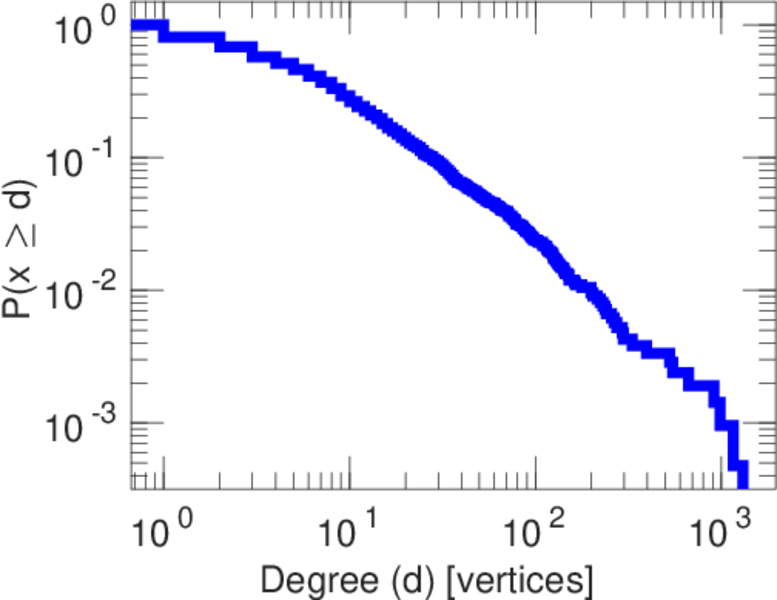
| Maximum degree | dmax = | 1,304
|
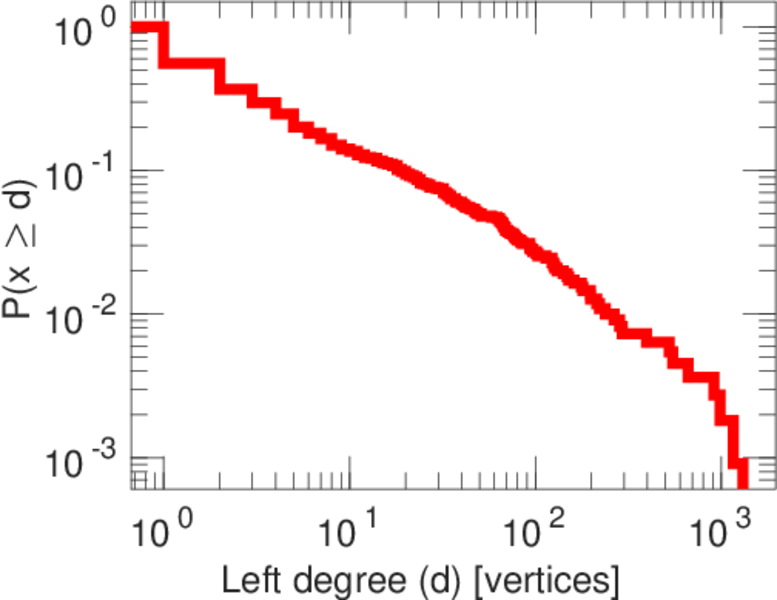
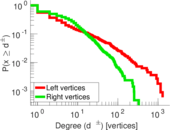
| Maximum left degree | d1max = | 1,304
|
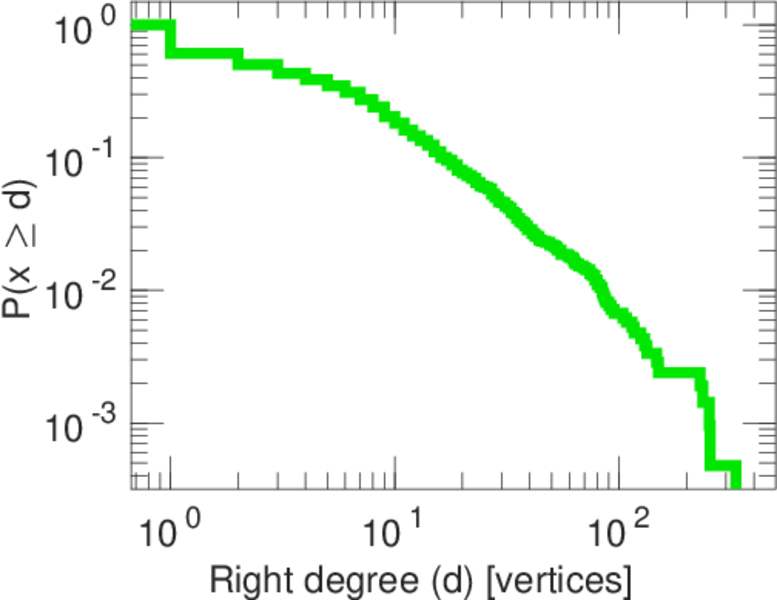
| Maximum right degree | d2max = | 332
|
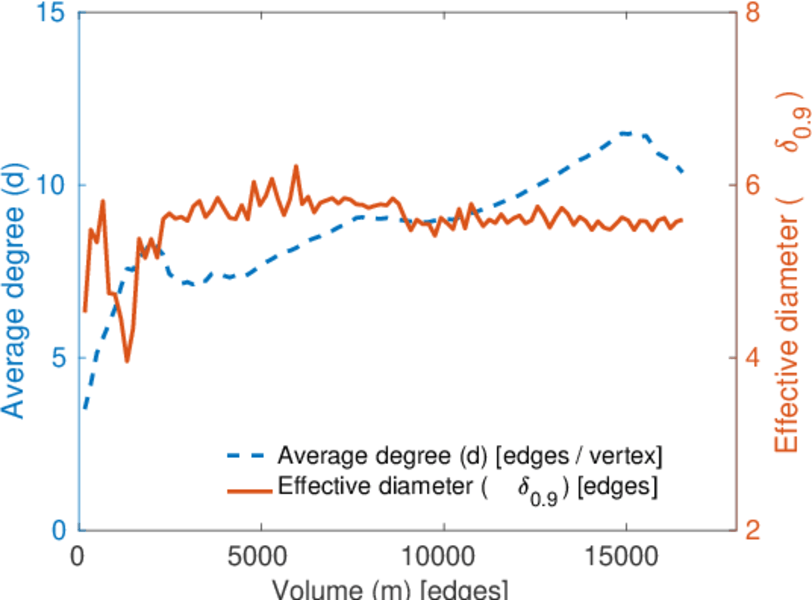
| Average degree | d = | 10.237 2
|
| Average left degree | d1 = | 15.039 1
|
| Average right degree | d2 = | 7.759 62
|
| Fill | p = | 0.003 686 66
|
| Average edge multiplicity | m̃ = | 1.915 18
|
| Size of LCC | N = | 2,634
|
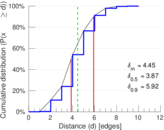
| Diameter | δ = | 12
|
| 50-Percentile effective diameter | δ0.5 = | 3.865 29
|
| 90-Percentile effective diameter | δ0.9 = | 5.915 71
|
| Median distance | δM = | 4
|
| Mean distance | δm = | 4.453 49
|
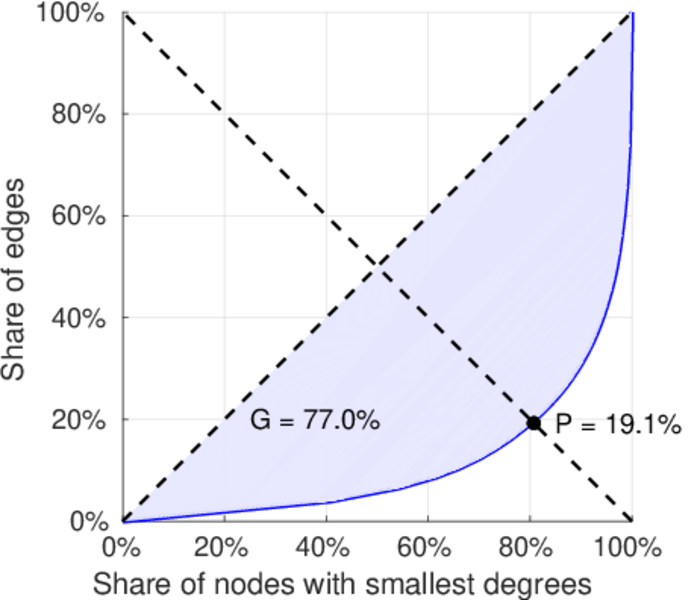
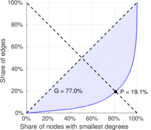
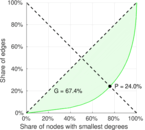
| Gini coefficient | G = | 0.737 477
|
| Balanced inequality ratio | P = | 0.214 152
|
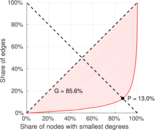
| Left balanced inequality ratio | P1 = | 0.130 022
|
| Right balanced inequality ratio | P2 = | 0.240 077
|
| Relative edge distribution entropy | Her = | 0.829 367
|
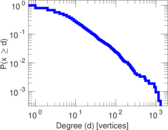
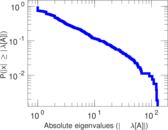
| Power law exponent | γ = | 2.244 22
|
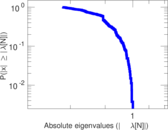
| Tail power law exponent | γt = | 2.381 00
|
| Tail power law exponent with p | γ3 = | 2.381 00
|
| p-value | p = | 0.150 000
|
| Left tail power law exponent with p | γ3,1 = | 1.891 00
|
| Left p-value | p1 = | 0.008 000 00
|
| Right tail power law exponent with p | γ3,2 = | 3.051 00
|
| Right p-value | p2 = | 0.084 000 0
|
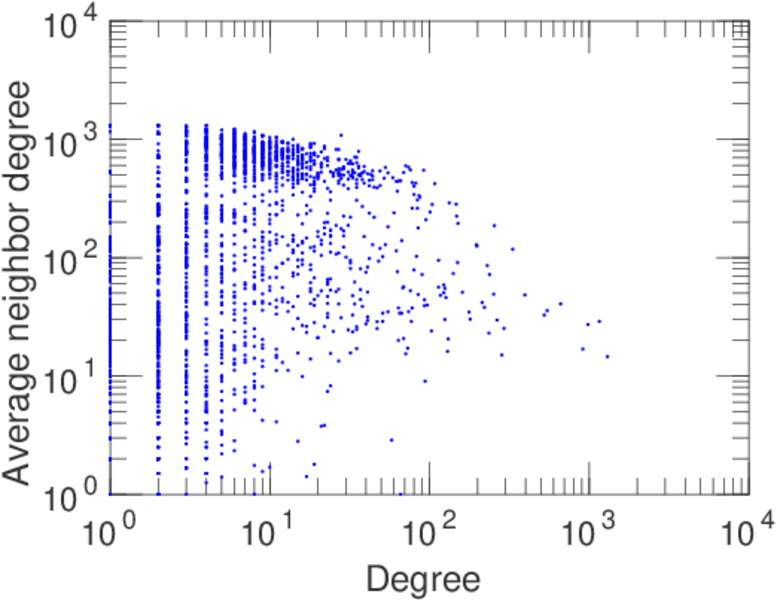
| Degree assortativity | ρ = | −0.229 984
|
| Degree assortativity p-value | pρ = | 5.718 05 × 10−104
|
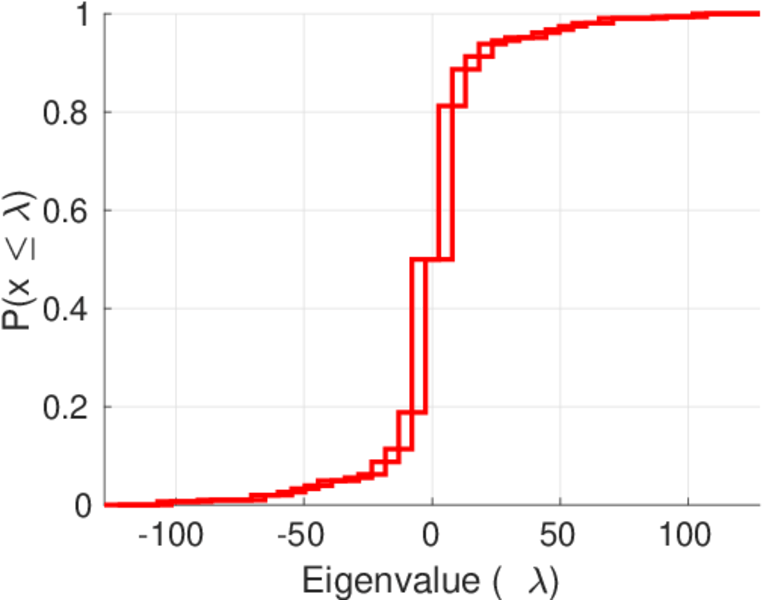
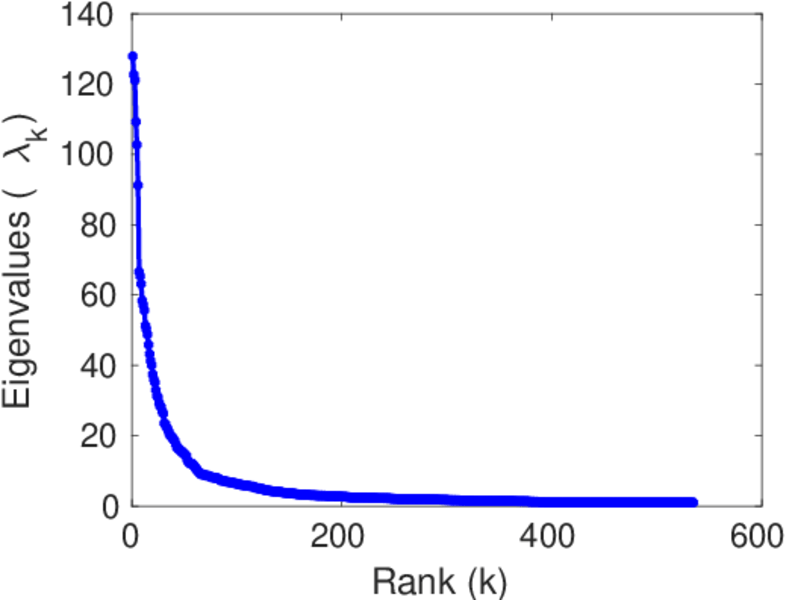
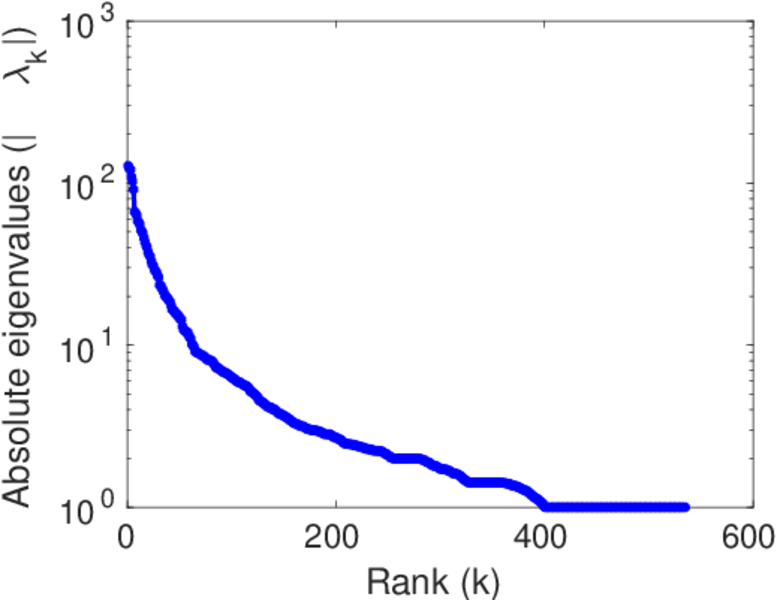
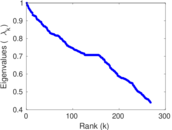
| Spectral norm | α = | 127.892
|
| Algebraic connectivity | a = | 0.029 700 2
|
| Spectral separation | |λ1[A] / λ2[A]| = | 1.042 46
|
| Controllability | C = | 1,801
|
| Relative controllability | Cr = | 0.564 577
|
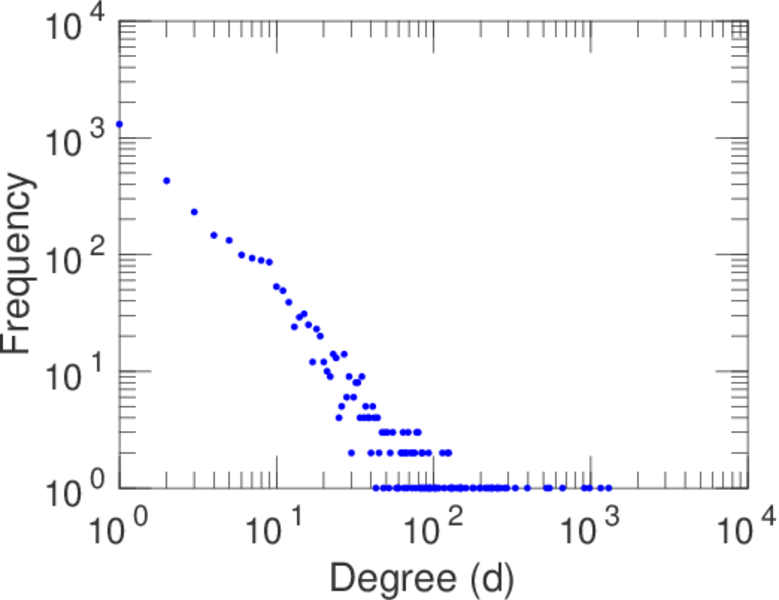
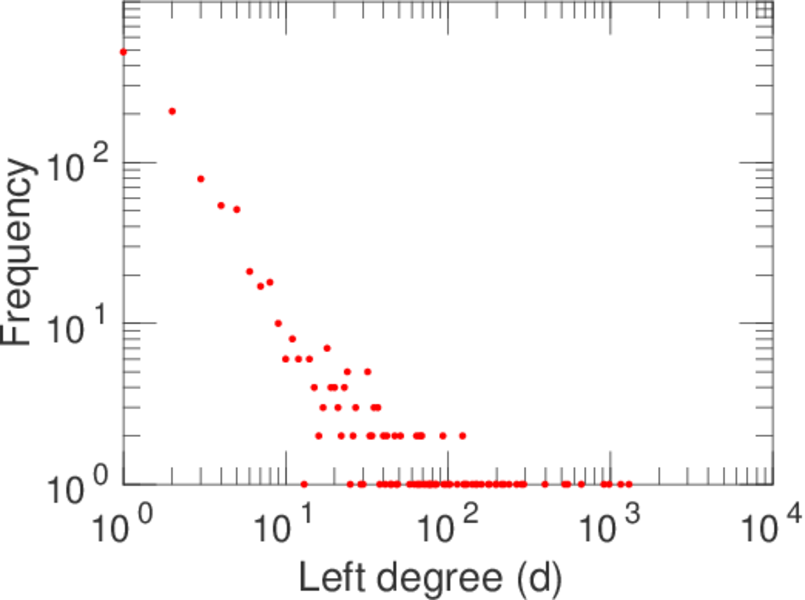
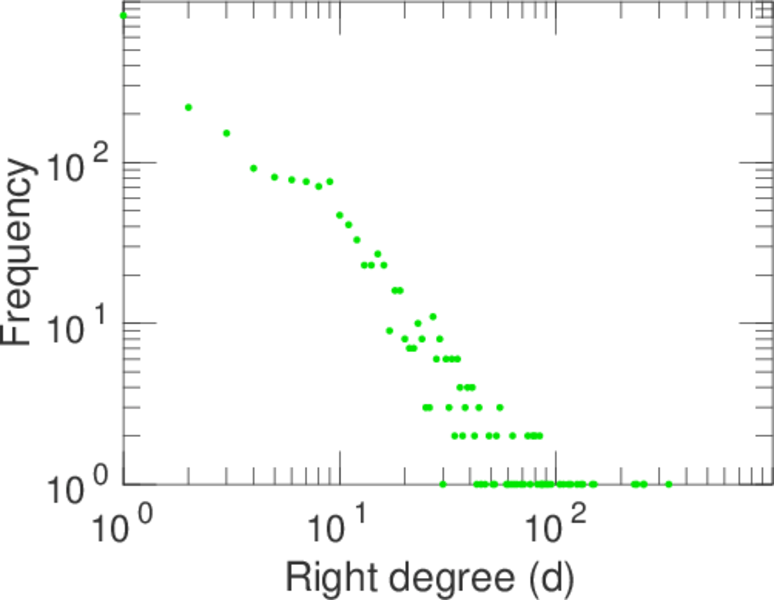
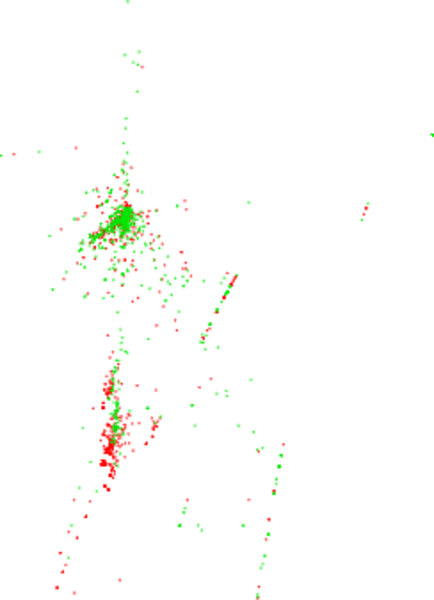
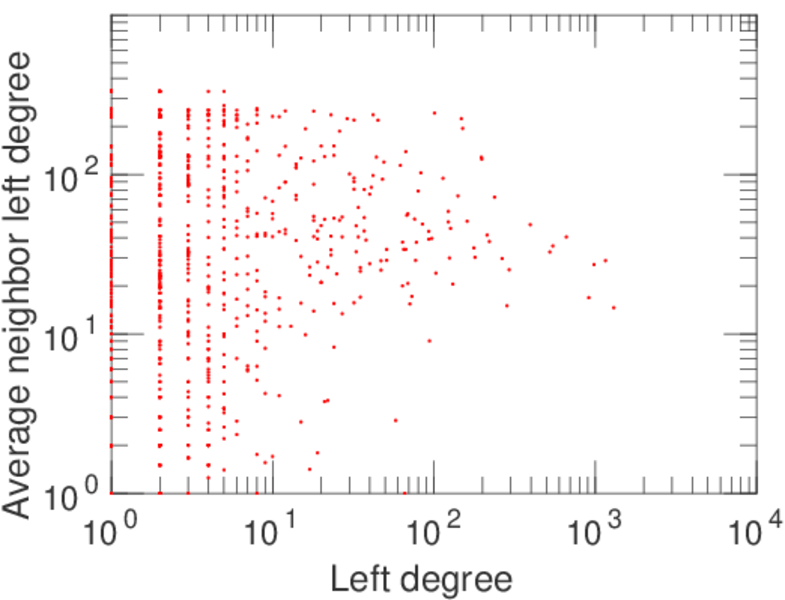
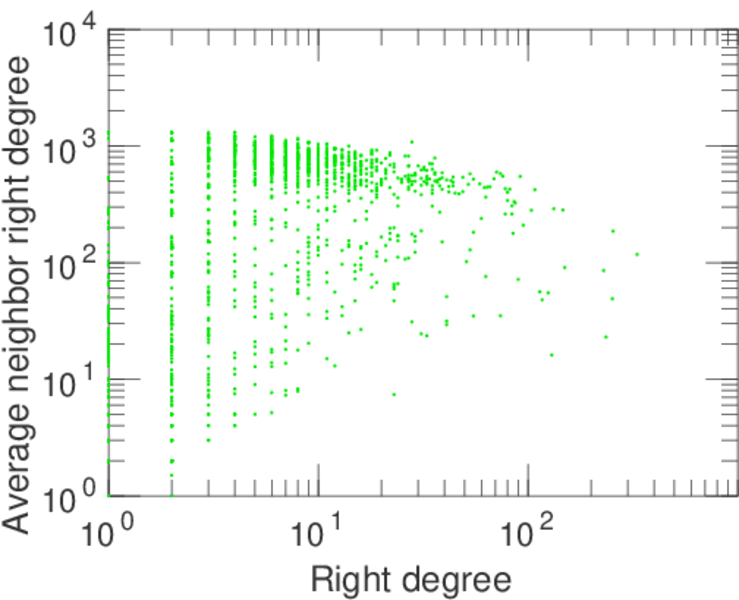
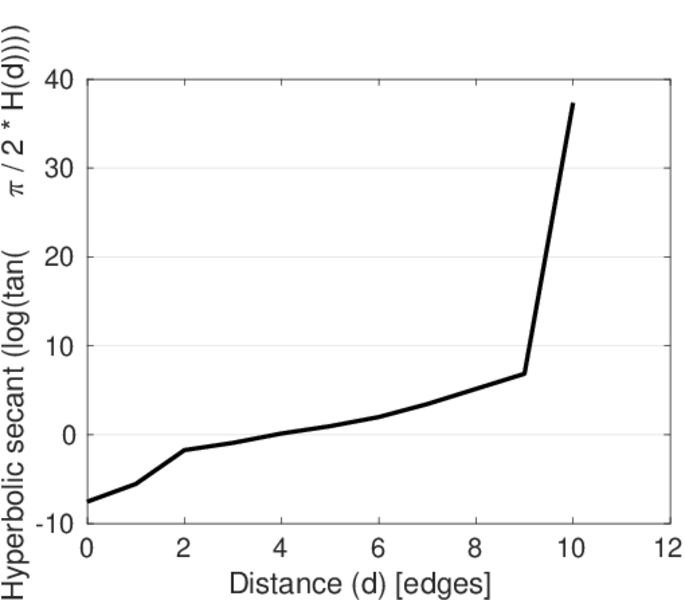
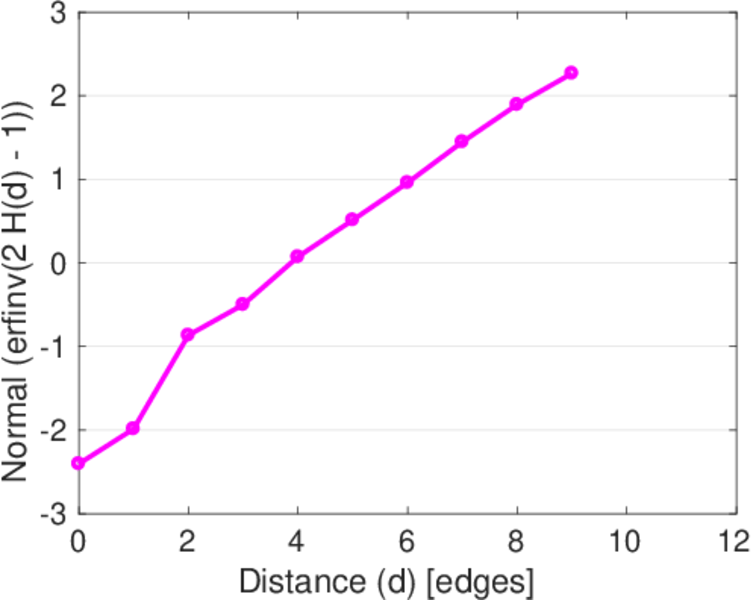
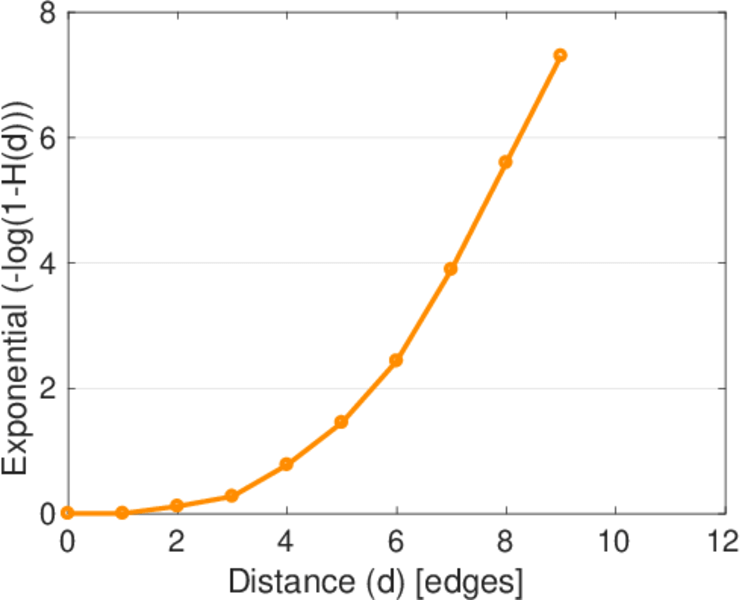
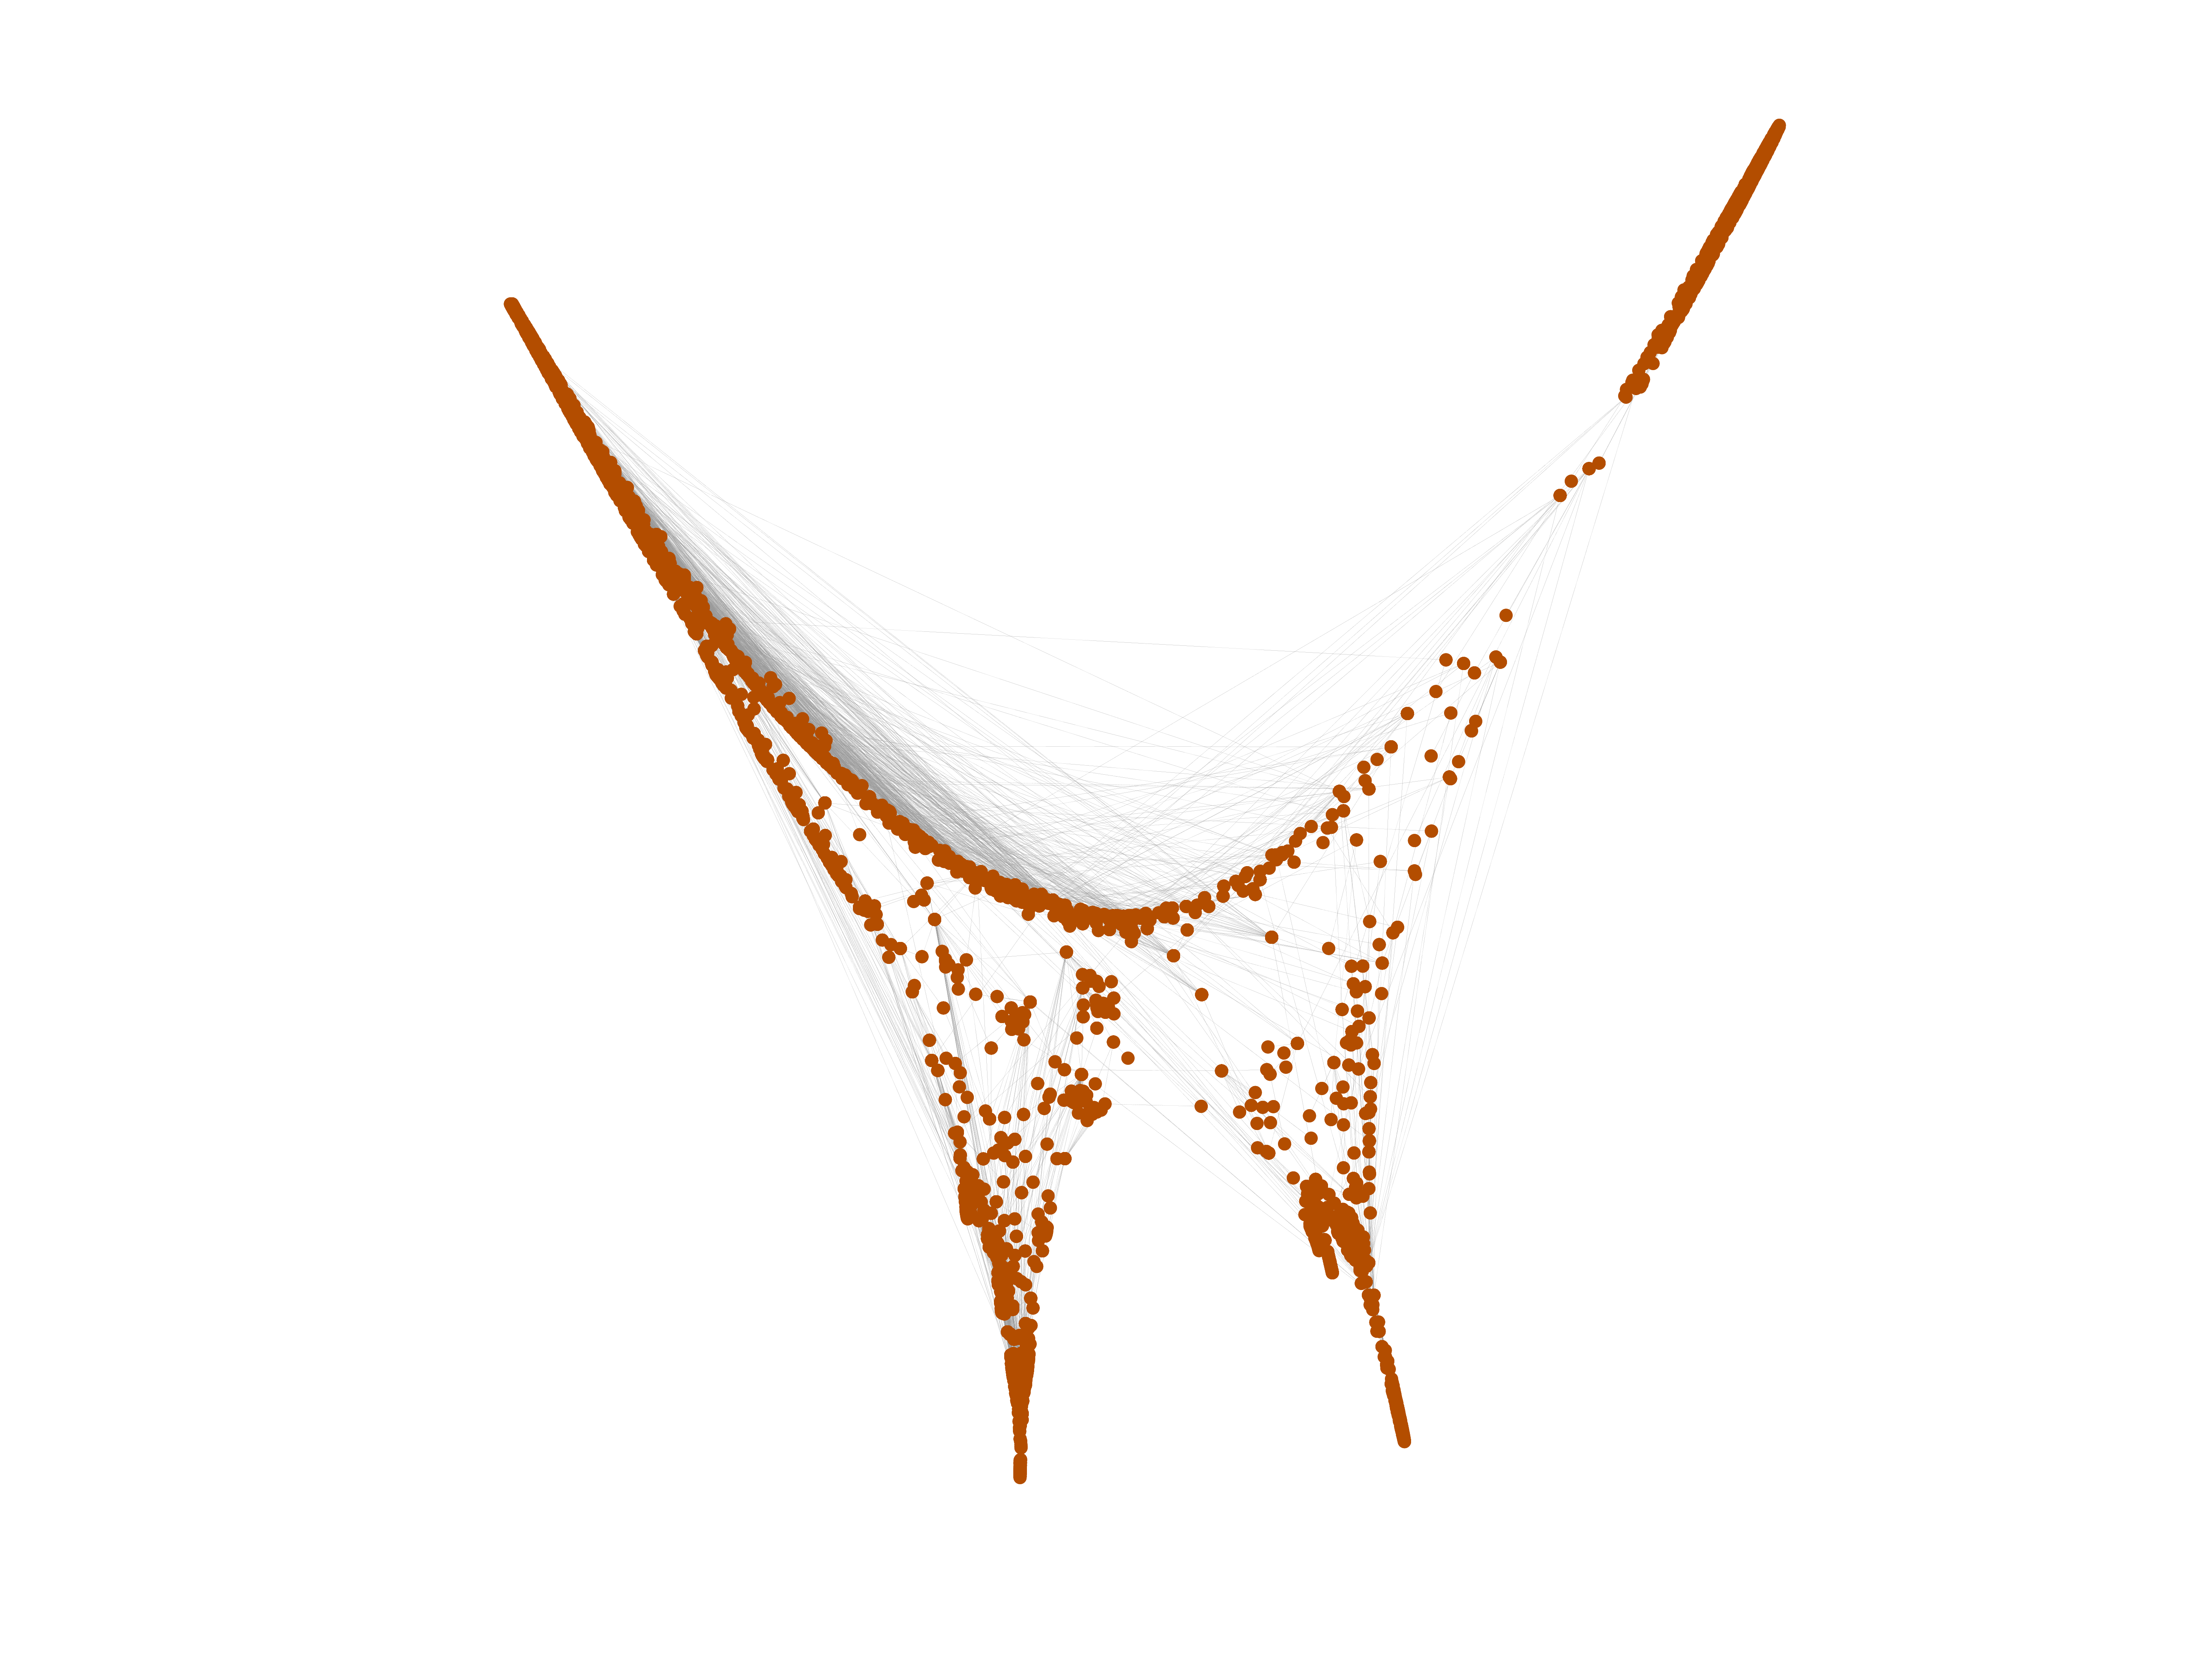
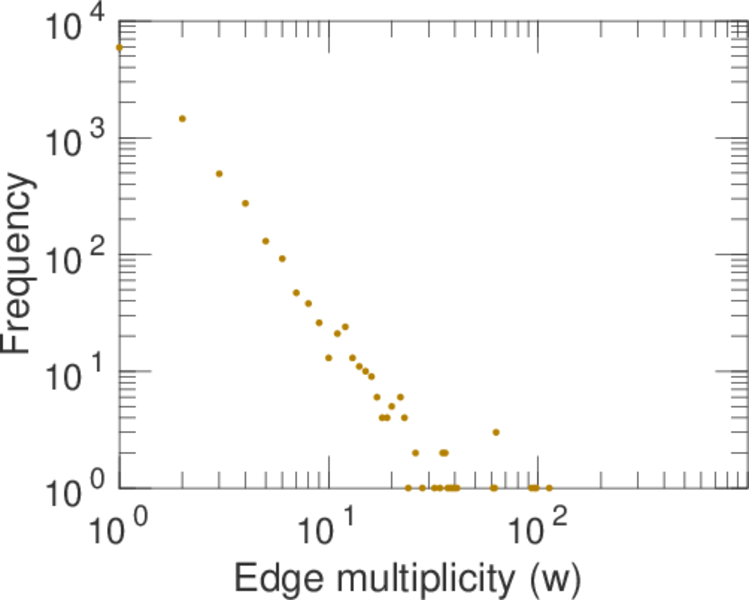
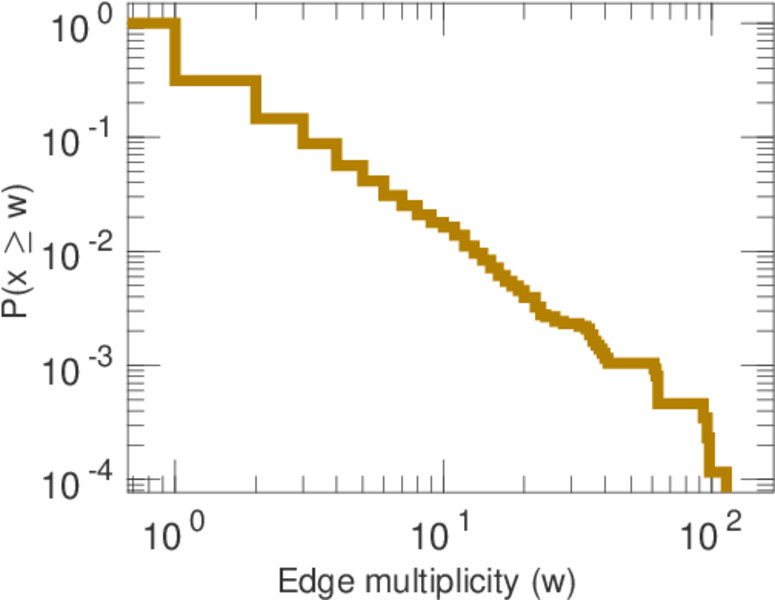
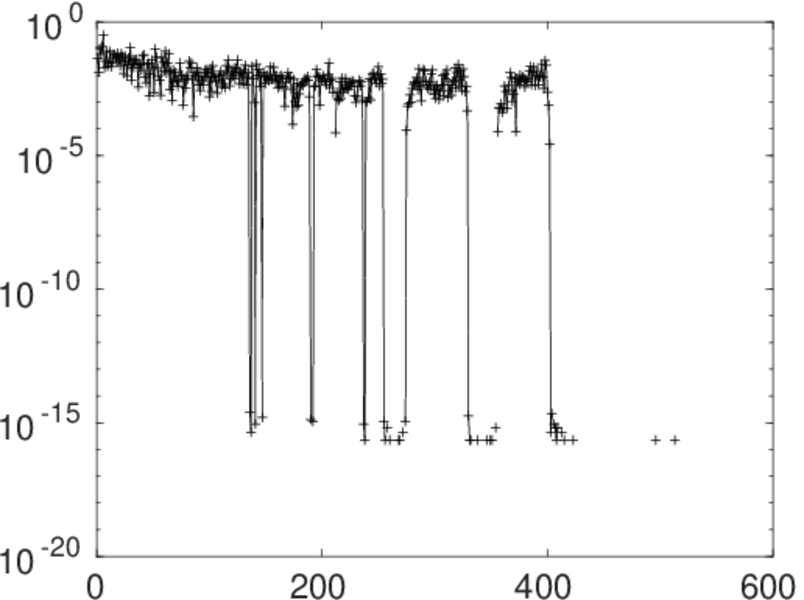
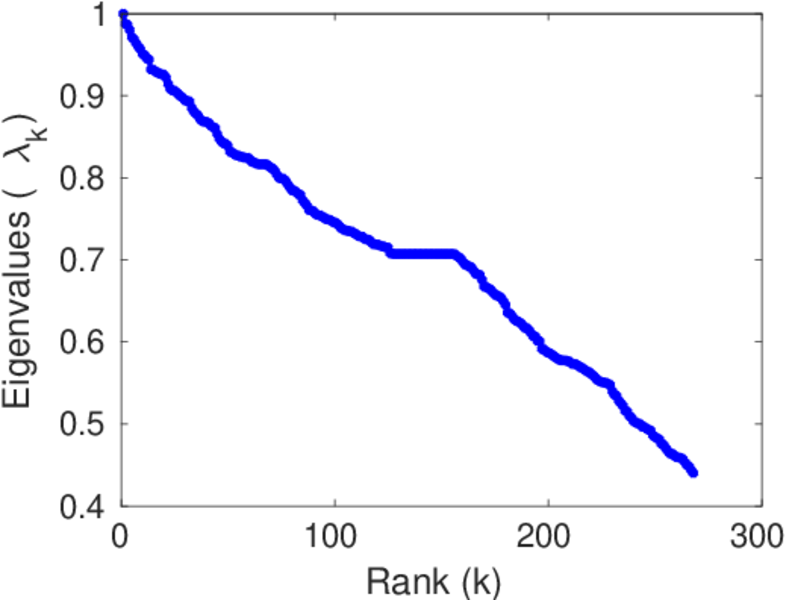
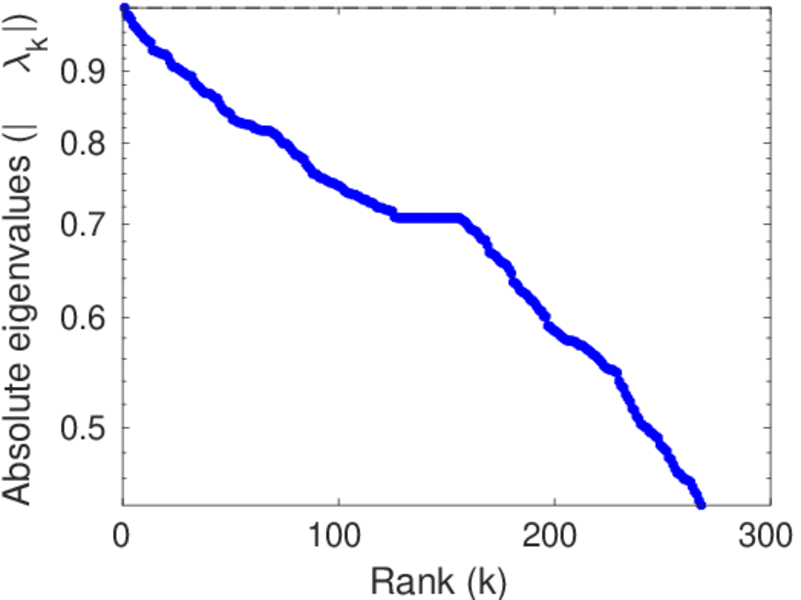
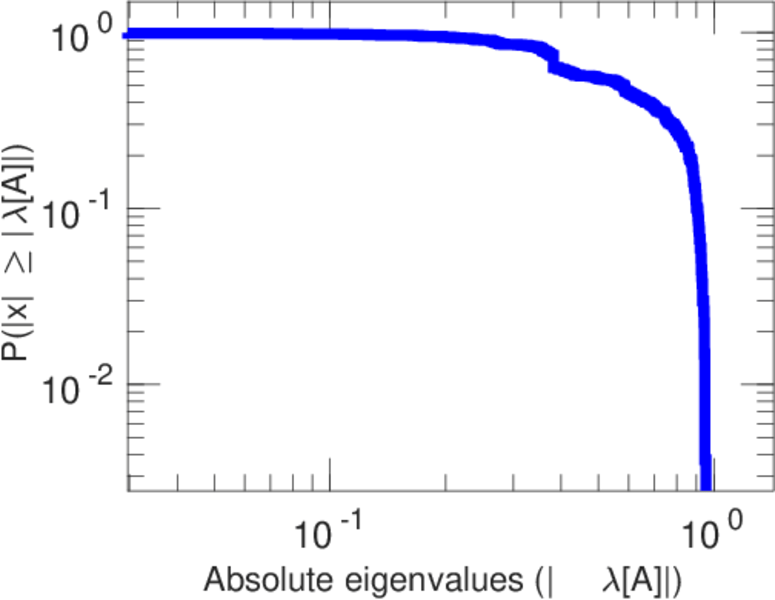
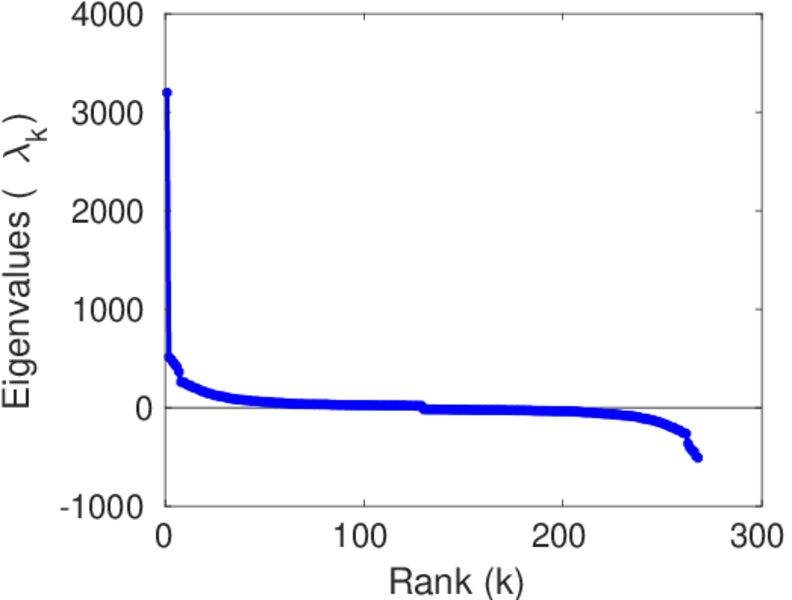
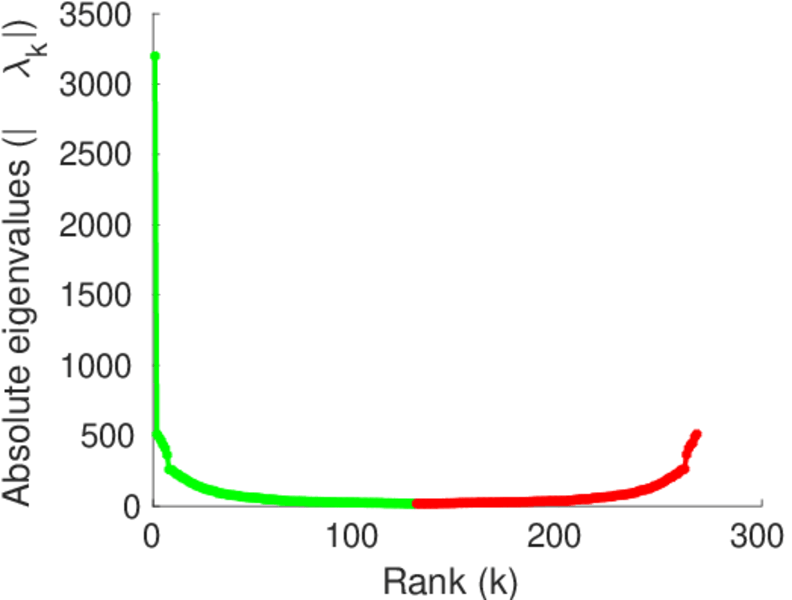
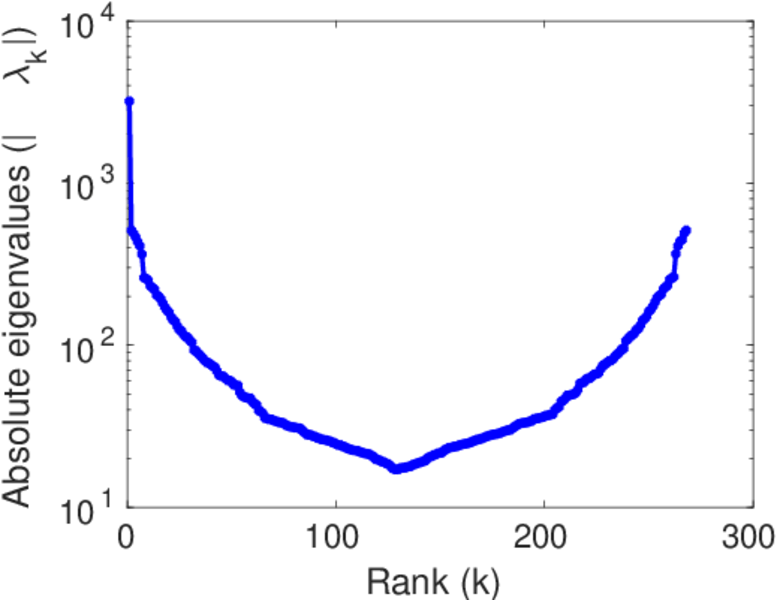
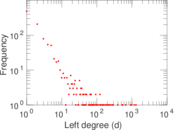
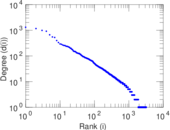
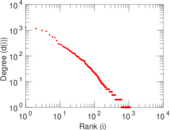
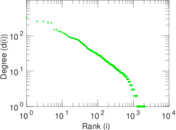
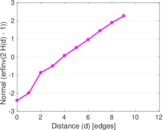
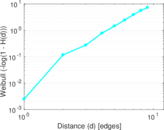
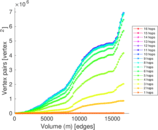
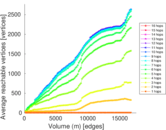
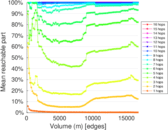
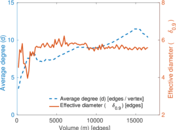
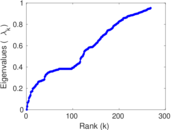
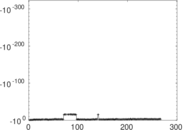
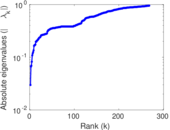
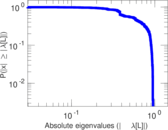
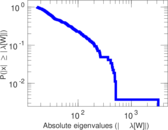
Plots


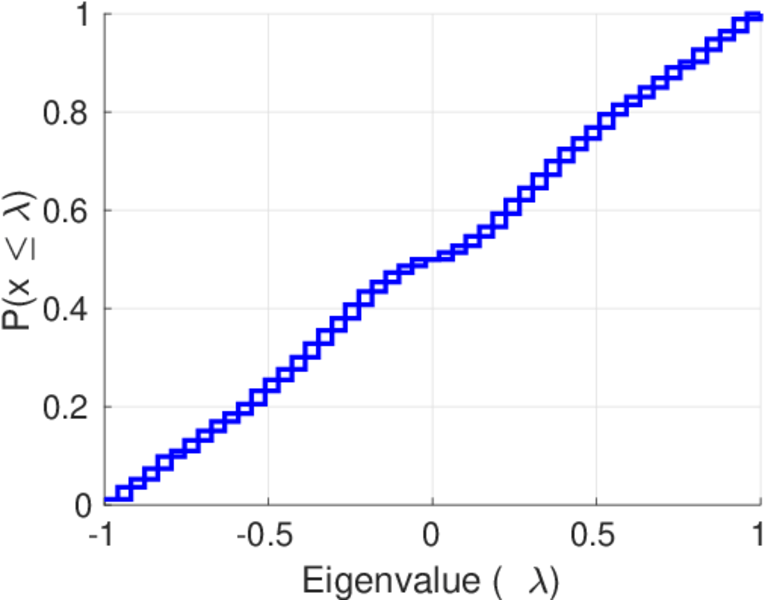
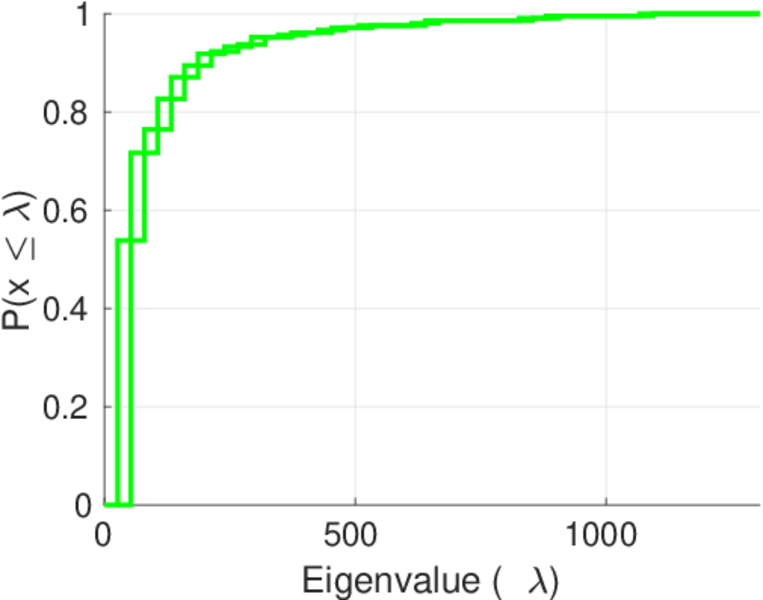
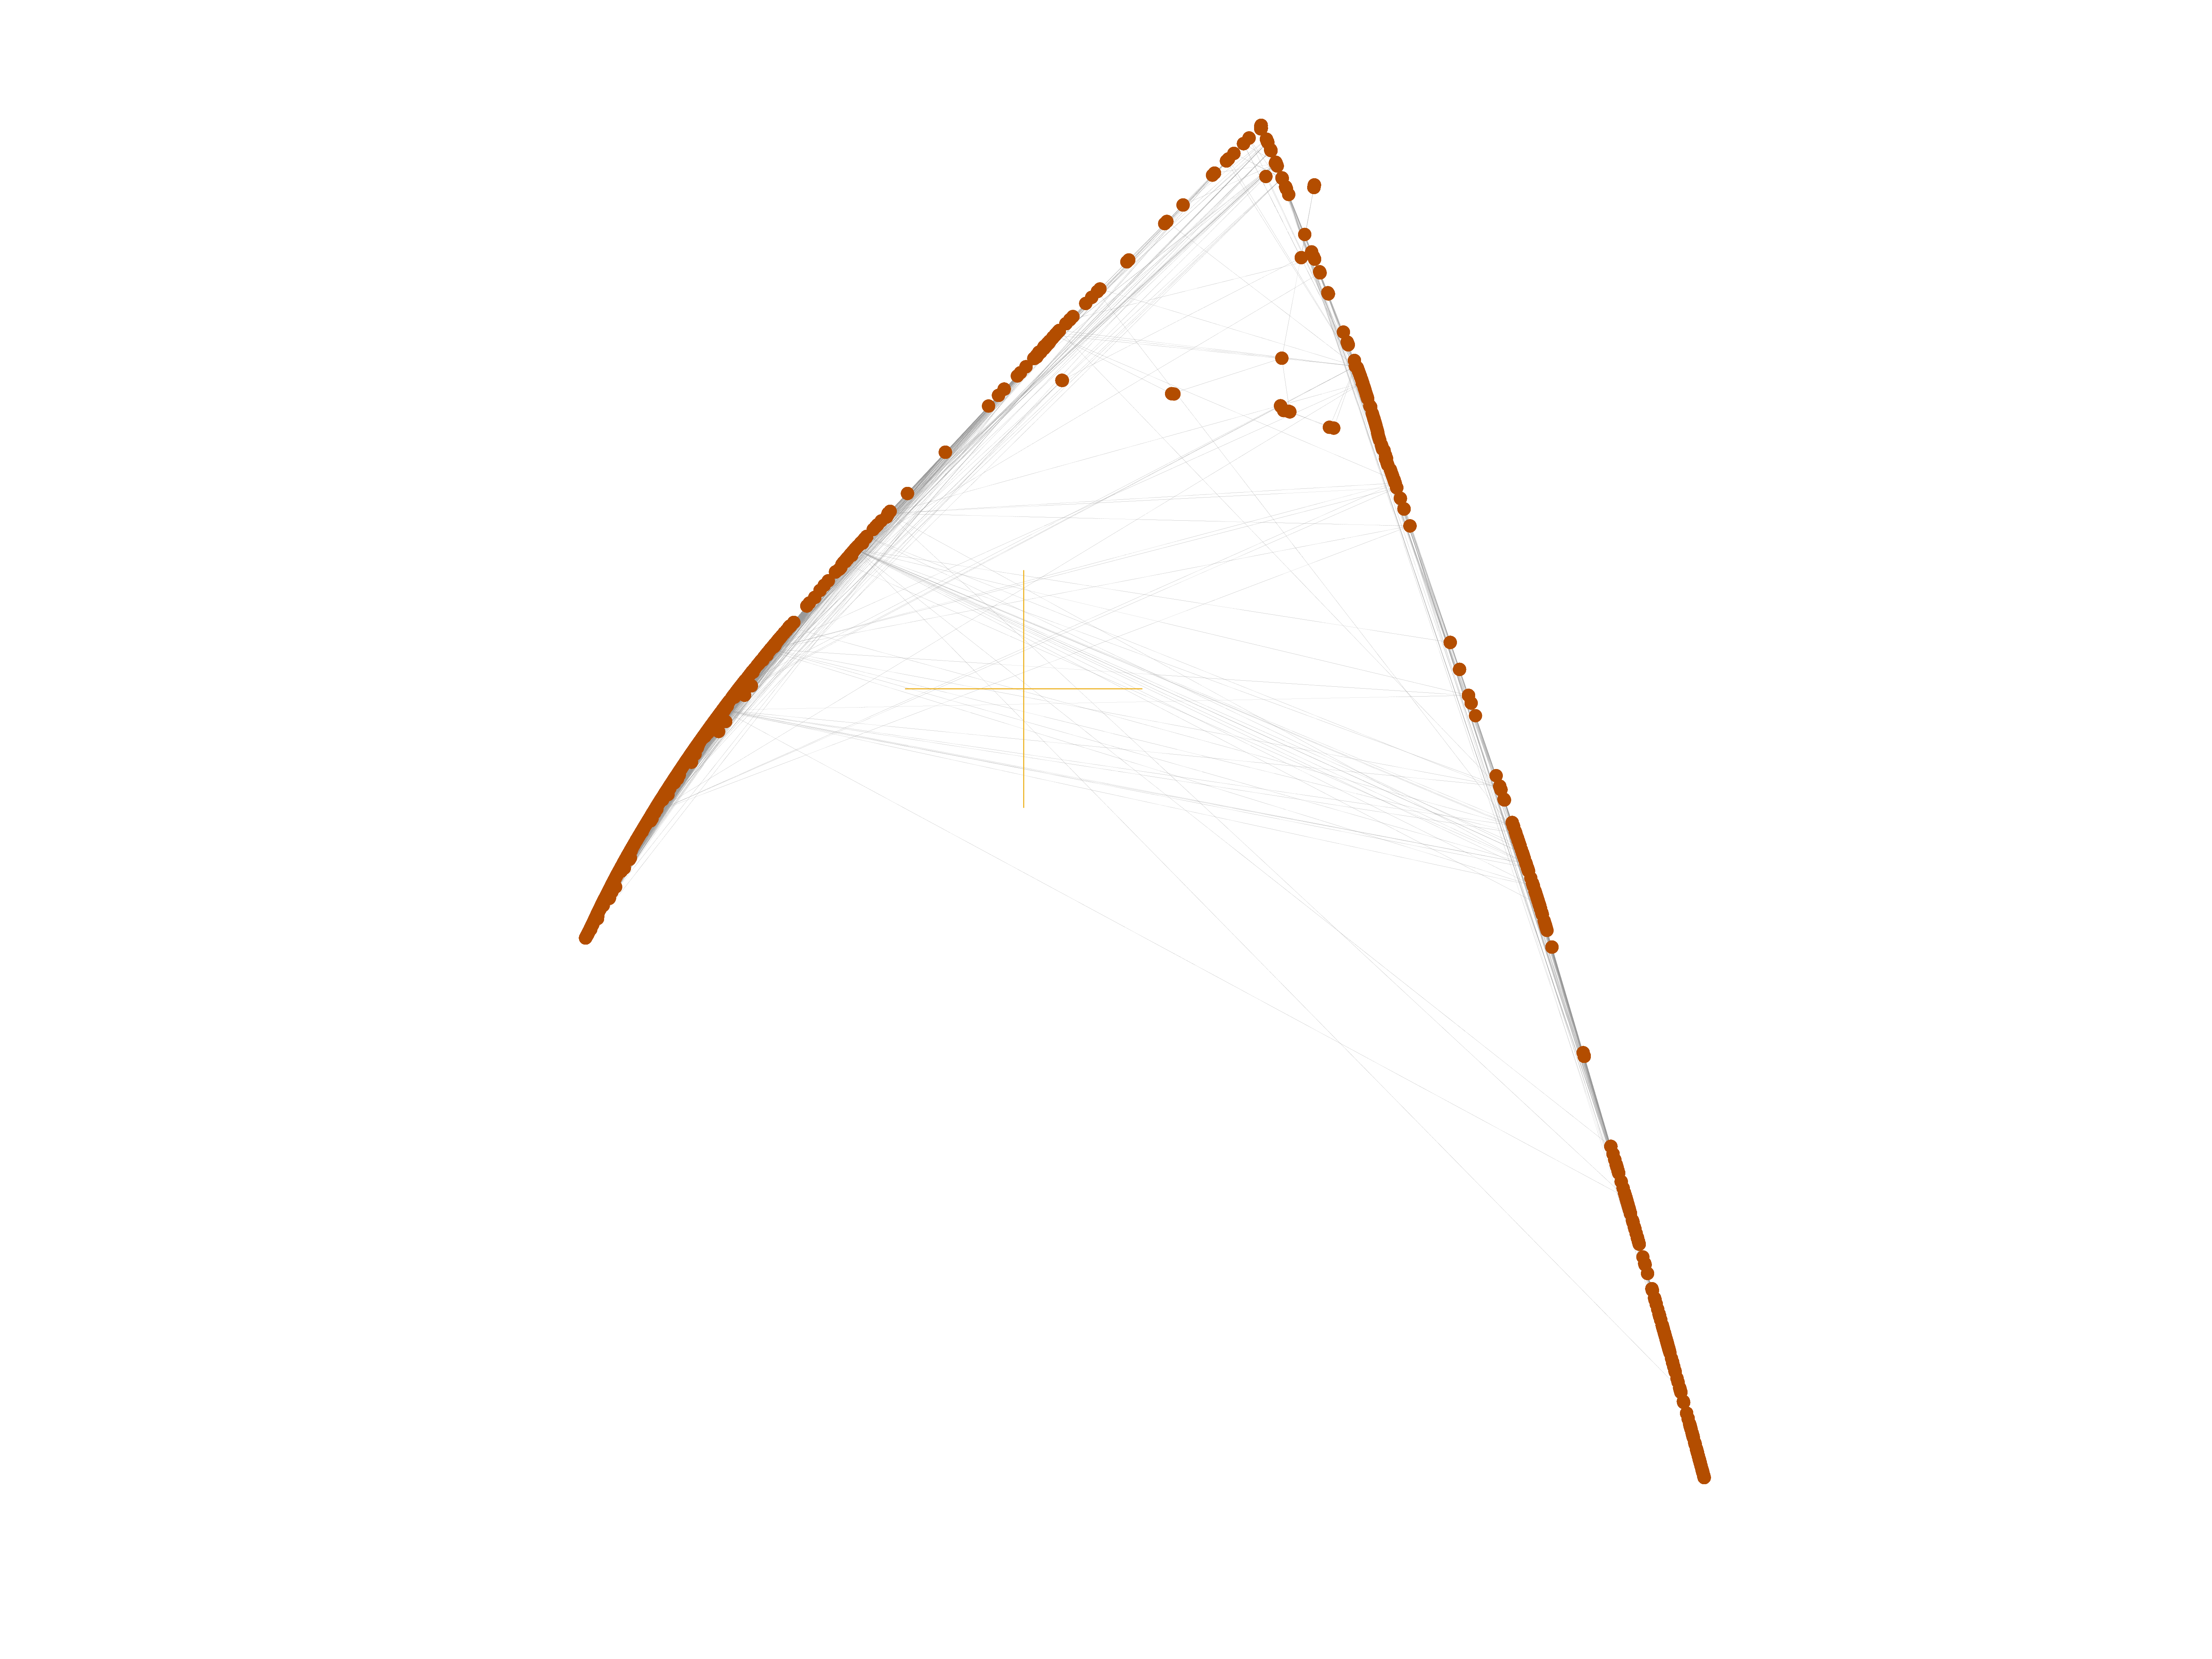
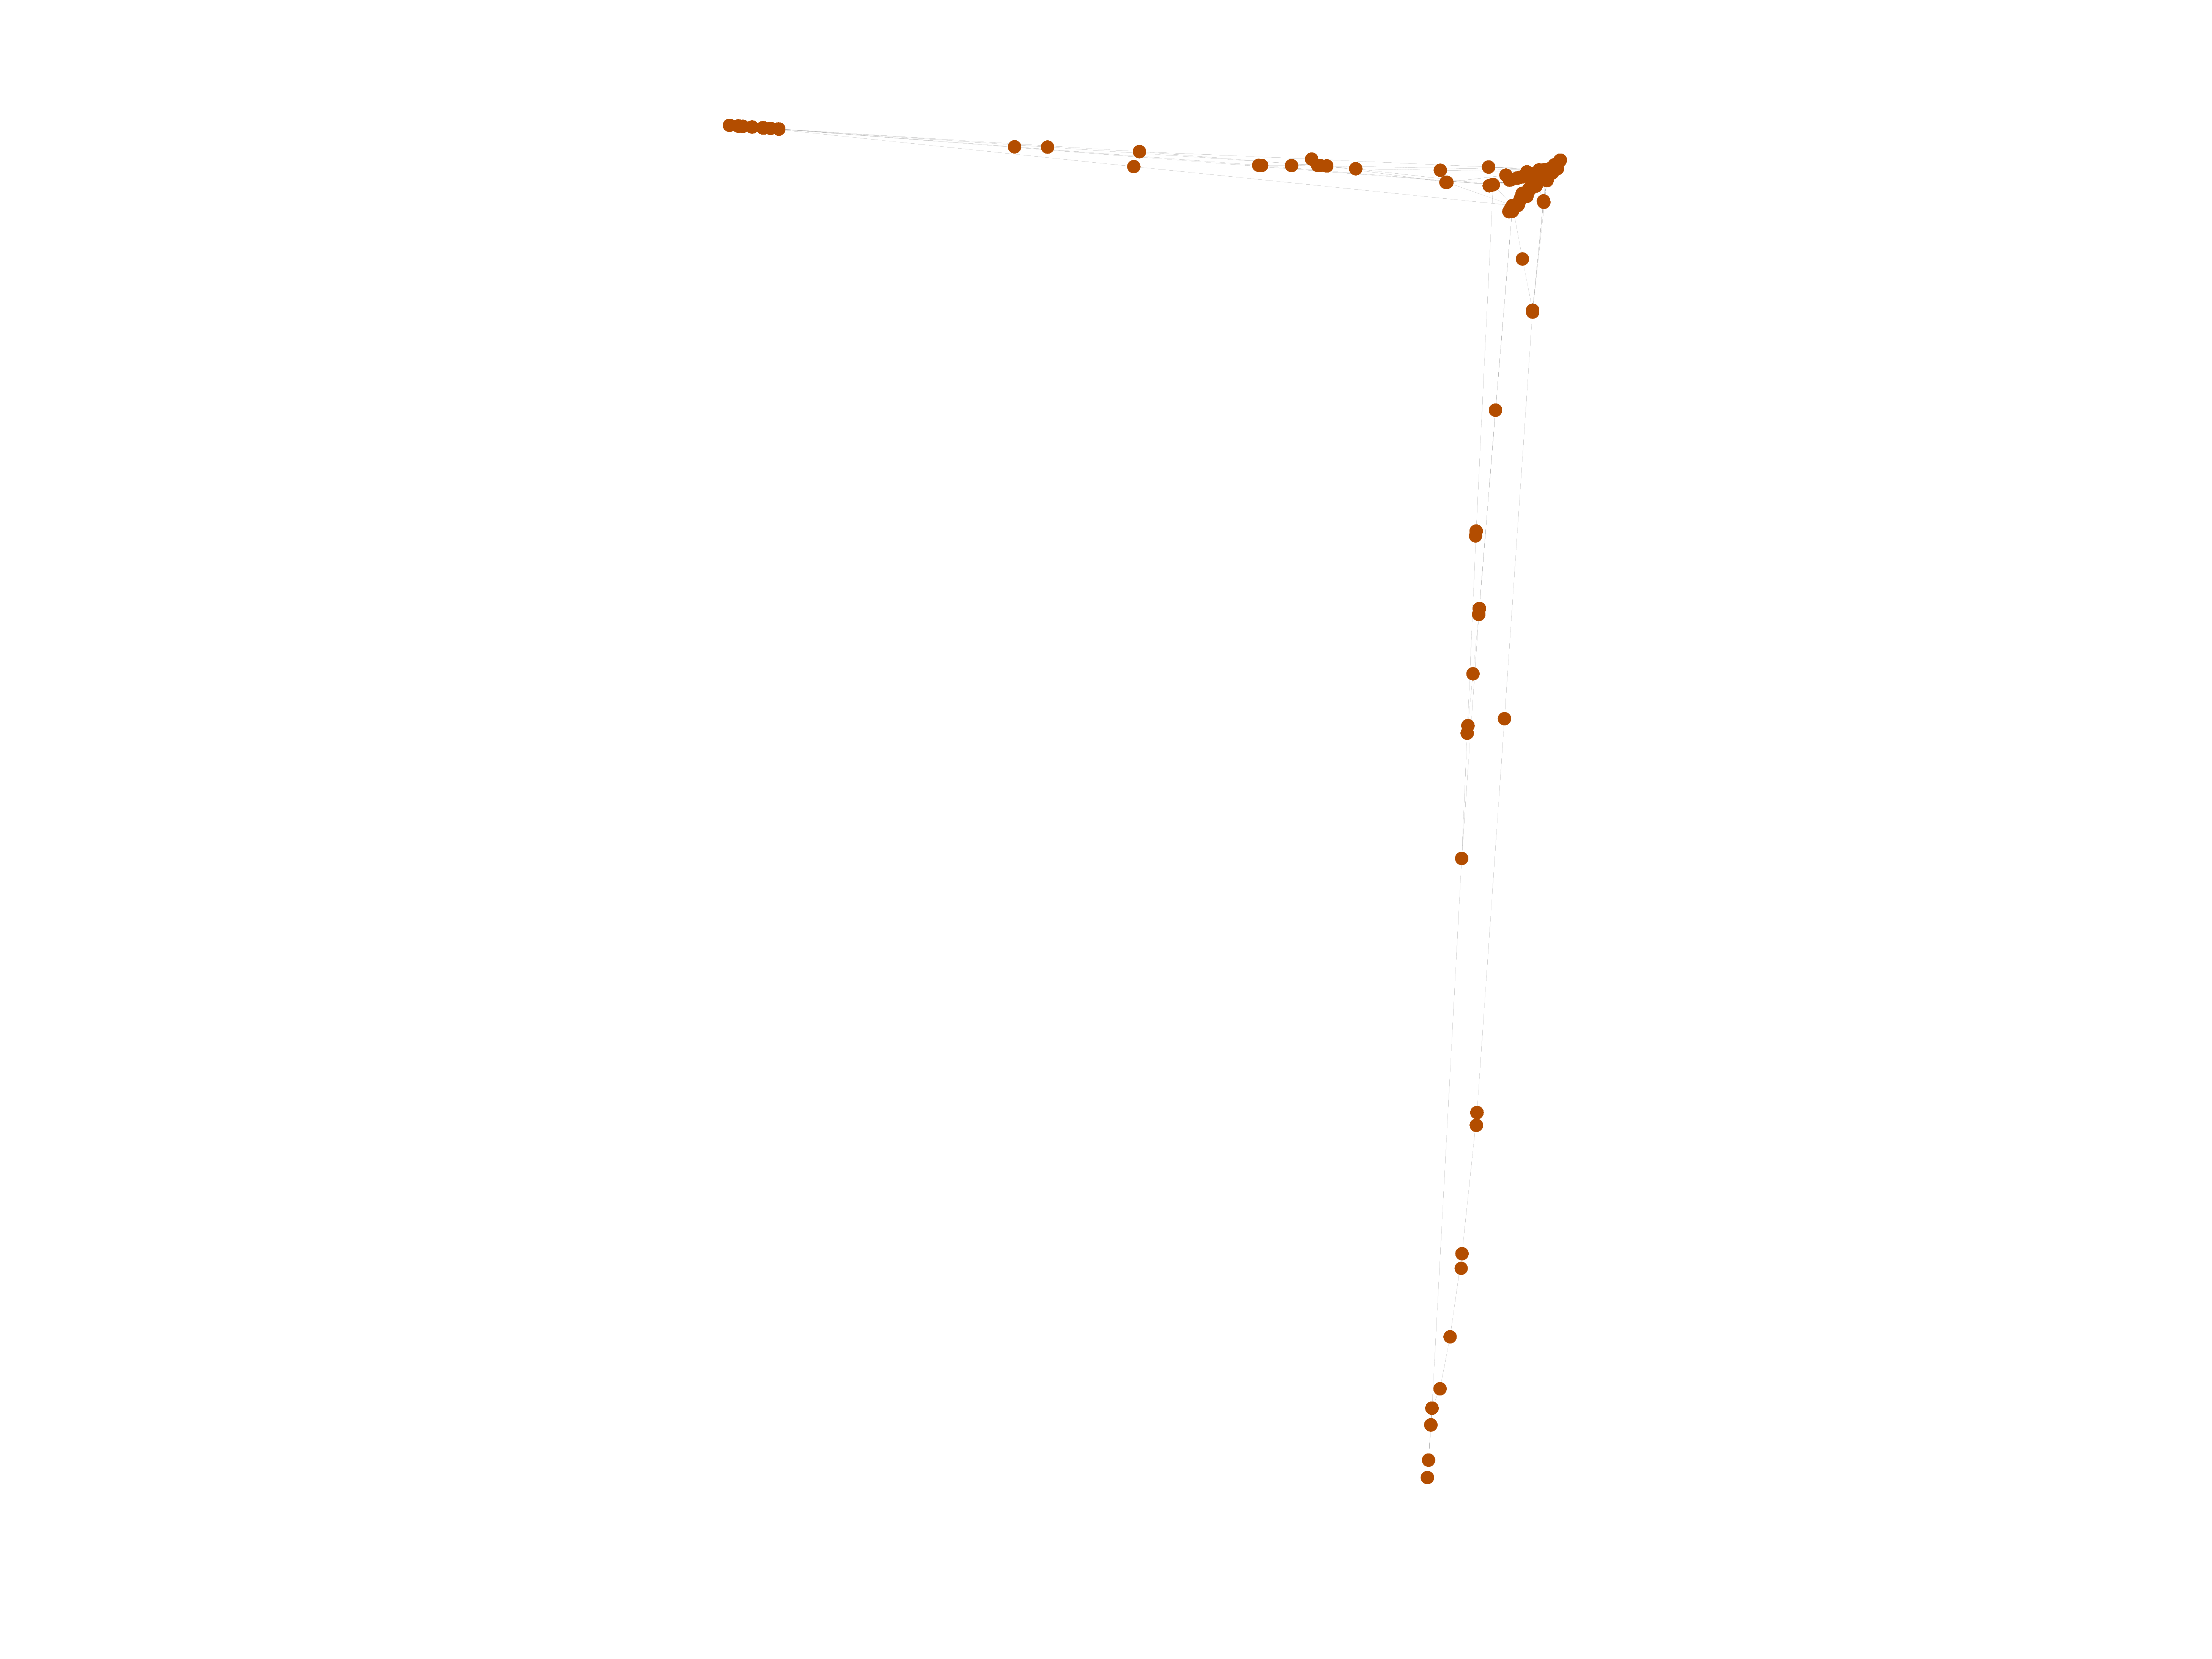
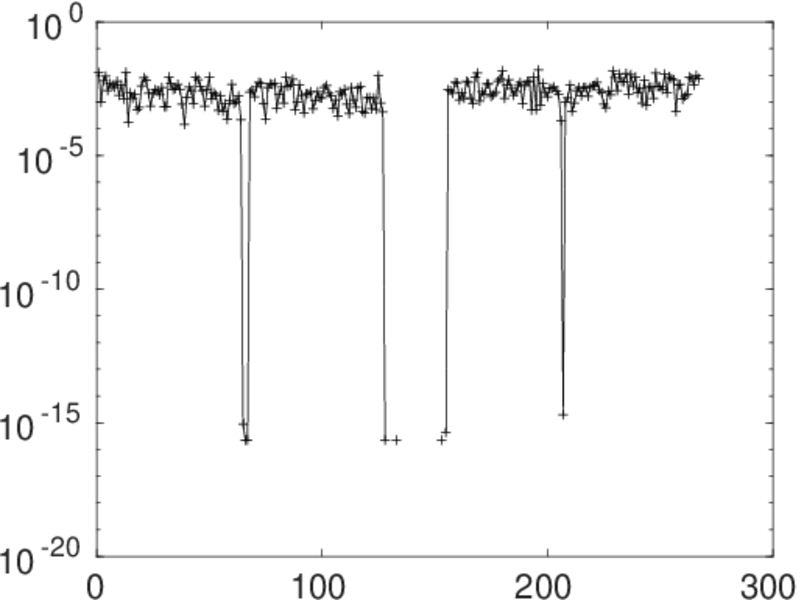
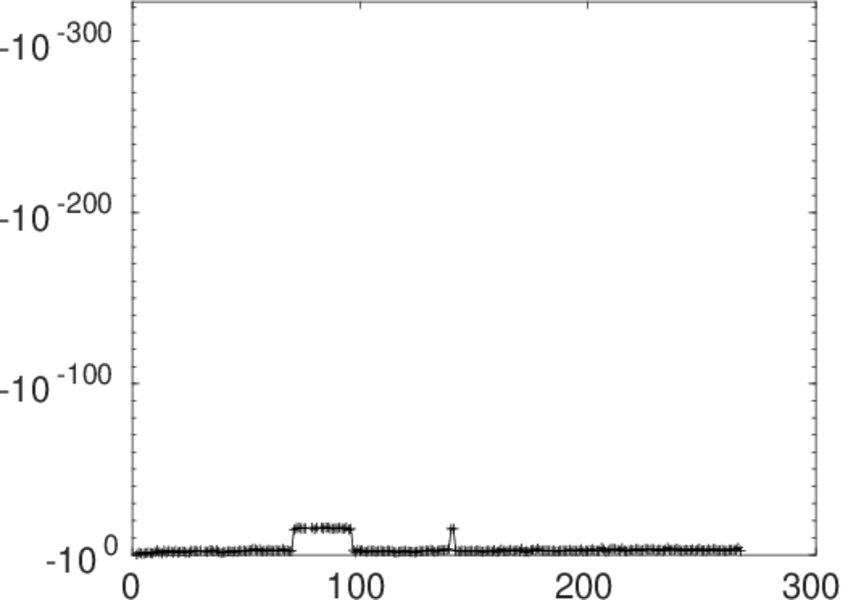
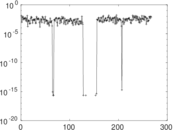
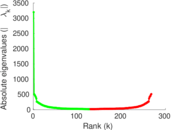
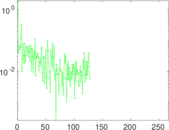
Matrix decompositions plots


Downloads
References
|
[1]
|
Jérôme Kunegis.
KONECT – The Koblenz Network Collection.
In Proc. Int. Conf. on World Wide Web Companion, pages
1343–1350, 2013.
[ http ]
|
|
[2]
|
Wikimedia Foundation.
Wikimedia downloads.
http://dumps.wikimedia.org/, January 2010.
|
 KONECT ‣ Networks ‣
Buy Me a Coffee
KONECT ‣ Networks ‣
Buy Me a Coffee