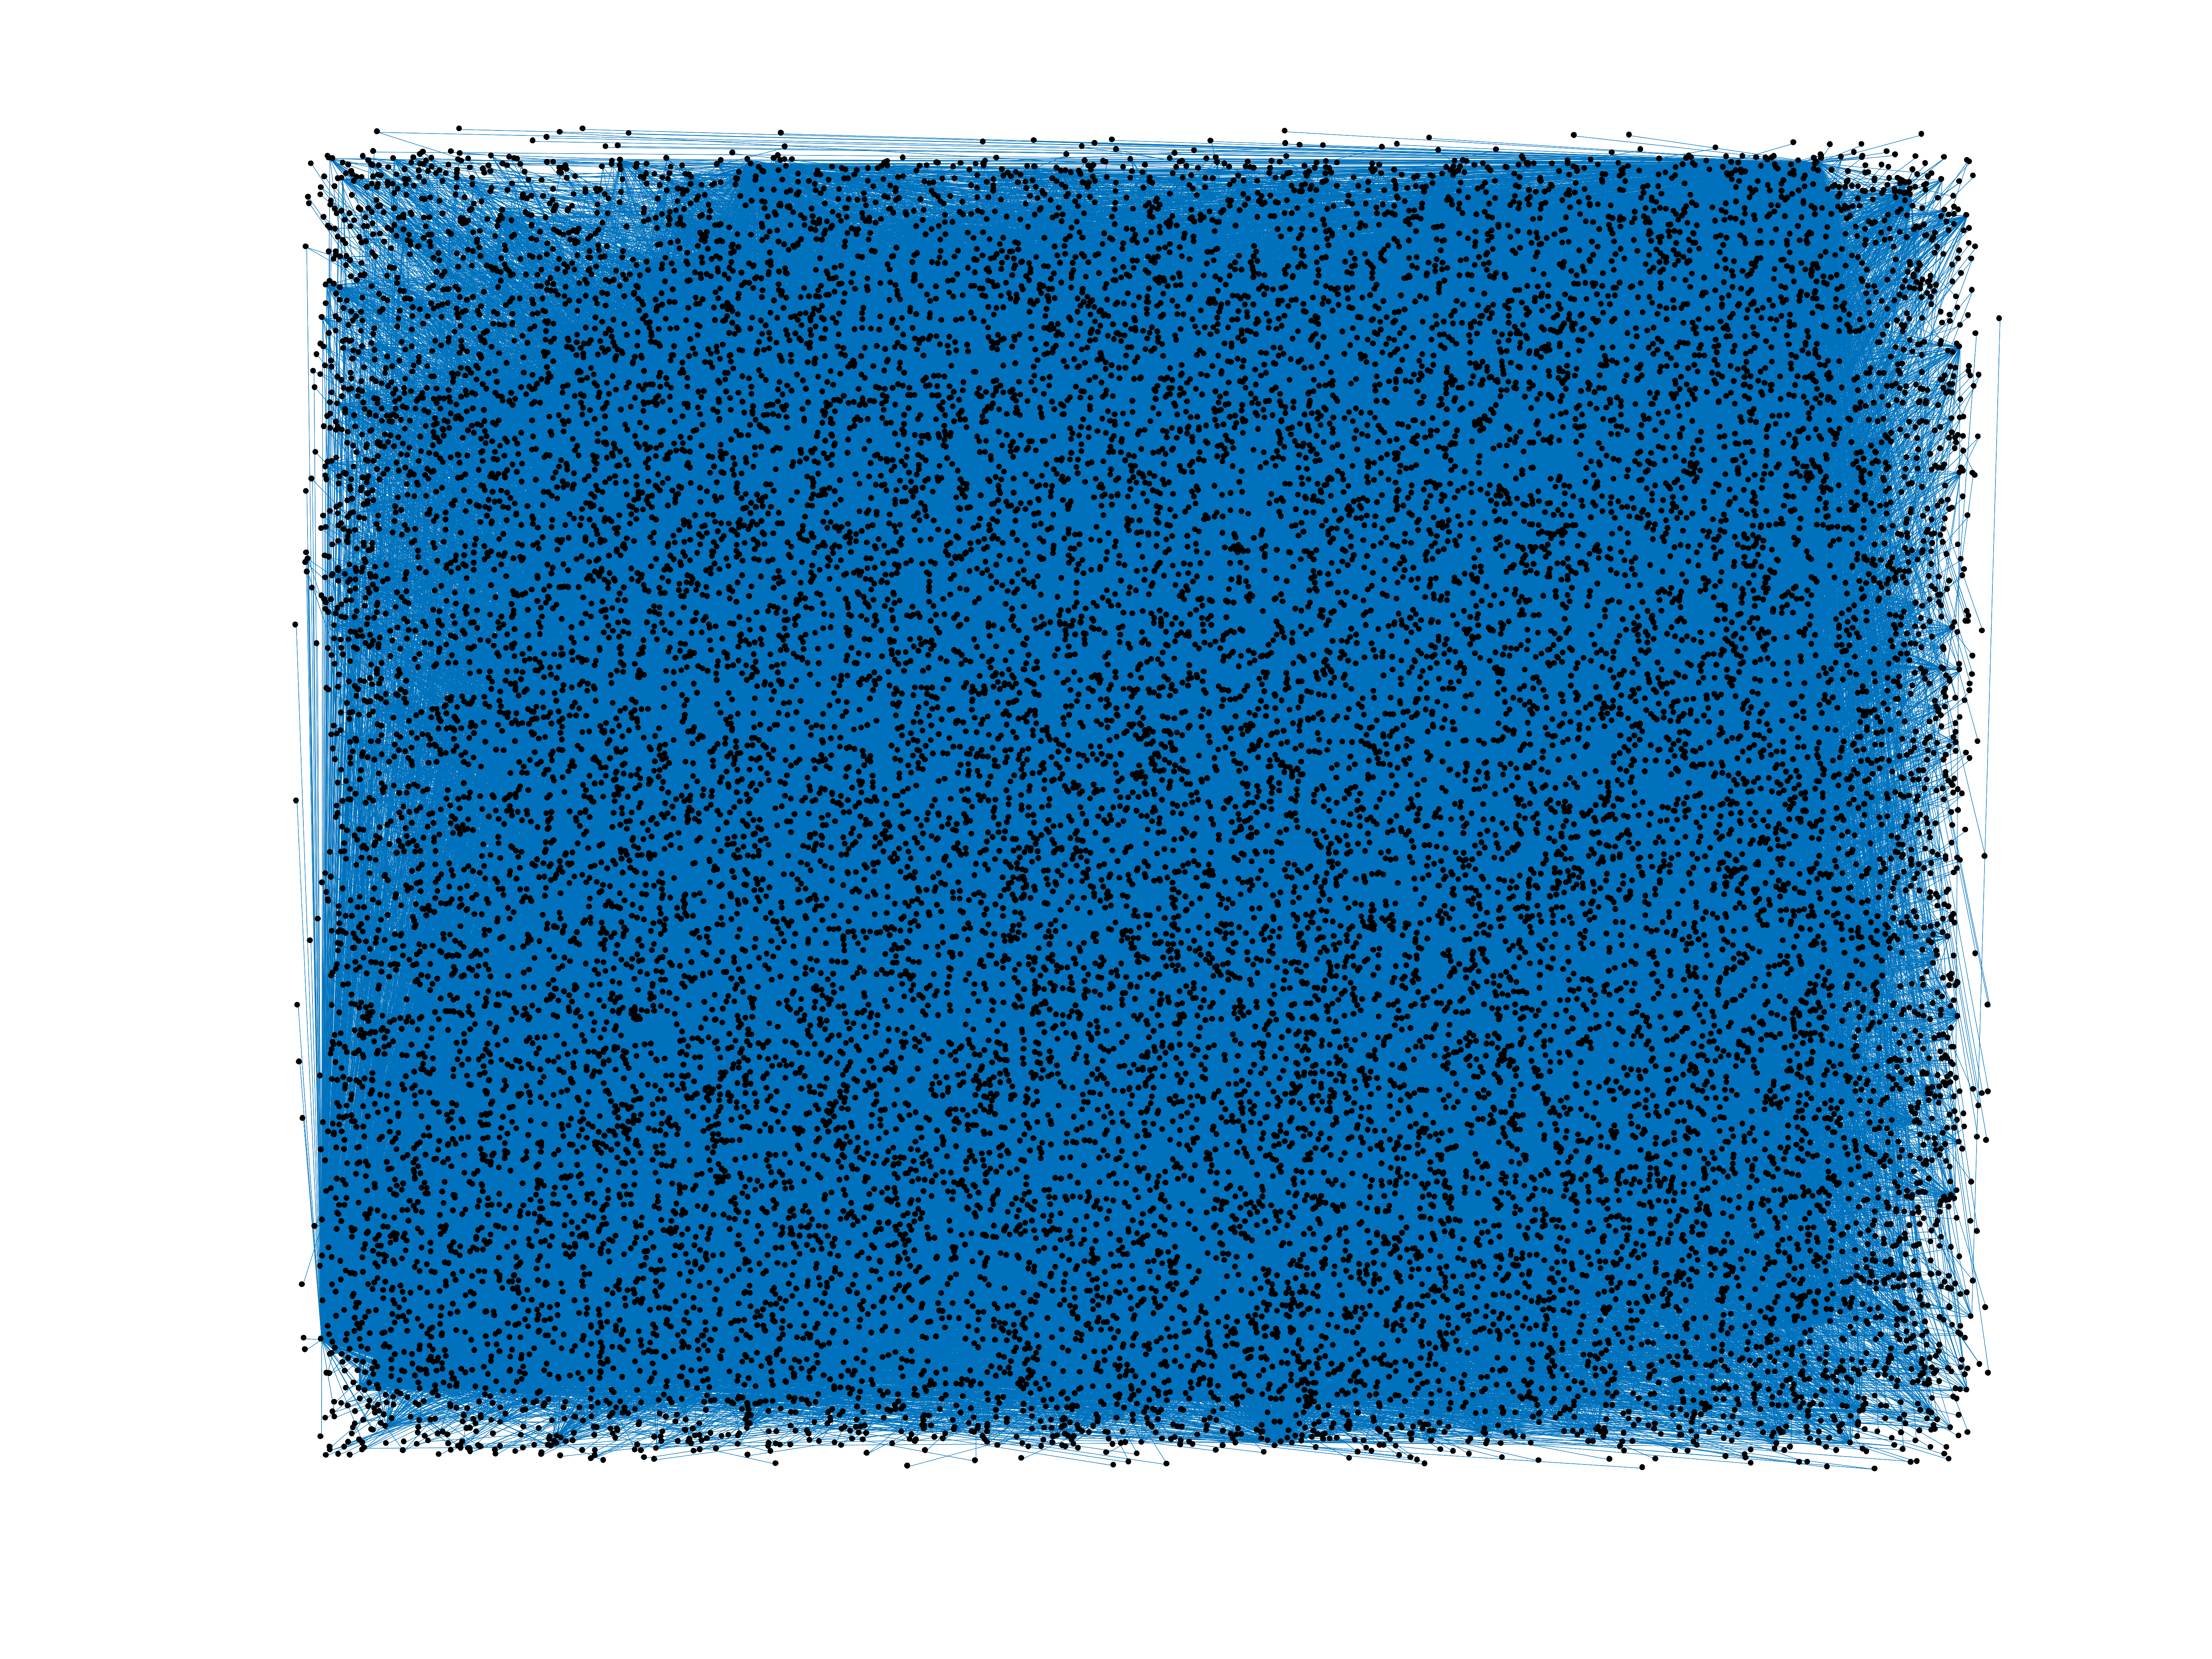
Wikipedia edits (crh)
This is the bipartite edit network of the Crimean Turkish Wikipedia. It
contains users and pages from the Crimean Turkish Wikipedia, connected by edit
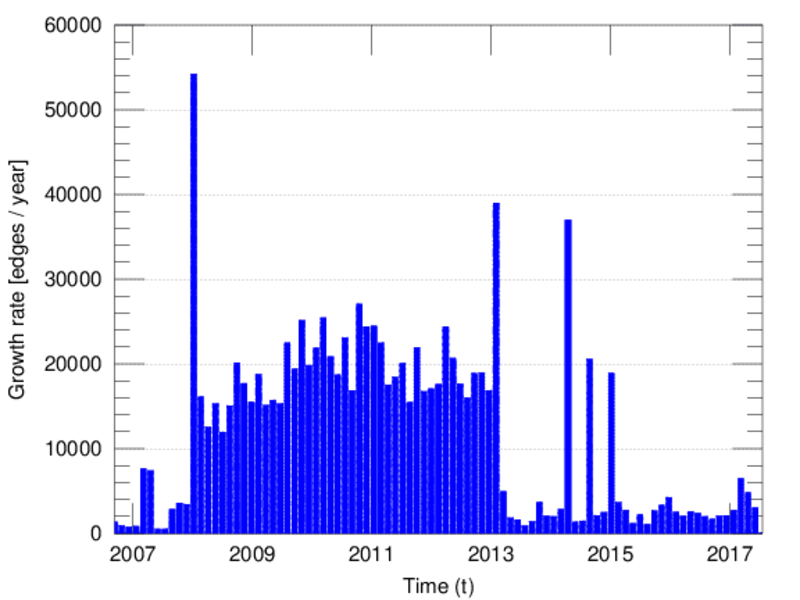
events. Each edge represents an edit. The dataset includes the timestamp of
each edit.
Metadata
Statistics
| Size | n = | 19,970
|
| Left size | n1 = | 1,250
|
| Right size | n2 = | 18,720
|
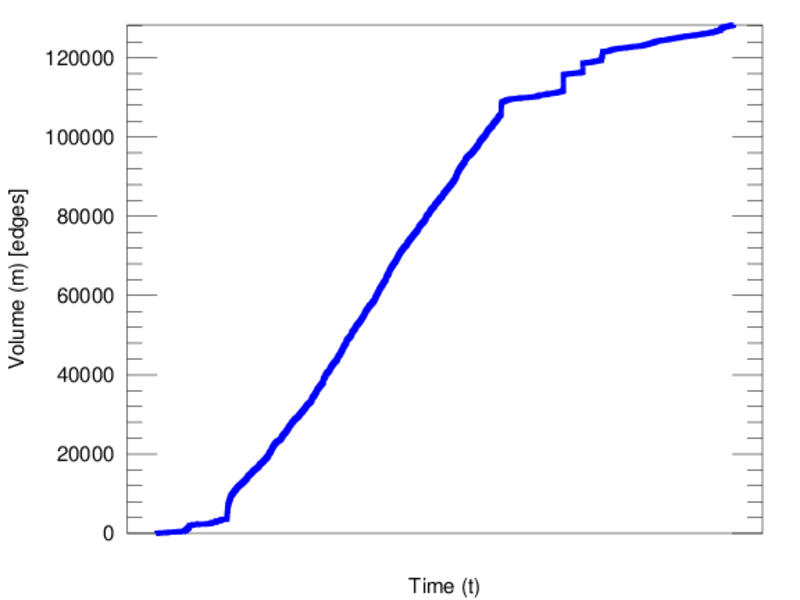
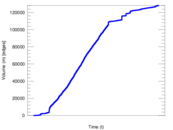
| Volume | m = | 128,264
|
| Unique edge count | m̿ = | 63,767
|
| Wedge count | s = | 54,165,052
|
| Claw count | z = | 57,485,550,072
|
| Cross count | x = | 56,308,196,266,707
|
| Square count | q = | 78,438,687
|
| 4-Tour count | T4 = | 844,353,210
|
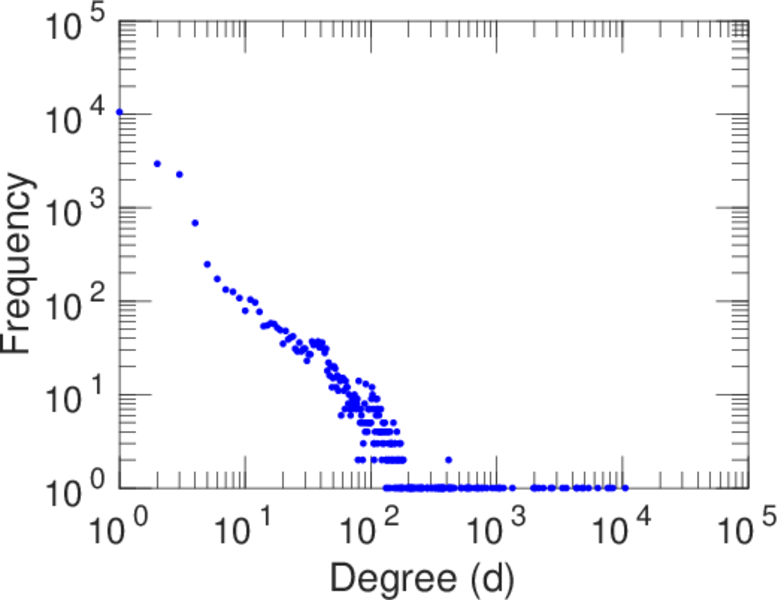
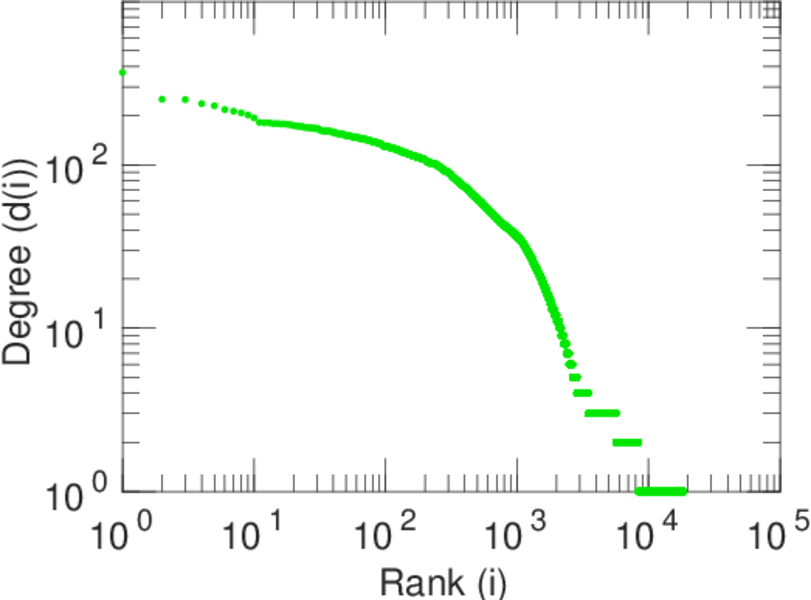
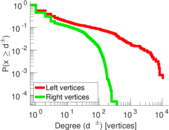
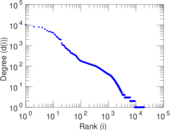
| Maximum degree | dmax = | 10,551
|
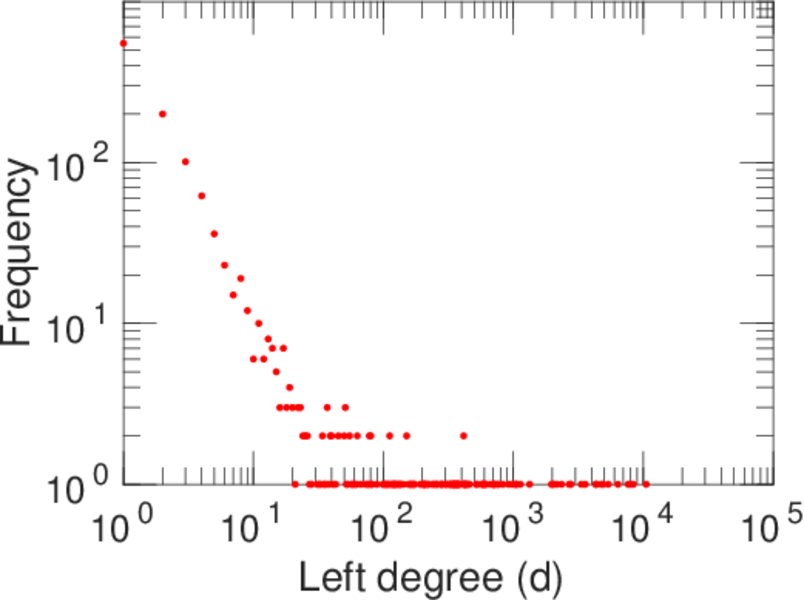
| Maximum left degree | d1max = | 10,551
|
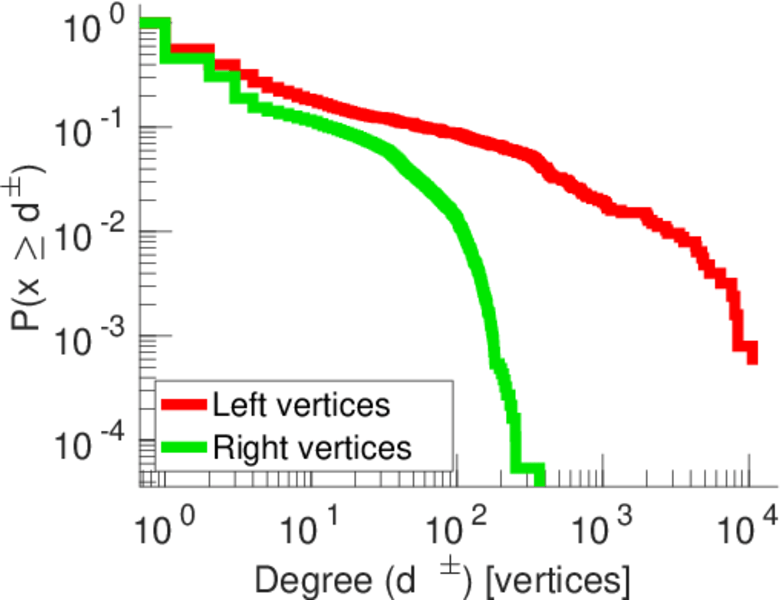
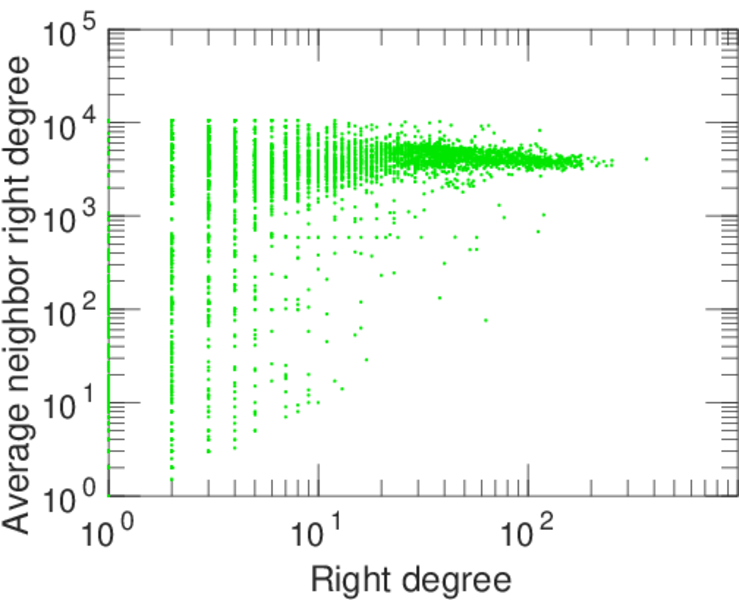
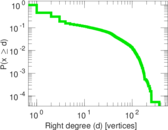
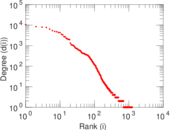
| Maximum right degree | d2max = | 368
|
| Average degree | d = | 12.845 7
|
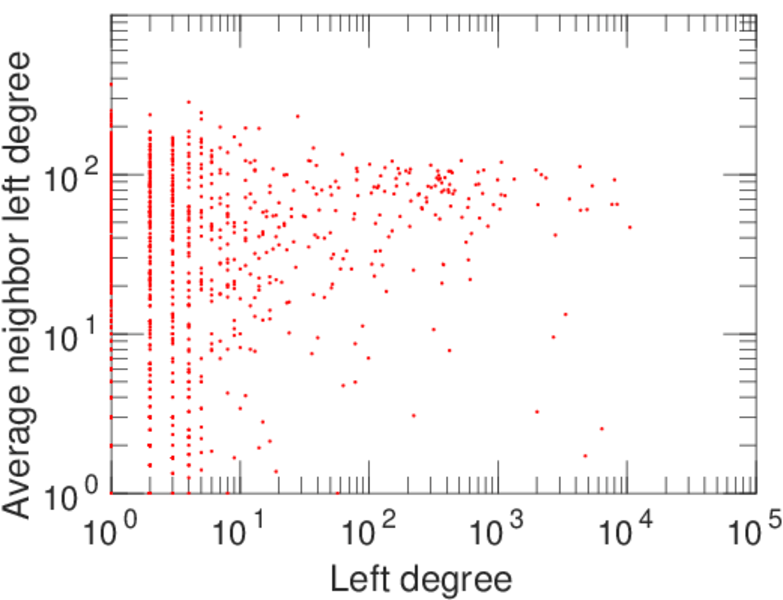
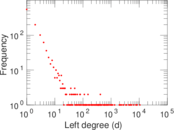
| Average left degree | d1 = | 102.611
|
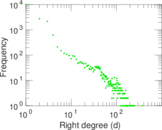
| Average right degree | d2 = | 6.851 71
|
| Fill | p = | 0.002 725 09
|
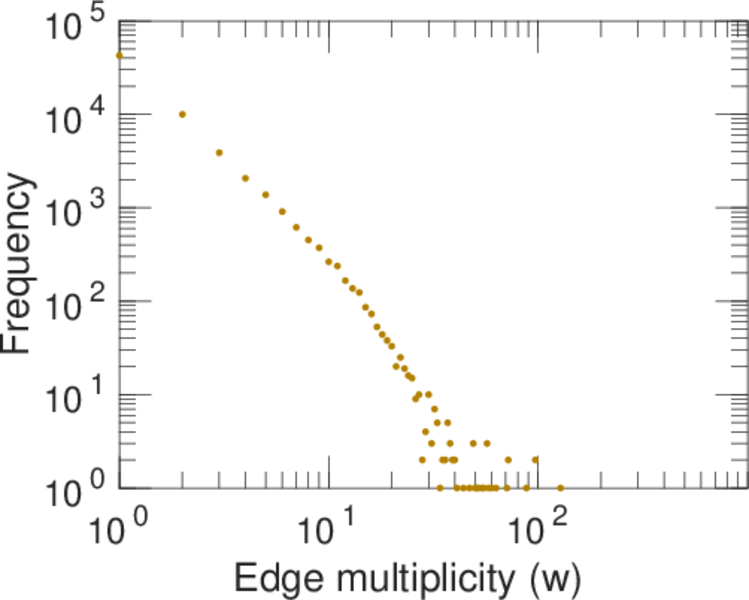
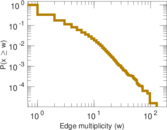
| Average edge multiplicity | m̃ = | 2.011 45
|
| Size of LCC | N = | 19,042
|
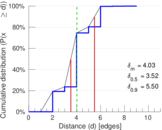
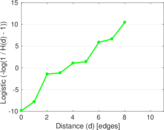
| Diameter | δ = | 11
|
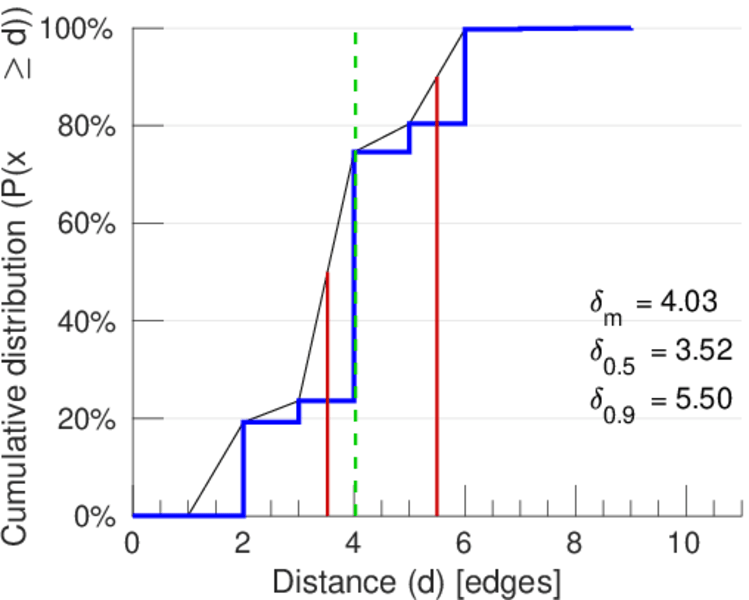
| 50-Percentile effective diameter | δ0.5 = | 3.517 99
|
| 90-Percentile effective diameter | δ0.9 = | 5.497 76
|
| Median distance | δM = | 4
|
| Mean distance | δm = | 4.026 30
|
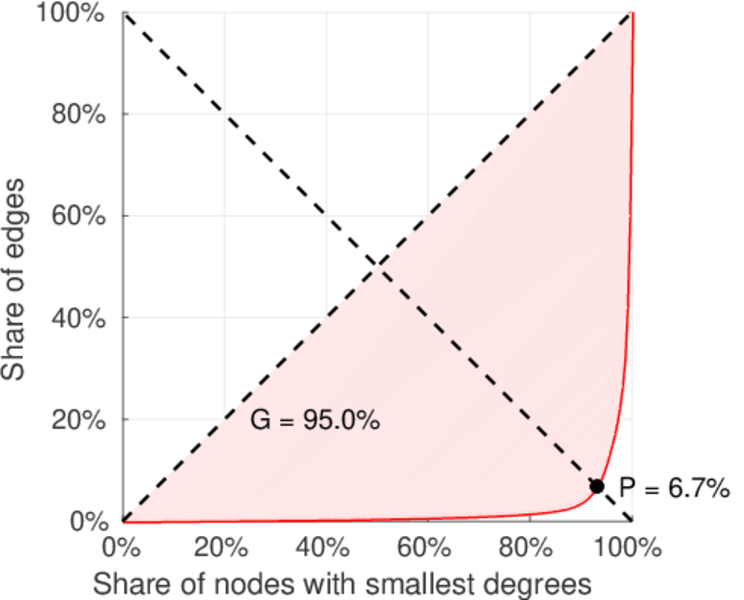
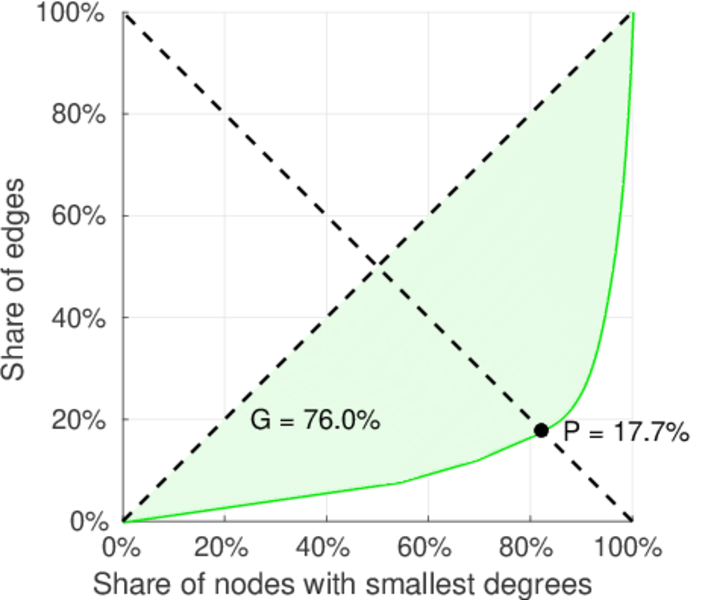
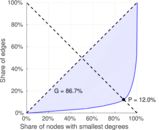
| Gini coefficient | G = | 0.873 749
|
| Balanced inequality ratio | P = | 0.114 794
|
| Left balanced inequality ratio | P1 = | 0.066 823 1
|
| Right balanced inequality ratio | P2 = | 0.176 909
|
| Relative edge distribution entropy | Her = | 0.743 509
|
| Power law exponent | γ = | 2.710 56
|
| Tail power law exponent | γt = | 2.241 00
|
| Tail power law exponent with p | γ3 = | 2.241 00
|
| p-value | p = | 0.000 00
|
| Left tail power law exponent with p | γ3,1 = | 1.481 00
|
| Left p-value | p1 = | 0.000 00
|
| Right tail power law exponent with p | γ3,2 = | 2.021 00
|
| Right p-value | p2 = | 0.000 00
|
| Degree assortativity | ρ = | −0.520 817
|
| Degree assortativity p-value | pρ = | 0.000 00
|
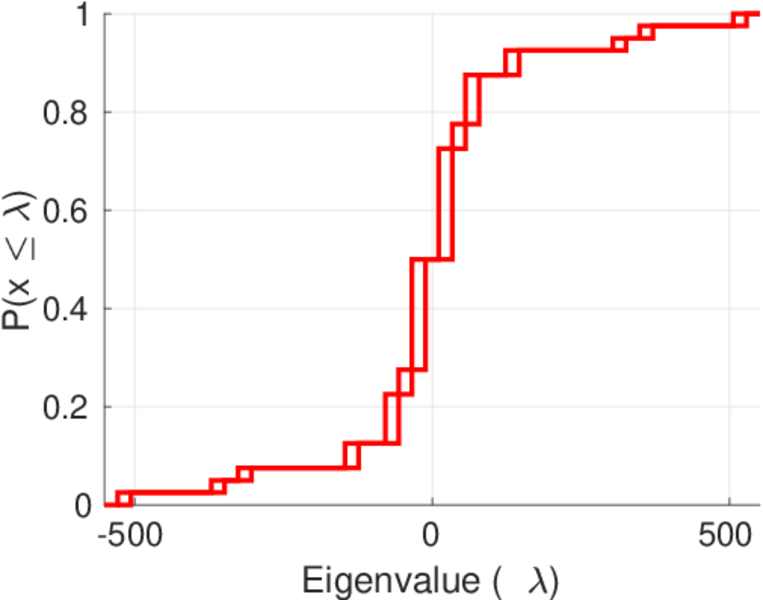
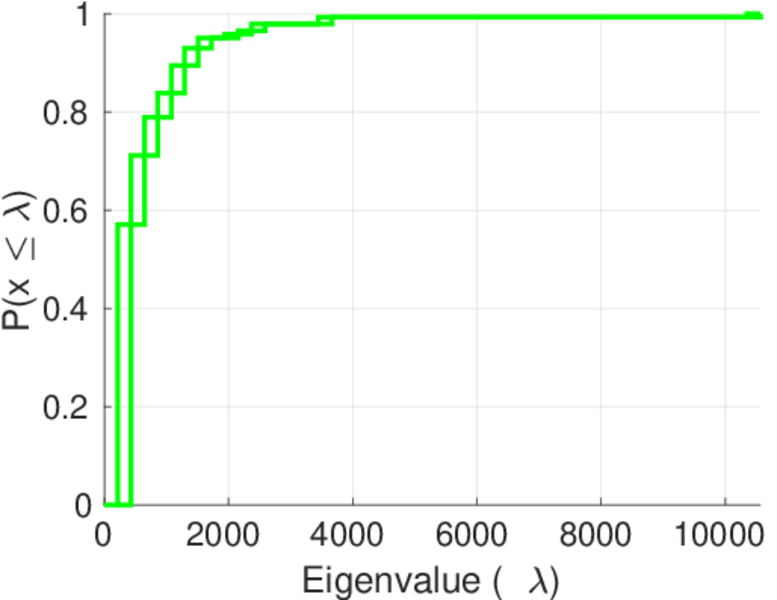
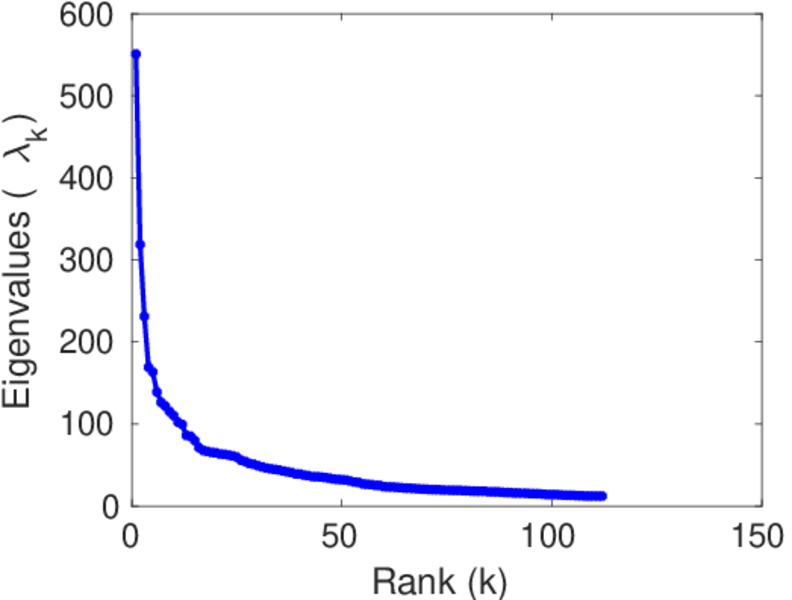
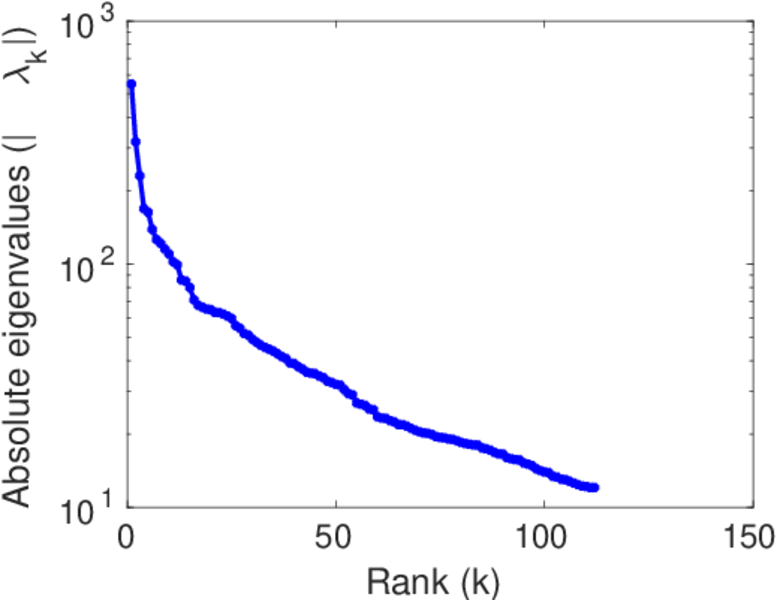
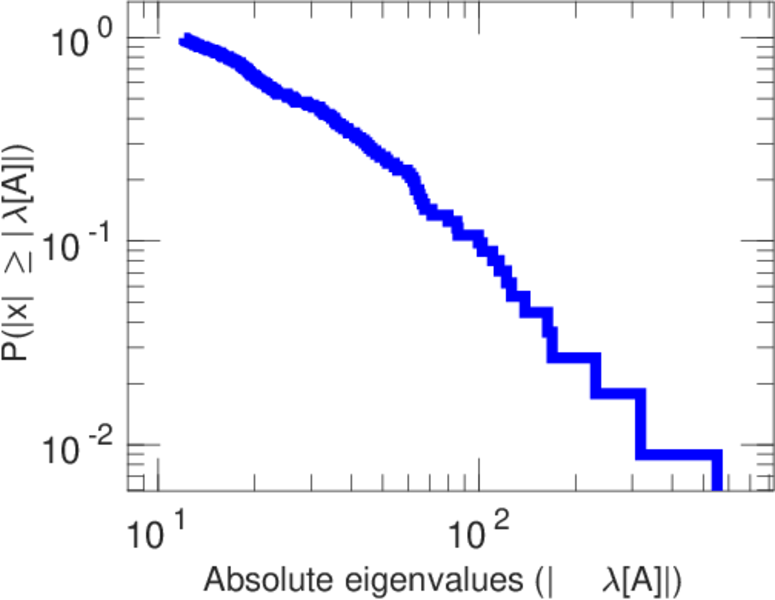
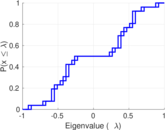
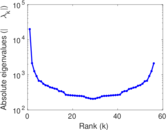
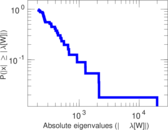
| Spectral norm | α = | 550.933
|
| Algebraic connectivity | a = | 0.010 231 4
|
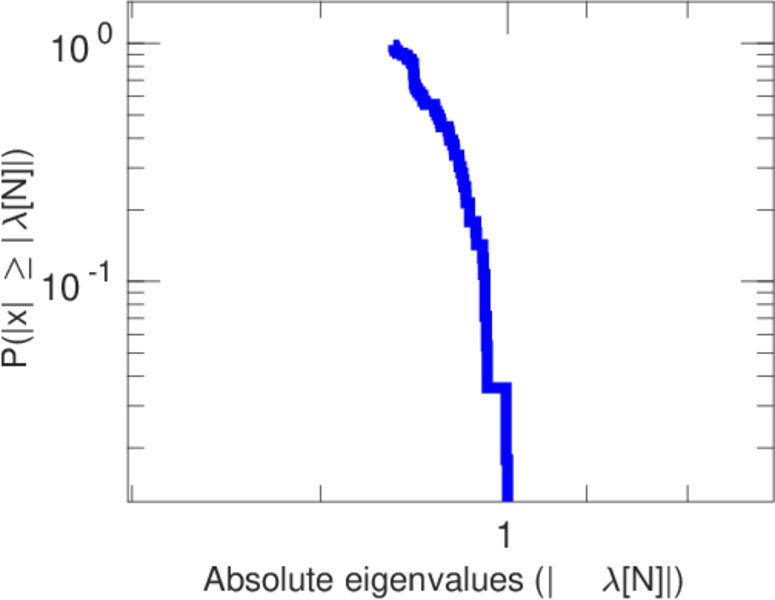
| Spectral separation | |λ1[A] / λ2[A]| = | 1.728 34
|
| Controllability | C = | 17,406
|
| Relative controllability | Cr = | 0.884 271
|
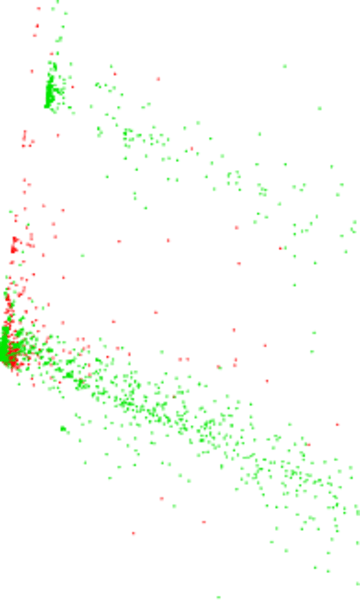
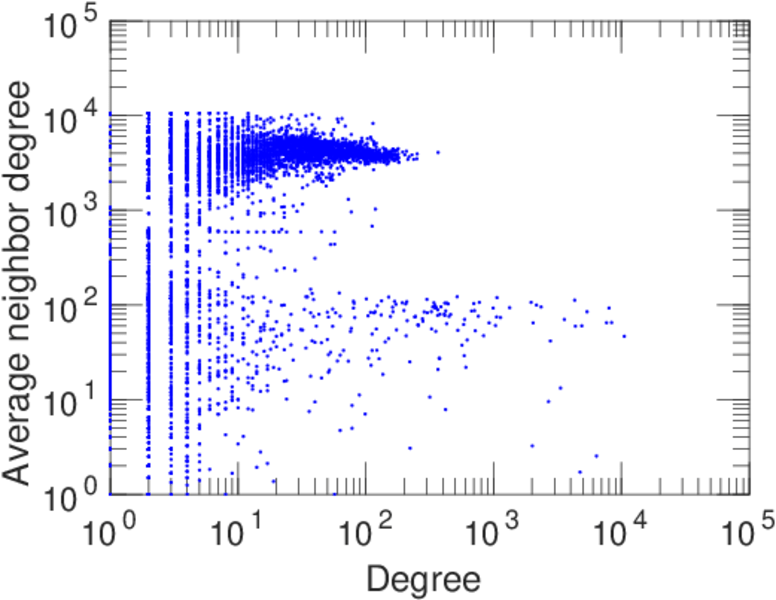
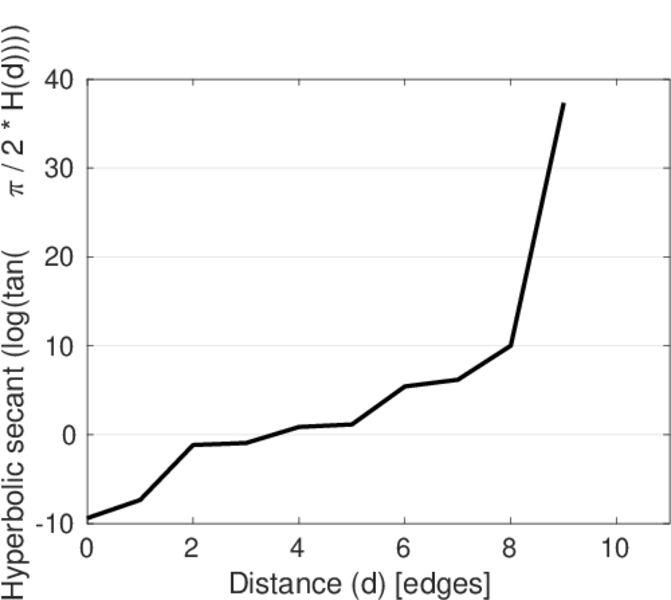
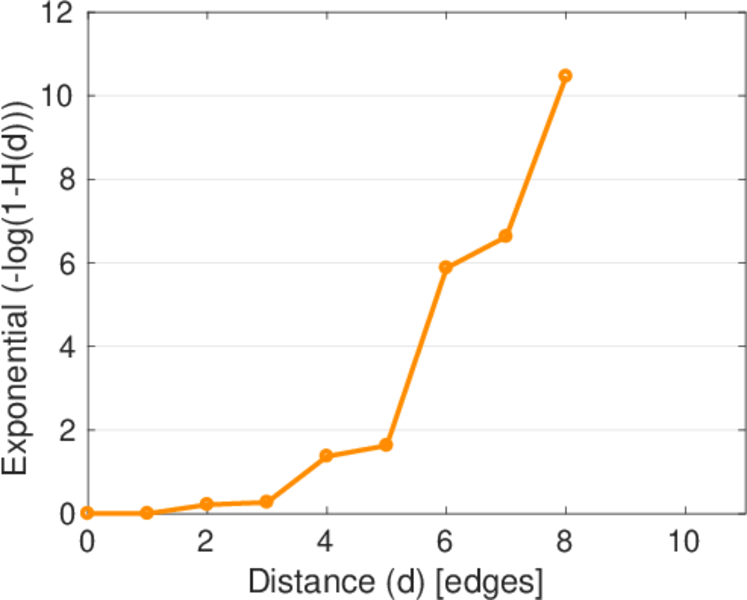
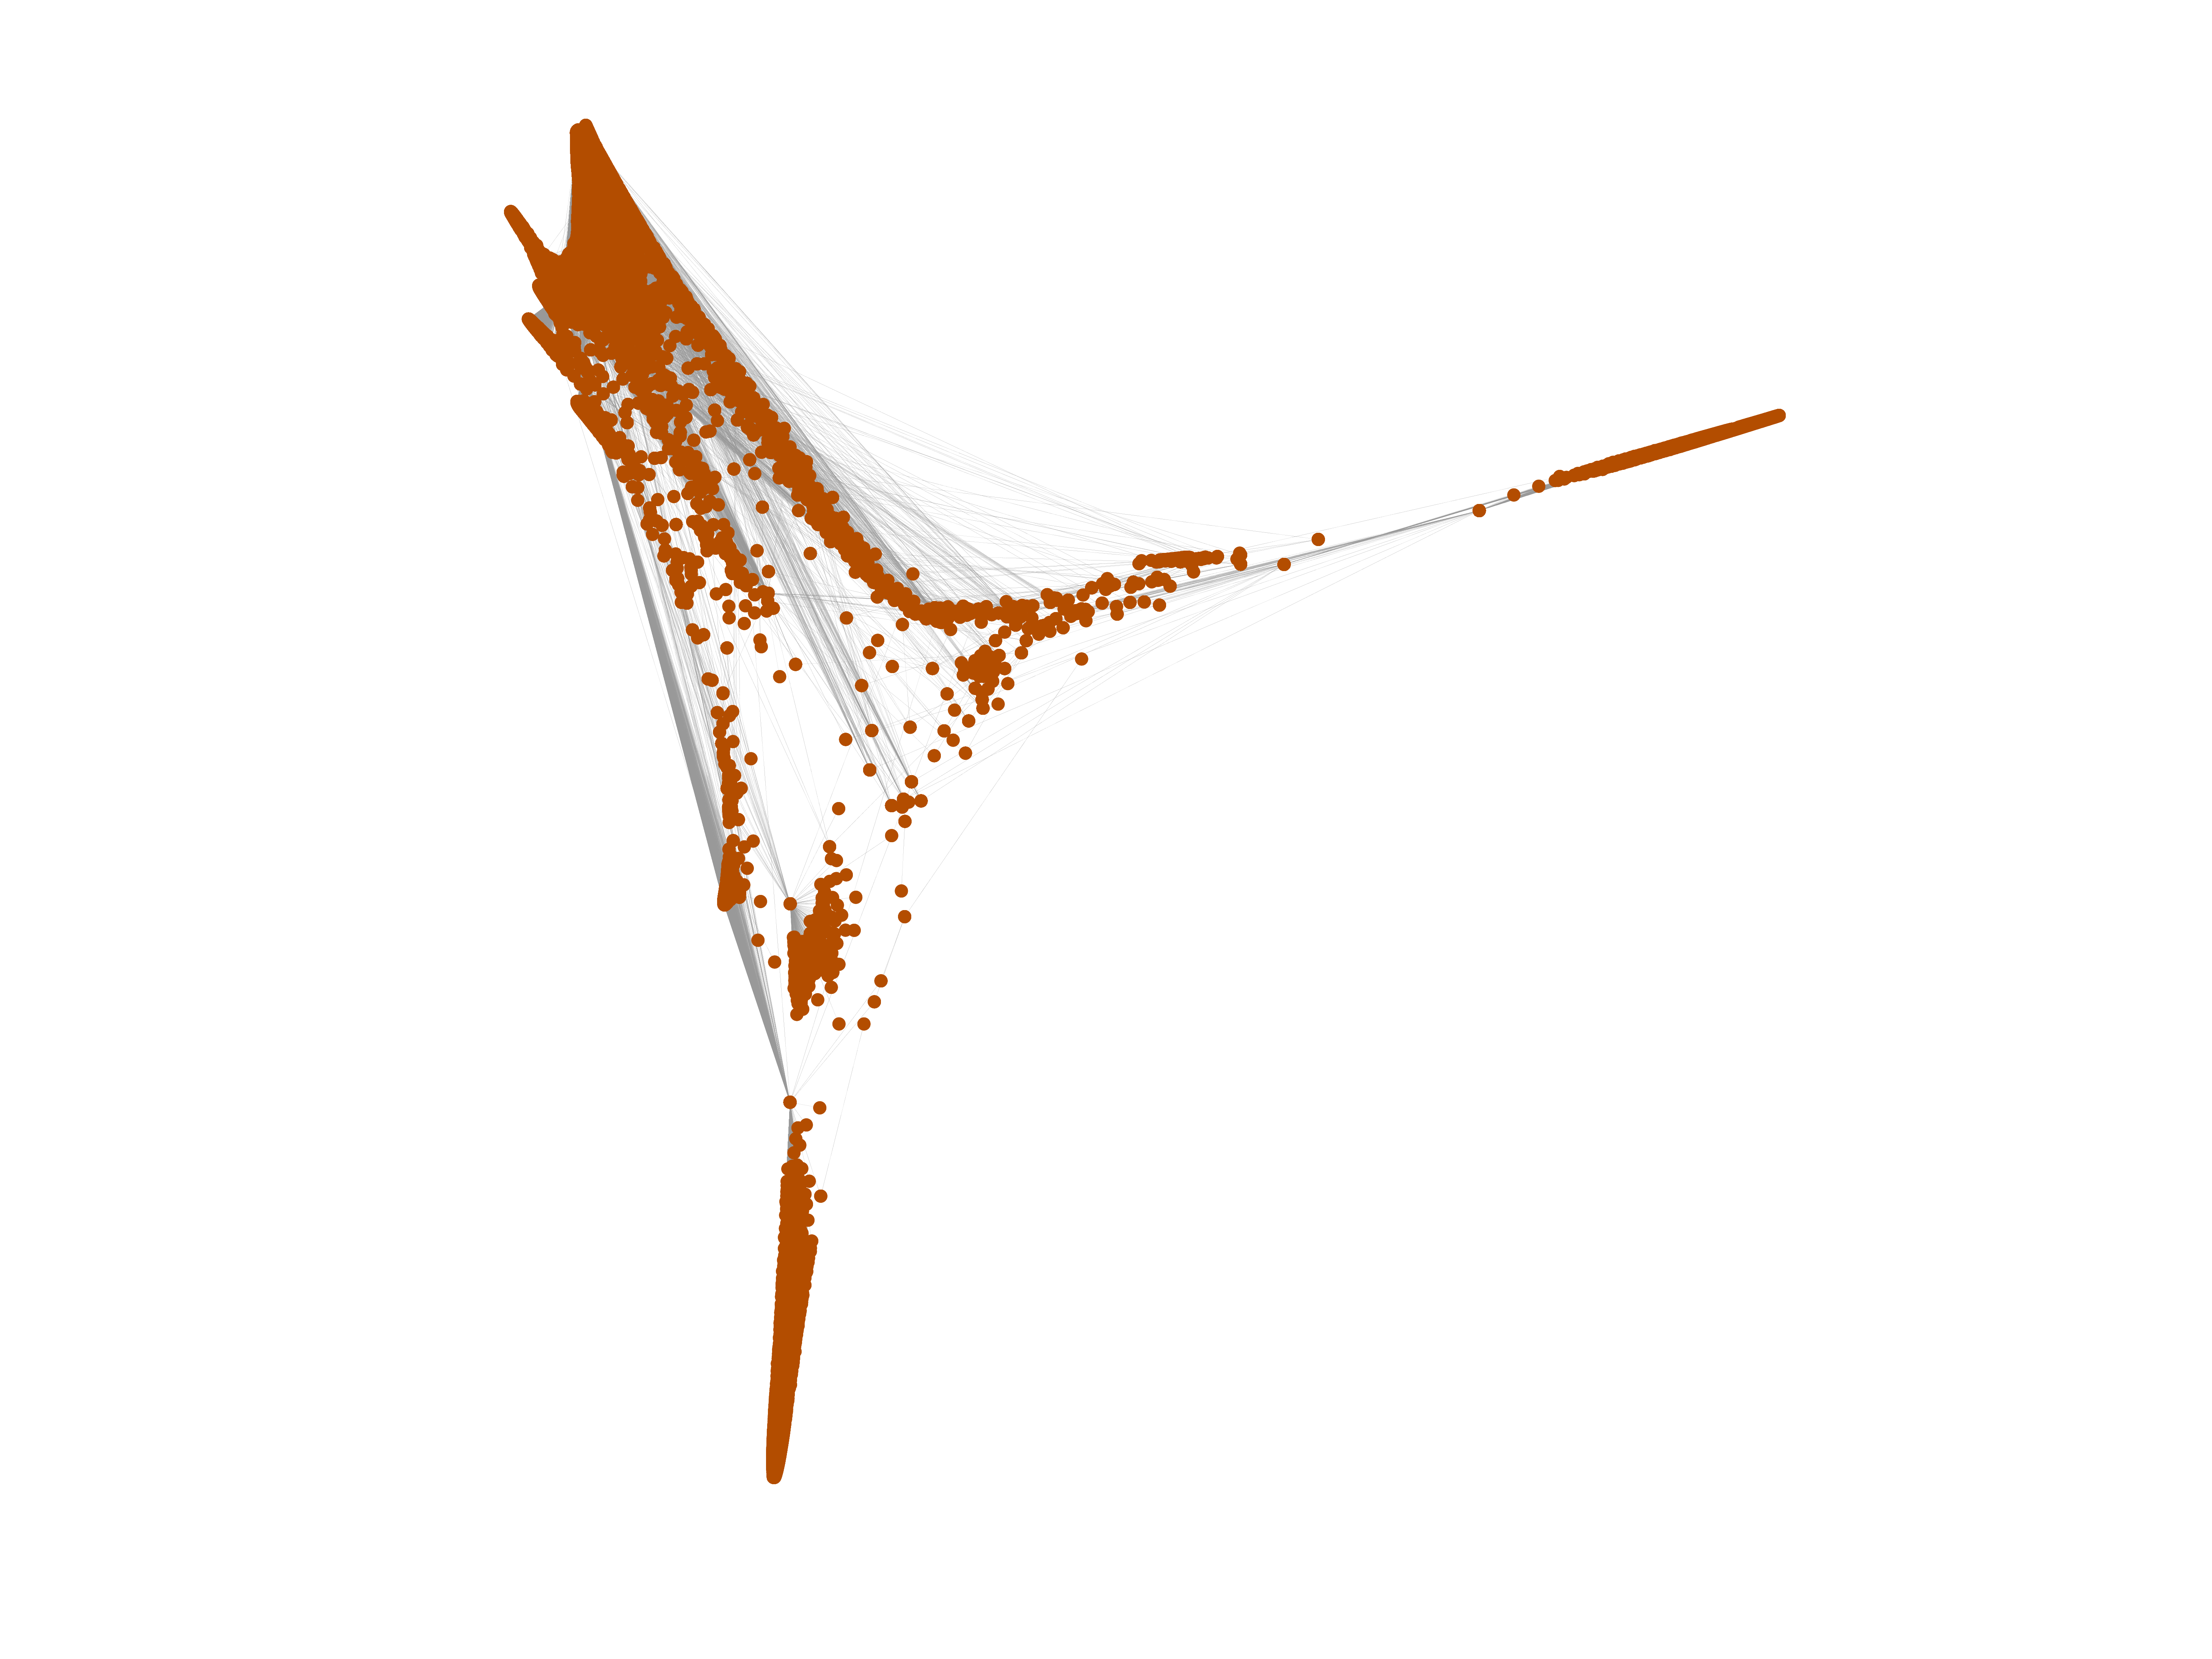
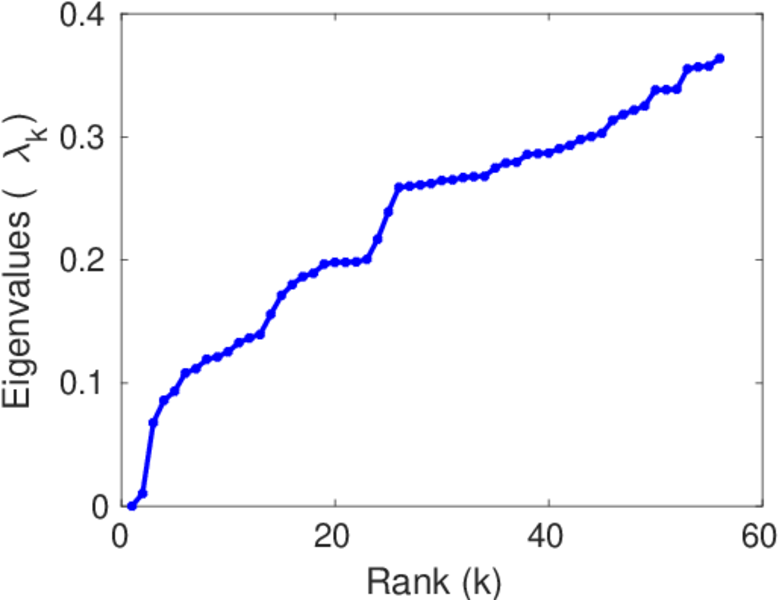
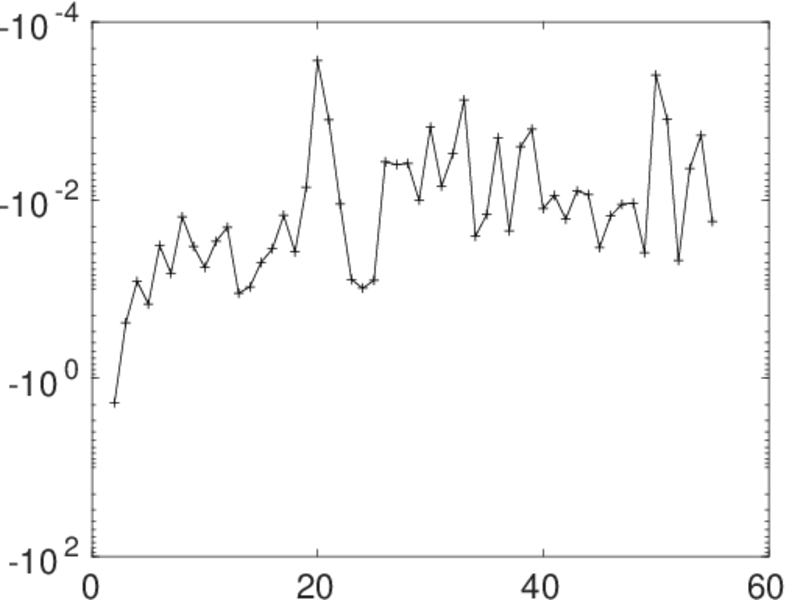
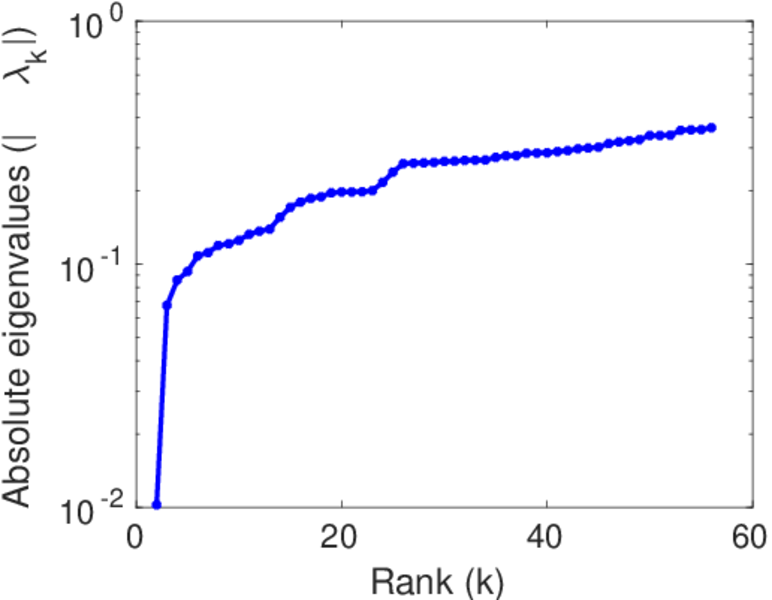
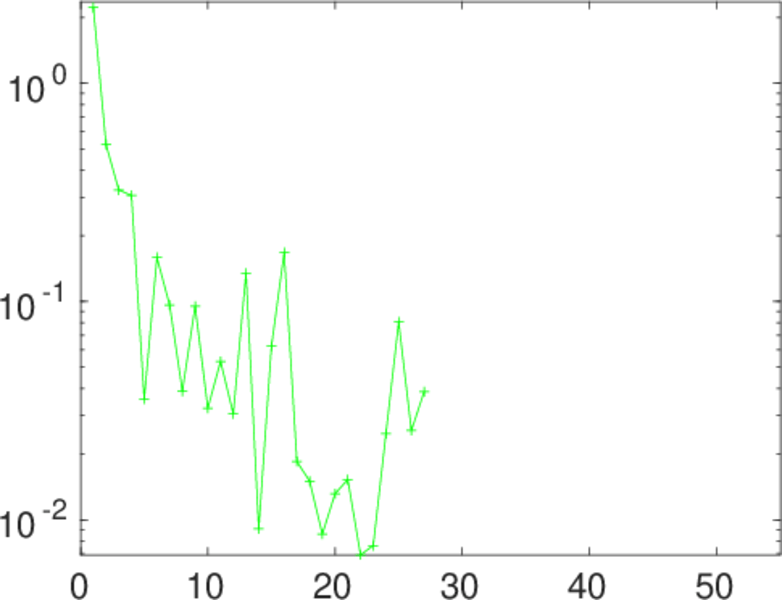
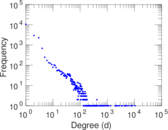
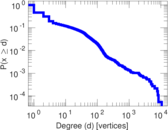
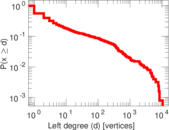
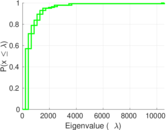
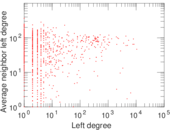
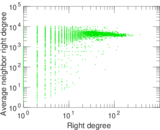
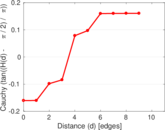
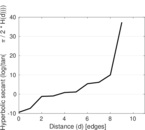
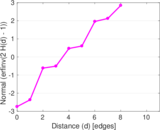
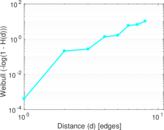
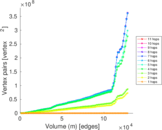
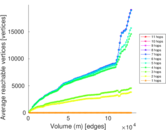
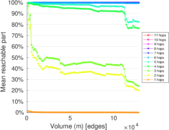
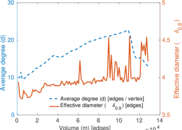
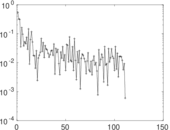
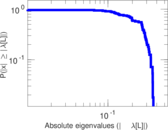
Plots


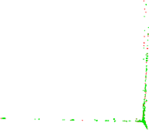


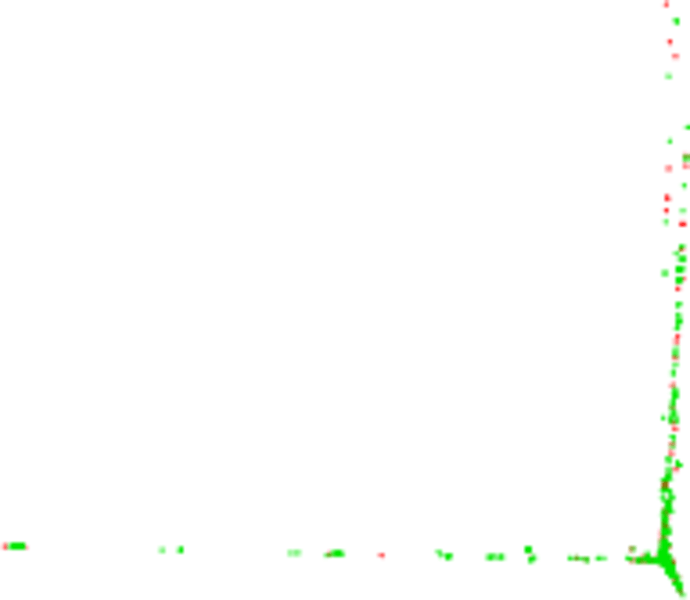
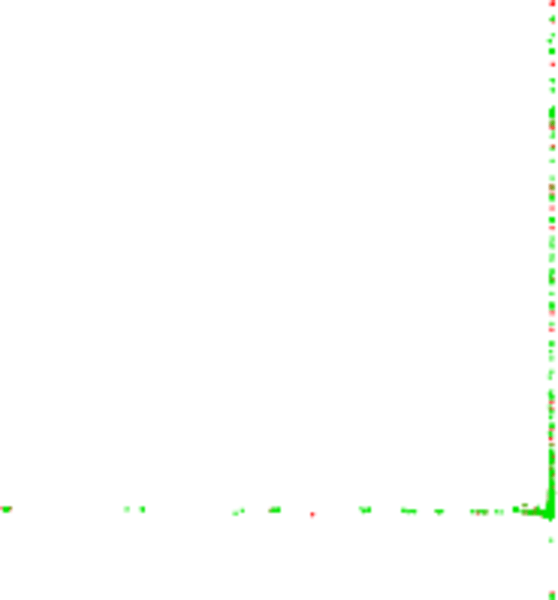
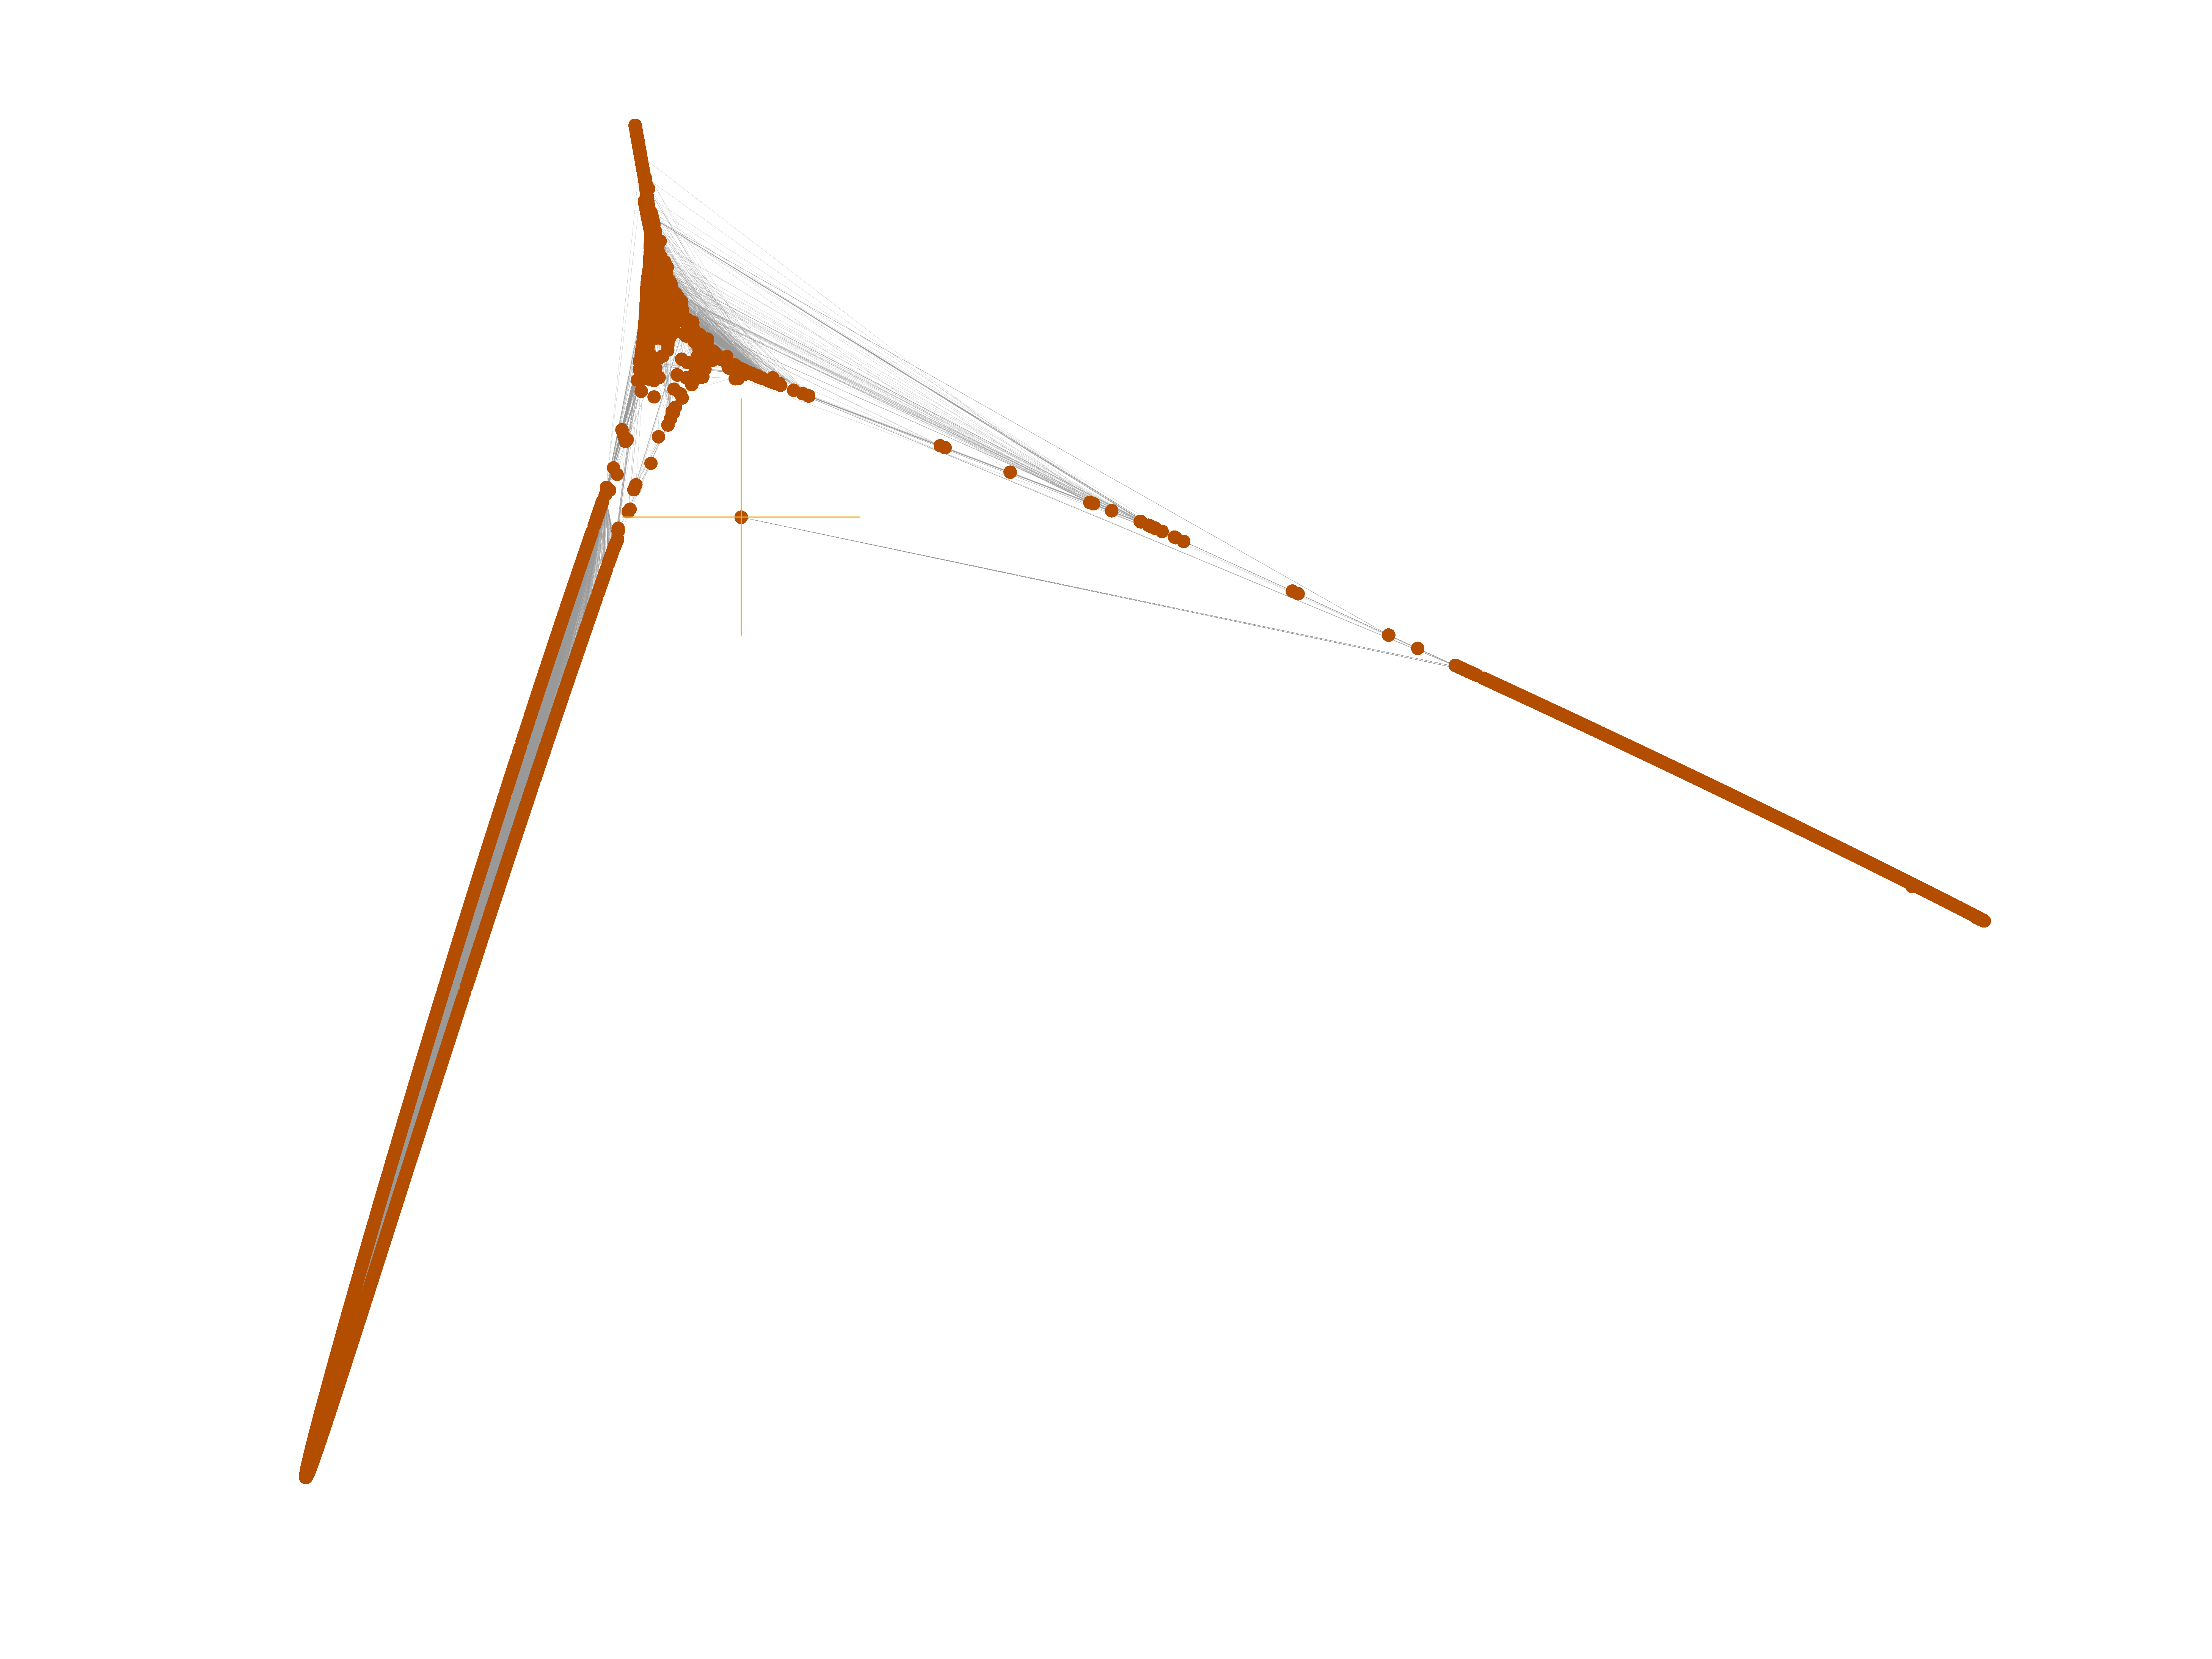
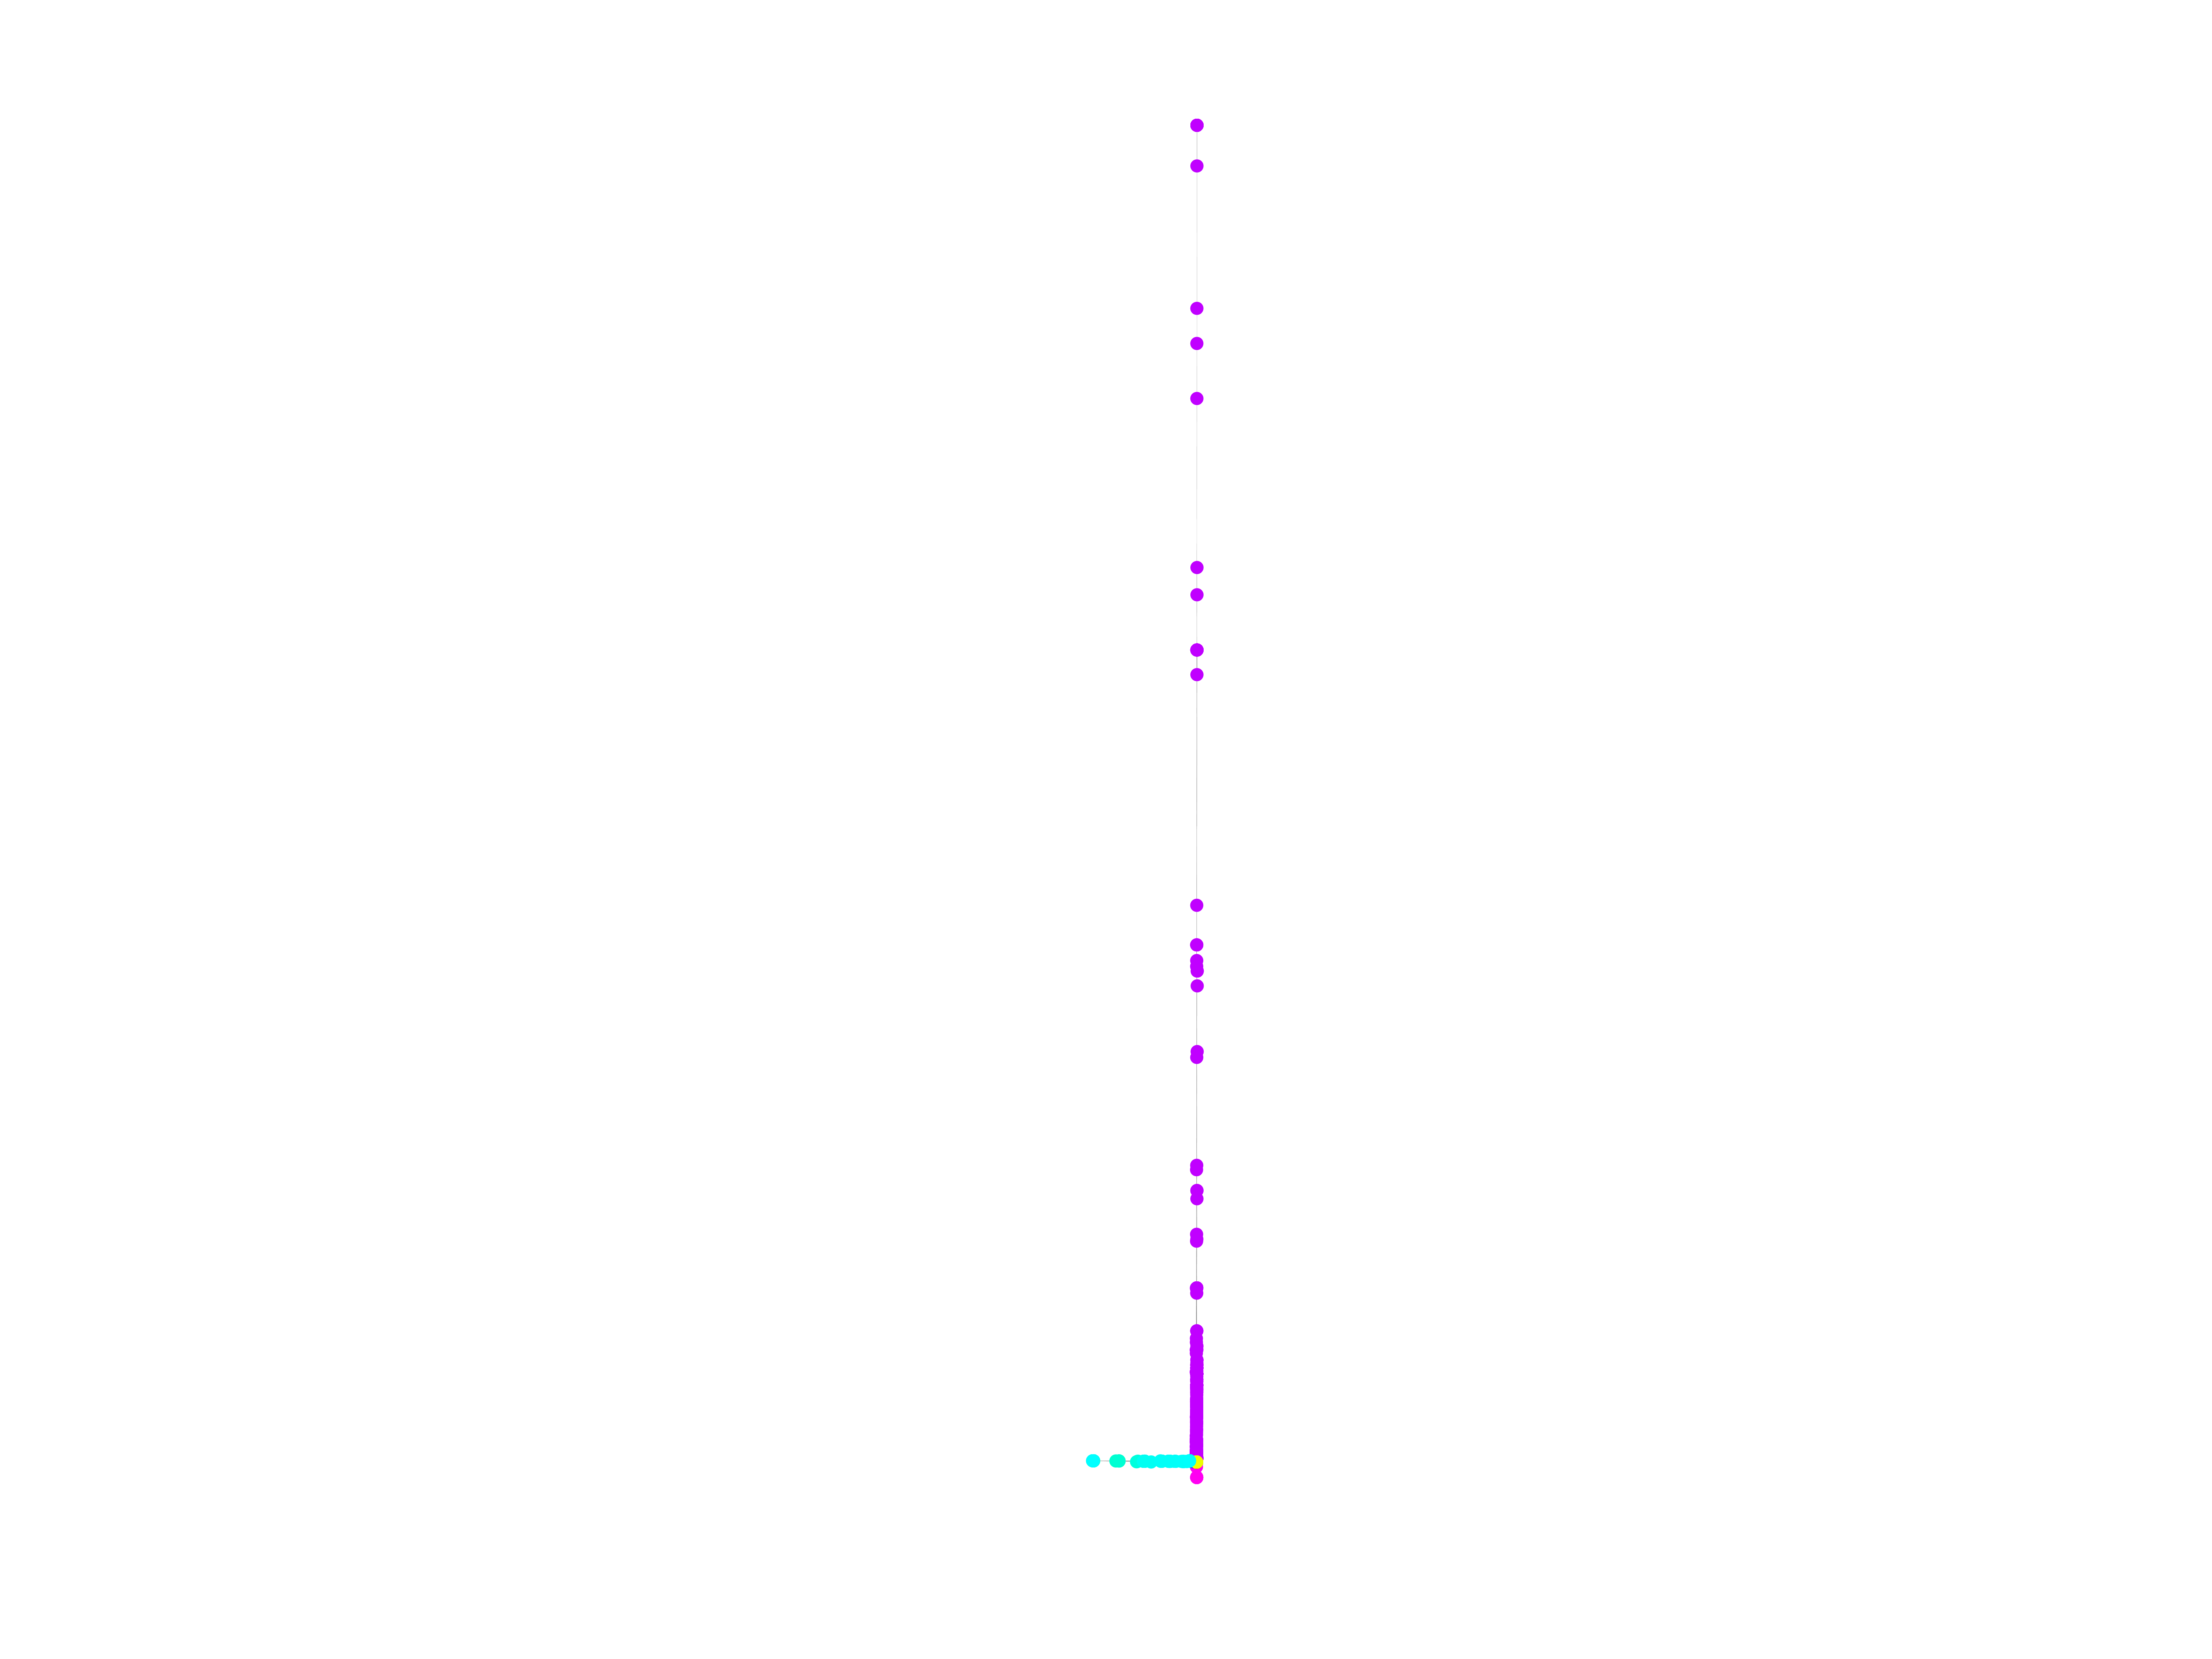
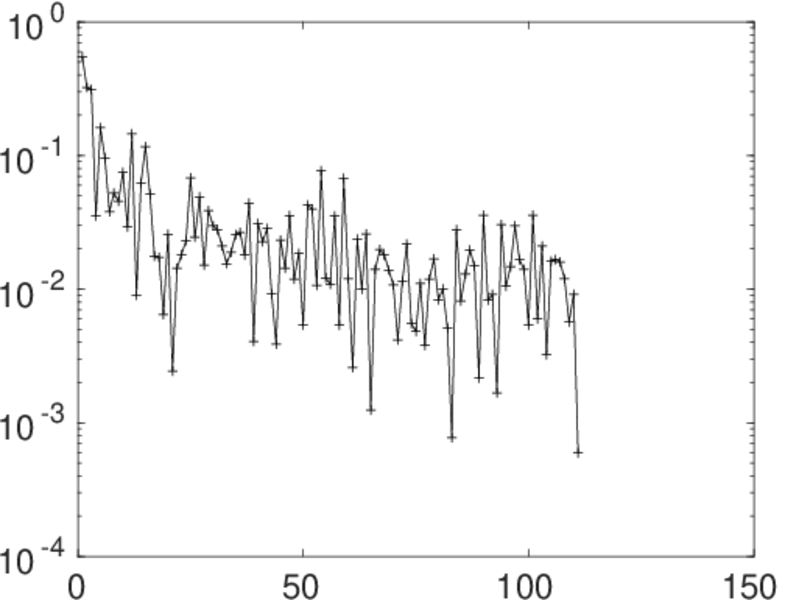
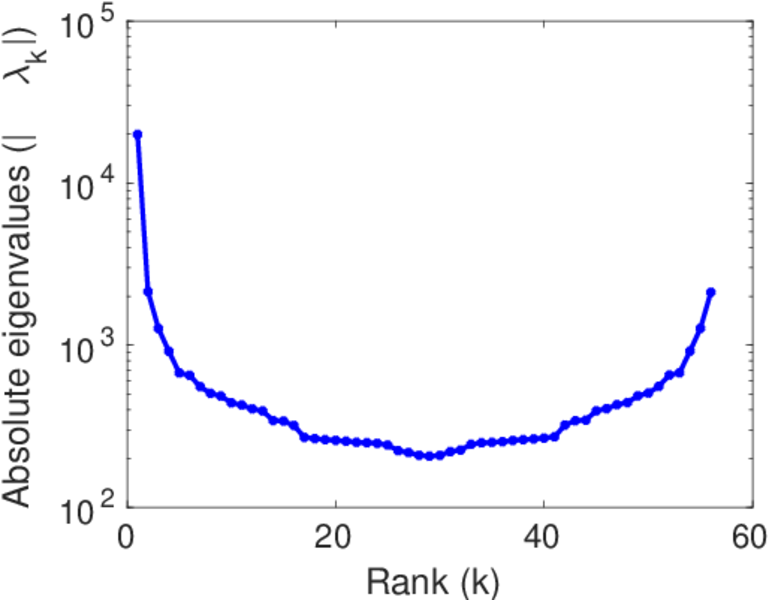
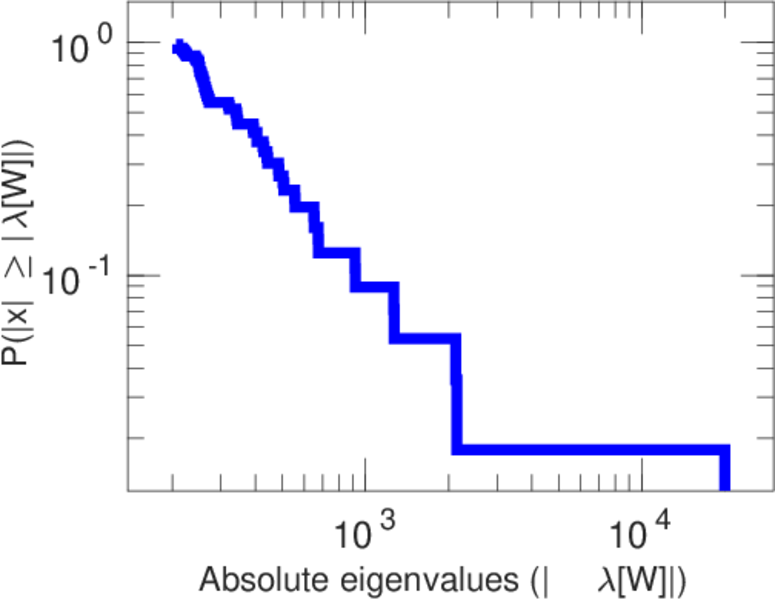
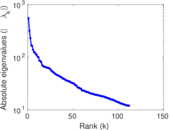
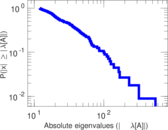
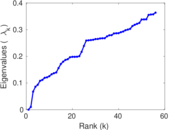
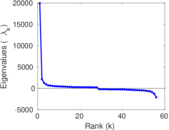
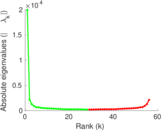
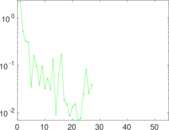
Matrix decompositions plots


Downloads
References
|
[1]
|
Jérôme Kunegis.
KONECT – The Koblenz Network Collection.
In Proc. Int. Conf. on World Wide Web Companion, pages
1343–1350, 2013.
[ http ]
|
|
[2]
|
Wikimedia Foundation.
Wikimedia downloads.
http://dumps.wikimedia.org/, January 2010.
|
 KONECT ‣ Networks ‣
Buy Me a Coffee
KONECT ‣ Networks ‣
Buy Me a Coffee