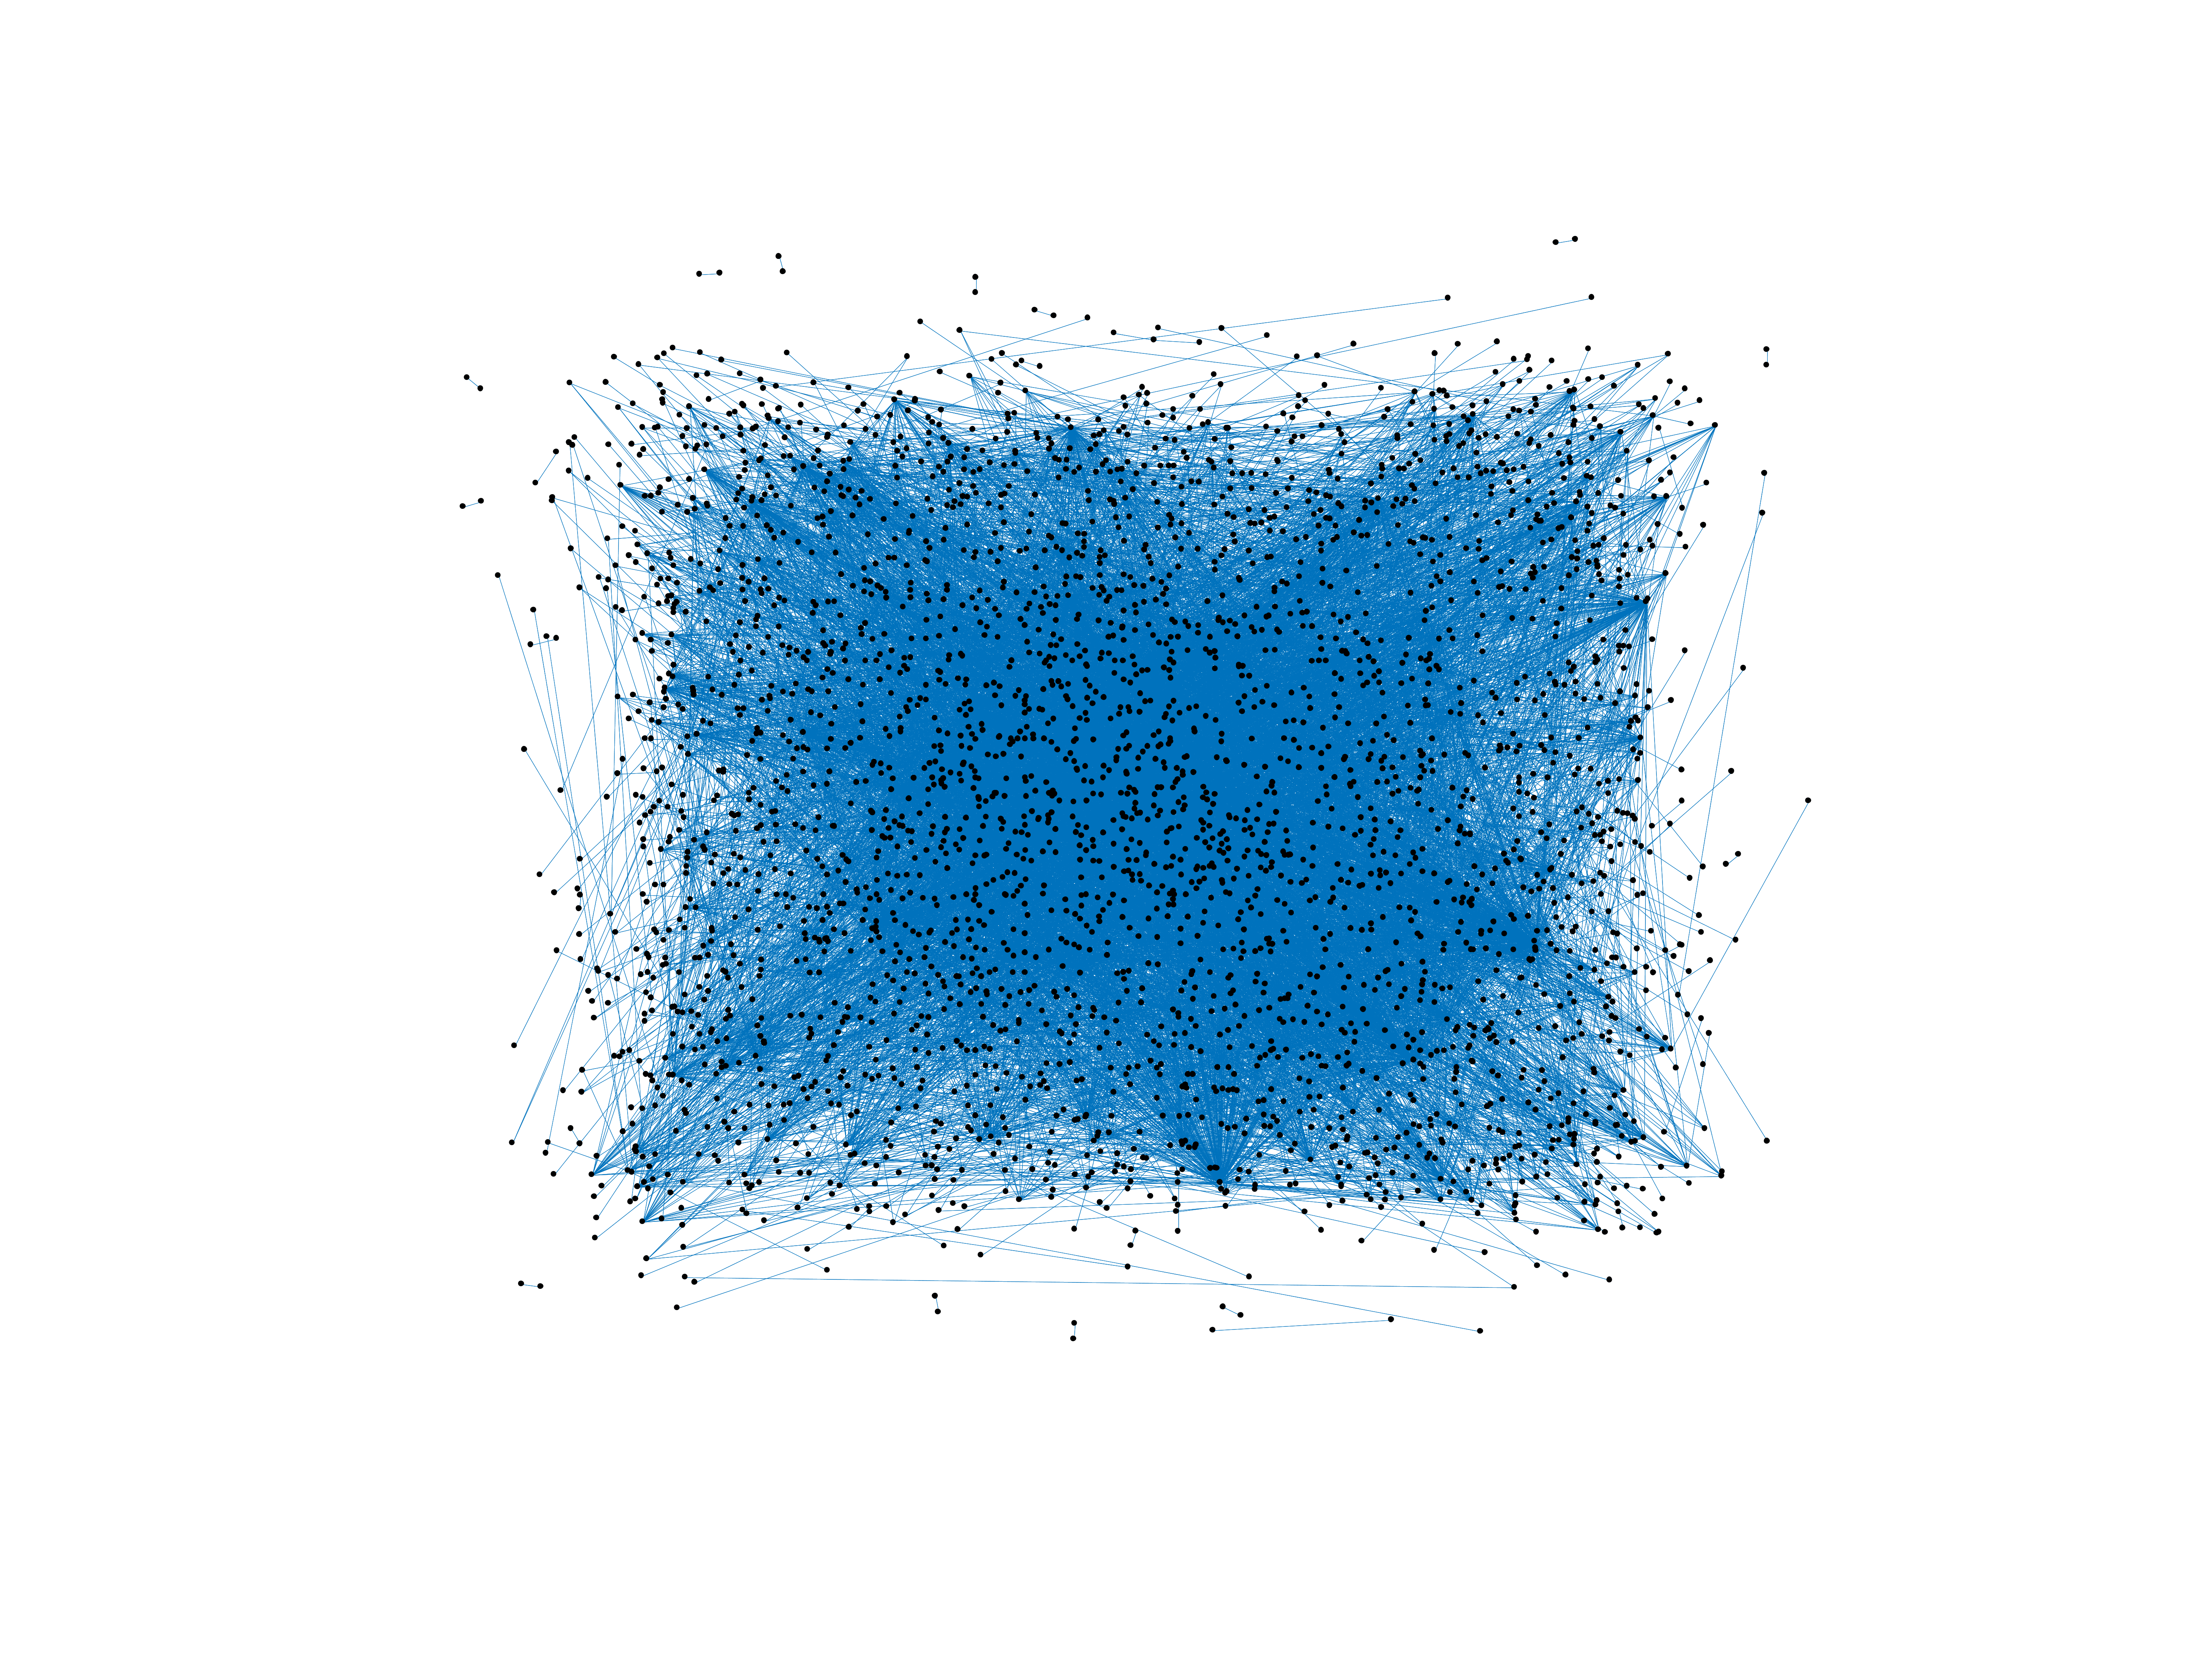
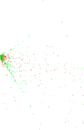
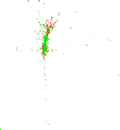
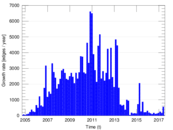
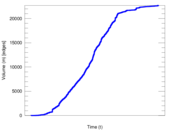
Wikipedia edits (cr)
This is the bipartite edit network of the Cree Wikipedia. It contains users and
pages from the Cree Wikipedia, connected by edit events. Each edge represents
an edit. The dataset includes the timestamp of each edit.
Metadata
Statistics
| Size | n = | 3,322
|
| Left size | n1 = | 1,188
|
| Right size | n2 = | 2,134
|
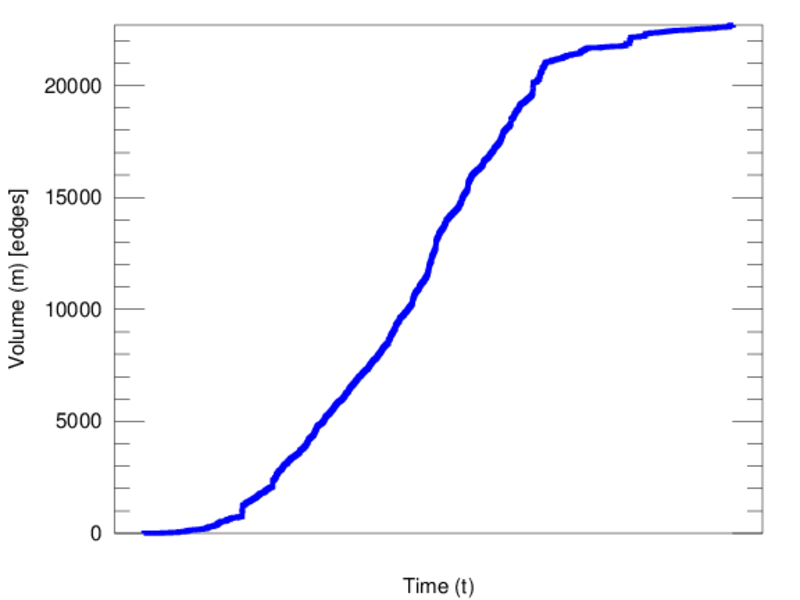
| Volume | m = | 22,700
|
| Unique edge count | m̿ = | 9,554
|
| Wedge count | s = | 627,357
|
| Claw count | z = | 45,525,555
|
| Cross count | x = | 3,824,843,026
|
| Square count | q = | 1,546,661
|
| 4-Tour count | T4 = | 14,907,168
|
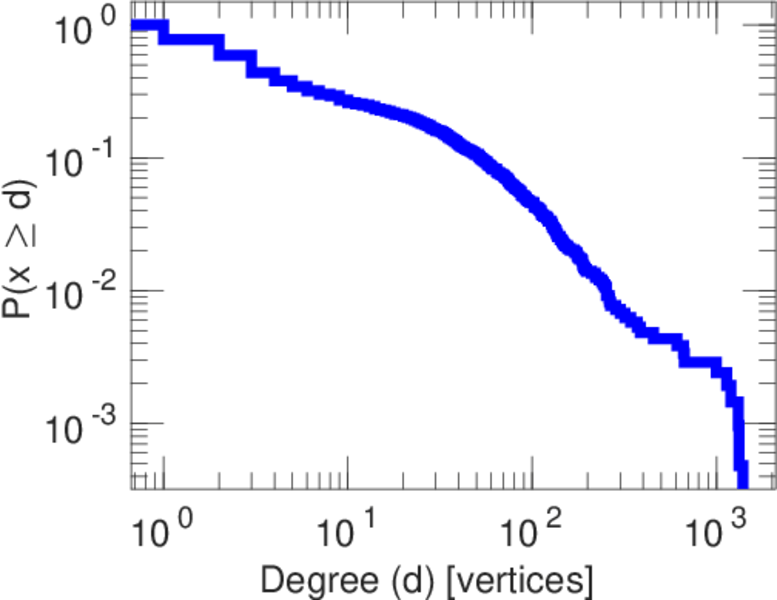
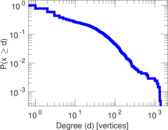
| Maximum degree | dmax = | 1,332
|
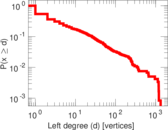
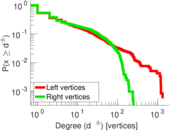
| Maximum left degree | d1max = | 1,332
|
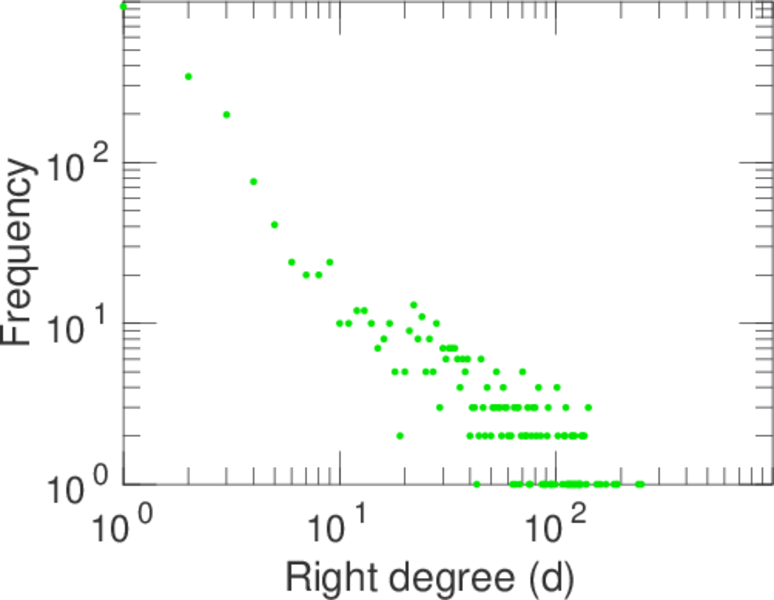
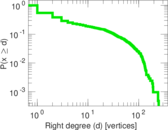
| Maximum right degree | d2max = | 248
|
| Average degree | d = | 13.666 5
|
| Average left degree | d1 = | 19.107 7
|
| Average right degree | d2 = | 10.637 3
|
| Fill | p = | 0.003 768 55
|
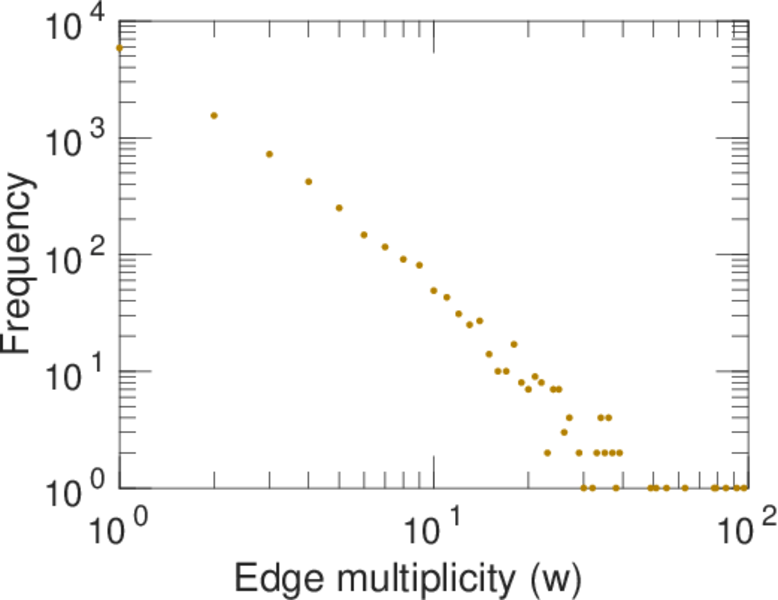
| Average edge multiplicity | m̃ = | 2.375 97
|
| Size of LCC | N = | 2,649
|
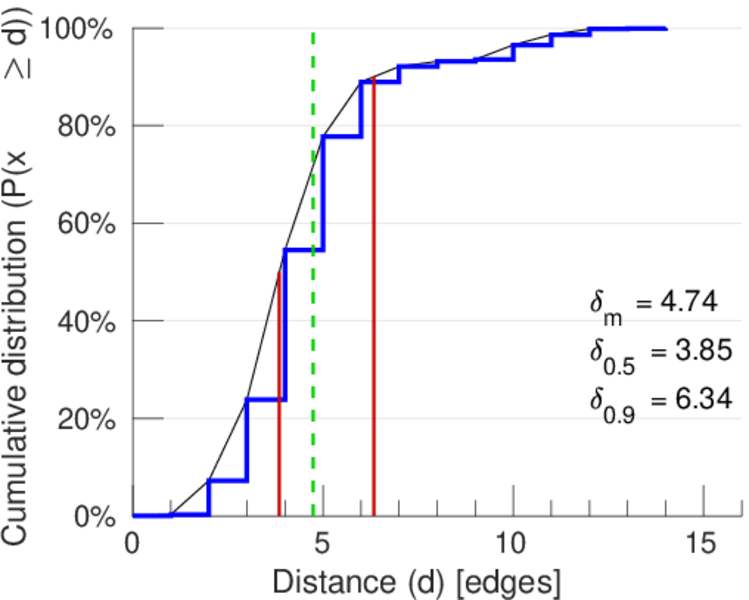
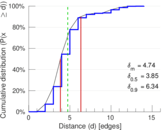
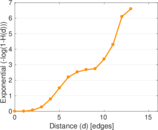
| Diameter | δ = | 15
|
| 50-Percentile effective diameter | δ0.5 = | 3.854 62
|
| 90-Percentile effective diameter | δ0.9 = | 6.337 53
|
| Median distance | δM = | 4
|
| Mean distance | δm = | 4.739 54
|
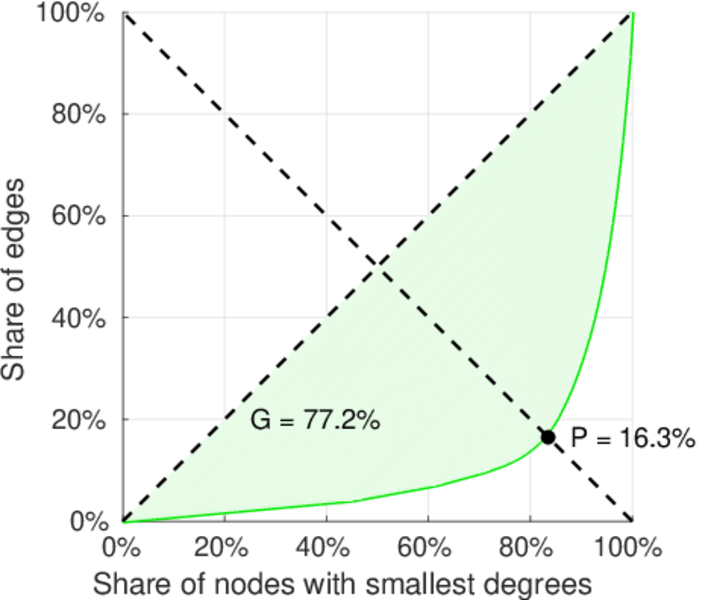
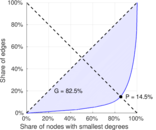
| Gini coefficient | G = | 0.801 581
|
| Balanced inequality ratio | P = | 0.167 181
|
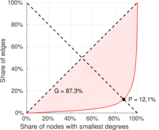
| Left balanced inequality ratio | P1 = | 0.120 837
|
| Right balanced inequality ratio | P2 = | 0.163 392
|
| Relative edge distribution entropy | Her = | 0.831 951
|
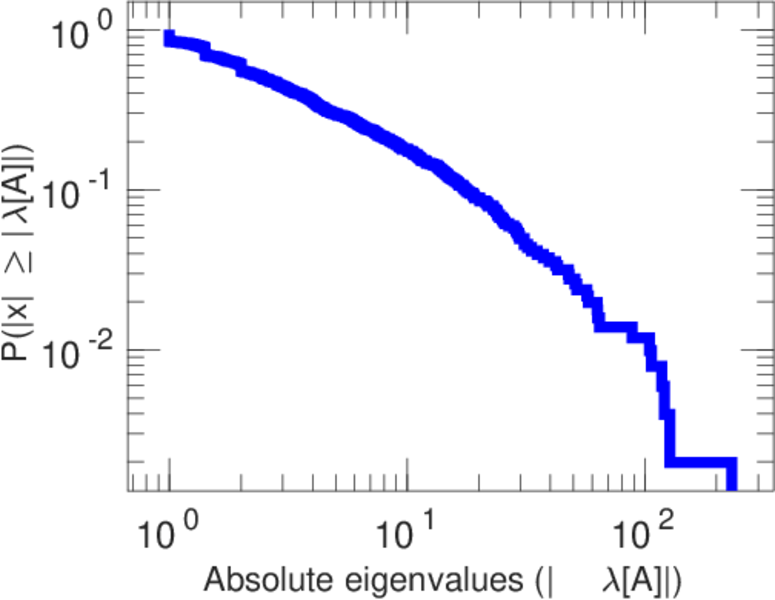
| Power law exponent | γ = | 2.392 24
|
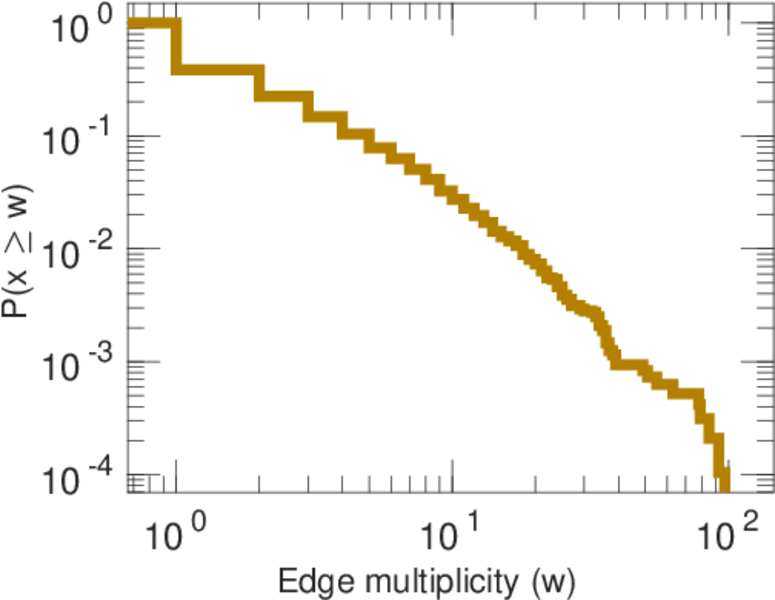
| Tail power law exponent | γt = | 1.861 00
|
| Tail power law exponent with p | γ3 = | 1.861 00
|
| p-value | p = | 0.000 00
|
| Left tail power law exponent with p | γ3,1 = | 1.851 00
|
| Left p-value | p1 = | 0.000 00
|
| Right tail power law exponent with p | γ3,2 = | 1.861 00
|
| Right p-value | p2 = | 0.000 00
|
| Degree assortativity | ρ = | −0.117 696
|
| Degree assortativity p-value | pρ = | 8.029 60 × 10−31
|
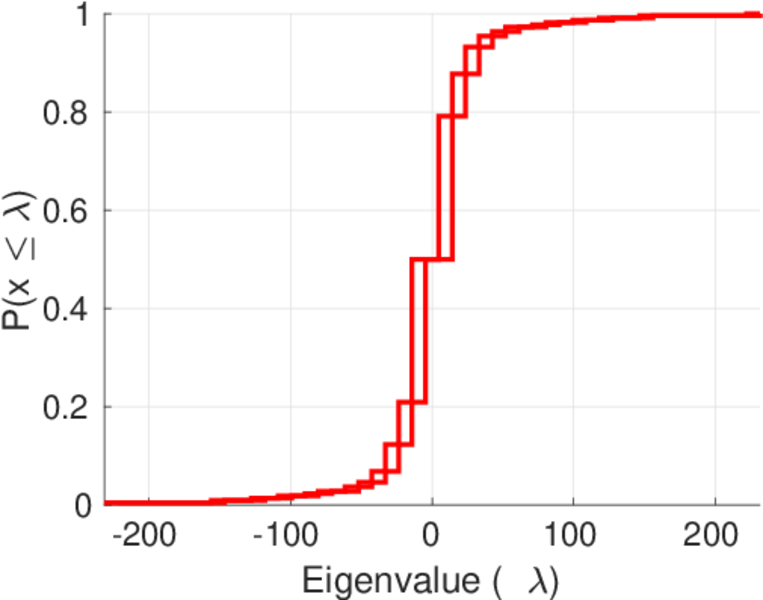
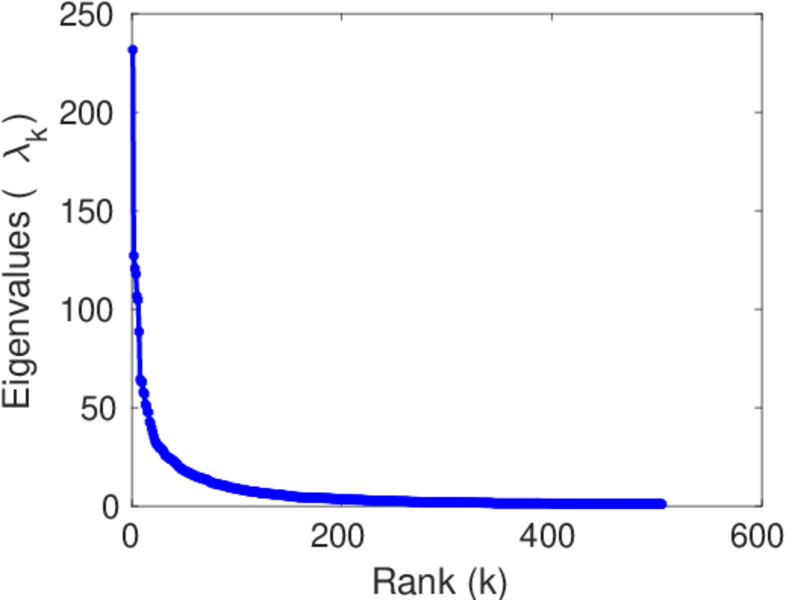
| Spectral norm | α = | 231.599
|
| Algebraic connectivity | a = | 0.009 234 94
|
| Spectral separation | |λ1[A] / λ2[A]| = | 1.821 18
|
| Controllability | C = | 1,758
|
| Relative controllability | Cr = | 0.539 595
|
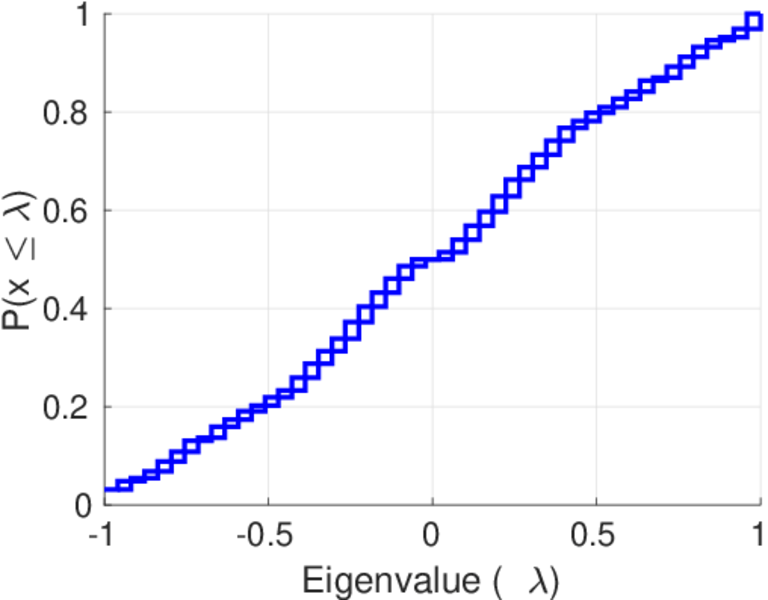
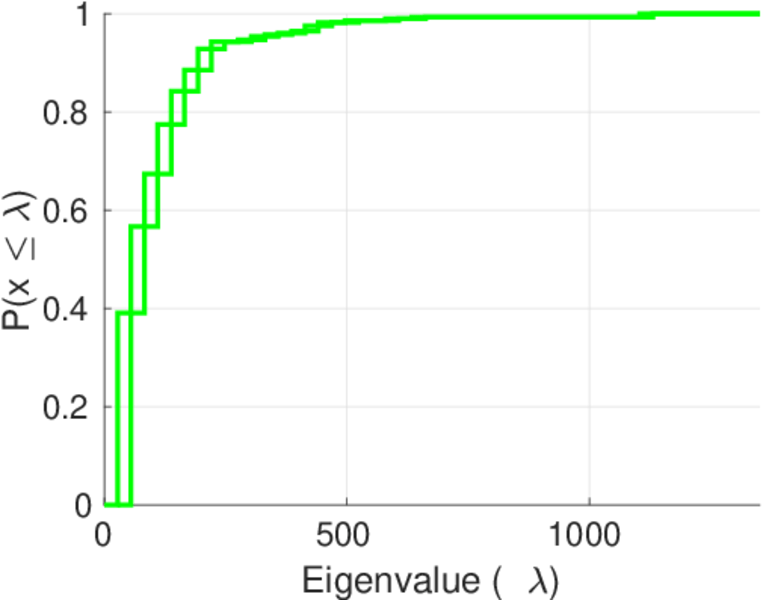
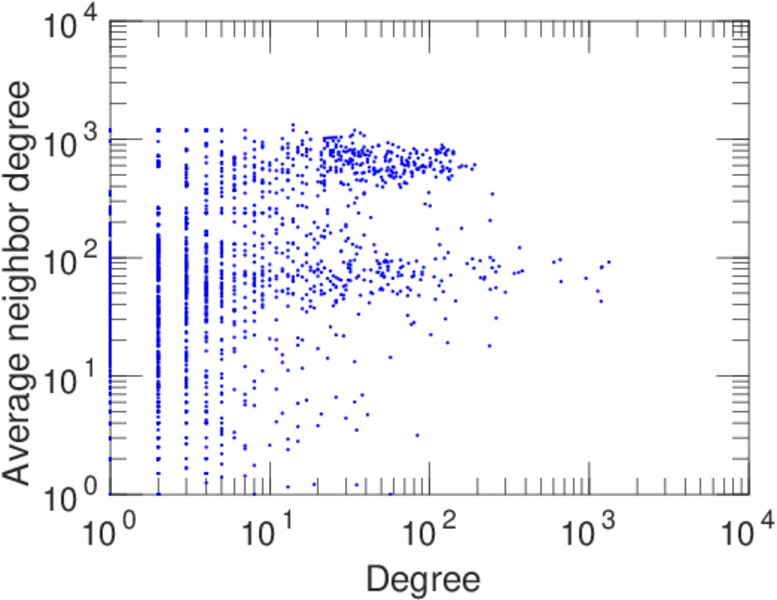
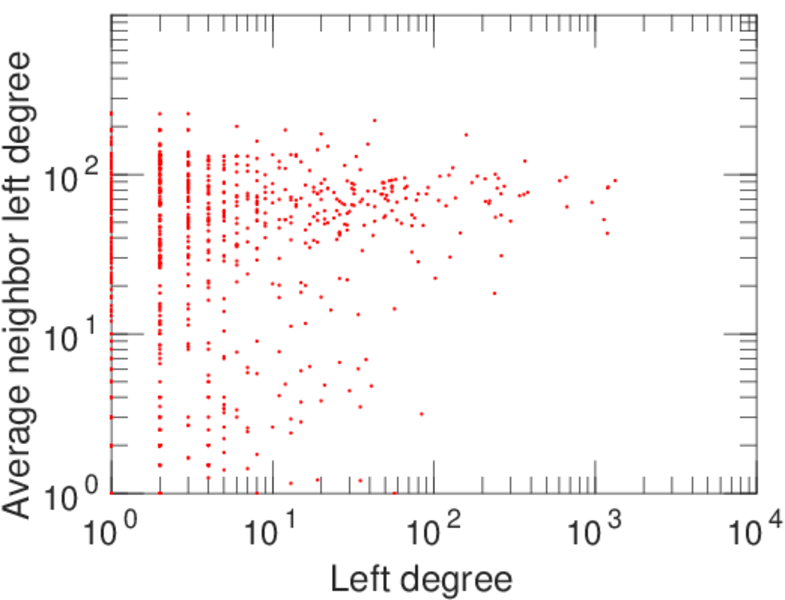
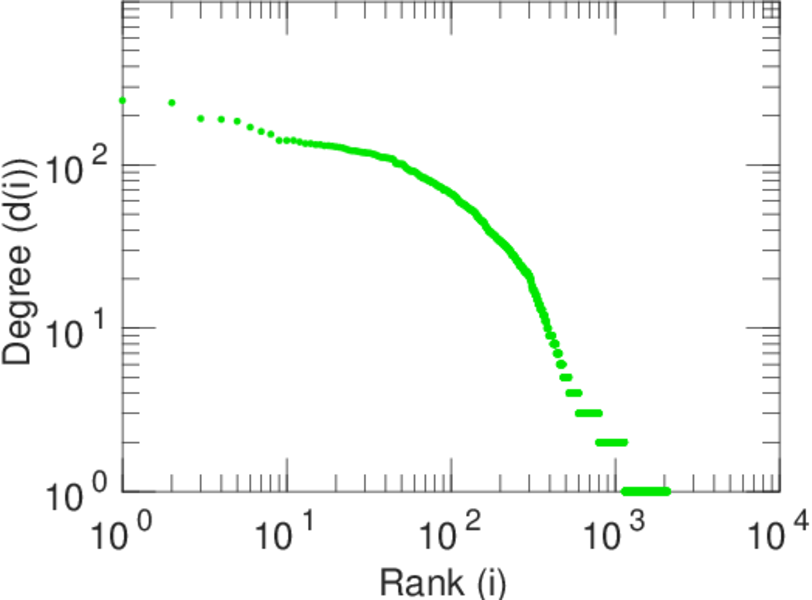
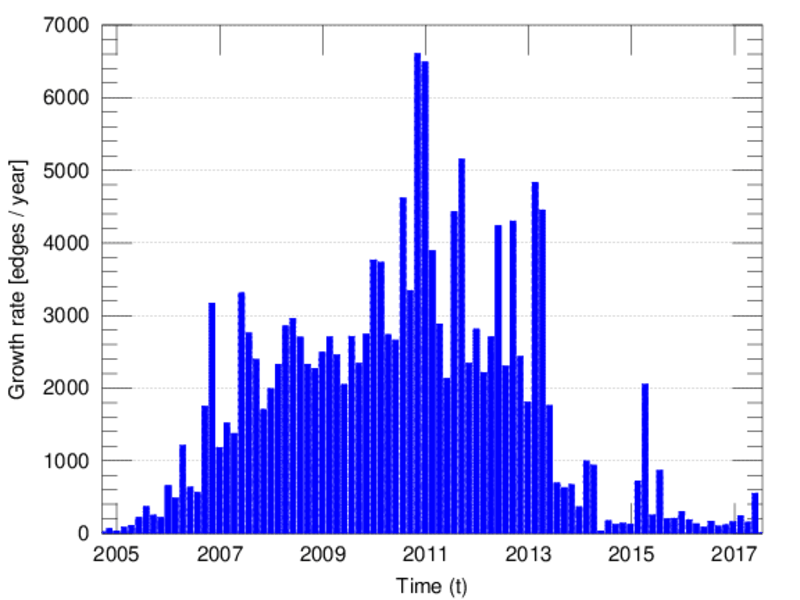
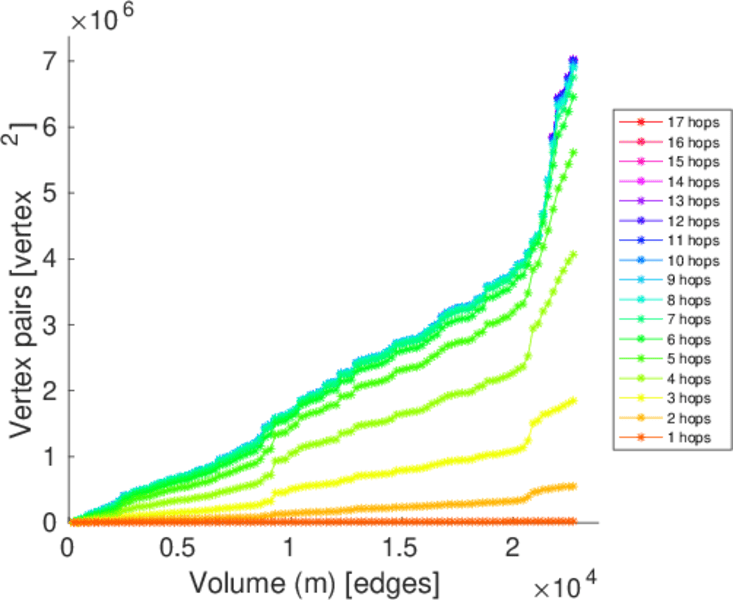
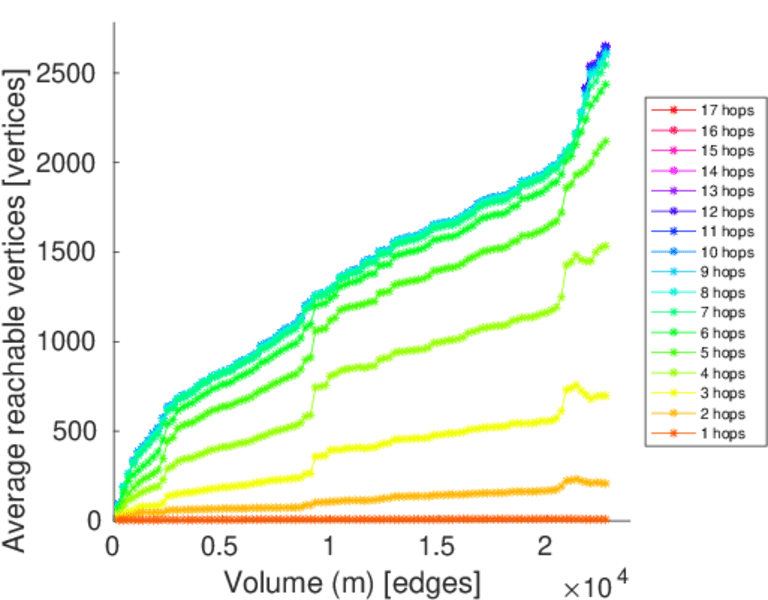
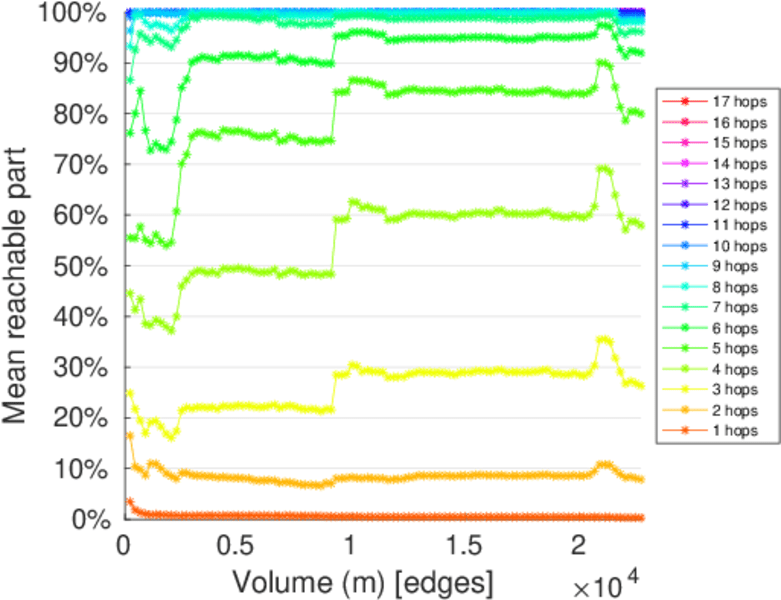
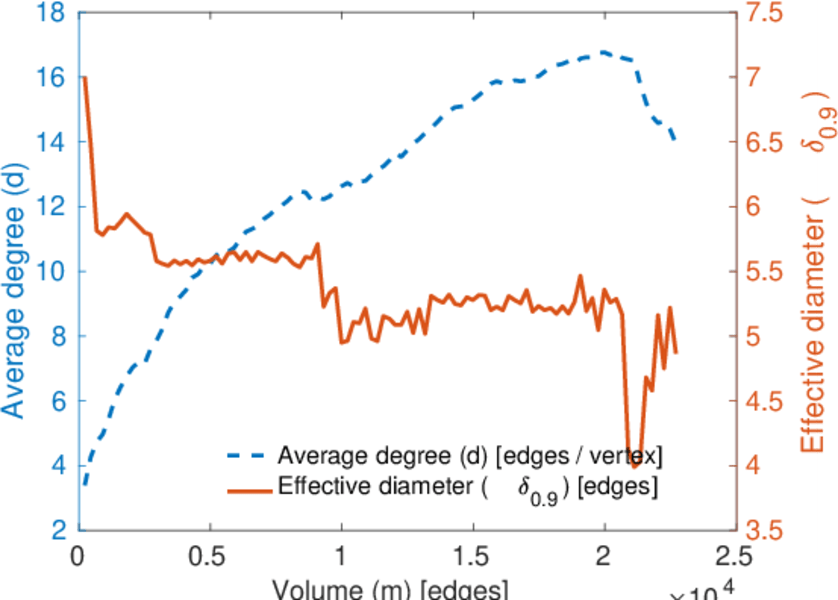
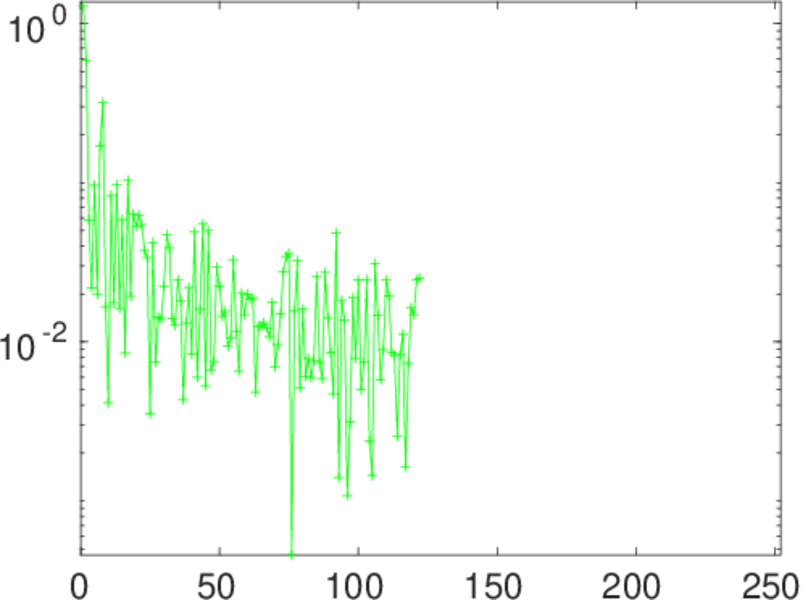
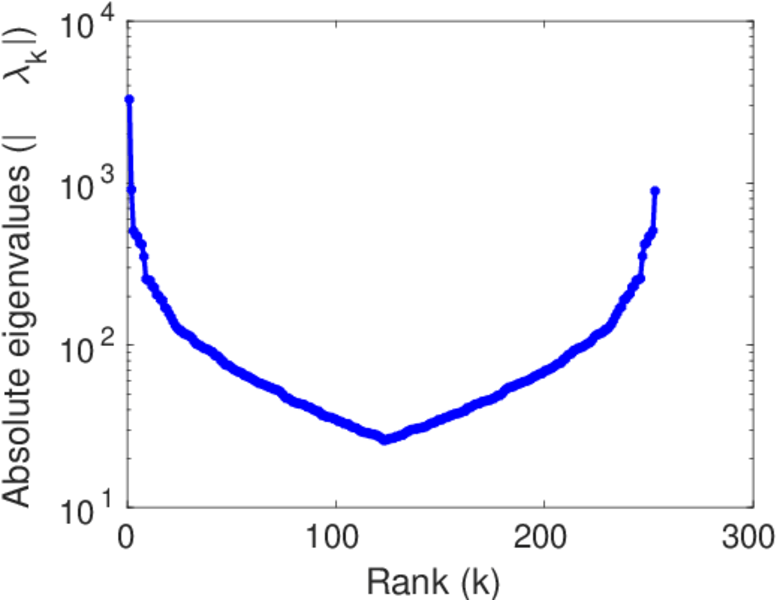
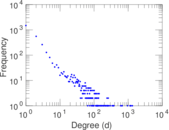
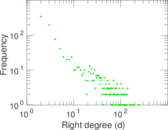
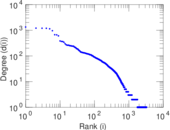
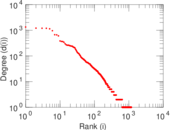
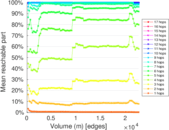
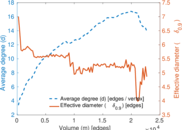
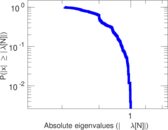
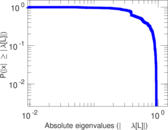
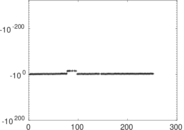
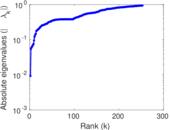
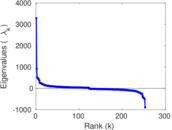
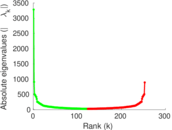
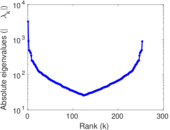
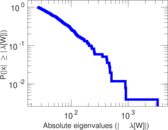
Plots


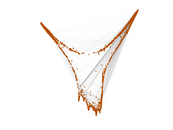


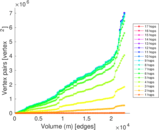

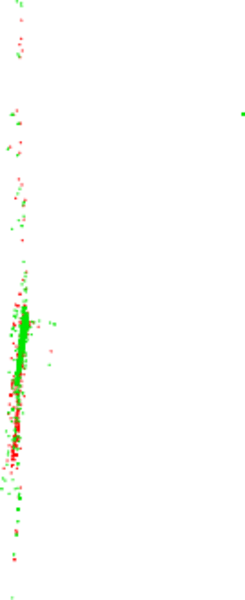
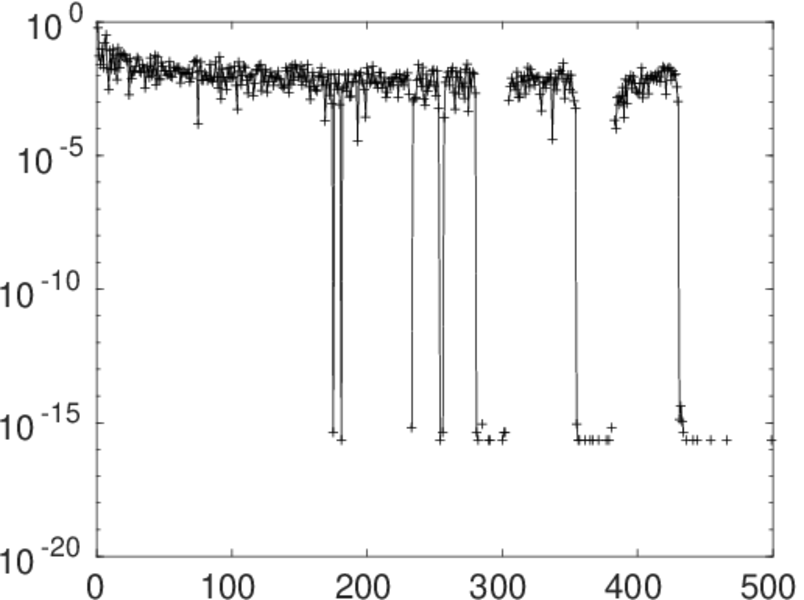
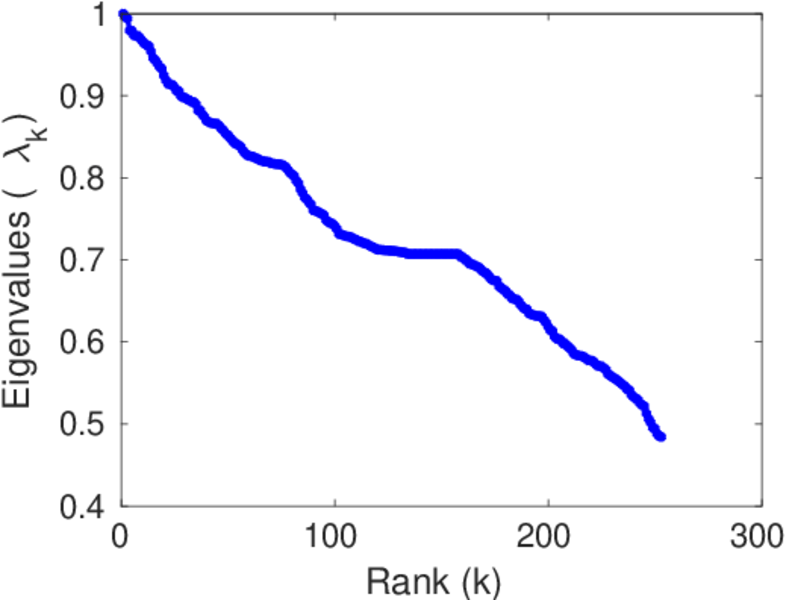
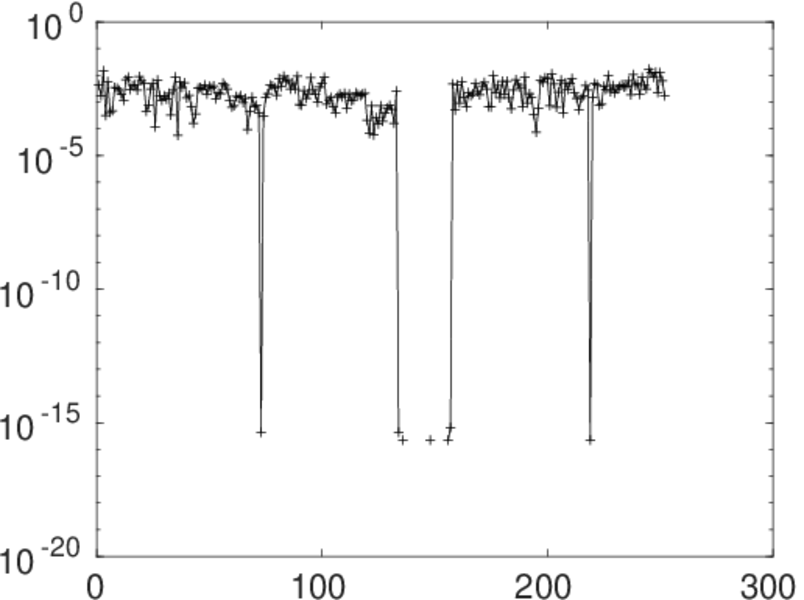
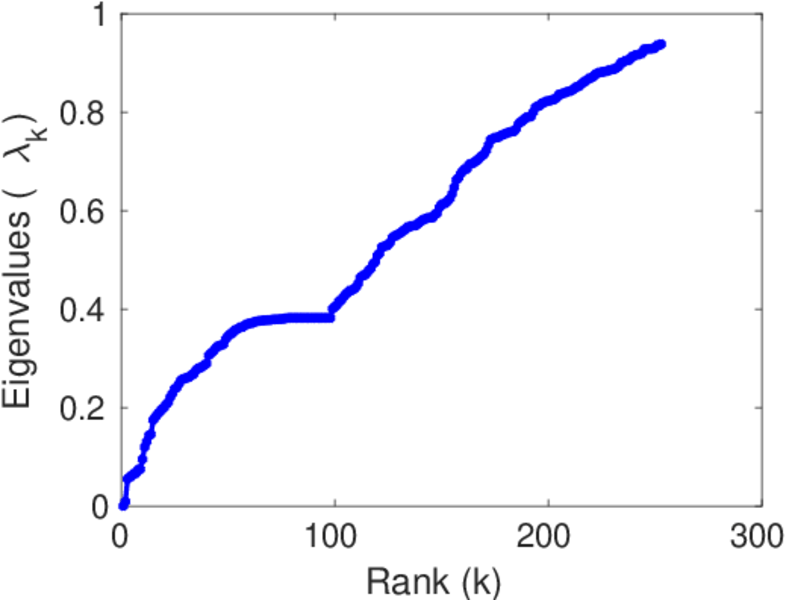
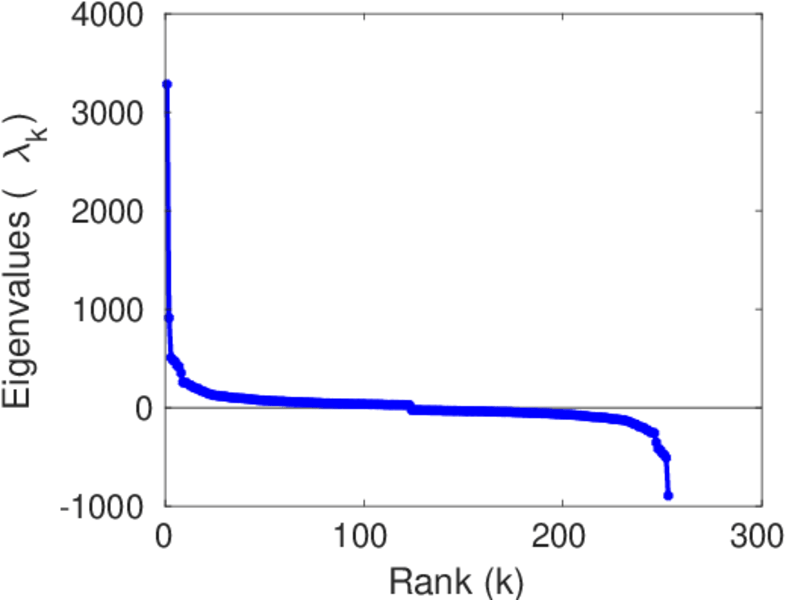
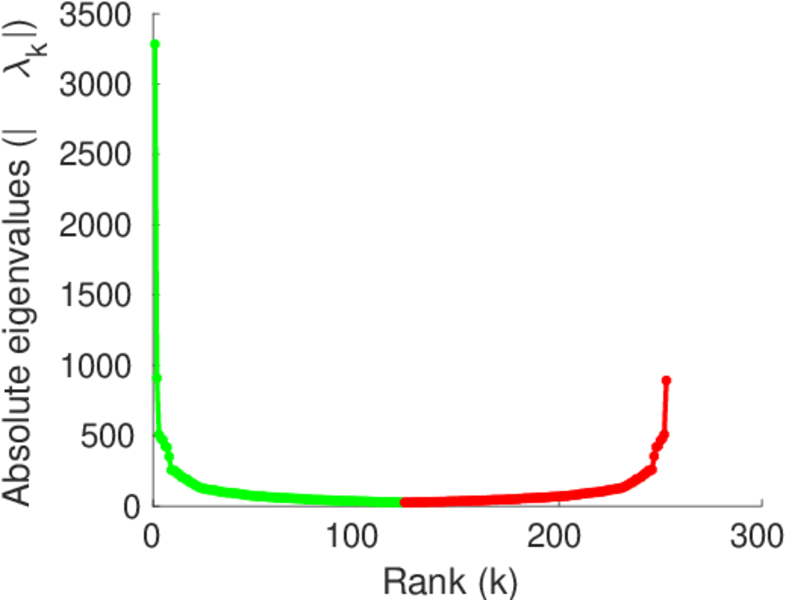
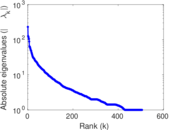
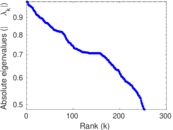
Matrix decompositions plots


Downloads
References
|
[1]
|
Jérôme Kunegis.
KONECT – The Koblenz Network Collection.
In Proc. Int. Conf. on World Wide Web Companion, pages
1343–1350, 2013.
[ http ]
|
|
[2]
|
Wikimedia Foundation.
Wikimedia downloads.
http://dumps.wikimedia.org/, January 2010.
|
 KONECT ‣ Networks ‣
Buy Me a Coffee
KONECT ‣ Networks ‣
Buy Me a Coffee