Wikipedia edits (csb)
This is the bipartite edit network of the Kashubian Wikipedia. It contains
users and pages from the Kashubian Wikipedia, connected by edit events. Each
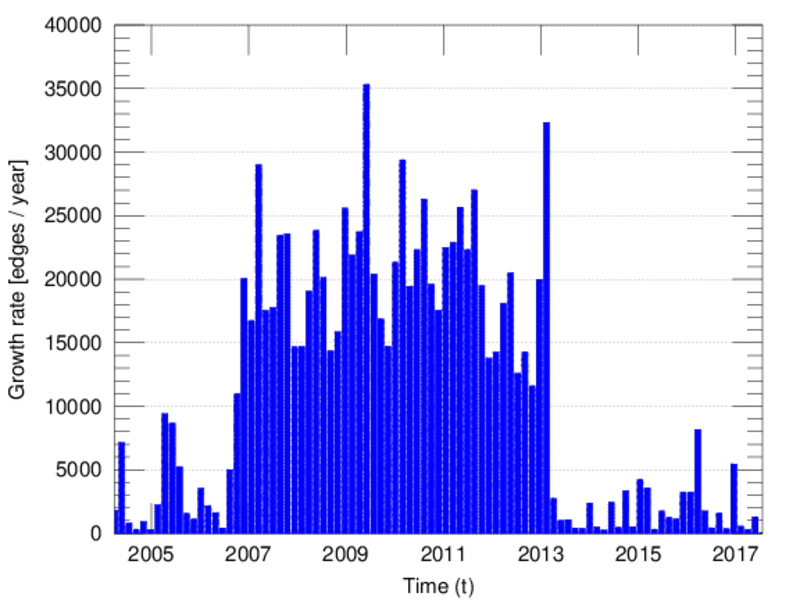
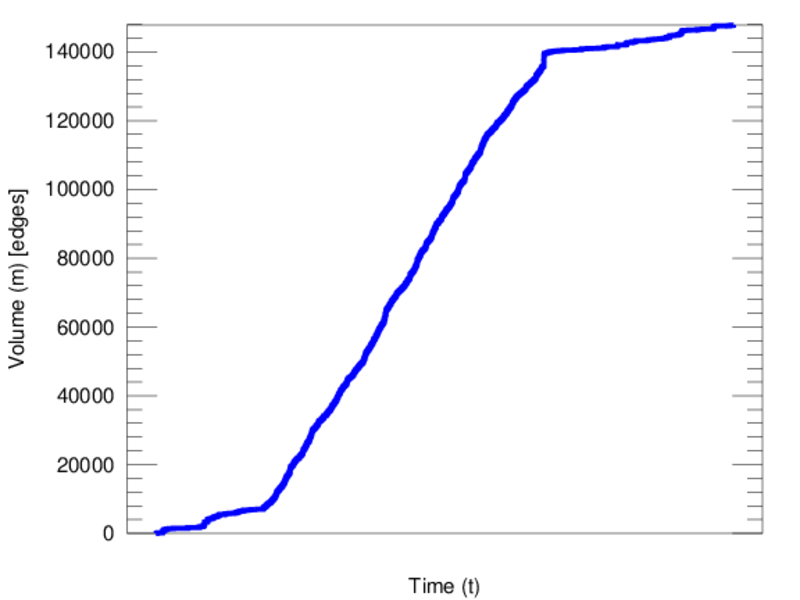
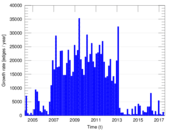
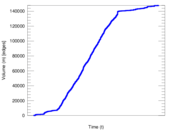
edge represents an edit. The dataset includes the timestamp of each edit.
Metadata
Statistics
| Size | n = | 9,613
|
| Left size | n1 = | 1,331
|
| Right size | n2 = | 8,282
|
| Volume | m = | 147,841
|
| Unique edge count | m̿ = | 62,081
|
| Wedge count | s = | 35,646,150
|
| Claw count | z = | 21,051,031,164
|
| Cross count | x = | 11,678,560,363,265
|
| Square count | q = | 166,854,596
|
| 4-Tour count | T4 = | 1,477,603,506
|
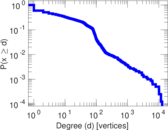
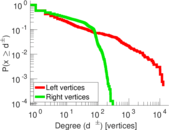
| Maximum degree | dmax = | 12,764
|
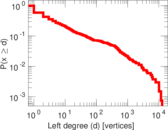
| Maximum left degree | d1max = | 12,764
|
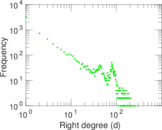
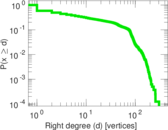
| Maximum right degree | d2max = | 304
|
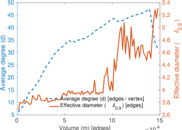
| Average degree | d = | 30.758 6
|
| Average left degree | d1 = | 111.075
|
| Average right degree | d2 = | 17.850 9
|
| Fill | p = | 0.005 631 78
|
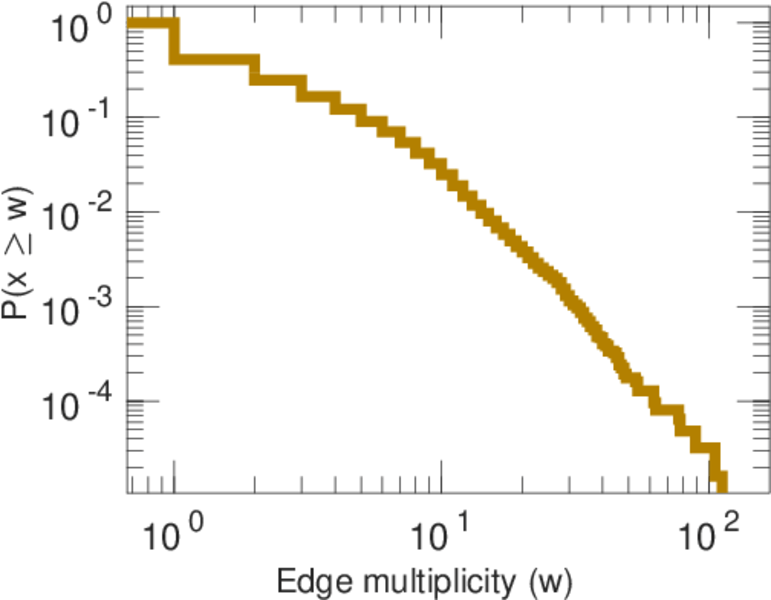
| Average edge multiplicity | m̃ = | 2.381 42
|
| Size of LCC | N = | 8,652
|
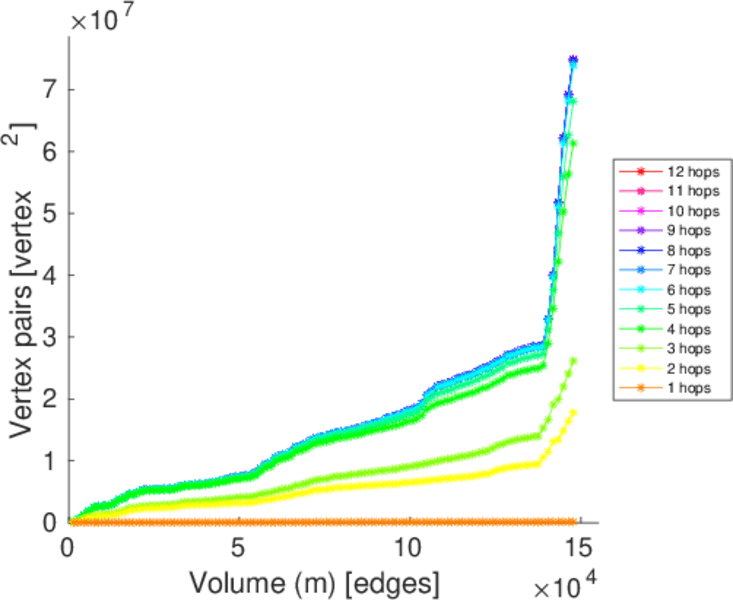
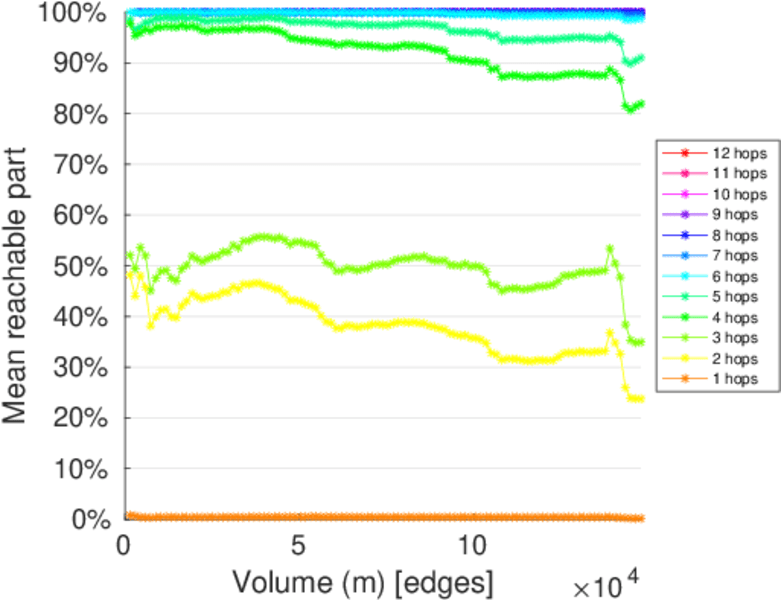
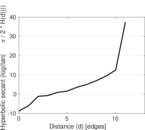
| Diameter | δ = | 12
|
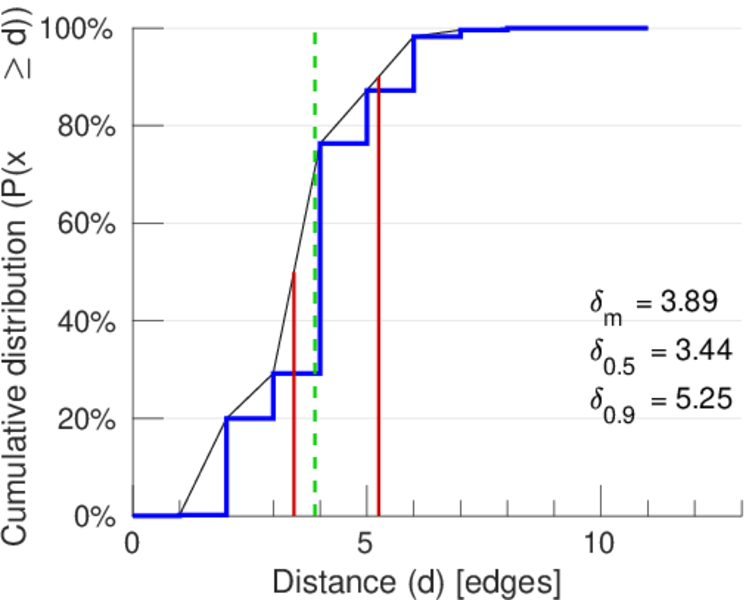
| 50-Percentile effective diameter | δ0.5 = | 3.441 55
|
| 90-Percentile effective diameter | δ0.9 = | 5.250 71
|
| Median distance | δM = | 4
|
| Mean distance | δm = | 3.893 59
|
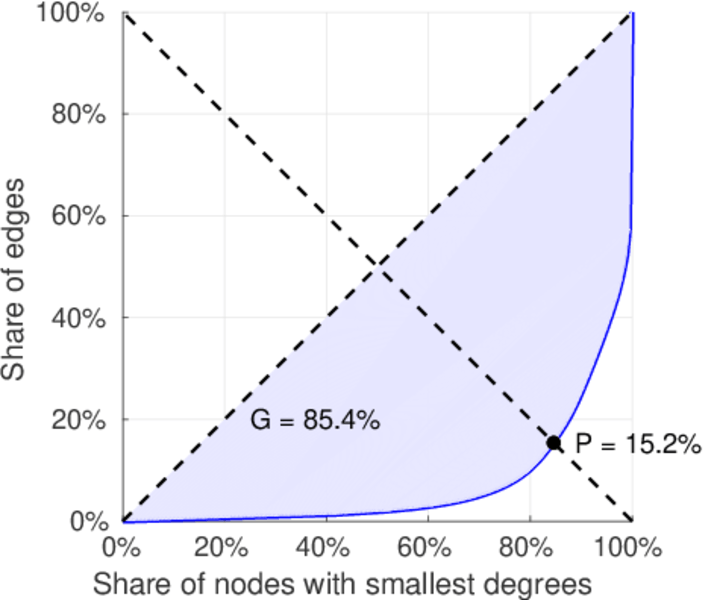
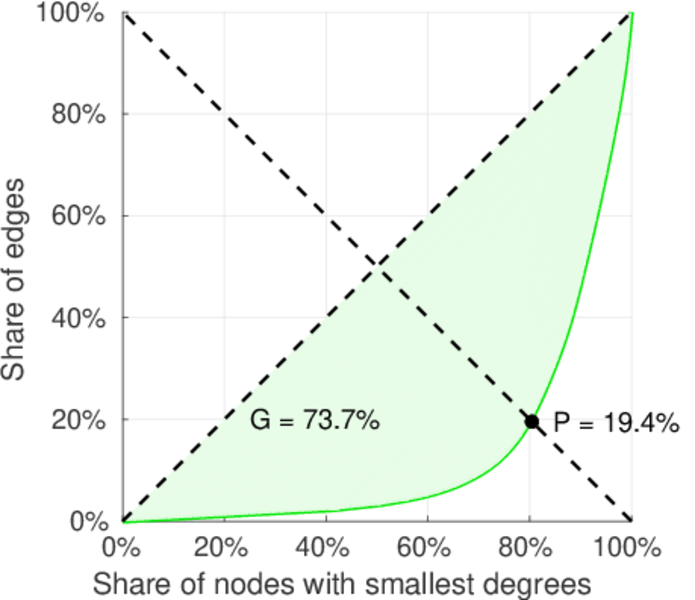
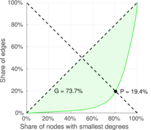
| Gini coefficient | G = | 0.851 596
|
| Balanced inequality ratio | P = | 0.158 643
|
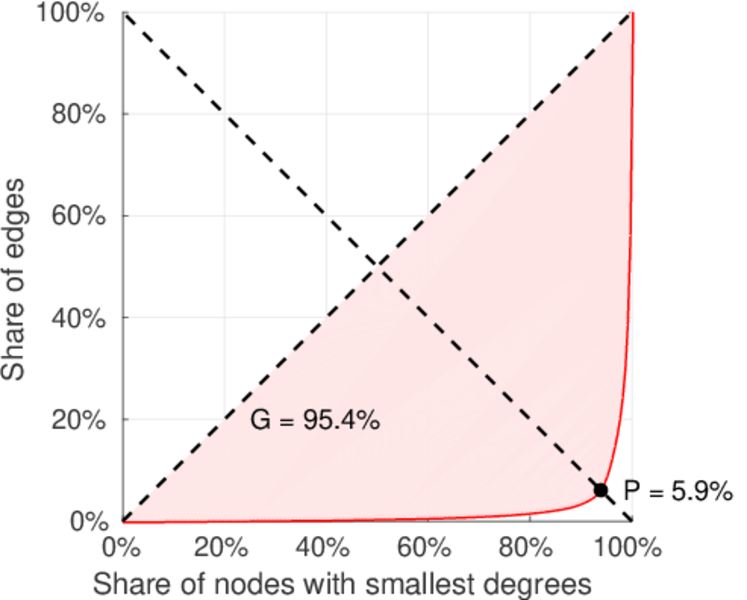
| Left balanced inequality ratio | P1 = | 0.059 347 5
|
| Right balanced inequality ratio | P2 = | 0.193 965
|
| Relative edge distribution entropy | Her = | 0.774 690
|
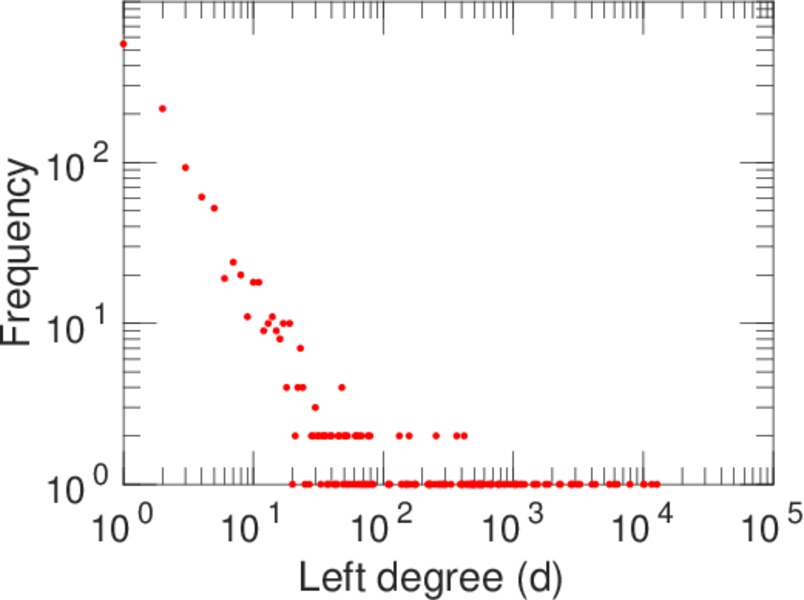
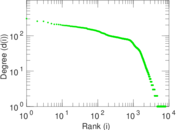
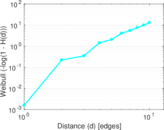
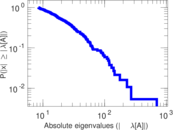
| Power law exponent | γ = | 1.899 96
|
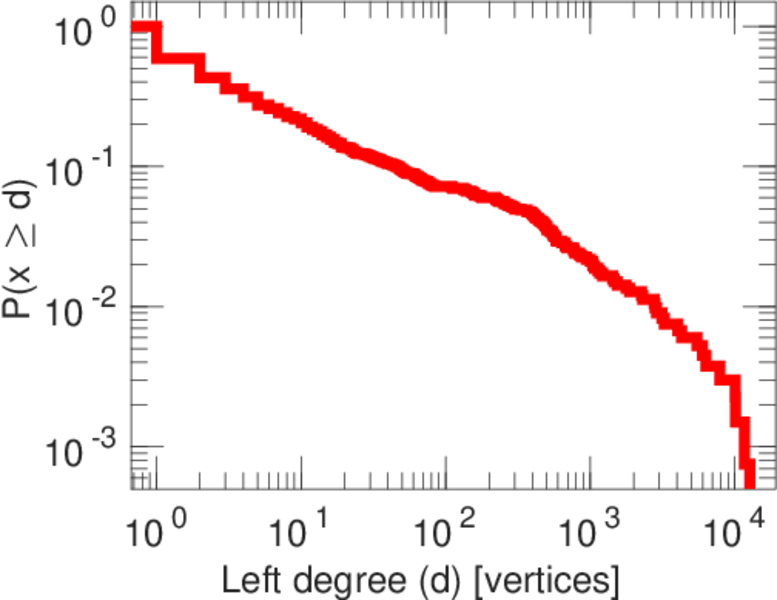
| Tail power law exponent | γt = | 1.631 00
|
| Tail power law exponent with p | γ3 = | 1.631 00
|
| p-value | p = | 0.000 00
|
| Left tail power law exponent with p | γ3,1 = | 1.671 00
|
| Left p-value | p1 = | 0.000 00
|
| Right tail power law exponent with p | γ3,2 = | 8.911 00
|
| Right p-value | p2 = | 0.243 000
|
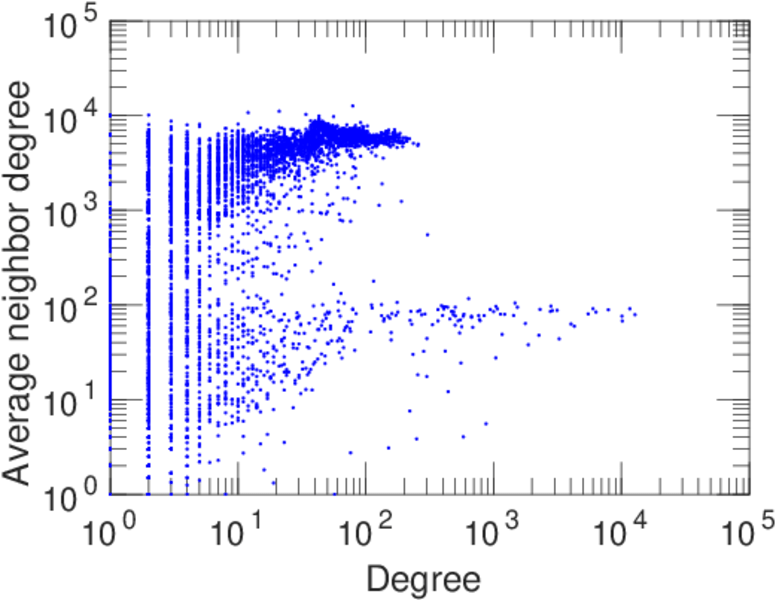
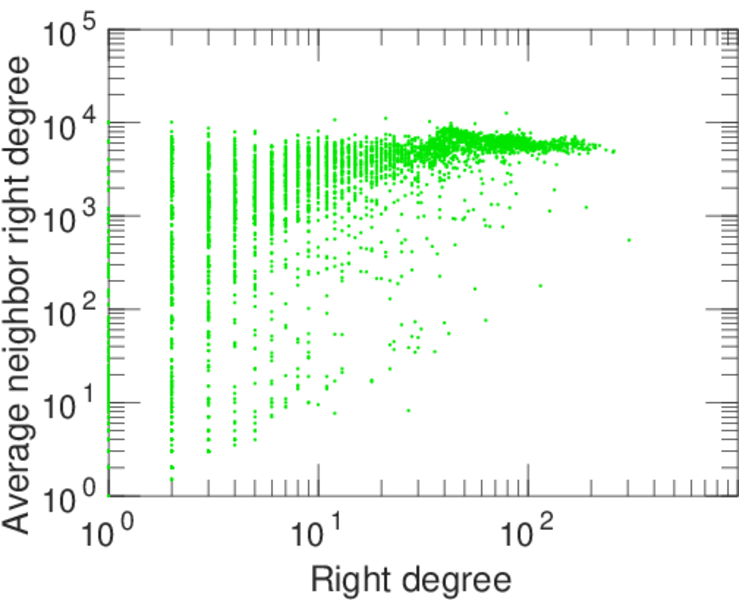
| Degree assortativity | ρ = | −0.057 567 2
|
| Degree assortativity p-value | pρ = | 9.899 36 × 10−47
|
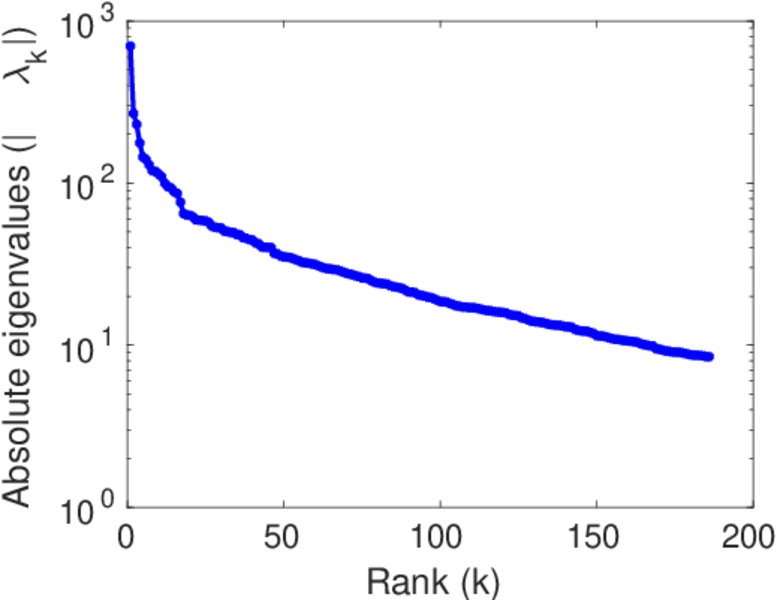
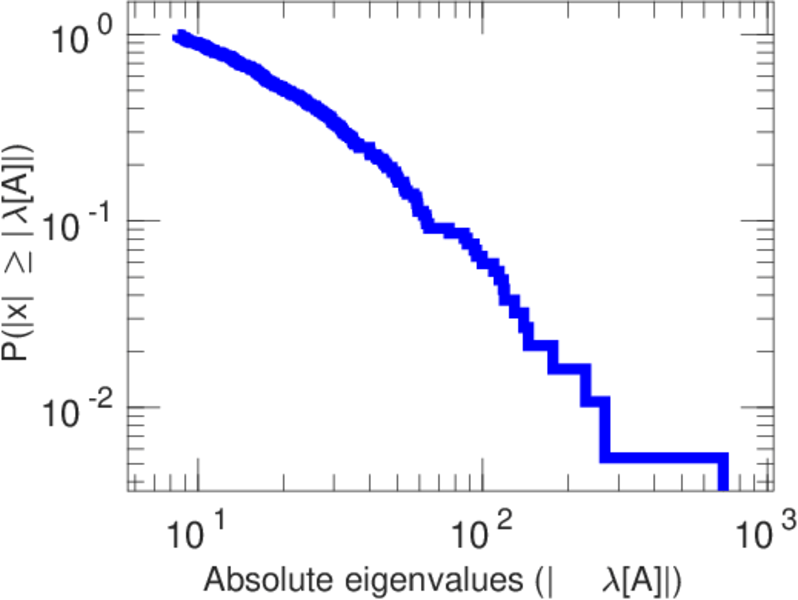
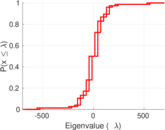
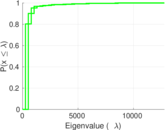
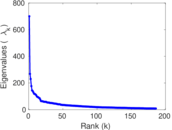
| Spectral norm | α = | 700.298
|
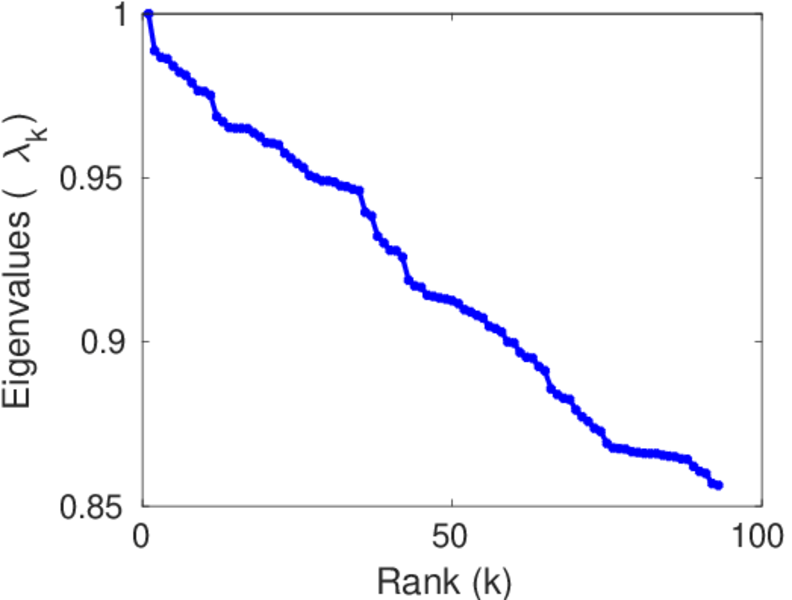
| Algebraic connectivity | a = | 0.024 062 4
|
| Spectral separation | |λ1[A] / λ2[A]| = | 2.610 31
|
| Controllability | C = | 6,887
|
| Relative controllability | Cr = | 0.736 814
|
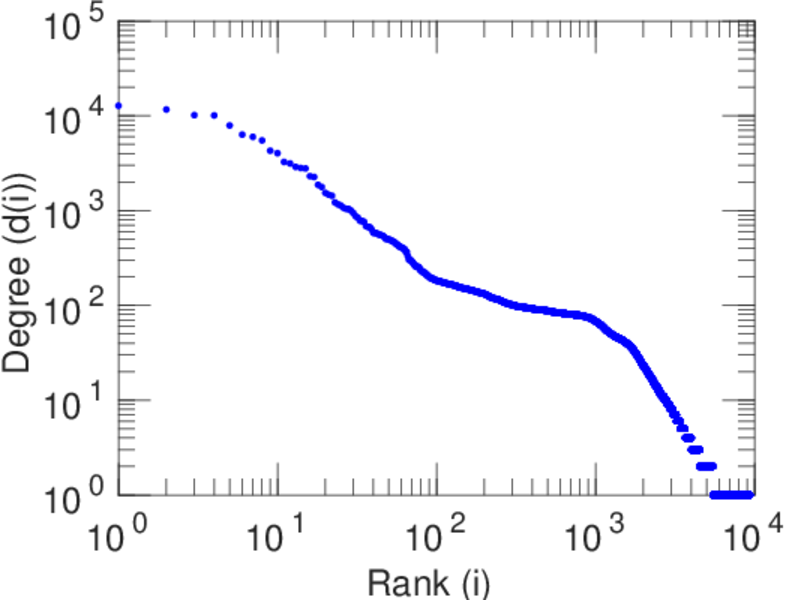
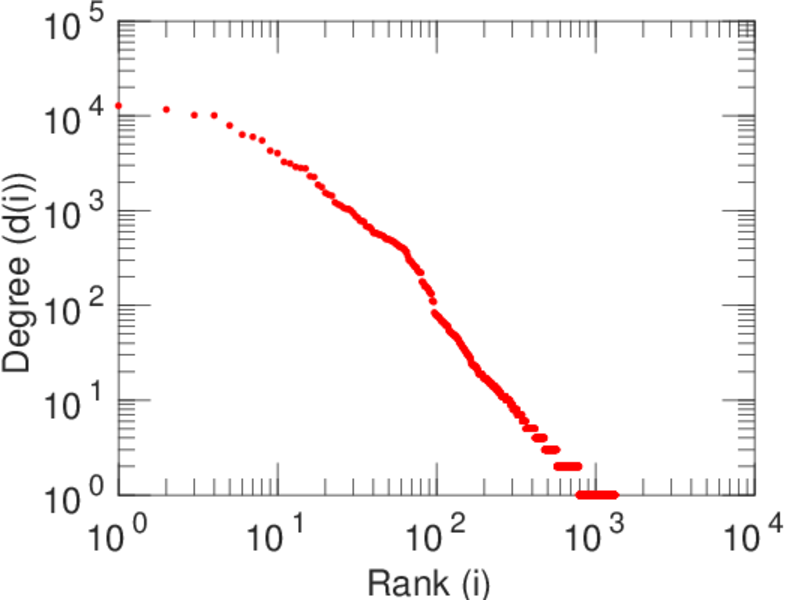
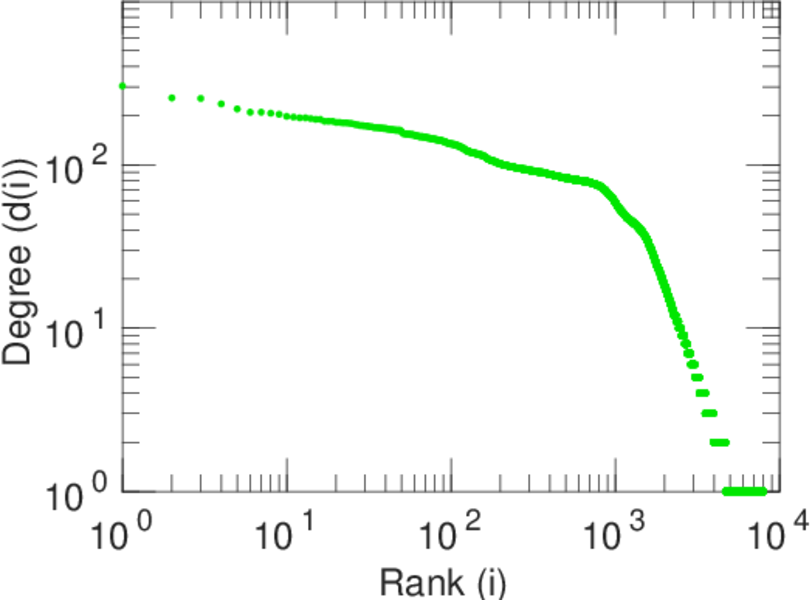
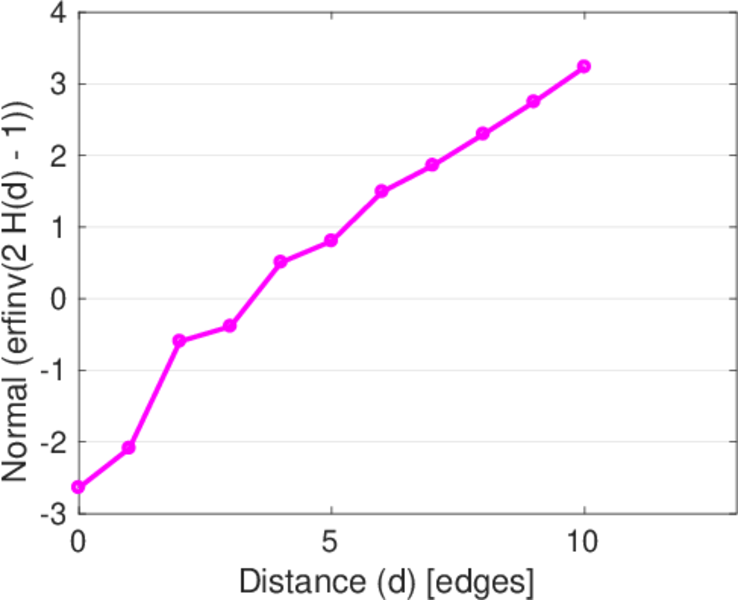
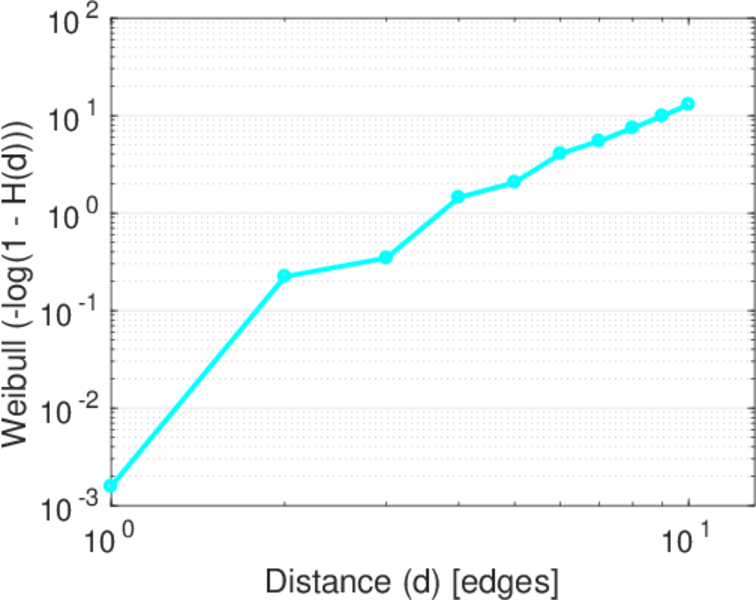
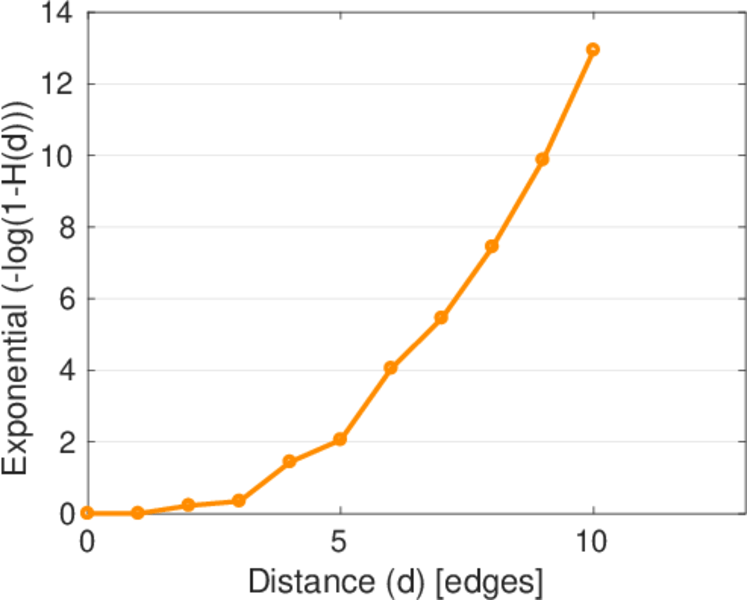
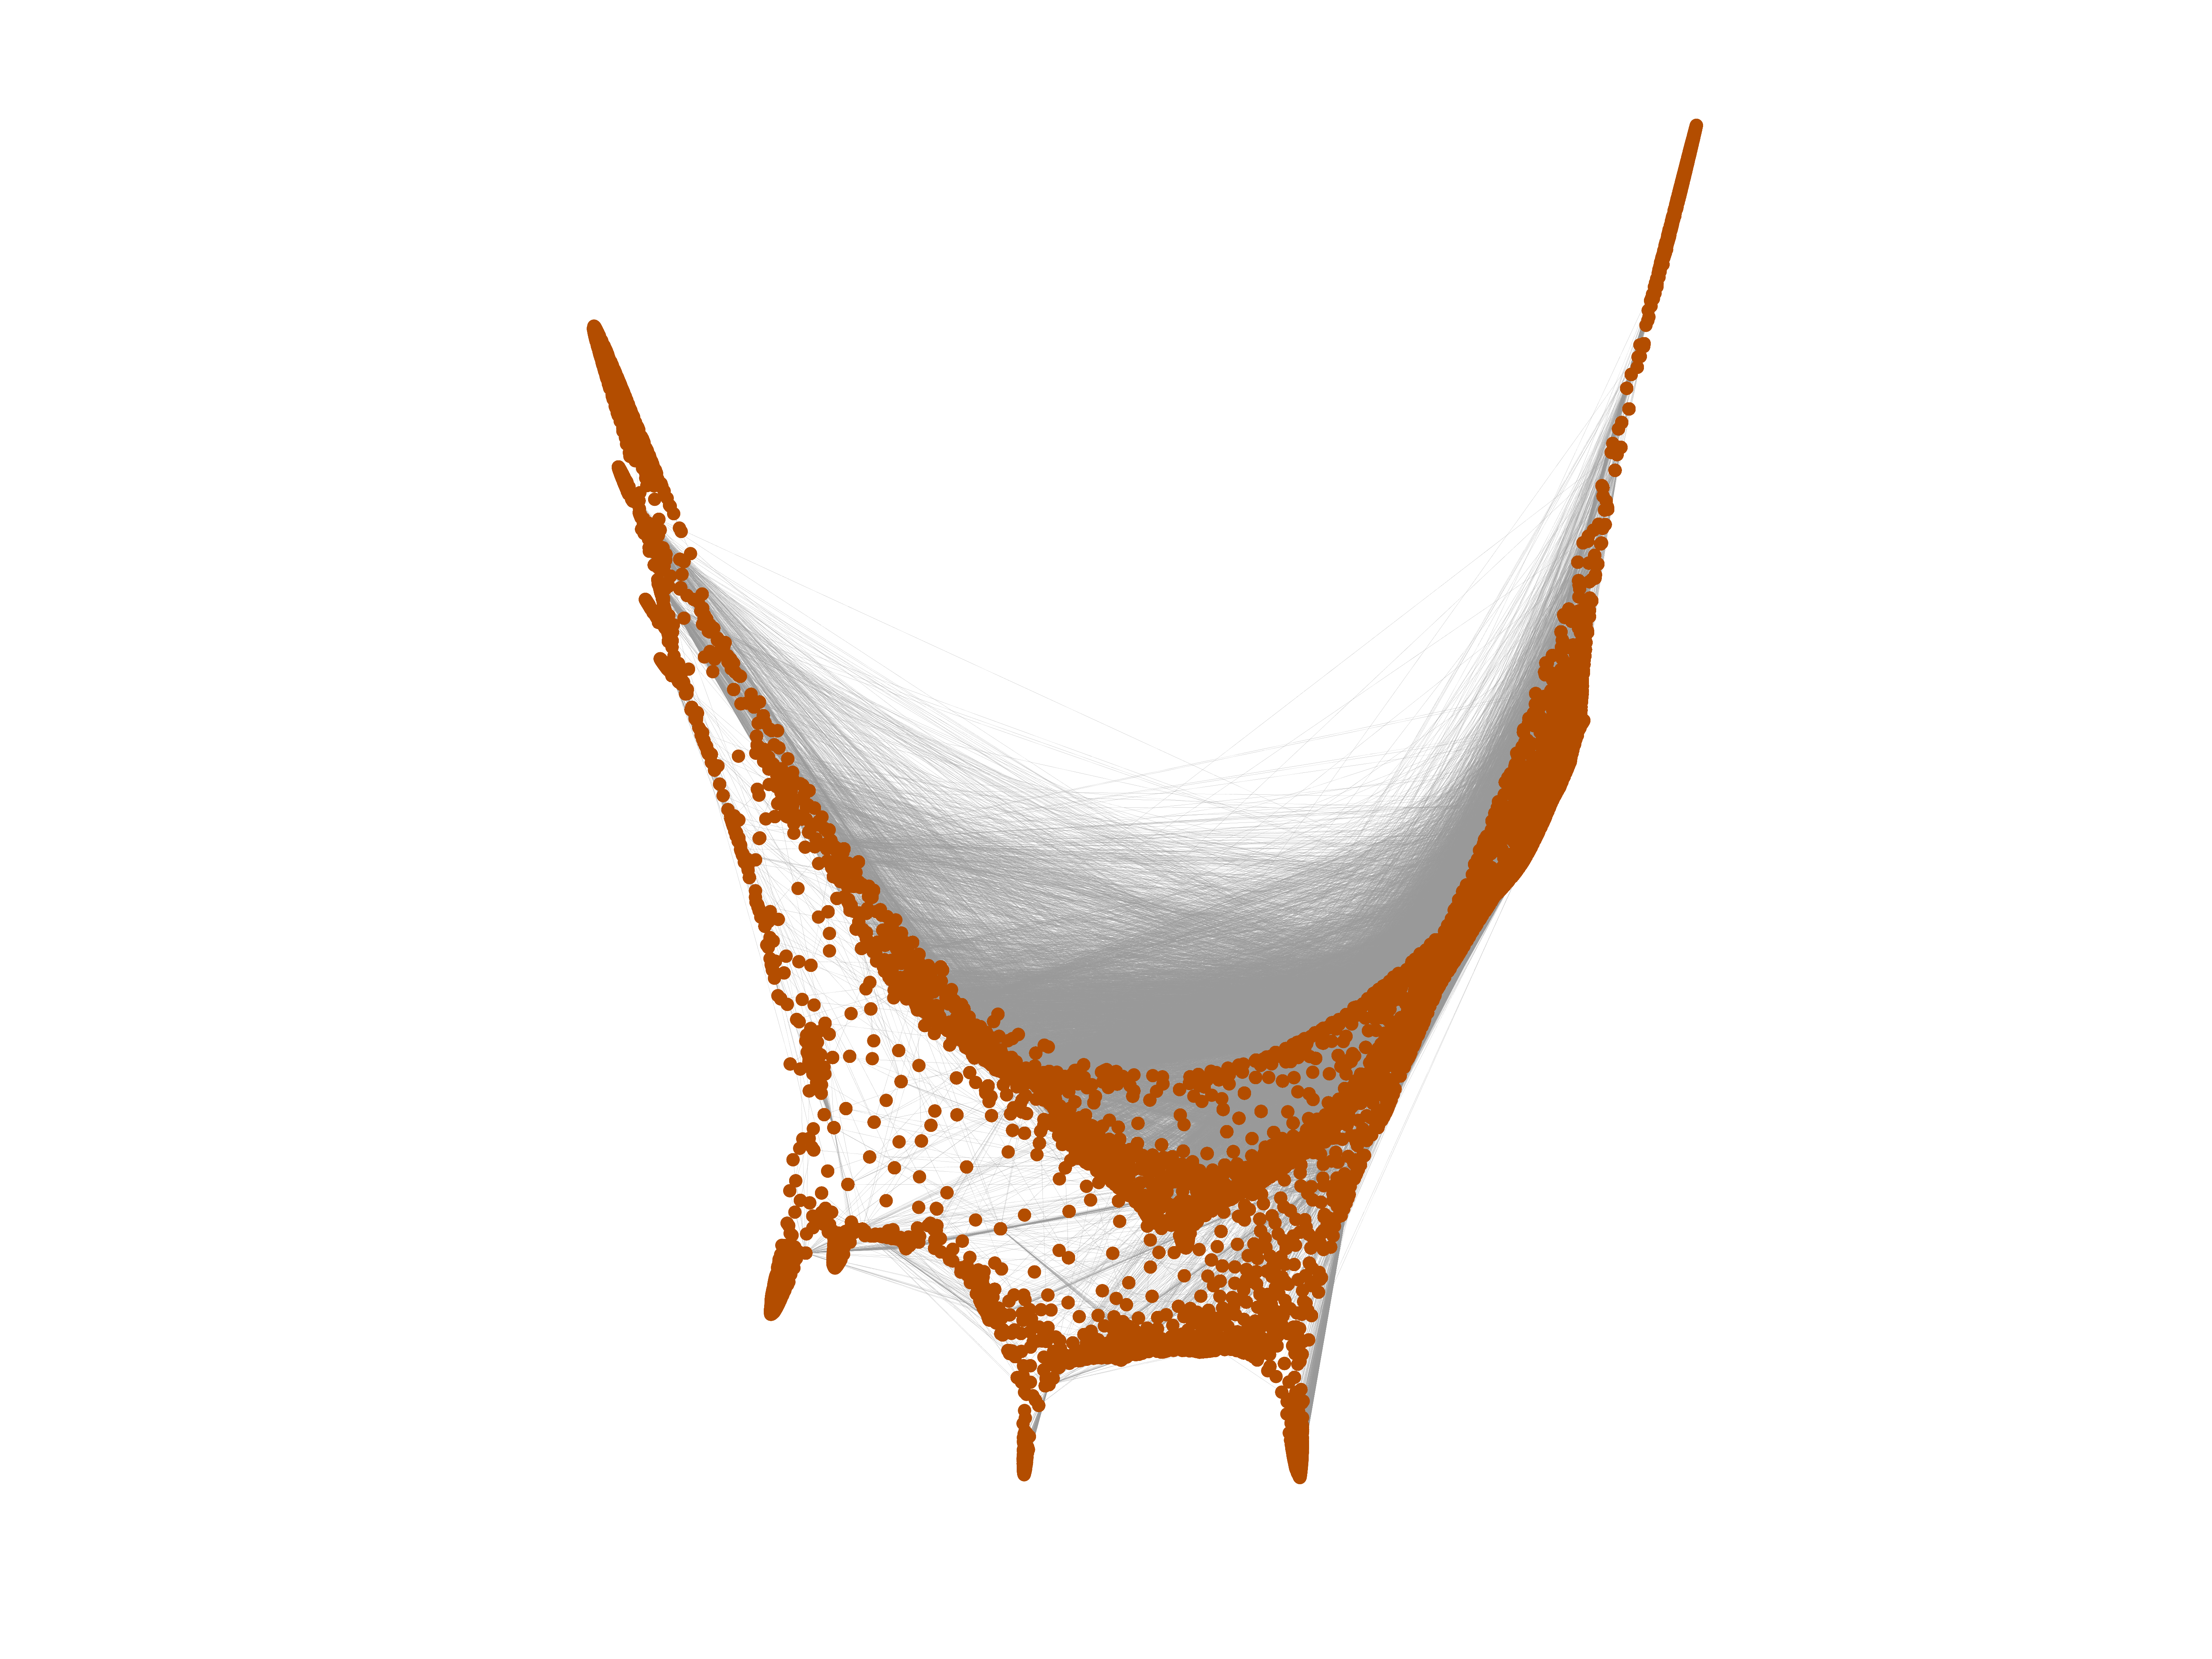
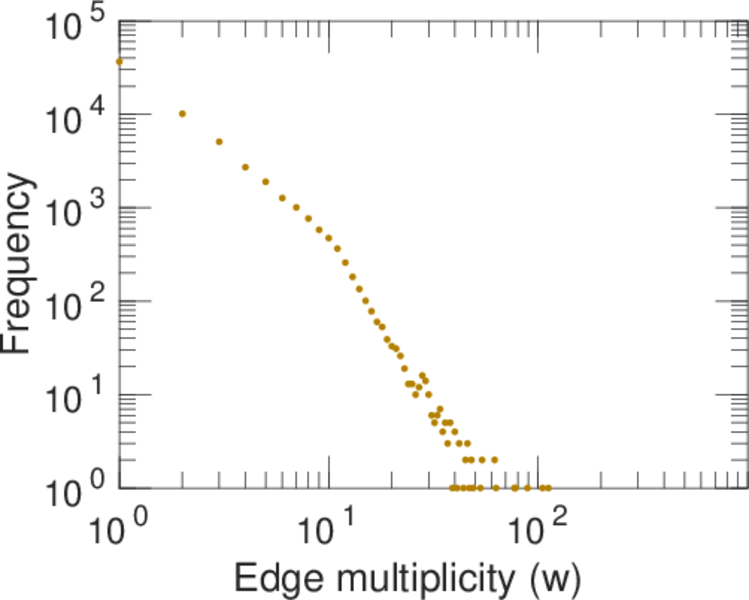
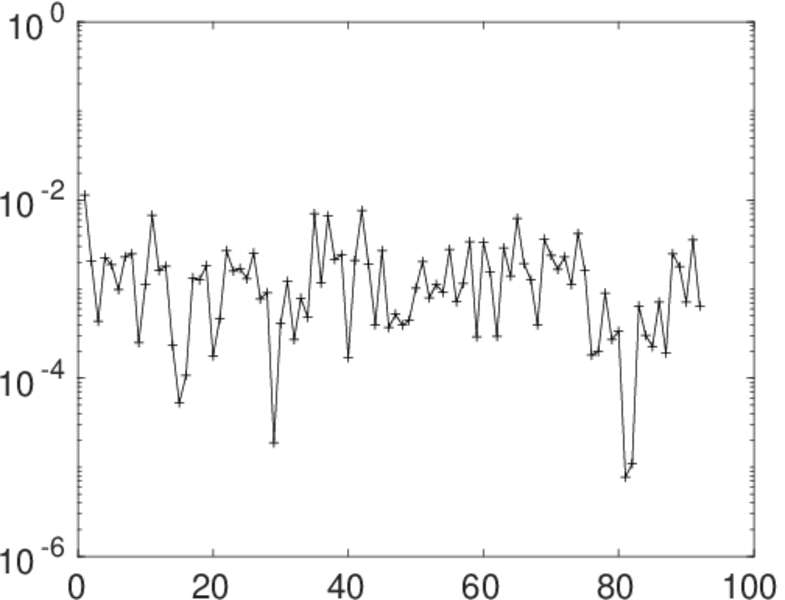
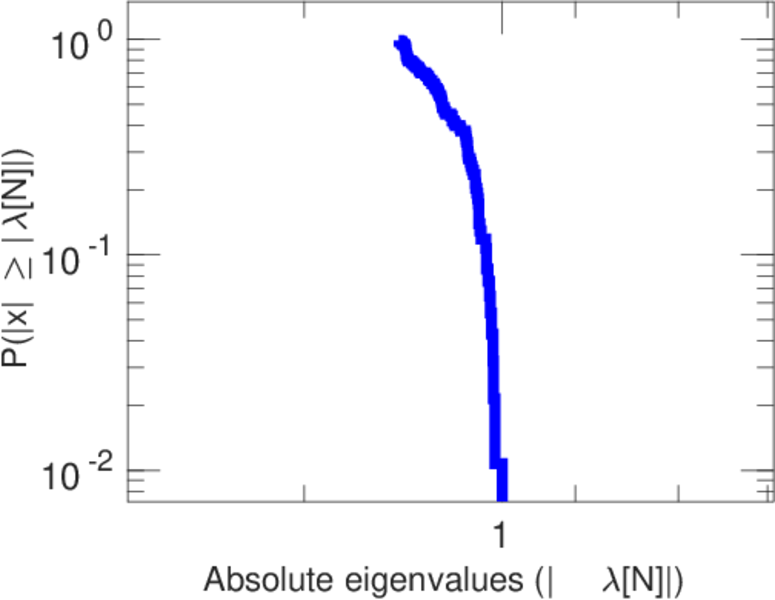
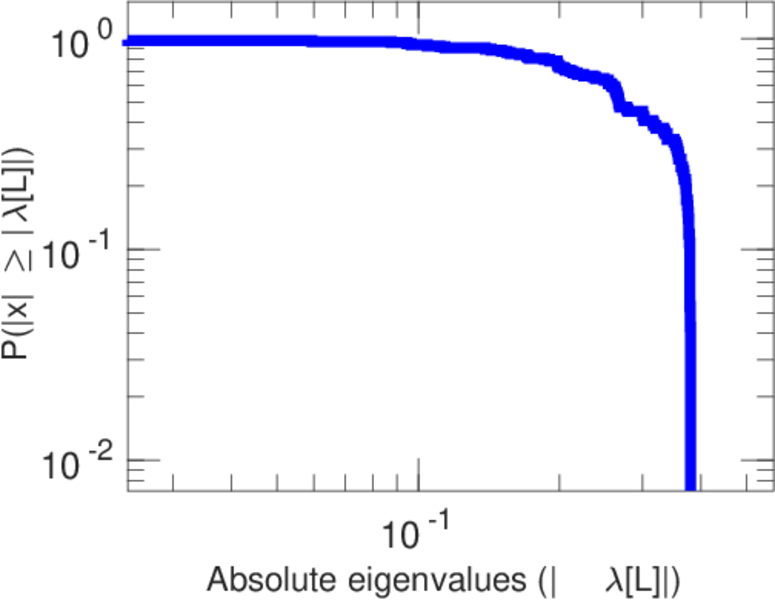
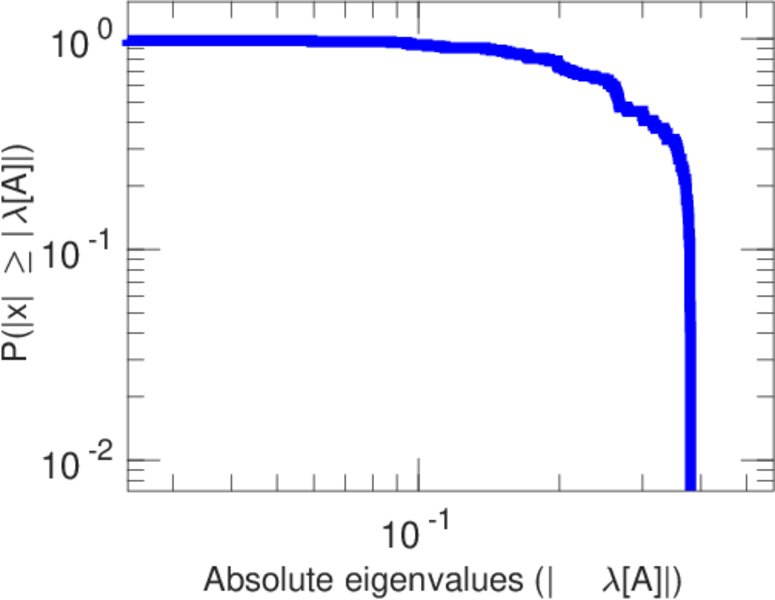
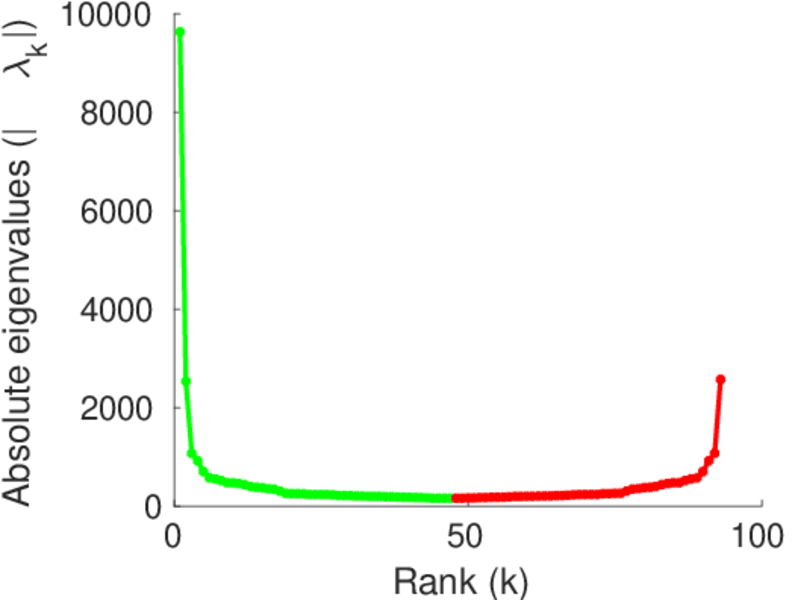
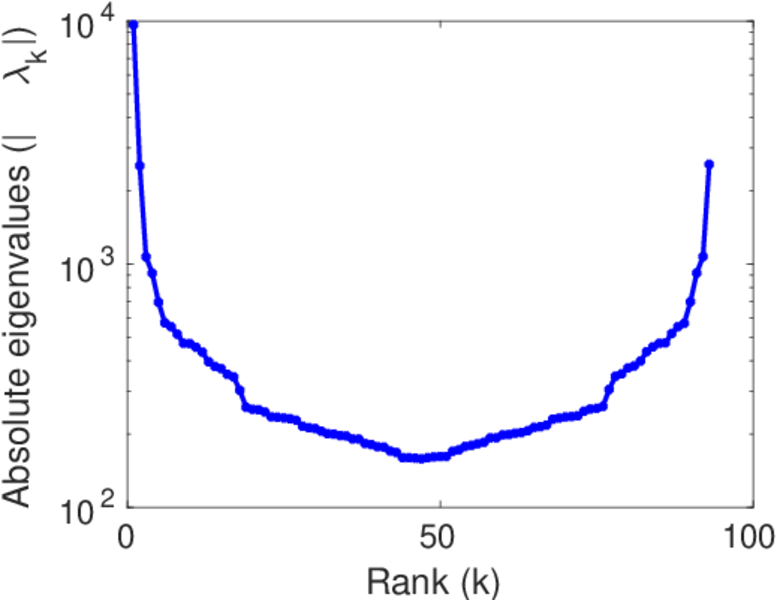
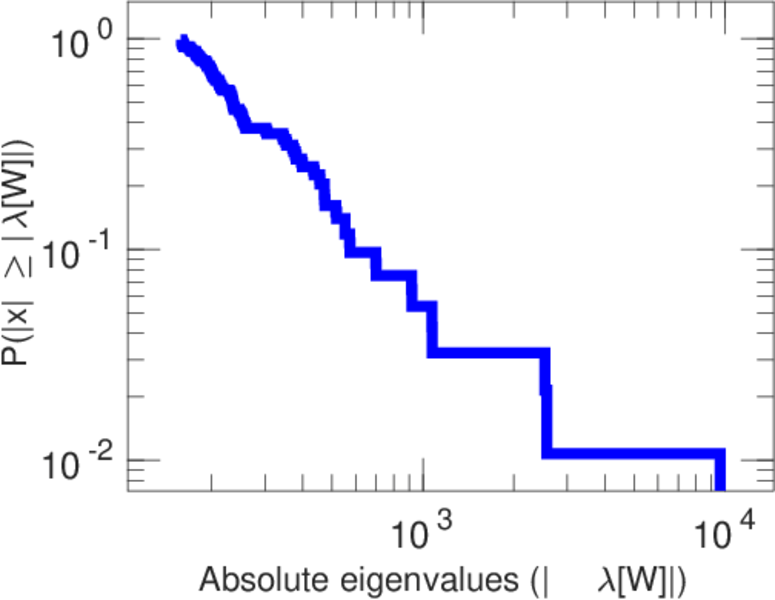
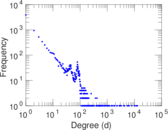
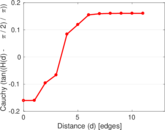
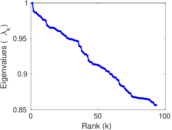
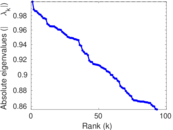
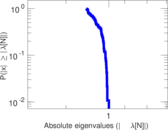
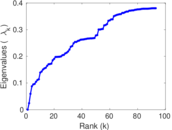
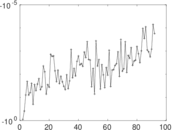
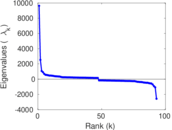
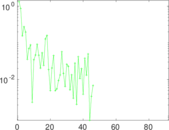
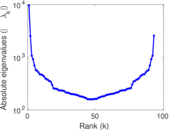
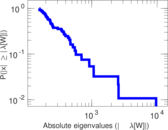
Plots


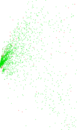


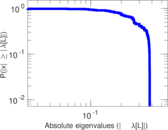
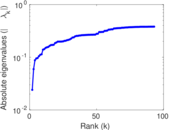
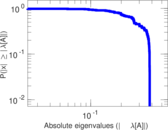
Matrix decompositions plots


Downloads
References
|
[1]
|
Jérôme Kunegis.
KONECT – The Koblenz Network Collection.
In Proc. Int. Conf. on World Wide Web Companion, pages
1343–1350, 2013.
[ http ]
|
|
[2]
|
Wikimedia Foundation.
Wikimedia downloads.
http://dumps.wikimedia.org/, January 2010.
|
 KONECT ‣ Networks ‣
Buy Me a Coffee
KONECT ‣ Networks ‣
Buy Me a Coffee