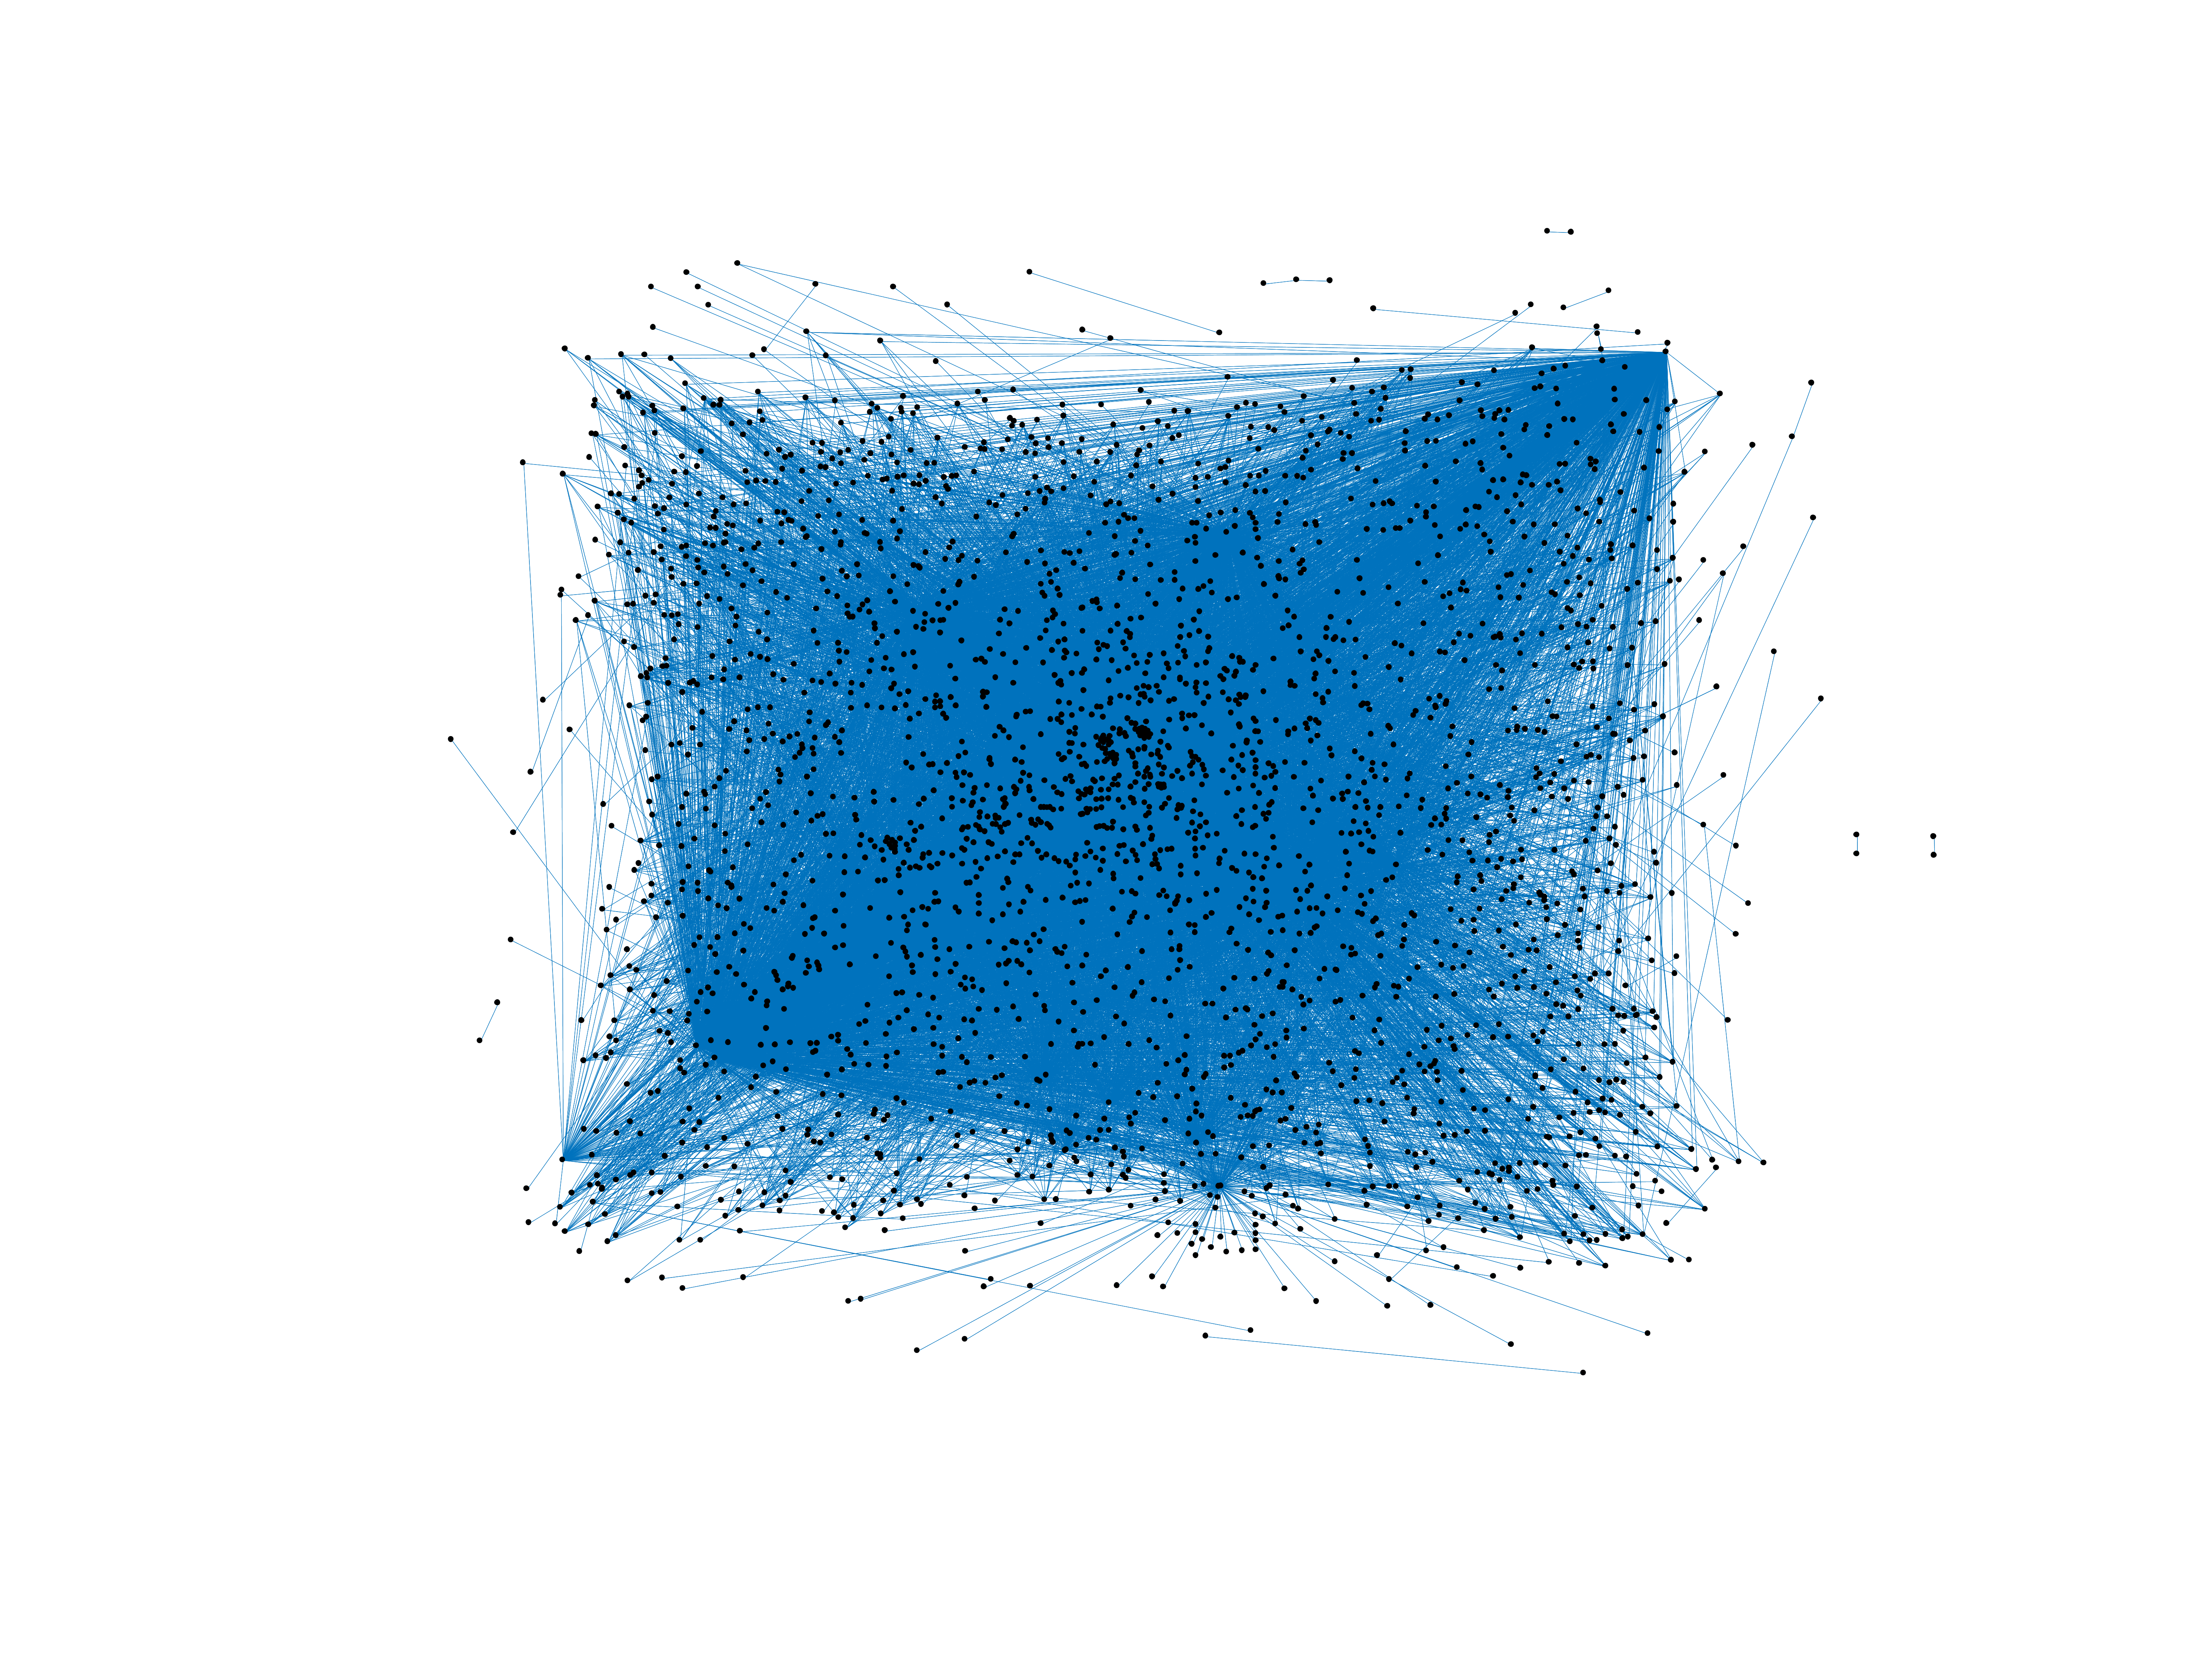
Wiktionary edits (csb)
This is the bipartite edit network of the Kashubian Wiktionary. It contains
users and pages from the Kashubian Wiktionary, connected by edit events. Each
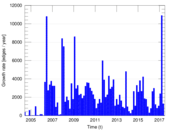
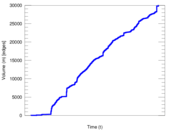
edge represents an edit. The dataset includes the timestamp of each edit.
Metadata
Statistics
| Size | n = | 2,763
|
| Left size | n1 = | 234
|
| Right size | n2 = | 2,529
|
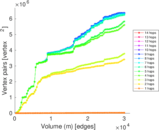
| Volume | m = | 29,959
|
| Unique edge count | m̿ = | 13,966
|
| Wedge count | s = | 6,433,124
|
| Claw count | z = | 2,457,675,126
|
| Cross count | x = | 776,548,336,055
|
| Square count | q = | 13,729,154
|
| 4-Tour count | T4 = | 135,597,704
|
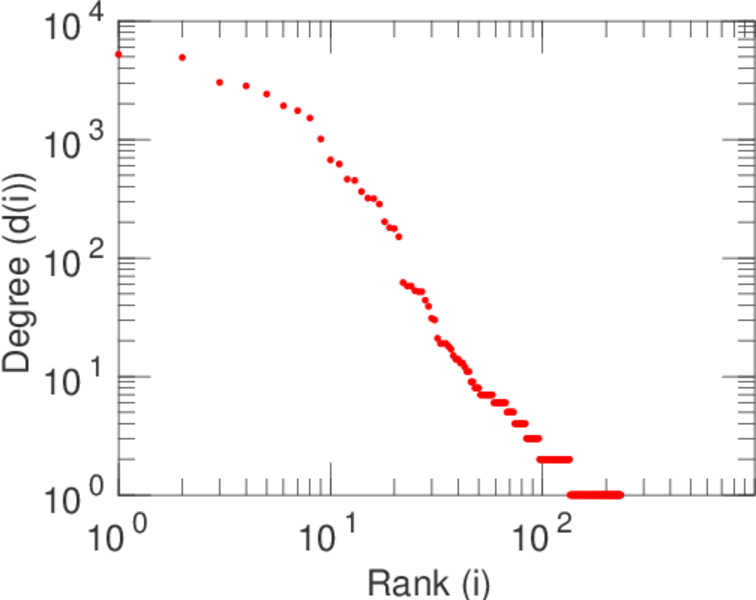
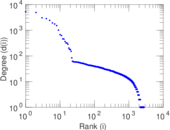
| Maximum degree | dmax = | 5,222
|
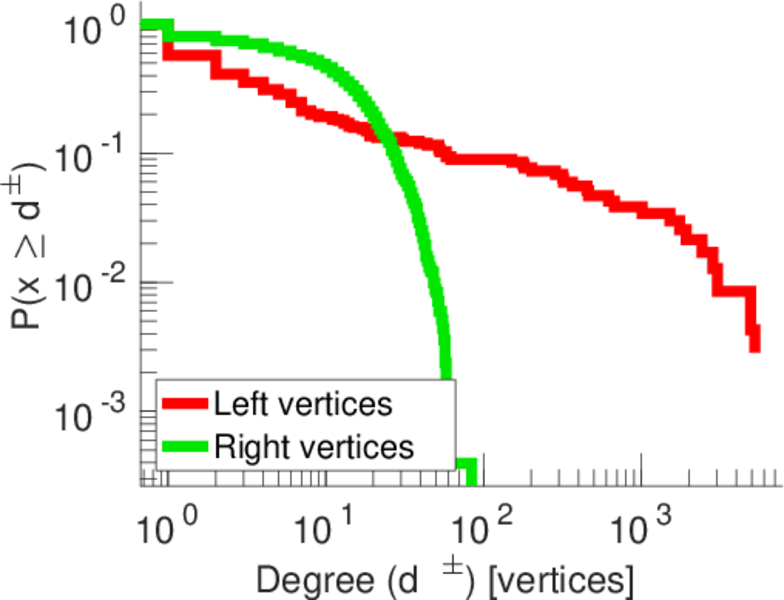
| Maximum left degree | d1max = | 5,222
|
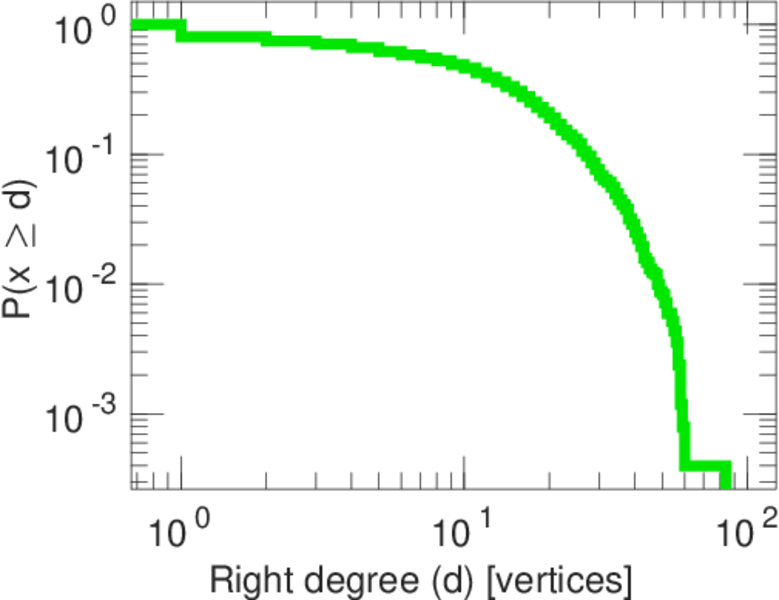
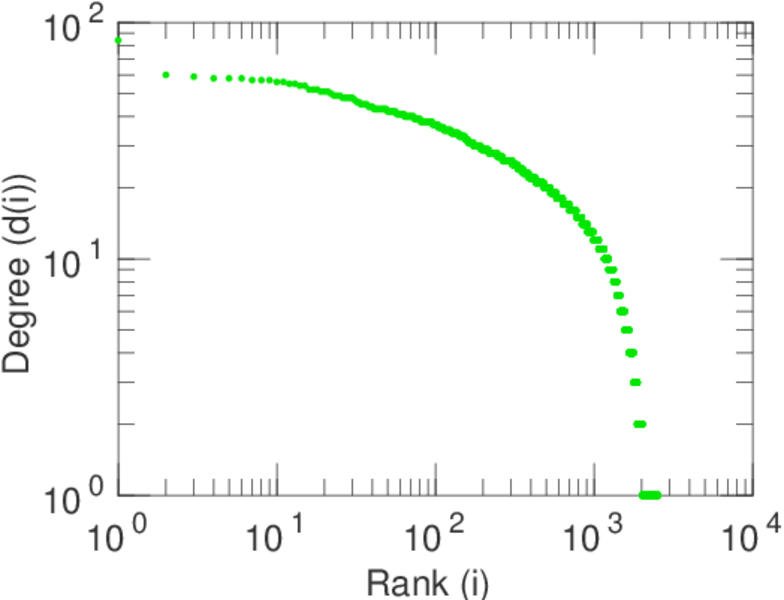
| Maximum right degree | d2max = | 84
|
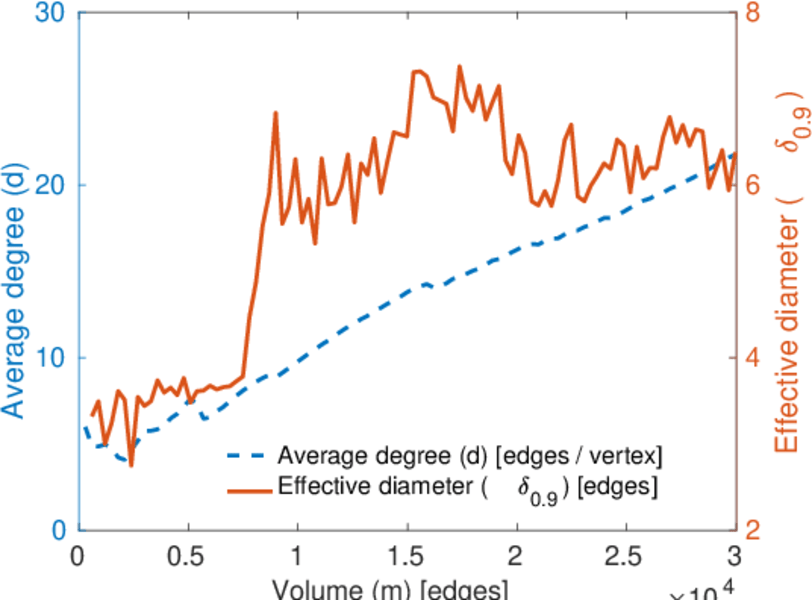
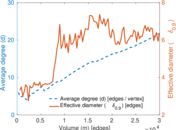
| Average degree | d = | 21.685 8
|
| Average left degree | d1 = | 128.030
|
| Average right degree | d2 = | 11.846 2
|
| Fill | p = | 0.023 599 7
|
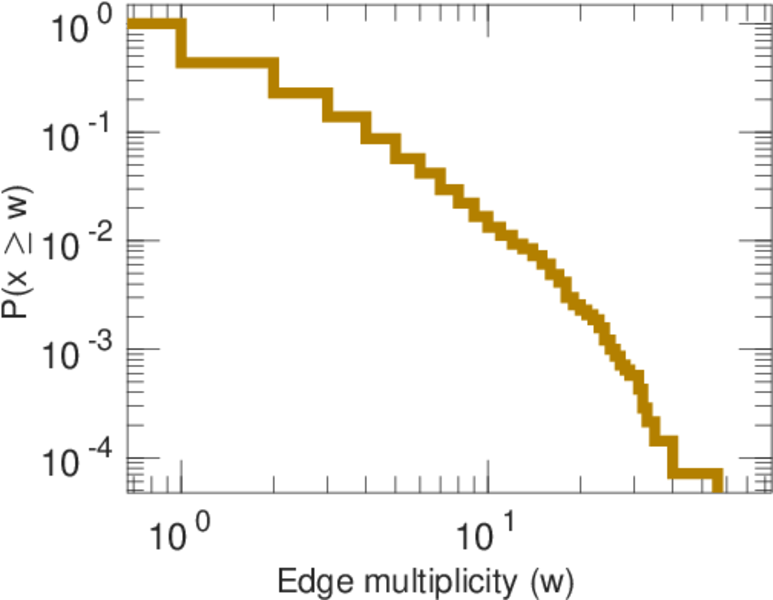
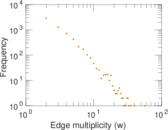
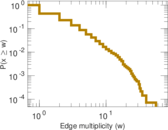
| Average edge multiplicity | m̃ = | 2.145 14
|
| Size of LCC | N = | 2,524
|
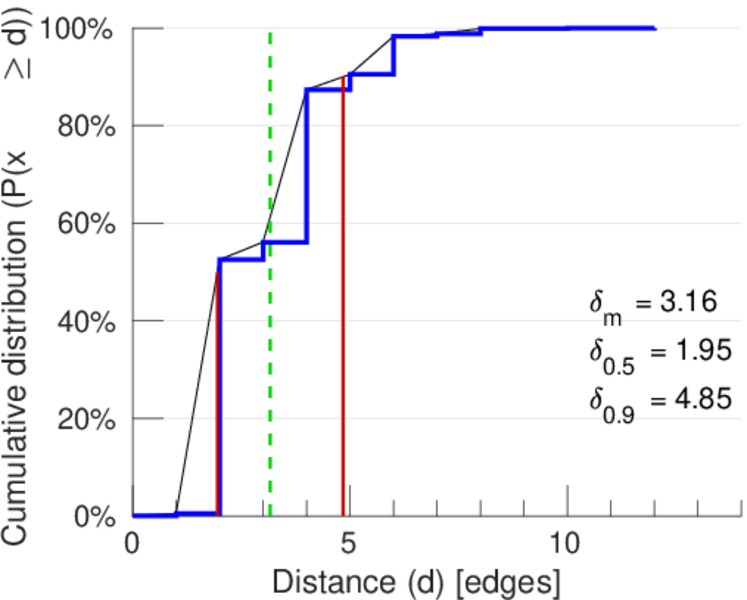
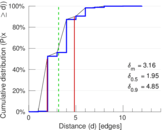
| Diameter | δ = | 13
|
| 50-Percentile effective diameter | δ0.5 = | 1.951 47
|
| 90-Percentile effective diameter | δ0.9 = | 4.845 49
|
| Median distance | δM = | 2
|
| Mean distance | δm = | 3.161 75
|
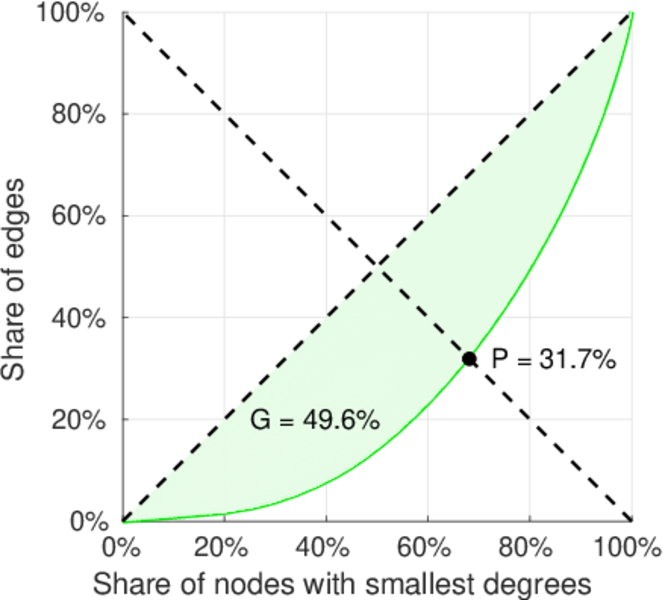
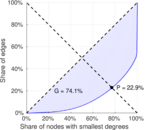
| Gini coefficient | G = | 0.728 041
|
| Balanced inequality ratio | P = | 0.232 301
|
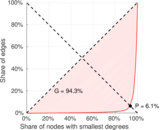
| Left balanced inequality ratio | P1 = | 0.061 484 0
|
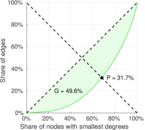
| Right balanced inequality ratio | P2 = | 0.317 467
|
| Relative edge distribution entropy | Her = | 0.761 266
|
| Power law exponent | γ = | 1.733 77
|
| Tail power law exponent | γt = | 3.671 00
|
| Tail power law exponent with p | γ3 = | 3.671 00
|
| p-value | p = | 0.000 00
|
| Left tail power law exponent with p | γ3,1 = | 1.611 00
|
| Left p-value | p1 = | 0.004 000 00
|
| Right tail power law exponent with p | γ3,2 = | 8.991 00
|
| Right p-value | p2 = | 0.000 00
|
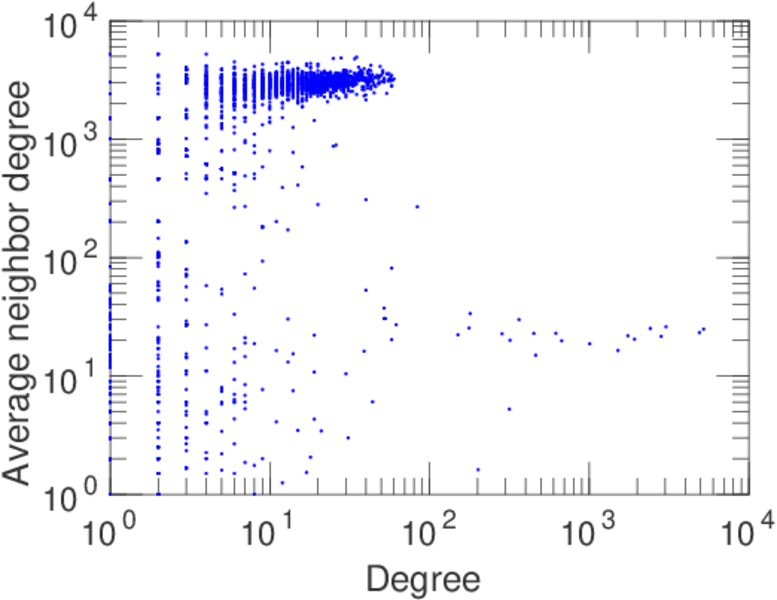
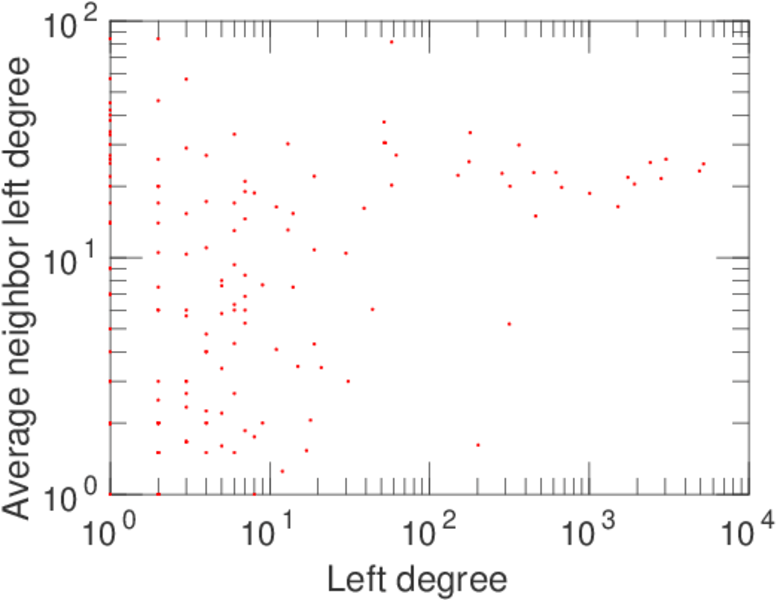
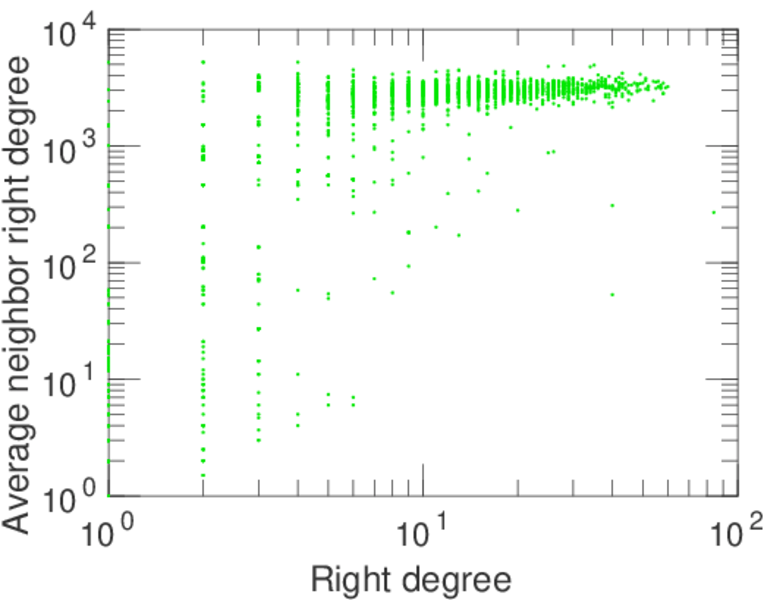
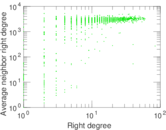
| Degree assortativity | ρ = | +0.159 338
|
| Degree assortativity p-value | pρ = | 4.435 50 × 10−80
|
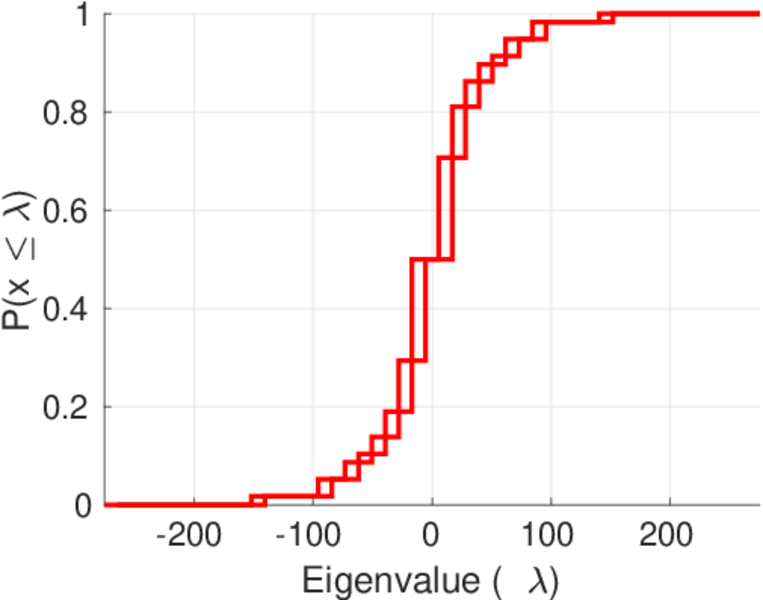
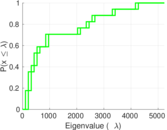
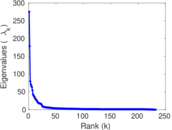
| Spectral norm | α = | 275.378
|
| Algebraic connectivity | a = | 0.013 089 5
|
| Spectral separation | |λ1[A] / λ2[A]| = | 1.543 05
|
| Controllability | C = | 2,297
|
| Relative controllability | Cr = | 0.834 363
|
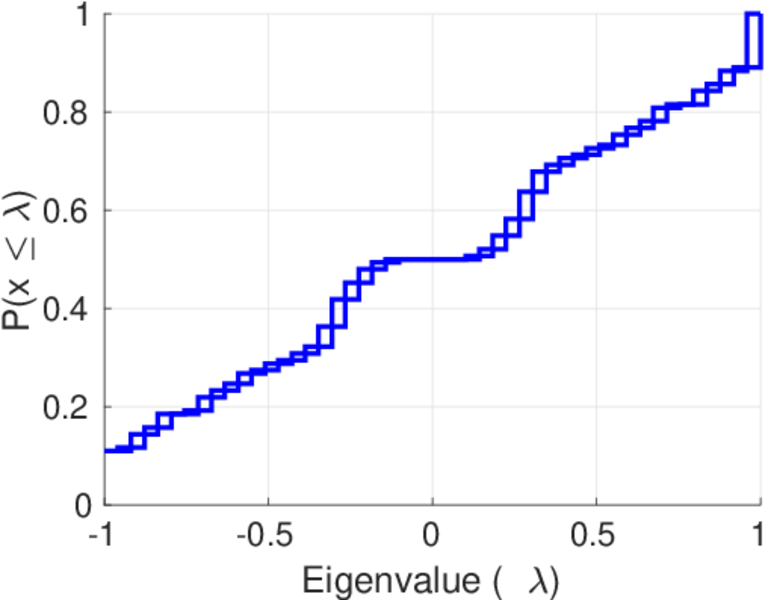
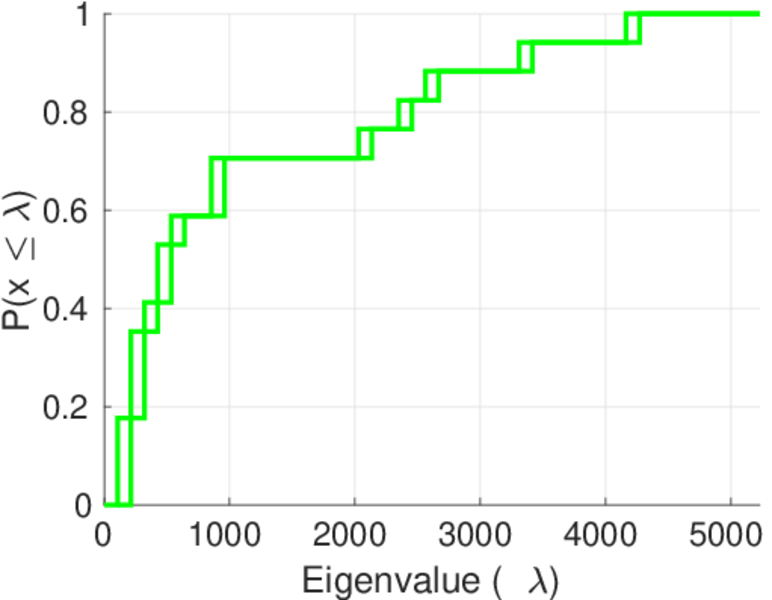
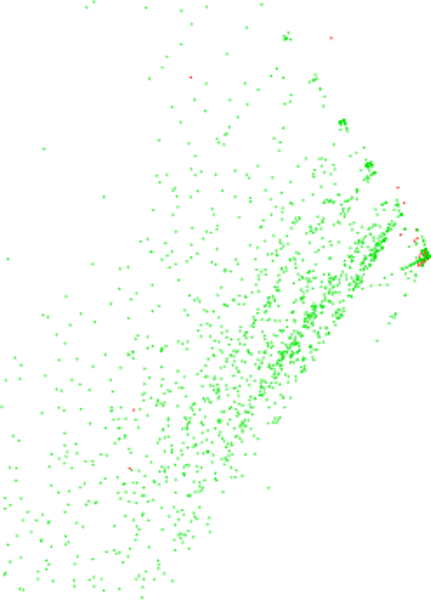
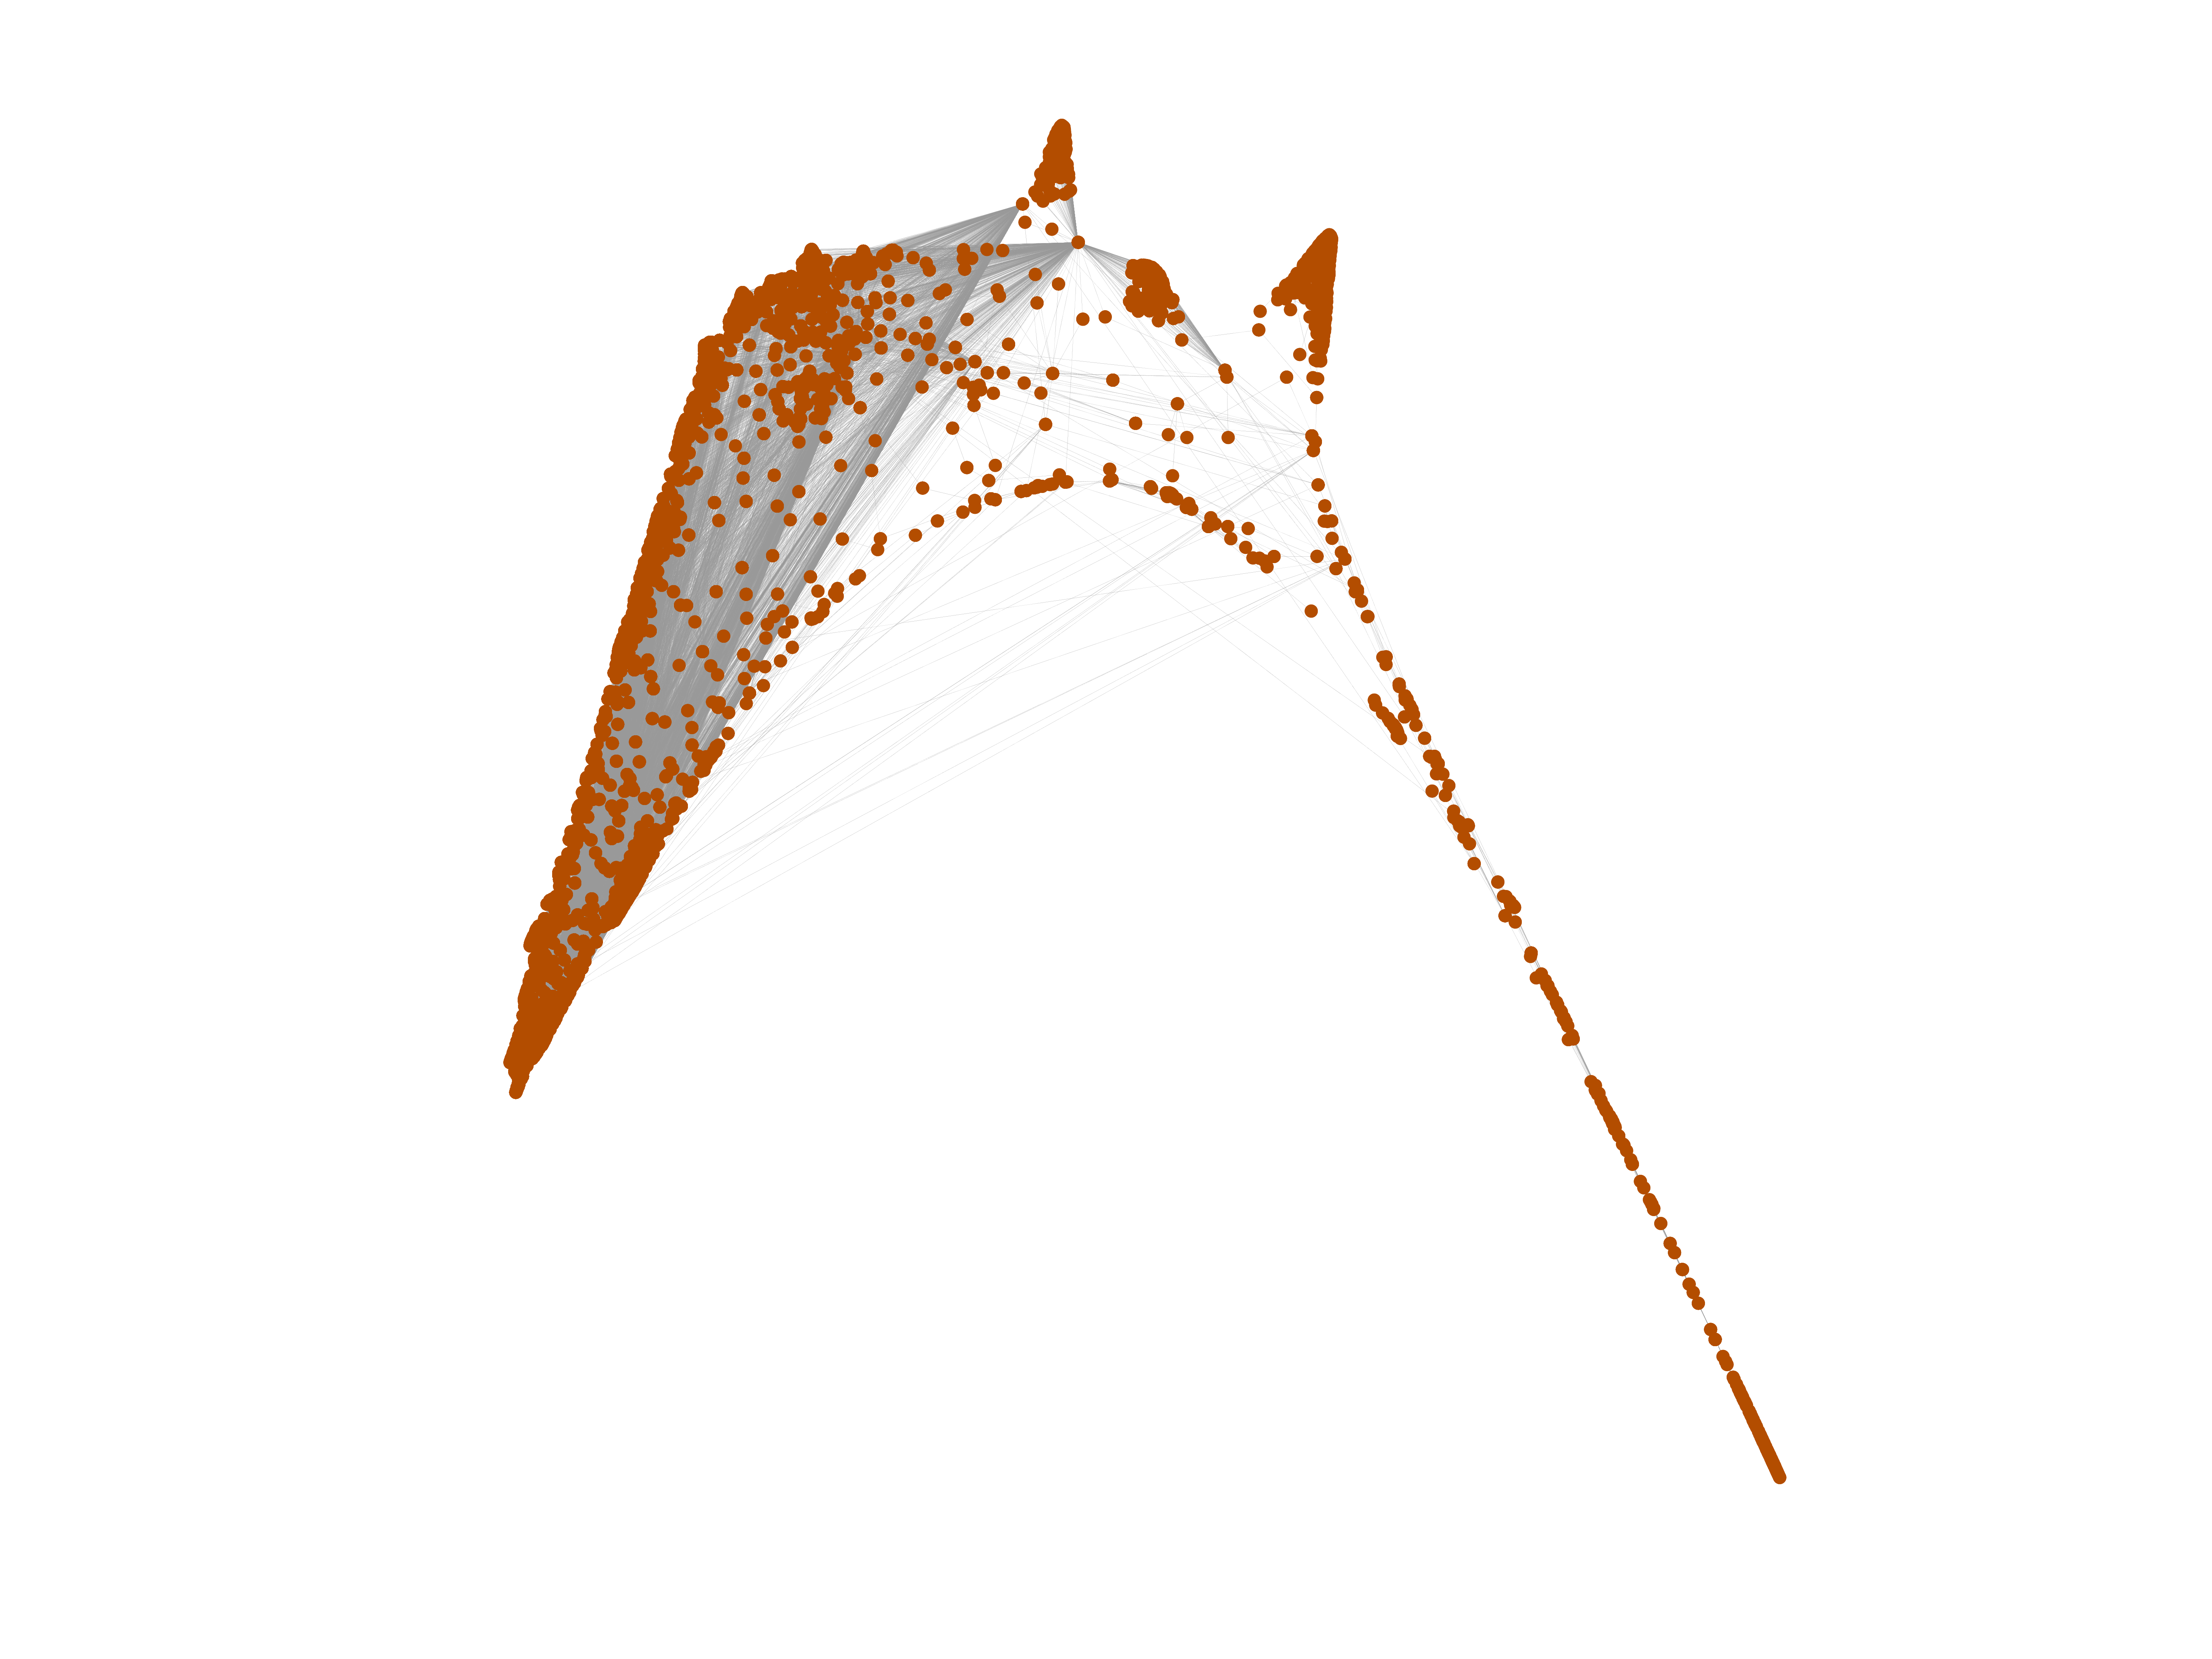
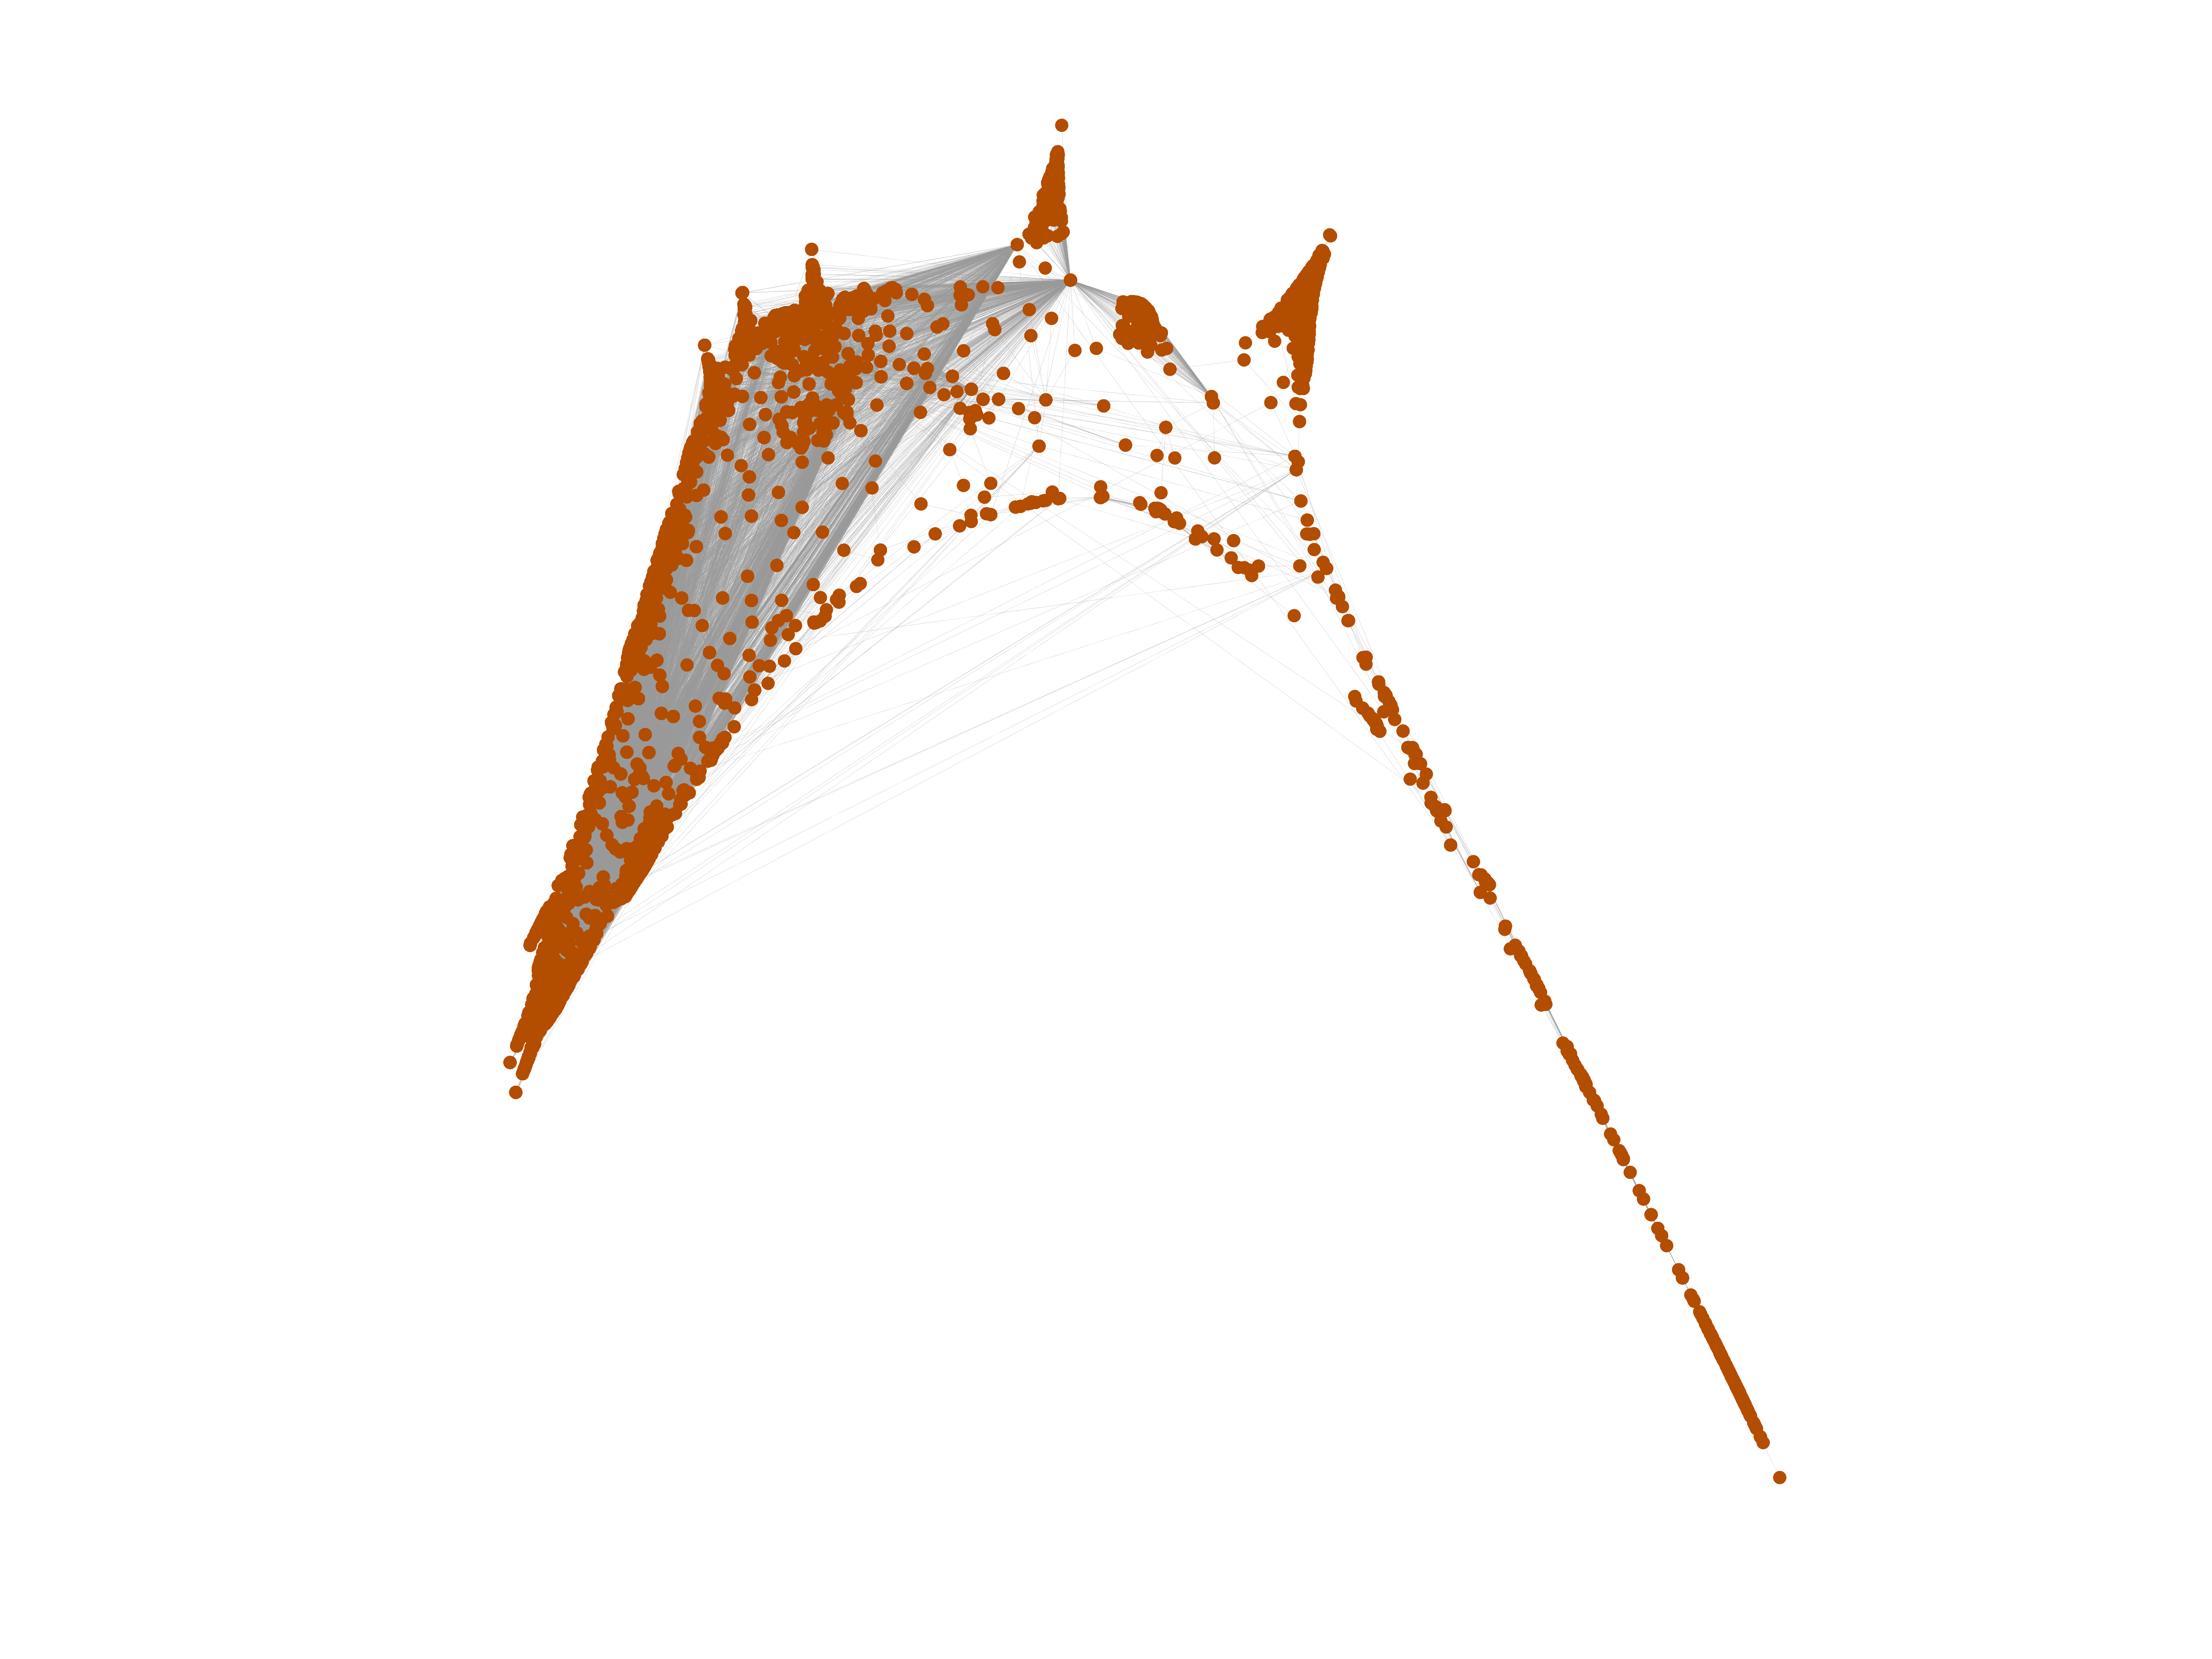
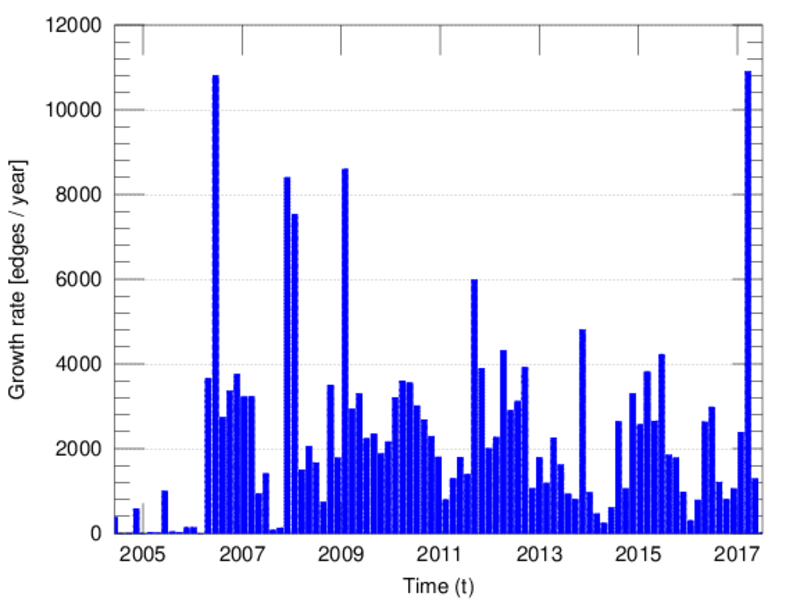
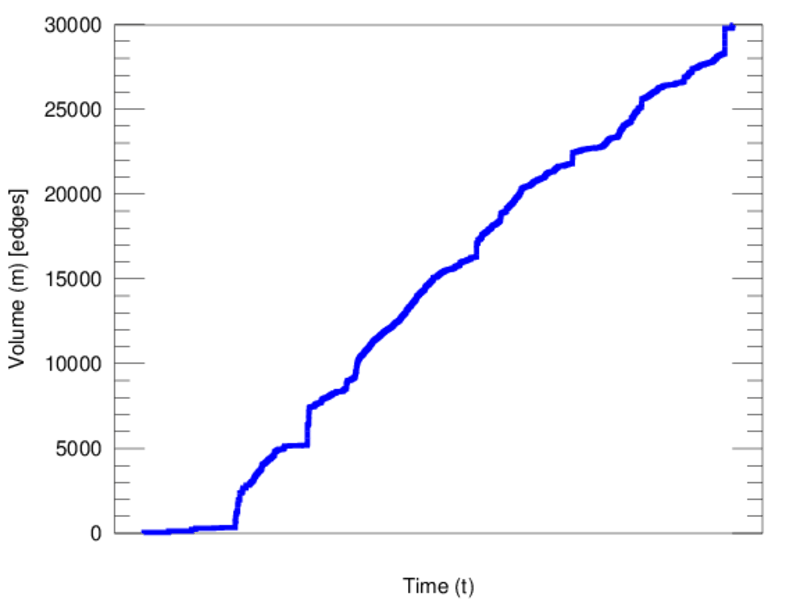
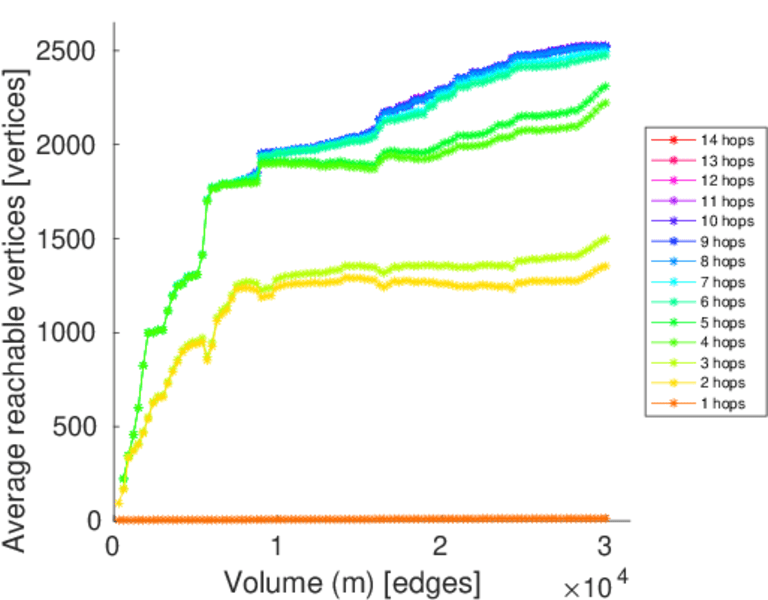
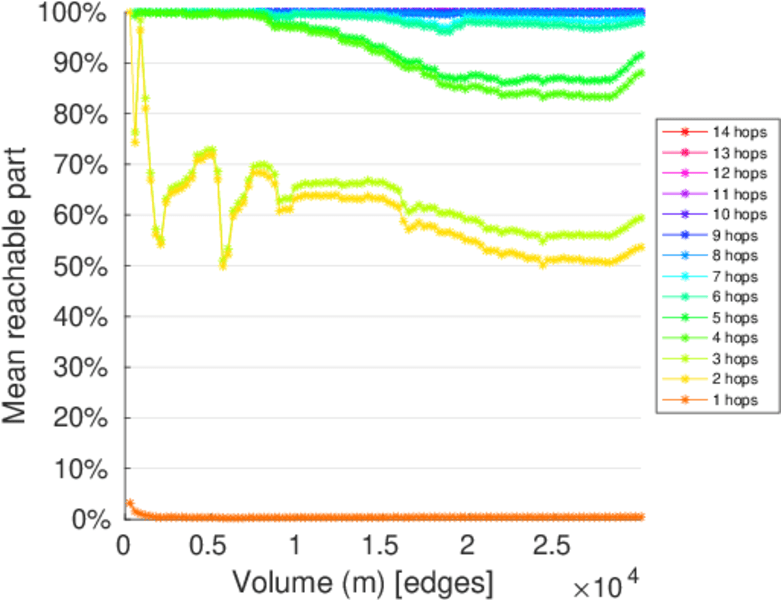
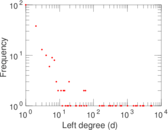
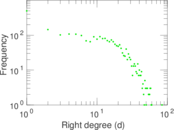
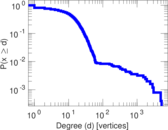
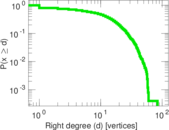
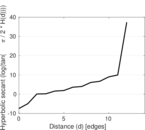
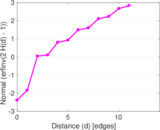
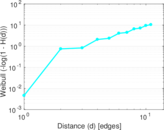
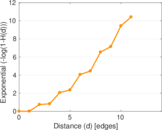
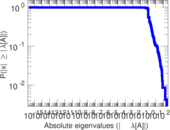
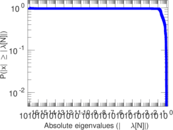
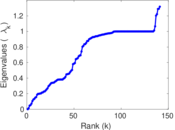
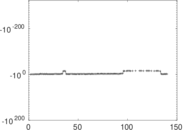
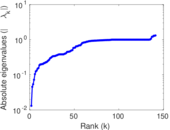
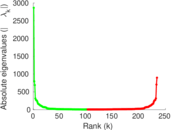
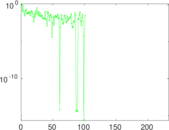
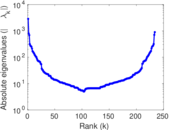
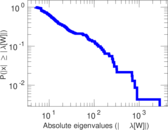
Plots


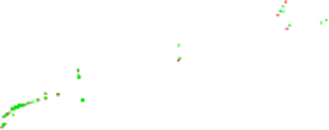
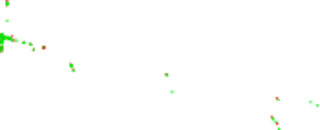


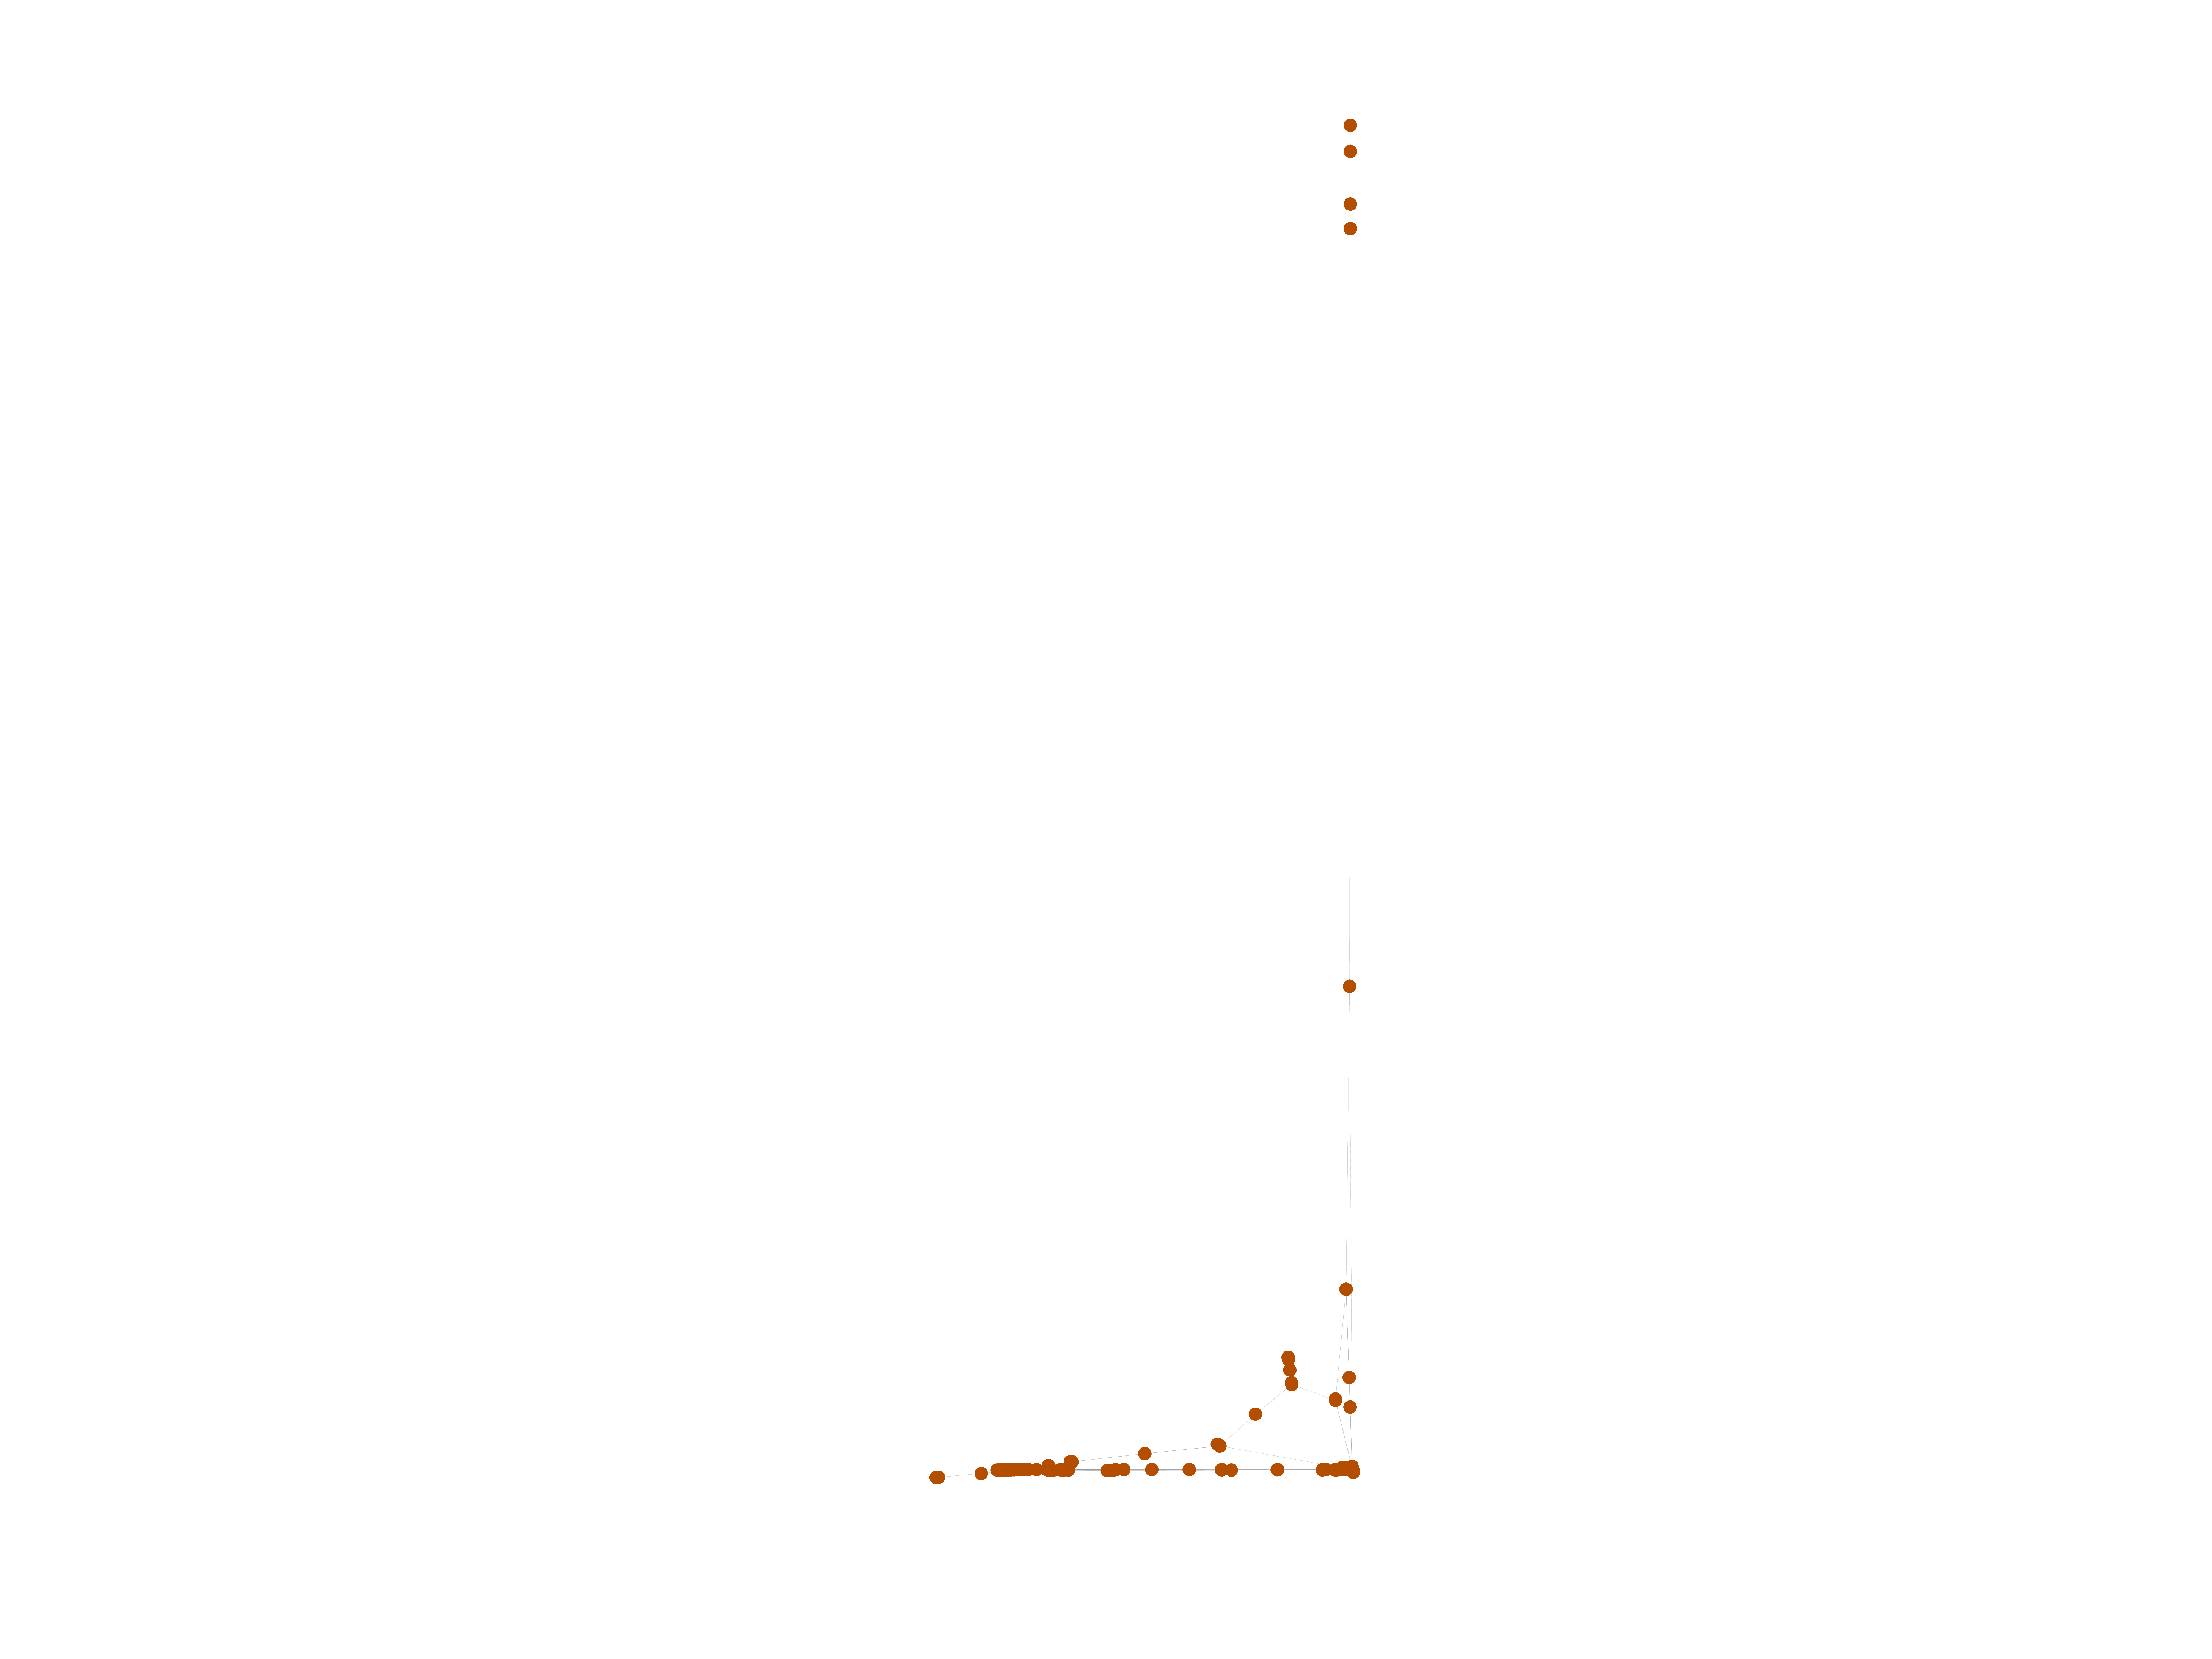
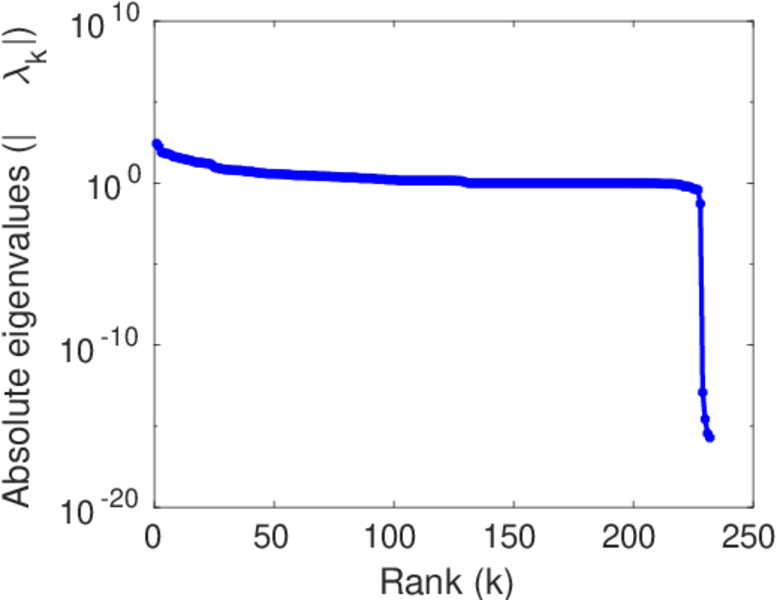
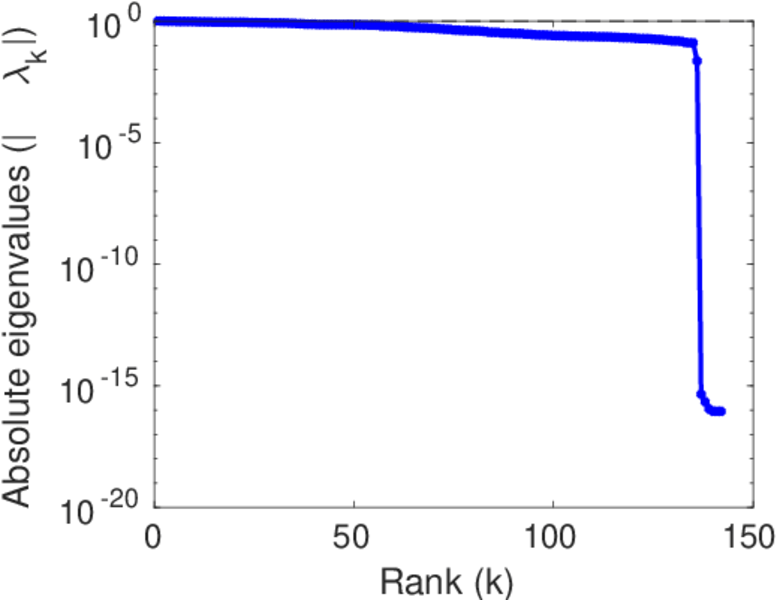
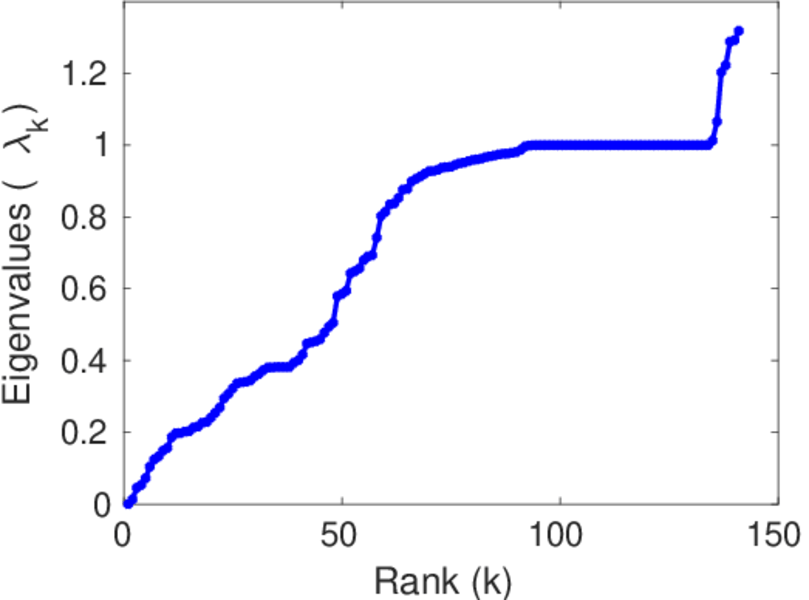
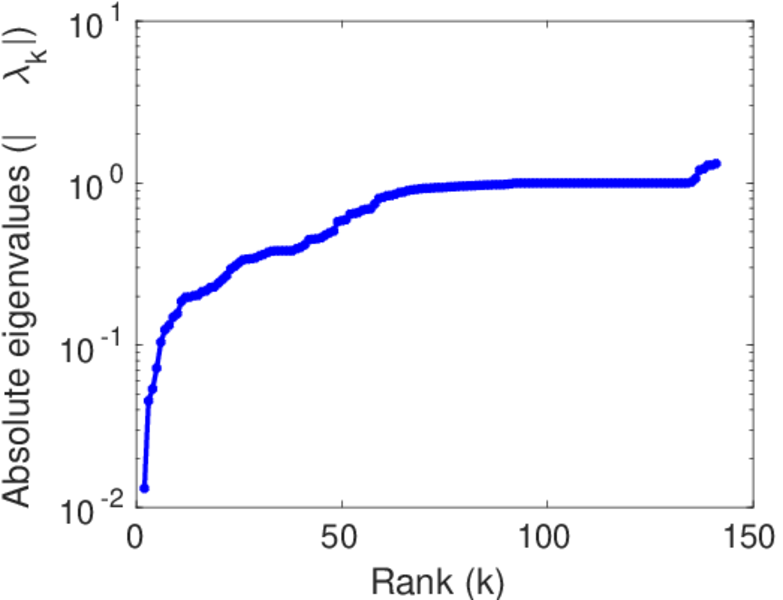
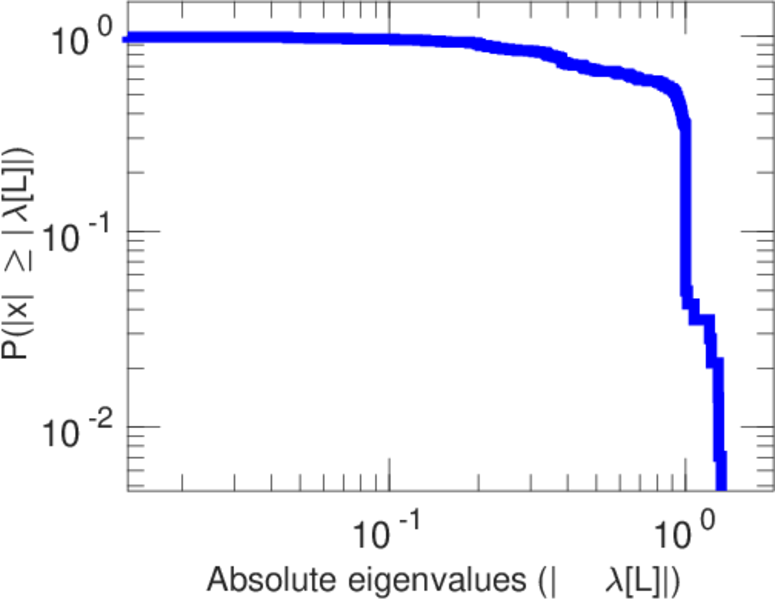
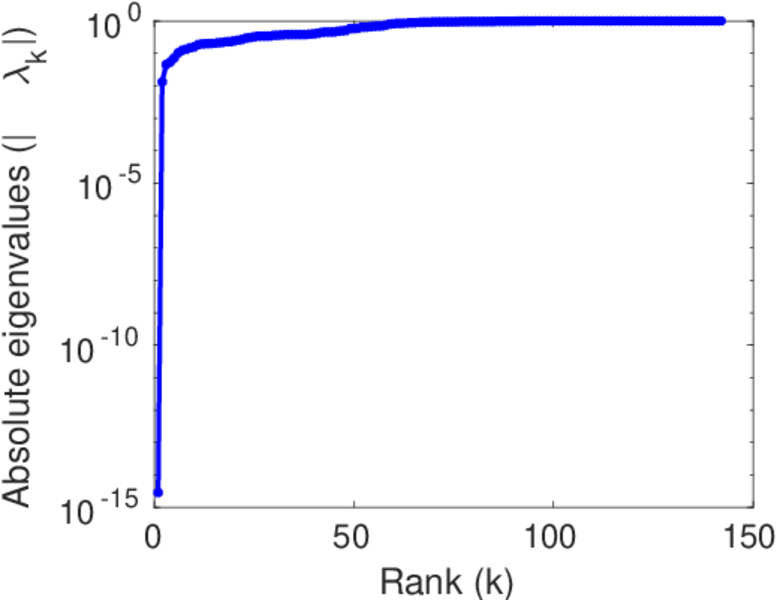
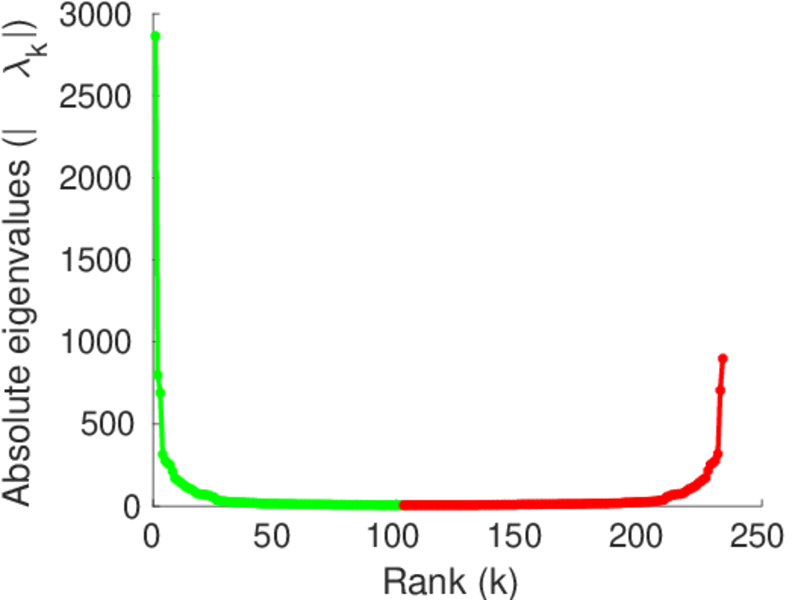
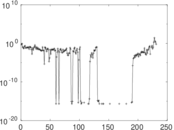
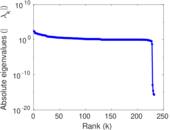
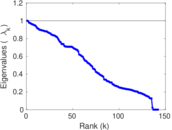
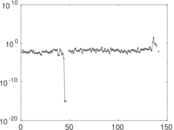
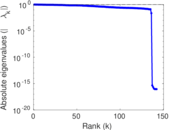
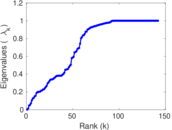
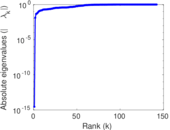
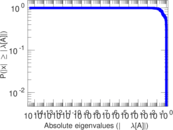
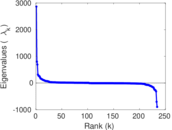
Matrix decompositions plots


Downloads
References
|
[1]
|
Jérôme Kunegis.
KONECT – The Koblenz Network Collection.
In Proc. Int. Conf. on World Wide Web Companion, pages
1343–1350, 2013.
[ http ]
|
|
[2]
|
Wikimedia Foundation.
Wikimedia downloads.
http://dumps.wikimedia.org/, January 2010.
|
 KONECT ‣ Networks ‣
Buy Me a Coffee
KONECT ‣ Networks ‣
Buy Me a Coffee