Wikinews edits (cs)
This is the bipartite edit network of the Czech Wikinews. It contains users and
pages from the Czech Wikinews, connected by edit events. Each edge represents
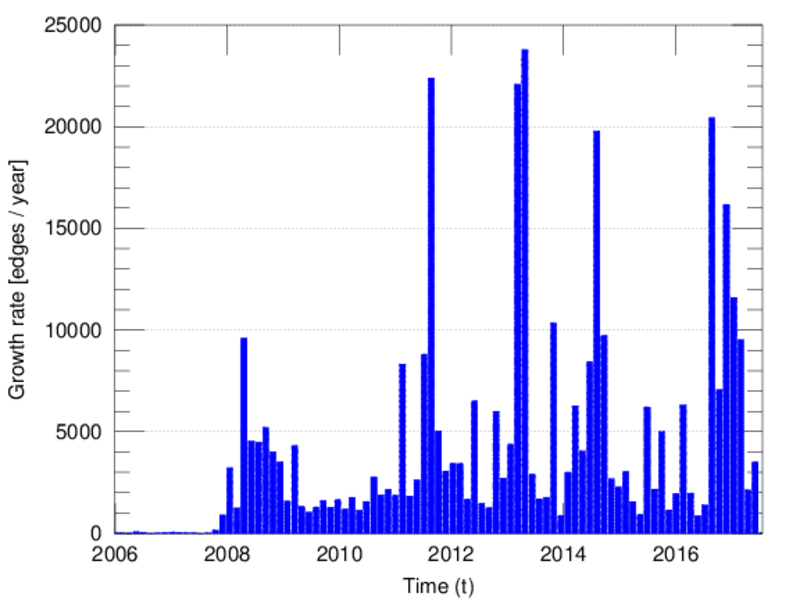
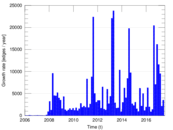
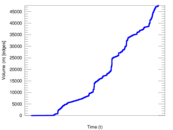
an edit. The dataset includes the timestamp of each edit.
Metadata
Statistics
| Size | n = | 10,943
|
| Left size | n1 = | 539
|
| Right size | n2 = | 10,404
|
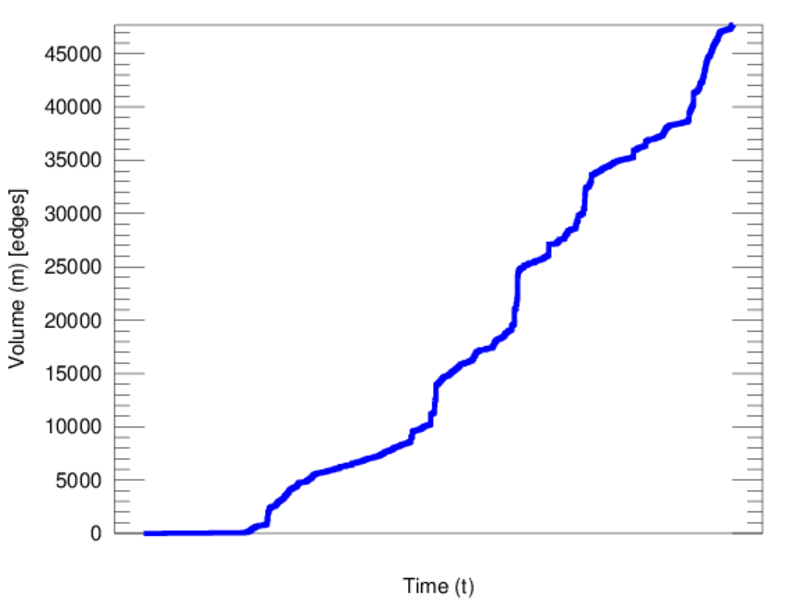
| Volume | m = | 47,698
|
| Unique edge count | m̿ = | 27,691
|
| Wedge count | s = | 43,130,853
|
| Claw count | z = | 77,736,340,986
|
| Cross count | x = | 116,993,431,332,978
|
| Square count | q = | 14,449,235
|
| 4-Tour count | T4 = | 288,203,322
|
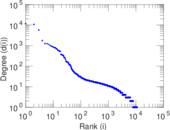
| Maximum degree | dmax = | 11,723
|
| Maximum left degree | d1max = | 11,723
|
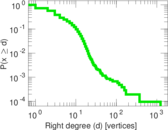
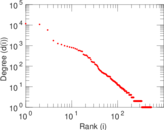
| Maximum right degree | d2max = | 1,236
|
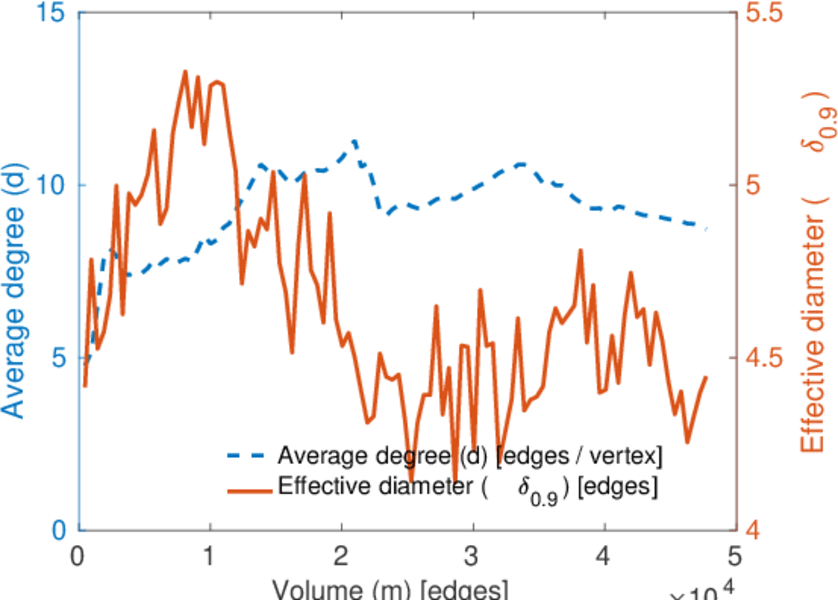
| Average degree | d = | 8.717 54
|
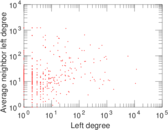
| Average left degree | d1 = | 88.493 5
|
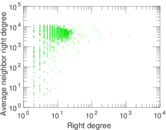
| Average right degree | d2 = | 4.584 58
|
| Fill | p = | 0.004 937 98
|
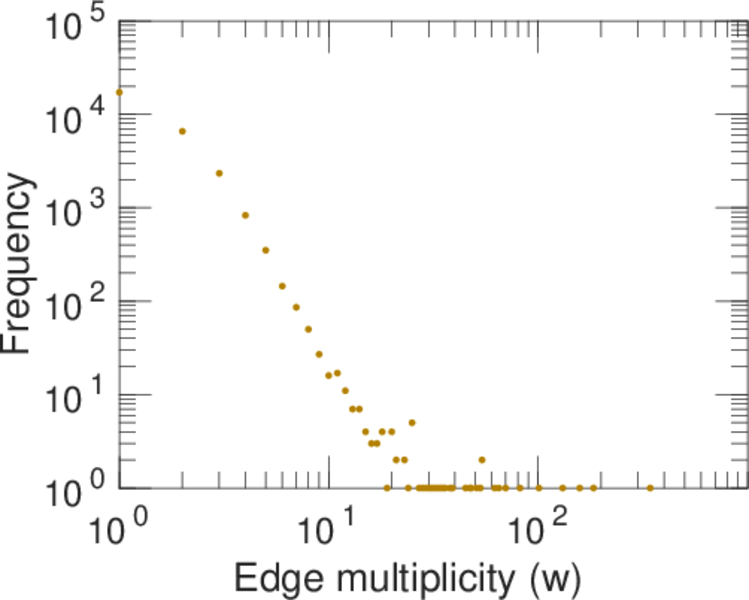
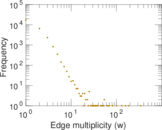
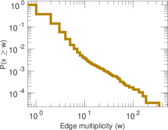
| Average edge multiplicity | m̃ = | 1.722 51
|
| Size of LCC | N = | 10,740
|
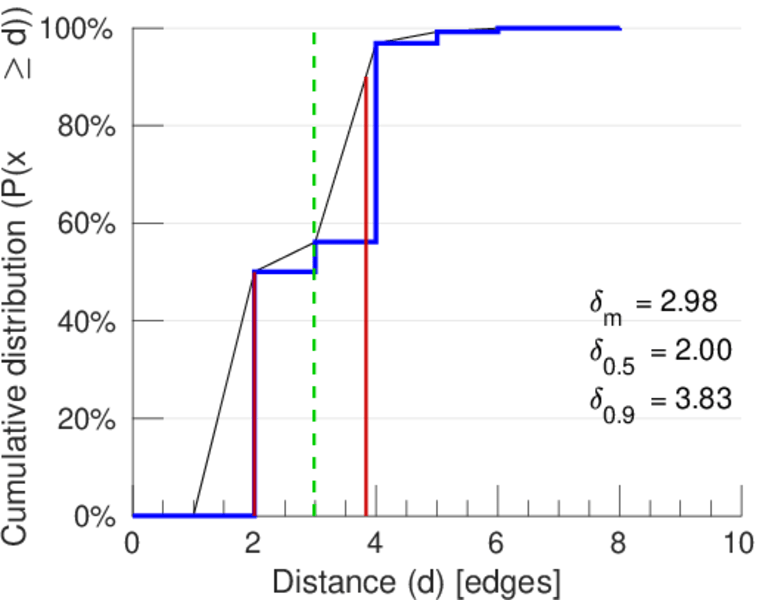
| Diameter | δ = | 10
|
| 50-Percentile effective diameter | δ0.5 = | 1.999 63
|
| 90-Percentile effective diameter | δ0.9 = | 3.831 80
|
| Median distance | δM = | 2
|
| Mean distance | δm = | 2.978 29
|
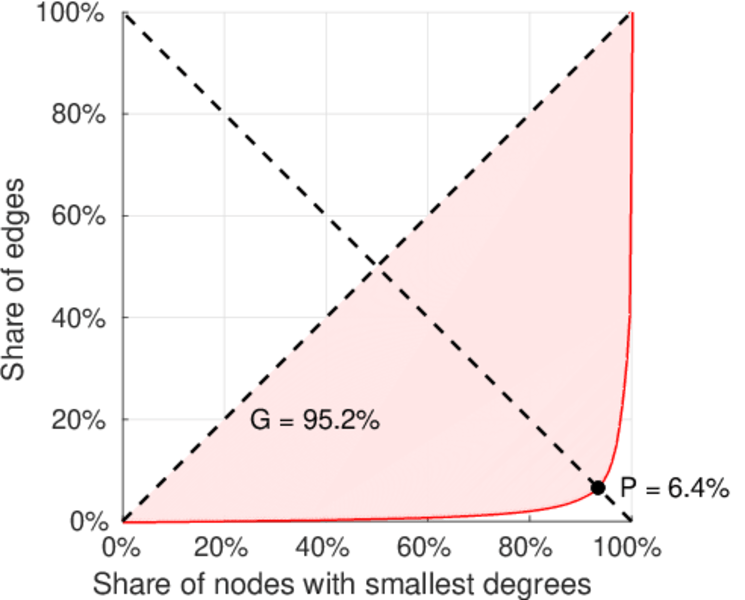
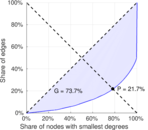
| Gini coefficient | G = | 0.744 755
|
| Balanced inequality ratio | P = | 0.214 087
|
| Left balanced inequality ratio | P1 = | 0.064 111 7
|
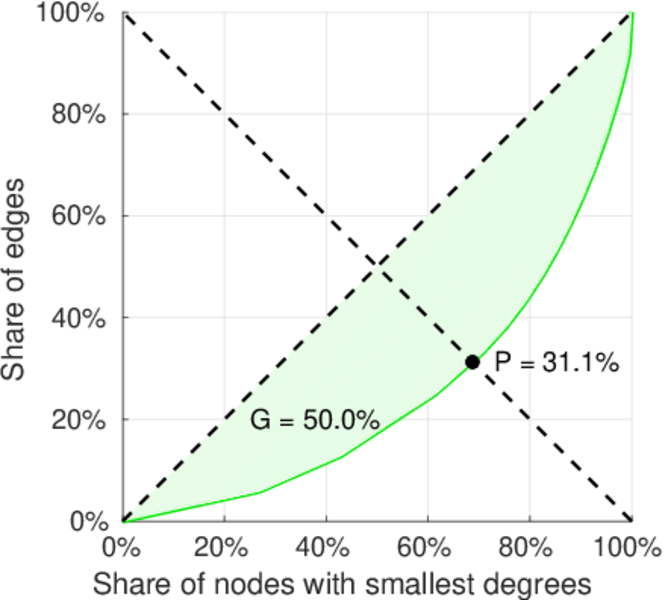
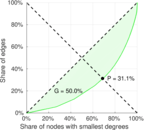
| Right balanced inequality ratio | P2 = | 0.311 250
|
| Relative edge distribution entropy | Her = | 0.722 515
|
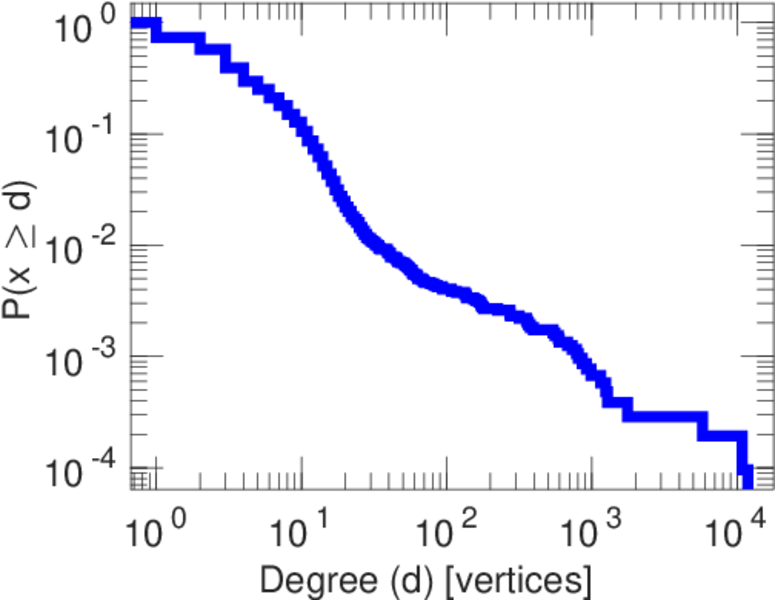
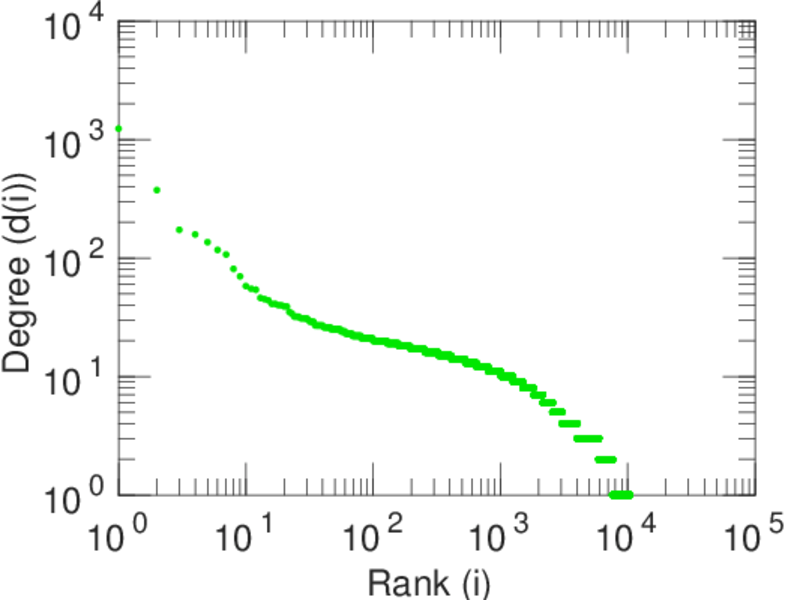
| Power law exponent | γ = | 2.382 83
|
| Tail power law exponent | γt = | 2.321 00
|
| Tail power law exponent with p | γ3 = | 2.321 00
|
| p-value | p = | 0.000 00
|
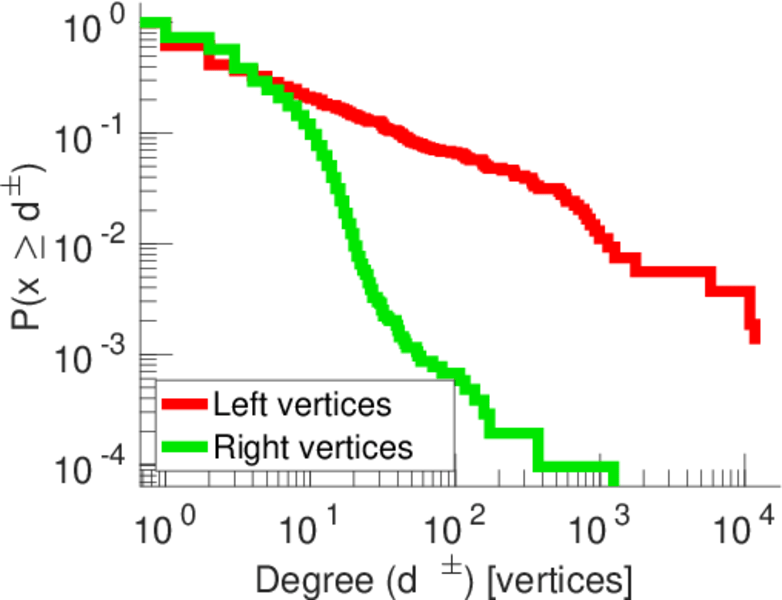
| Left tail power law exponent with p | γ3,1 = | 1.651 00
|
| Left p-value | p1 = | 0.003 000 00
|
| Right tail power law exponent with p | γ3,2 = | 5.901 00
|
| Right p-value | p2 = | 0.111 000
|
| Degree assortativity | ρ = | −0.281 242
|
| Degree assortativity p-value | pρ = | 0.000 00
|
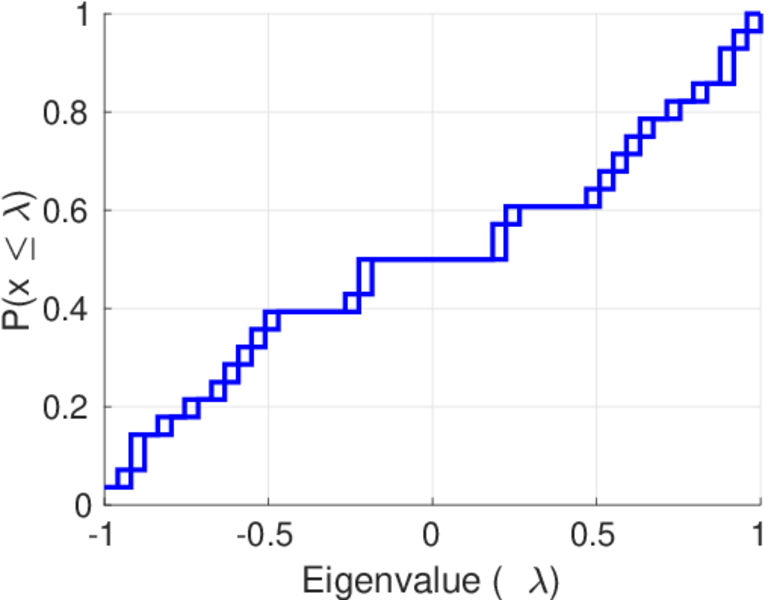
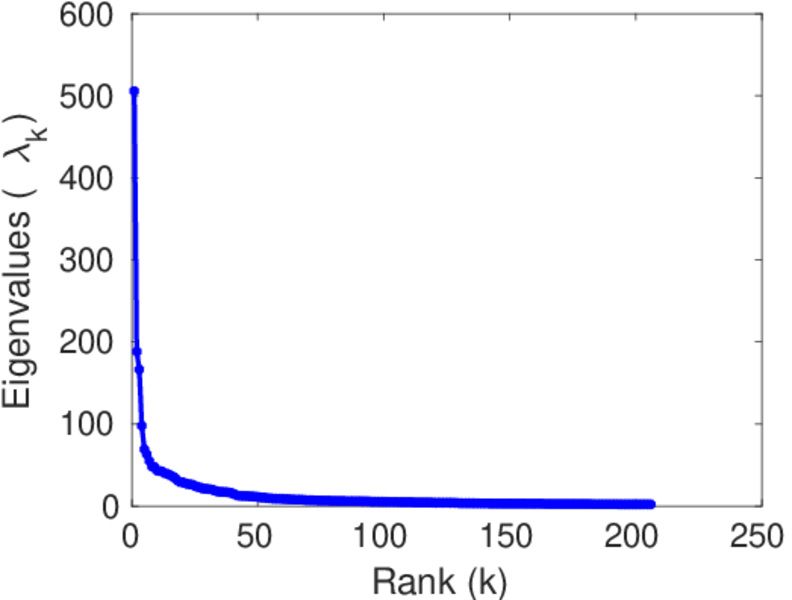
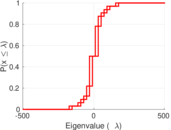
| Spectral norm | α = | 505.724
|
| Algebraic connectivity | a = | 0.041 027 0
|
| Spectral separation | |λ1[A] / λ2[A]| = | 2.686 92
|
| Controllability | C = | 9,959
|
| Relative controllability | Cr = | 0.910 412
|
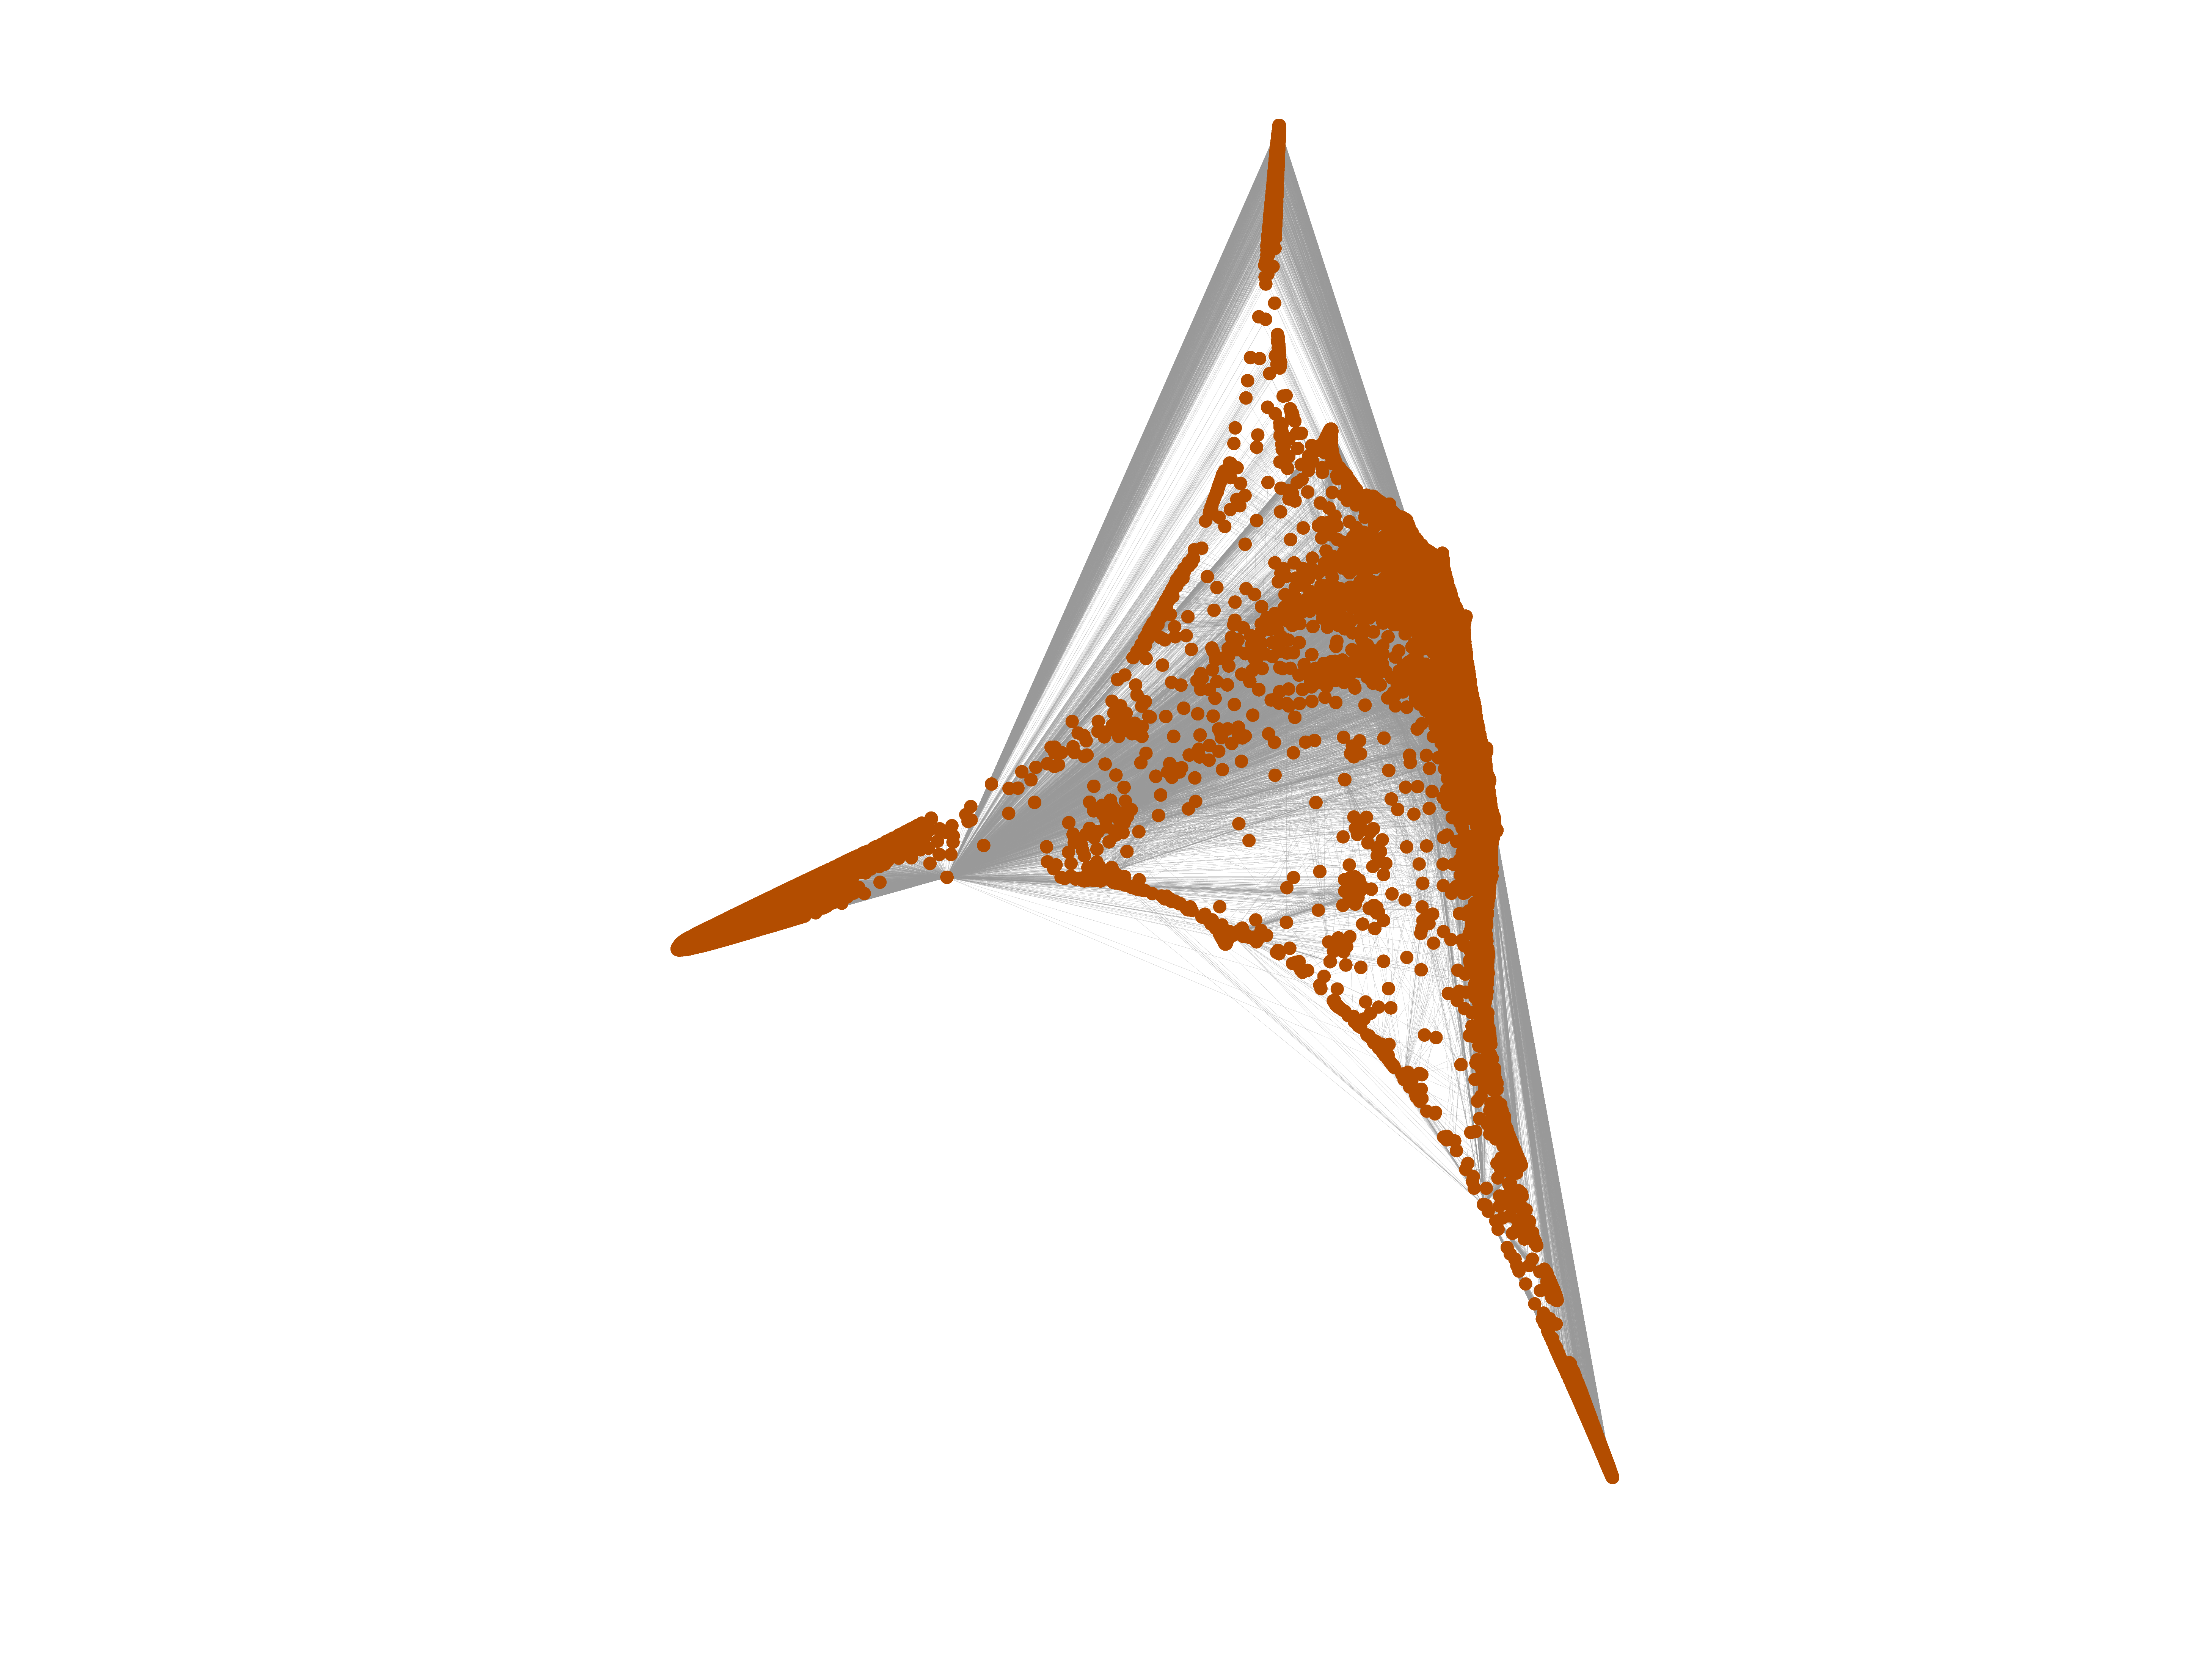
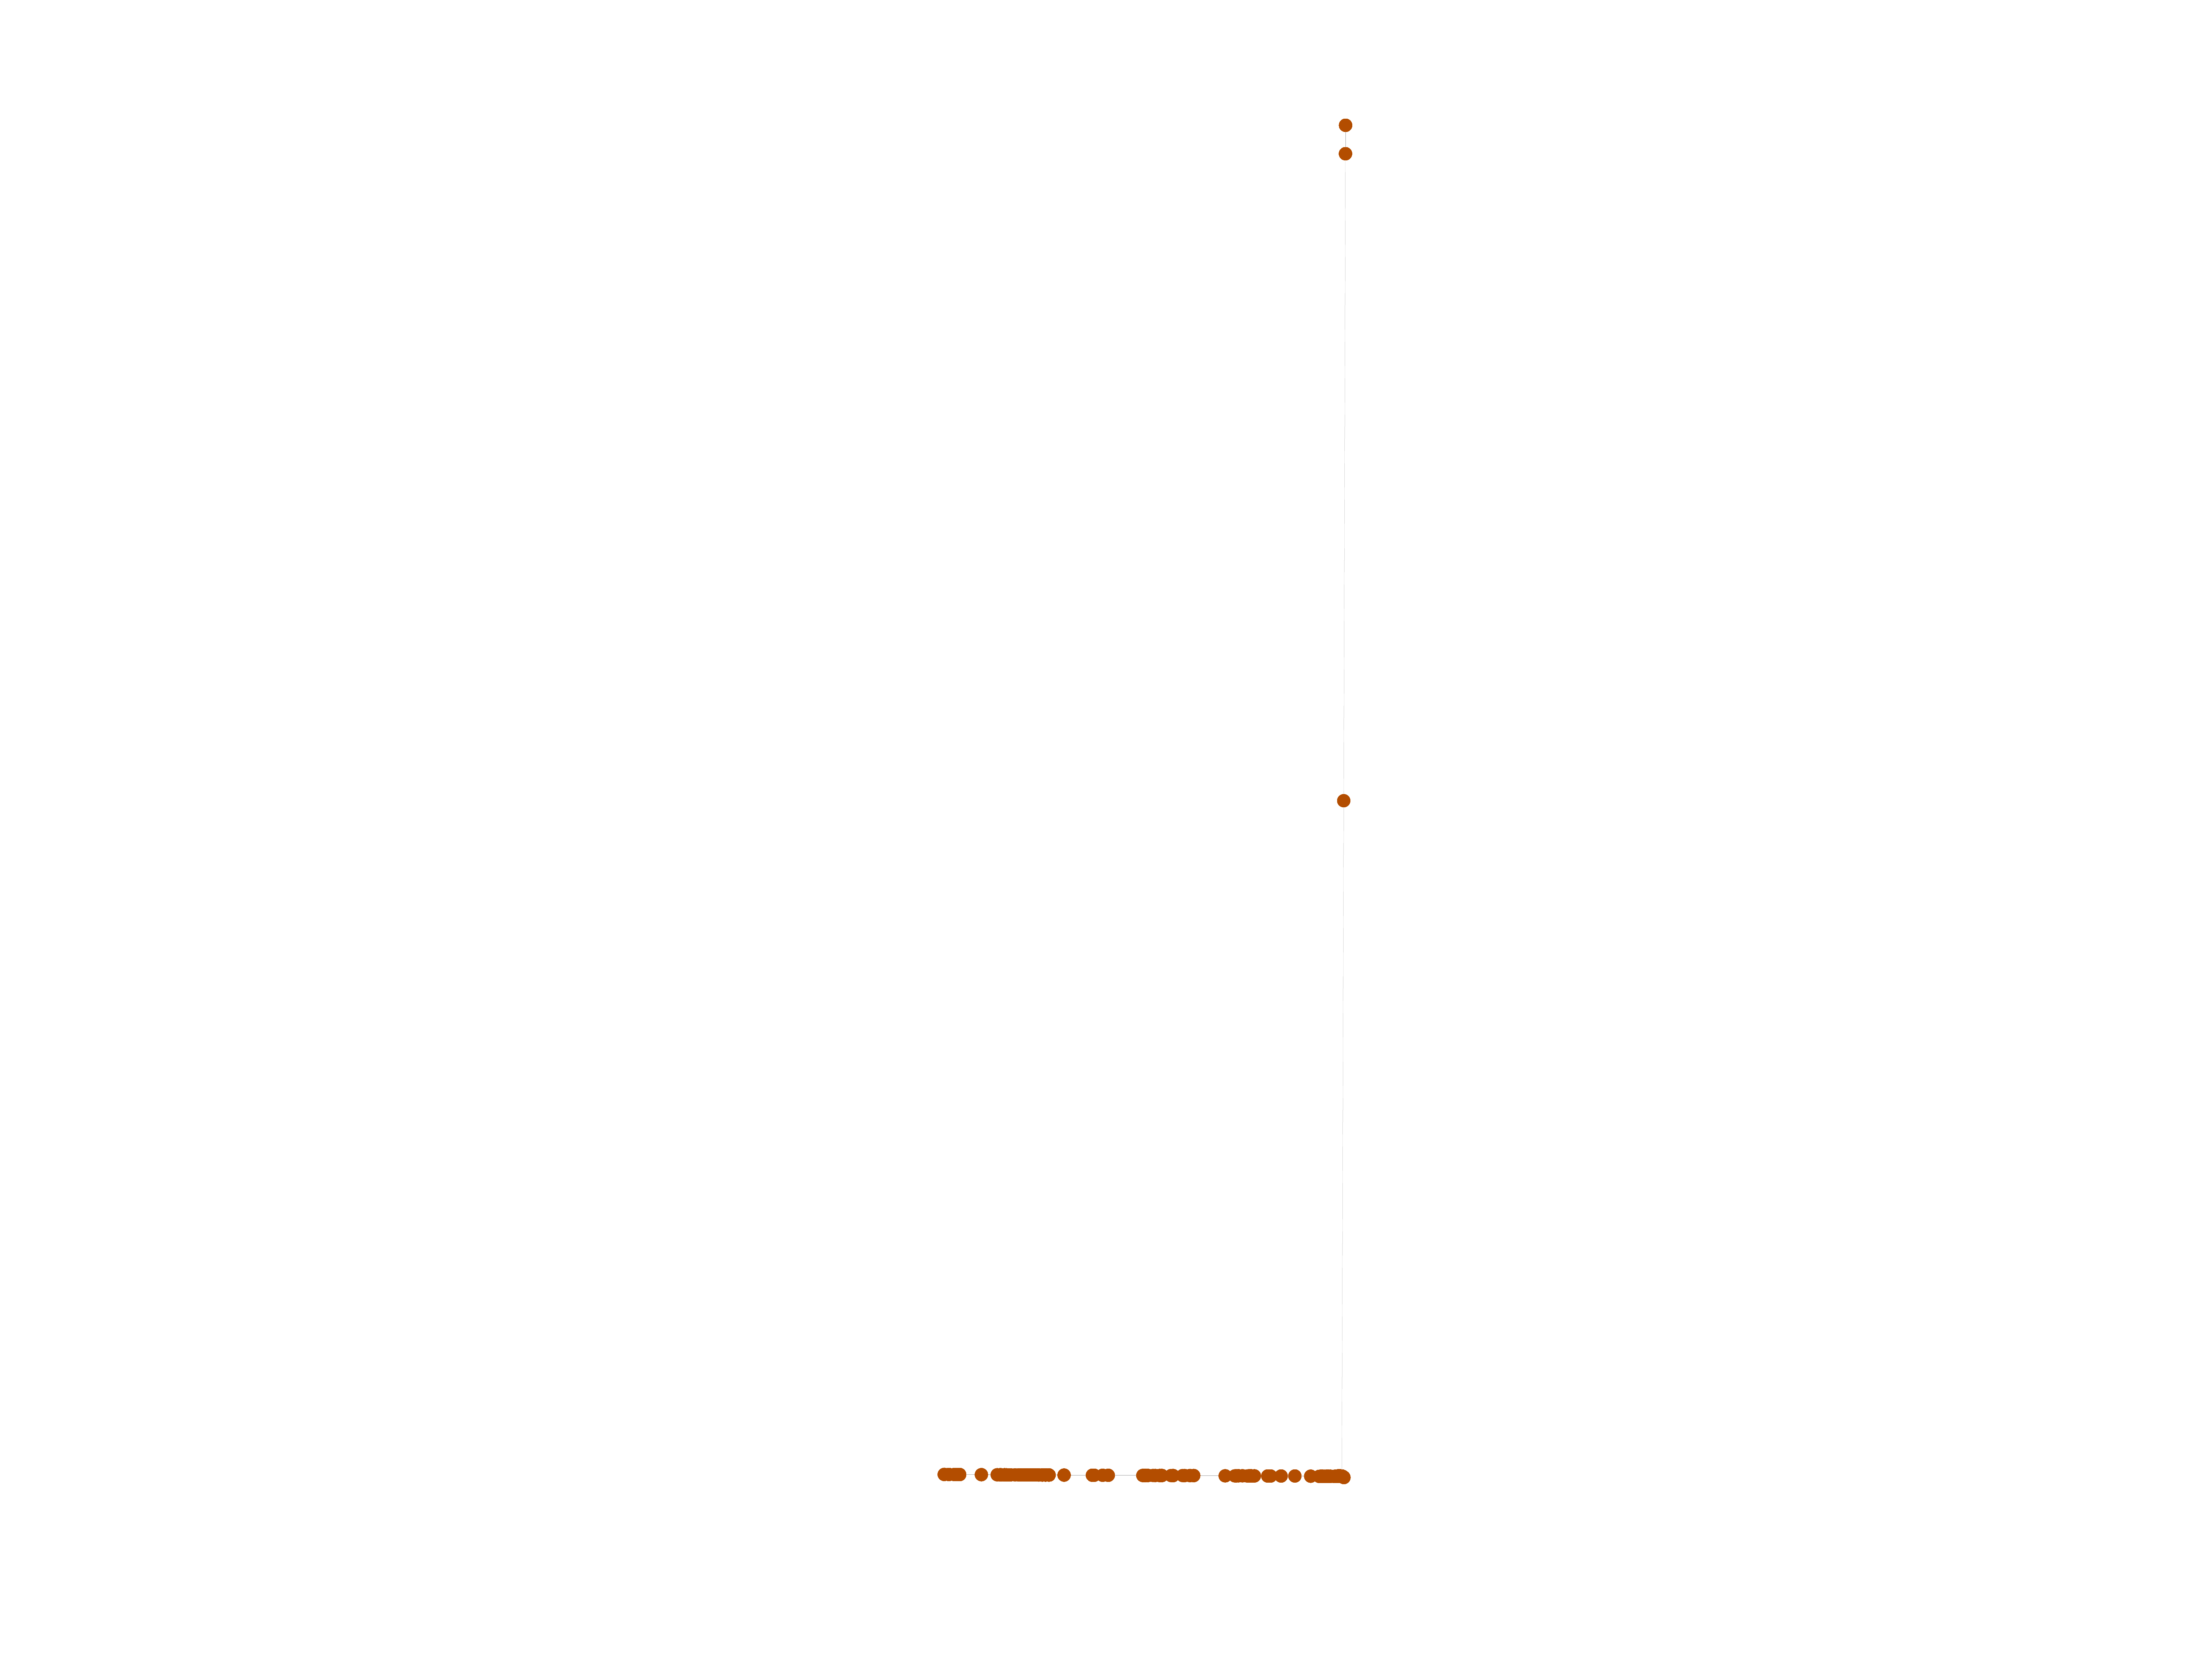
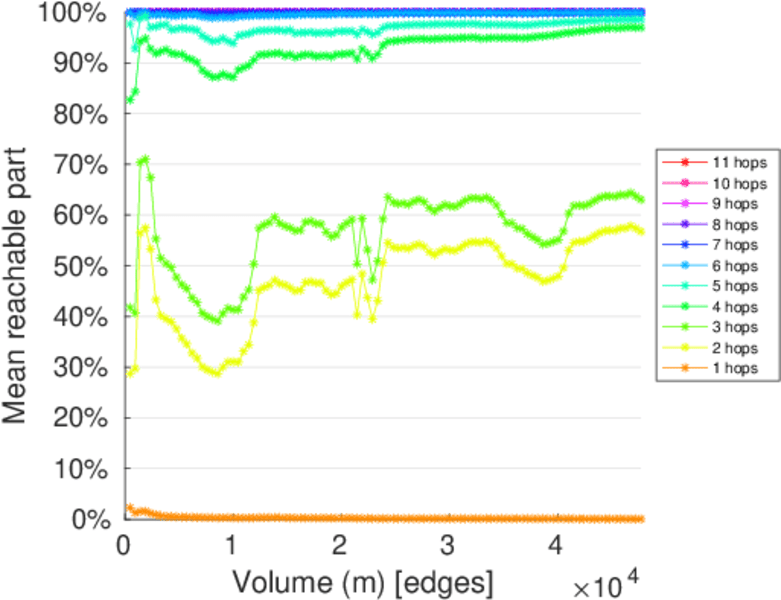
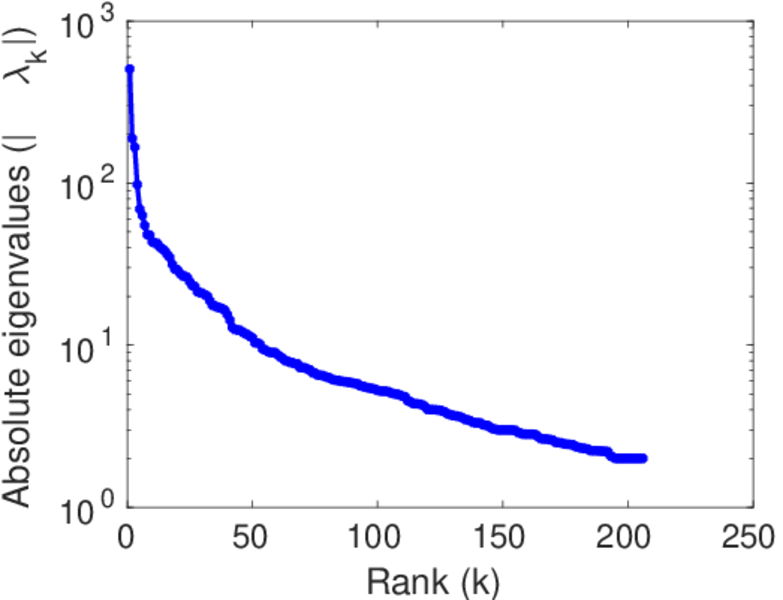
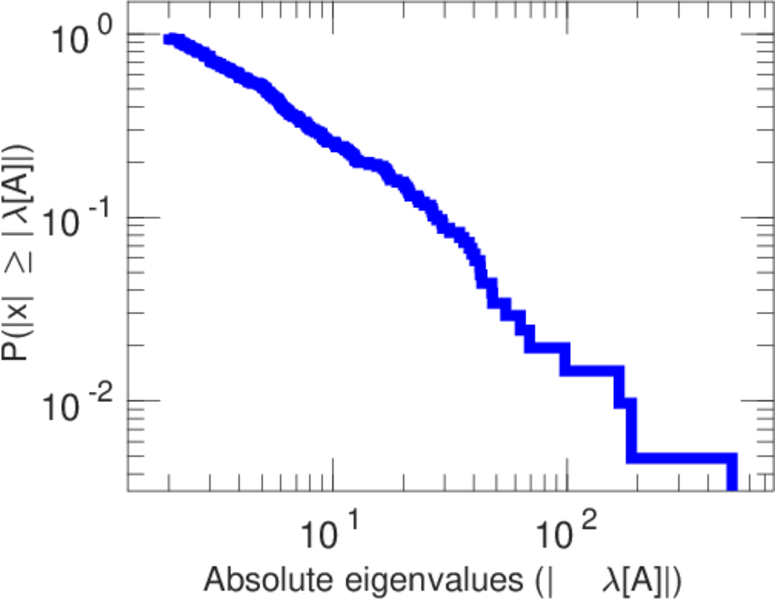
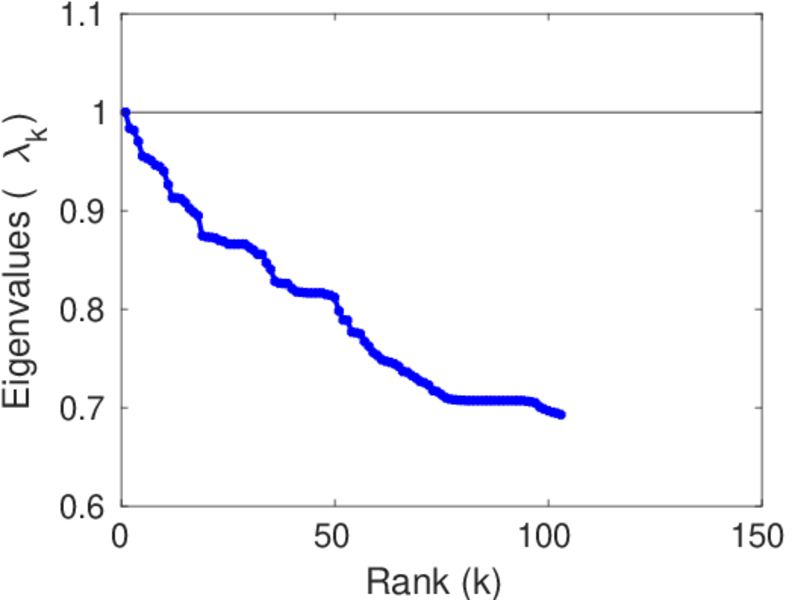
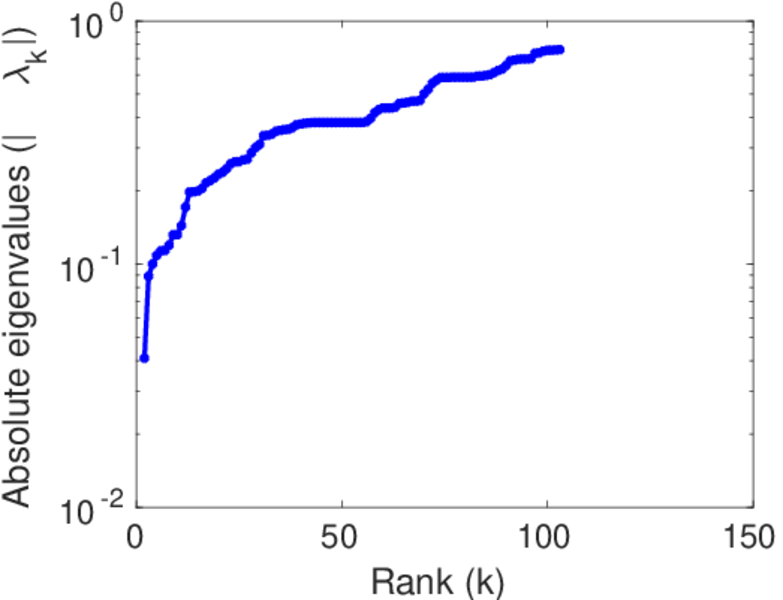
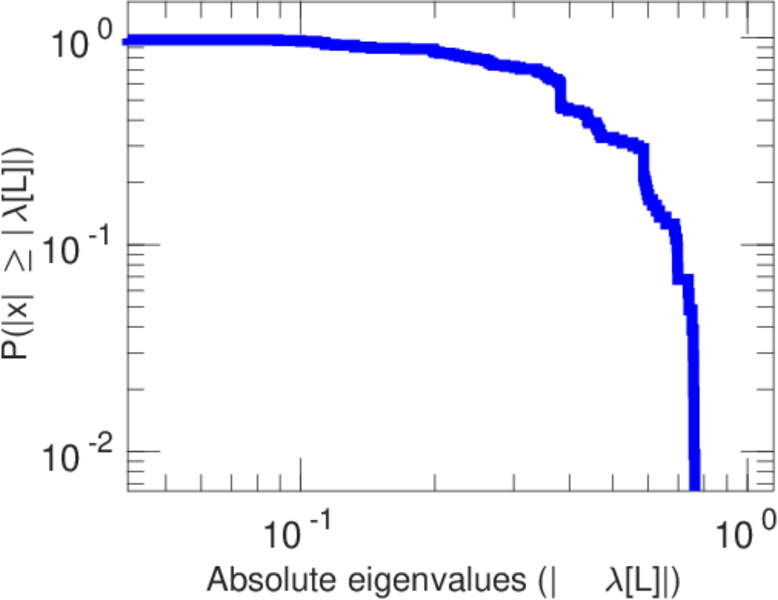
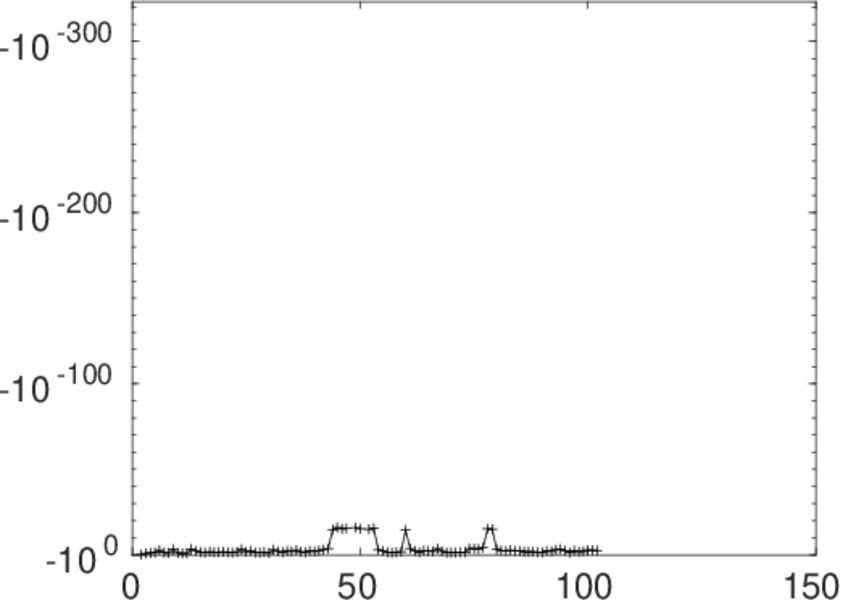
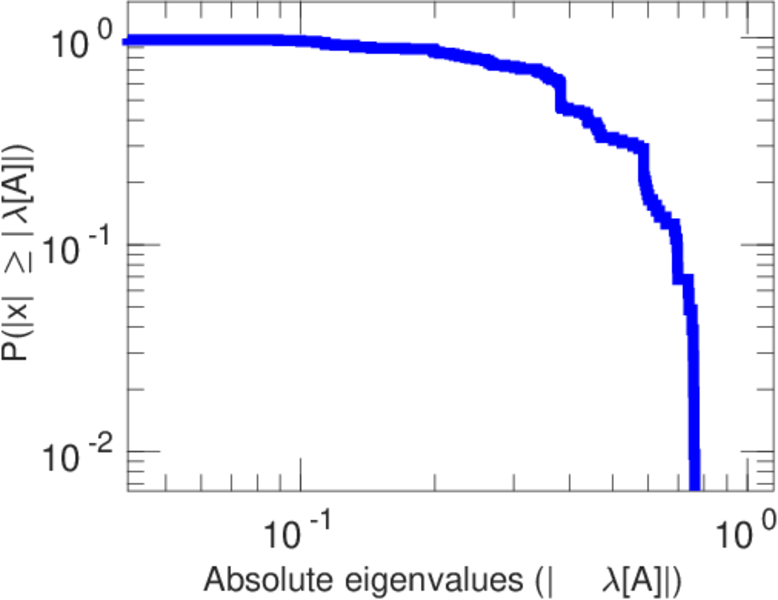
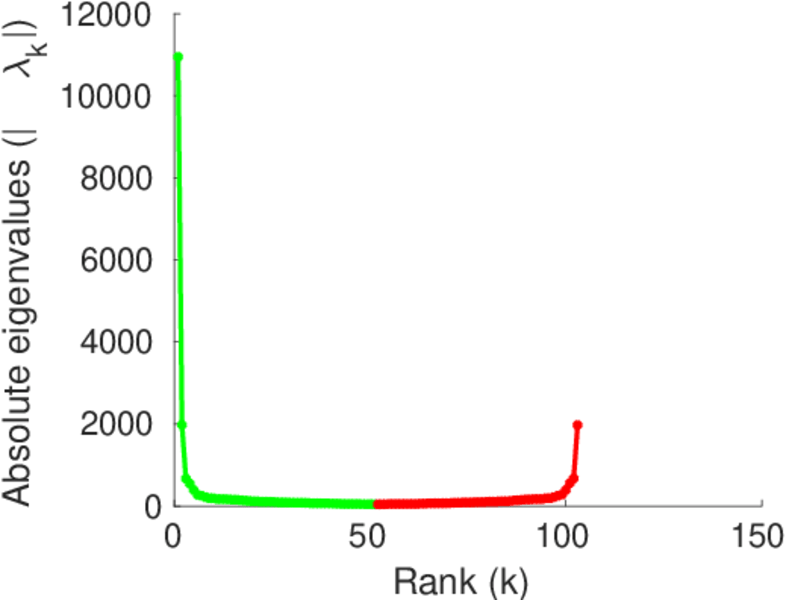
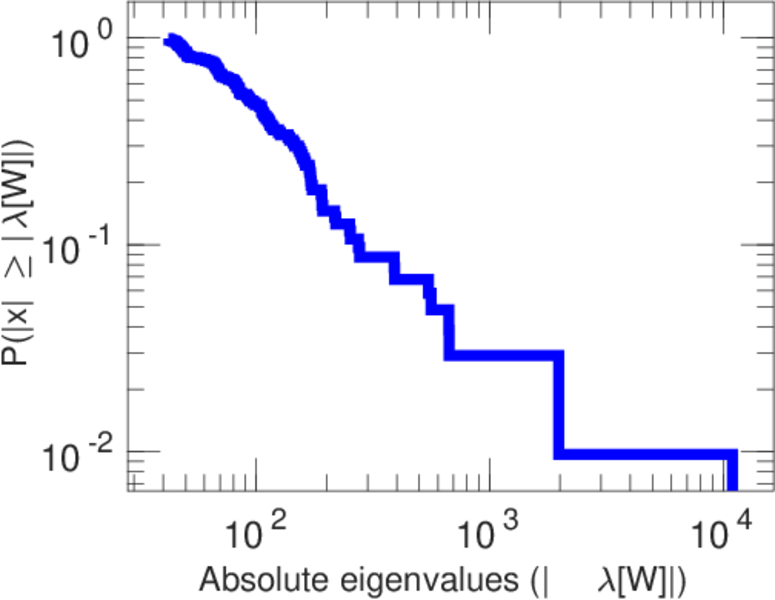
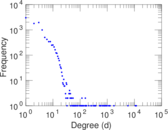
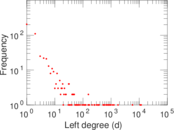
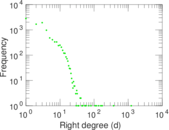
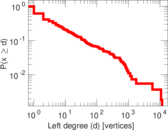
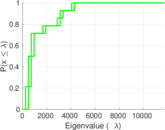
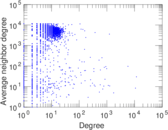
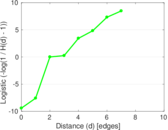
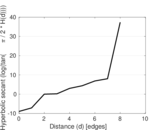
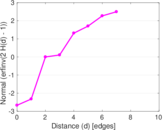
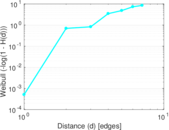
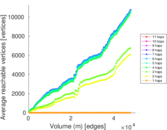
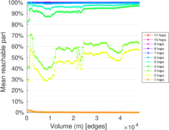
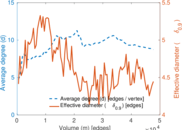
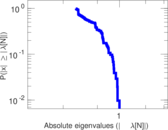
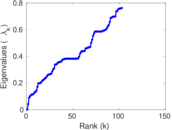
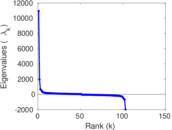
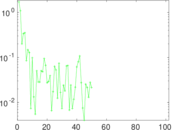
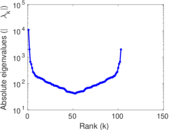
Plots


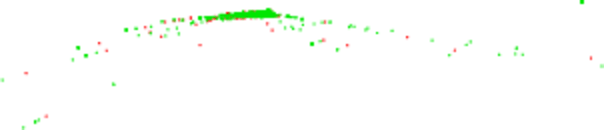


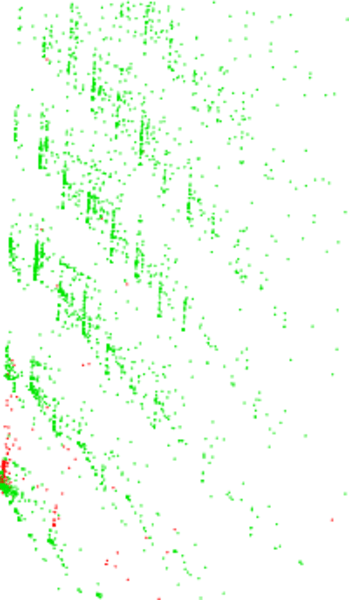
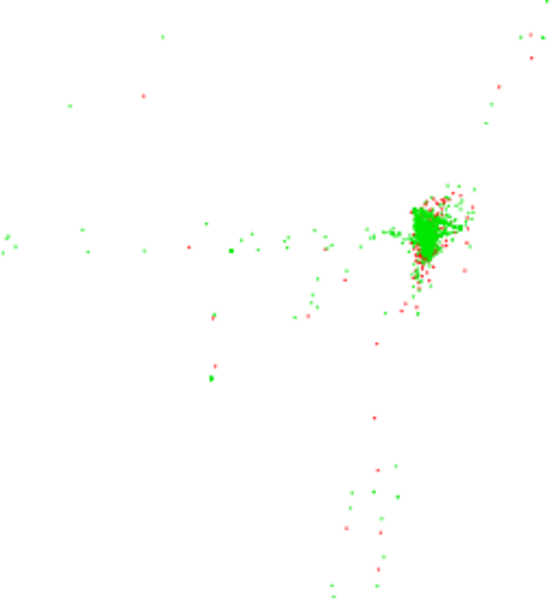
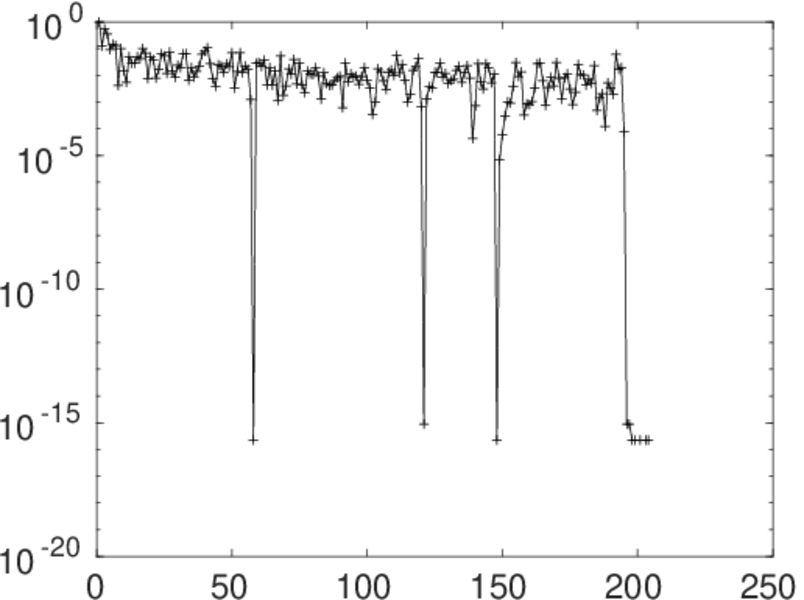
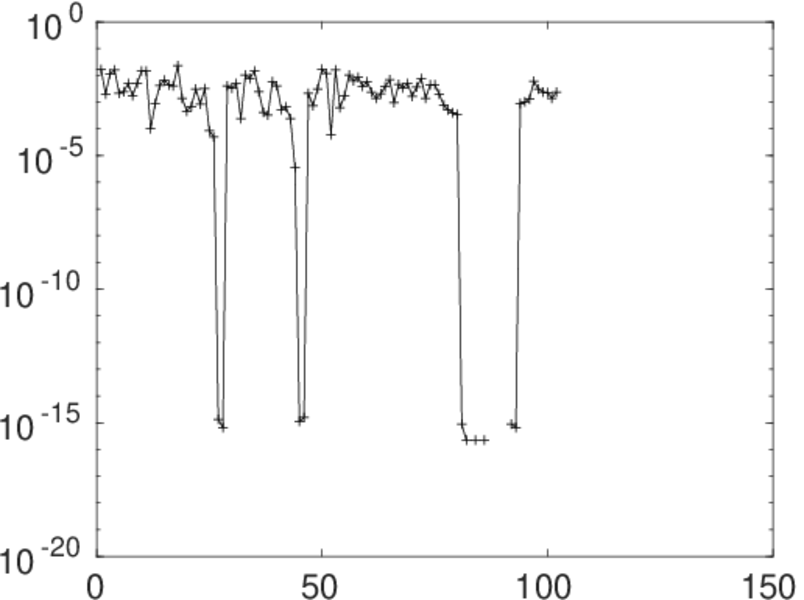
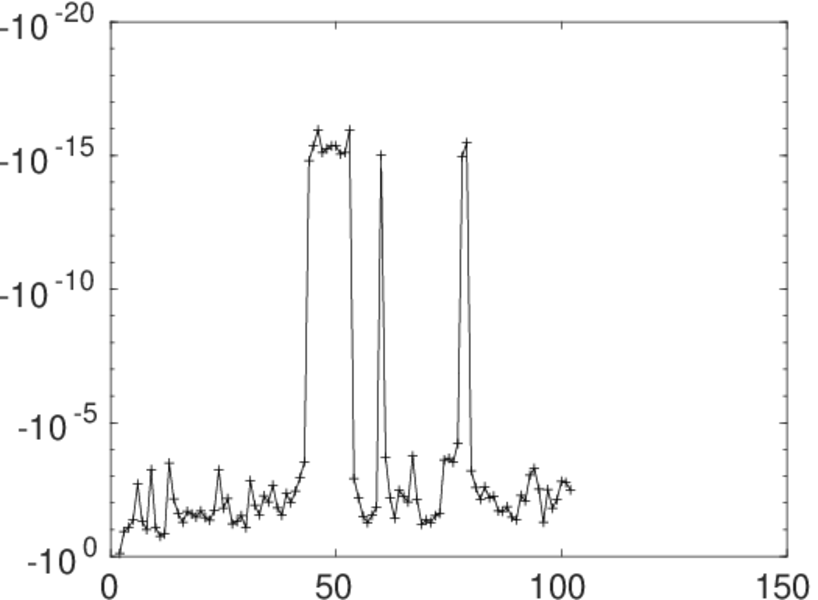
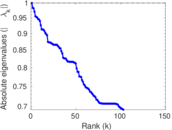
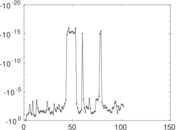
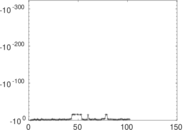
Matrix decompositions plots


Downloads
References
|
[1]
|
Jérôme Kunegis.
KONECT – The Koblenz Network Collection.
In Proc. Int. Conf. on World Wide Web Companion, pages
1343–1350, 2013.
[ http ]
|
|
[2]
|
Wikimedia Foundation.
Wikimedia downloads.
http://dumps.wikimedia.org/, January 2010.
|
 KONECT ‣ Networks ‣
Buy Me a Coffee
KONECT ‣ Networks ‣
Buy Me a Coffee