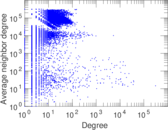
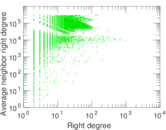
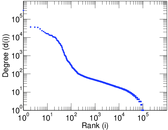
Wiktionary edits (cs)
This is the bipartite edit network of the Czech Wiktionary. It contains users
and pages from the Czech Wiktionary, connected by edit events. Each edge
represents an edit. The dataset includes the timestamp of each edit.
Metadata
Statistics
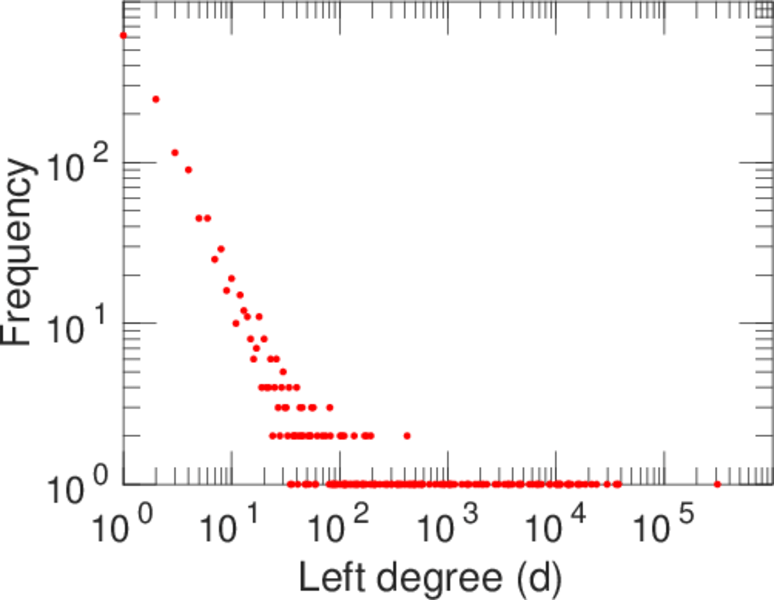
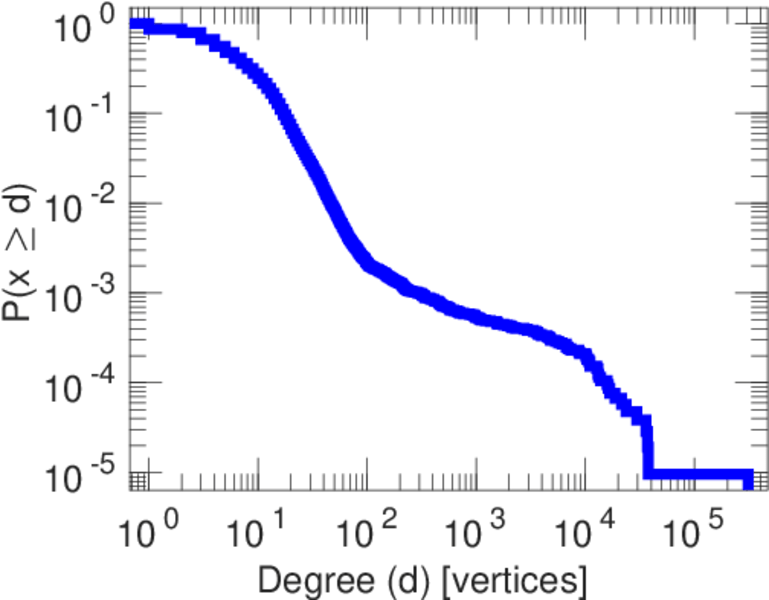
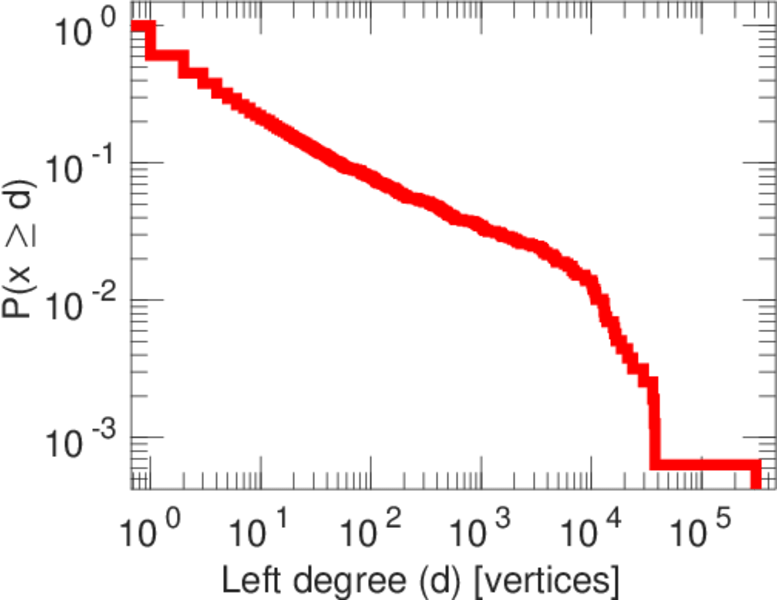
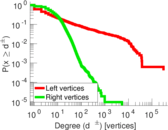
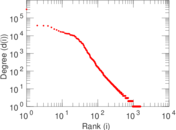
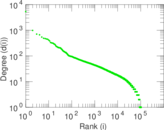
| Size | n = | 106,001
|
| Left size | n1 = | 1,578
|
| Right size | n2 = | 104,423
|
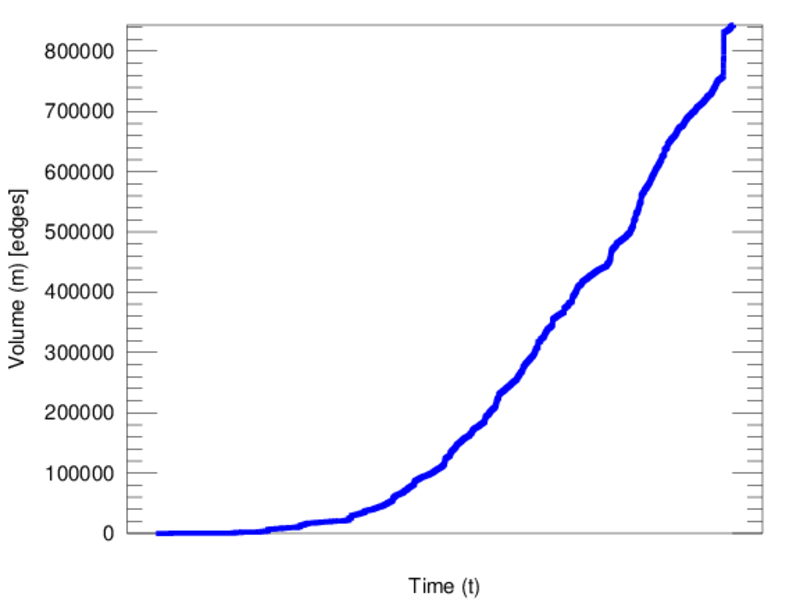
| Volume | m = | 843,327
|
| Unique edge count | m̿ = | 436,112
|
| Wedge count | s = | 5,173,570,699
|
| Claw count | z = | 96,308,705,556,701
|
| Cross count | x = | 1,774,857,088,304,190,720
|
| Square count | q = | 2,864,839,983
|
| 4-Tour count | T4 = | 43,613,988,192
|
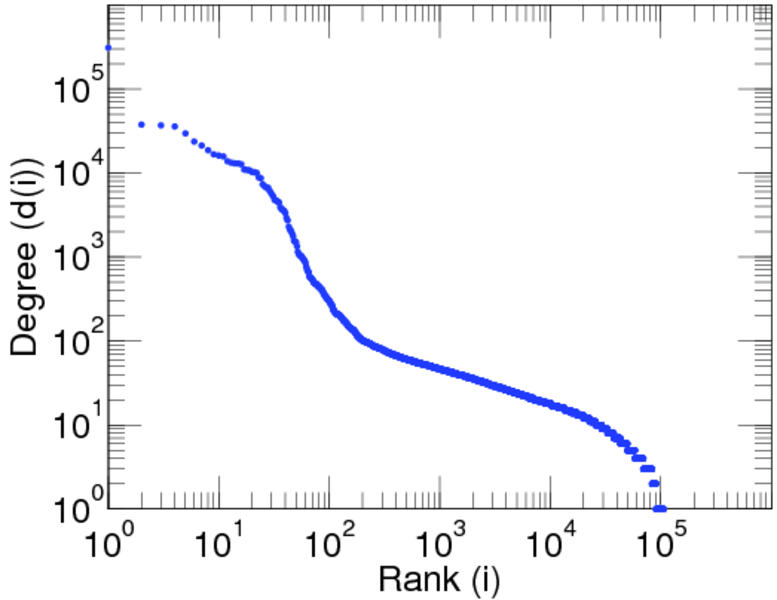
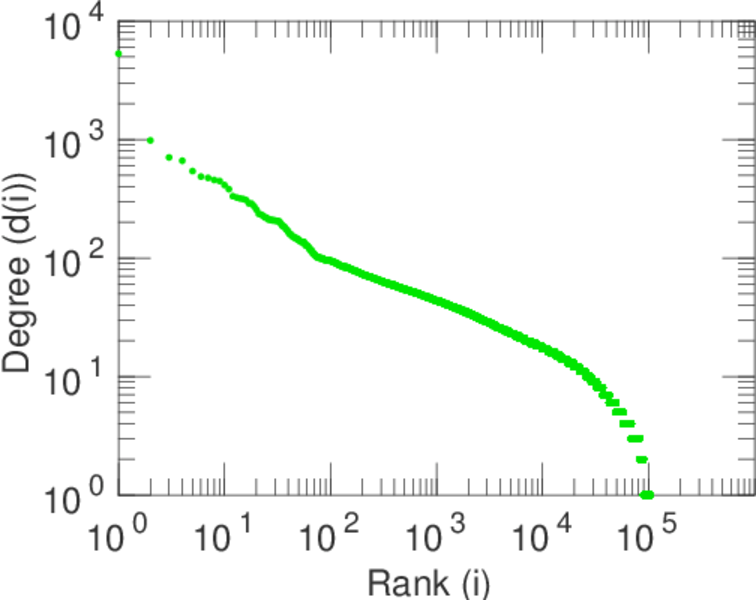
| Maximum degree | dmax = | 310,284
|
| Maximum left degree | d1max = | 310,284
|
| Maximum right degree | d2max = | 5,308
|
| Average degree | d = | 15.911 7
|
| Average left degree | d1 = | 534.428
|
| Average right degree | d2 = | 8.076 07
|
| Average edge multiplicity | m̃ = | 1.933 74
|
| Size of LCC | N = | 105,490
|
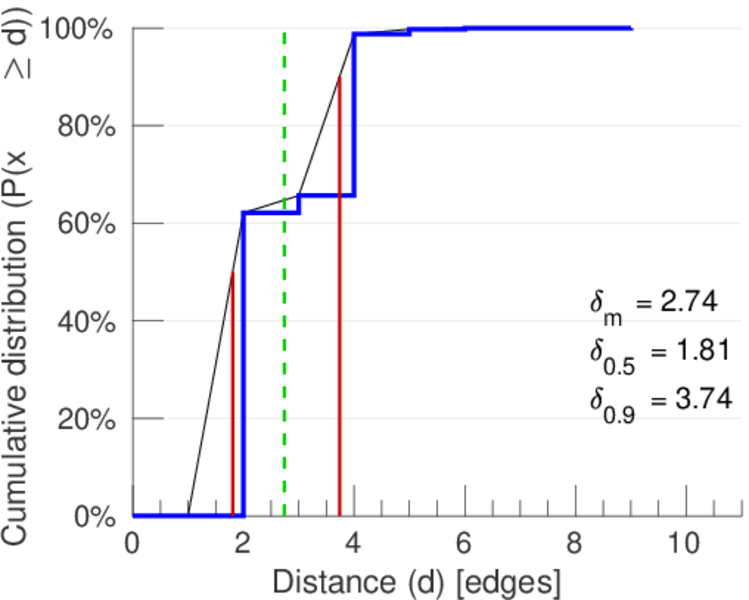
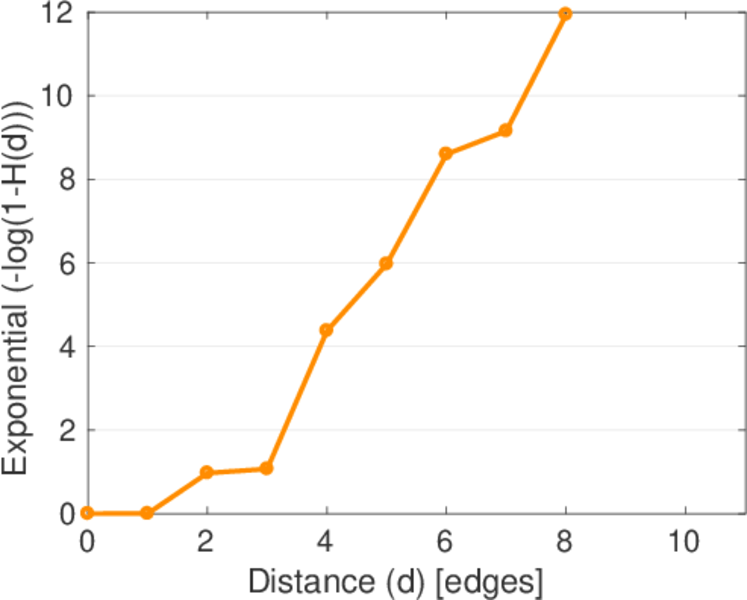
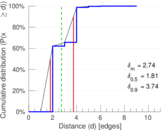
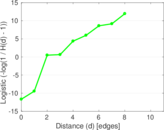
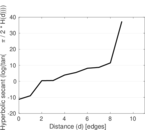
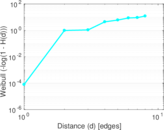
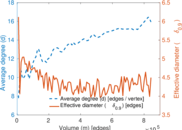
| Diameter | δ = | 11
|
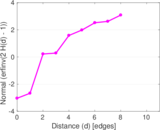
| 50-Percentile effective diameter | δ0.5 = | 1.805 03
|
| 90-Percentile effective diameter | δ0.9 = | 3.735 88
|
| Median distance | δM = | 2
|
| Mean distance | δm = | 2.737 80
|
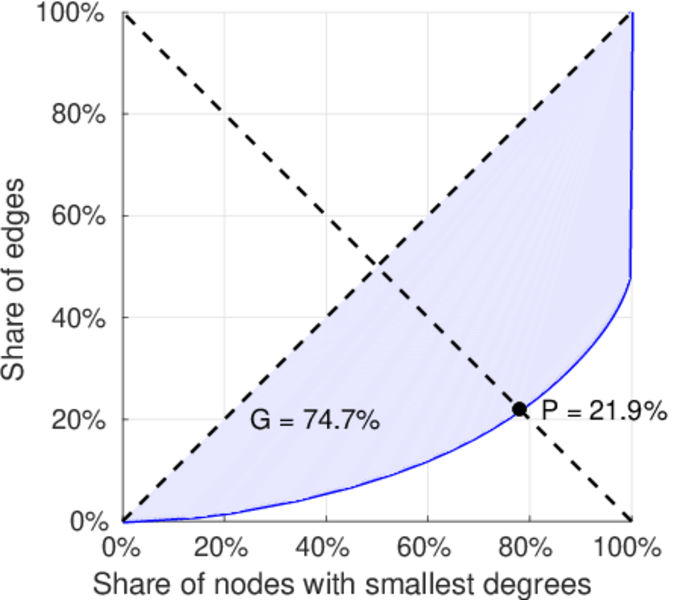
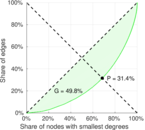
| Gini coefficient | G = | 0.747 689
|
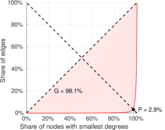
| Balanced inequality ratio | P = | 0.217 959
|
| Left balanced inequality ratio | P1 = | 0.028 805 0
|
| Right balanced inequality ratio | P2 = | 0.313 948
|
| Relative edge distribution entropy | Her = | 0.705 452
|
| Power law exponent | γ = | 1.881 41
|
| Tail power law exponent | γt = | 3.641 00
|
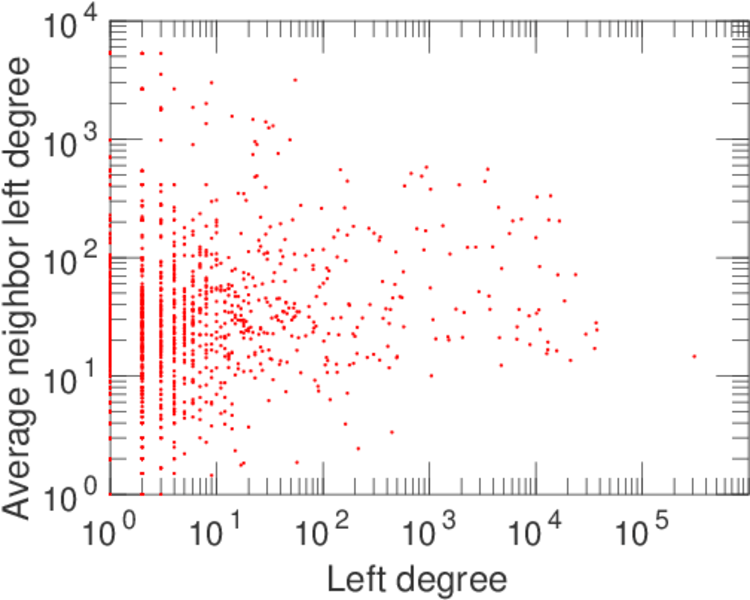
| Degree assortativity | ρ = | −0.208 550
|
| Degree assortativity p-value | pρ = | 0.000 00
|
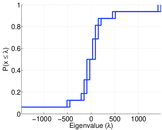
| Algebraic connectivity | a = | 0.071 125 5
|
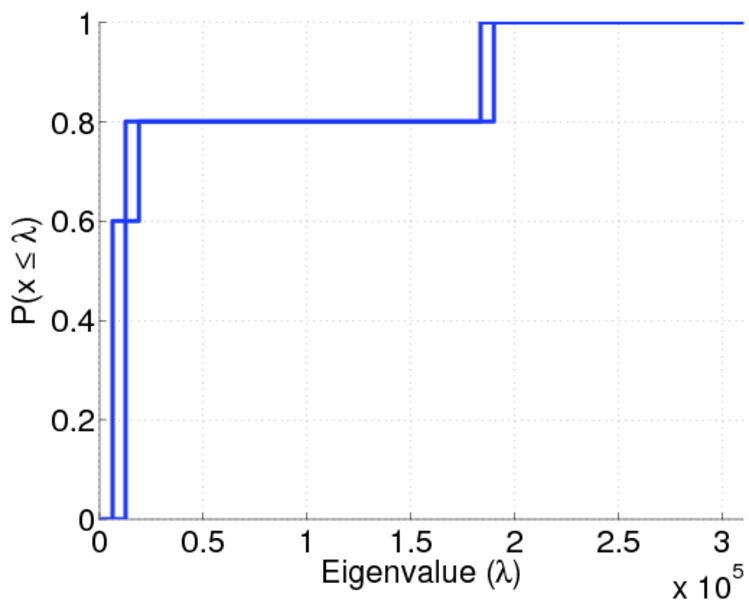
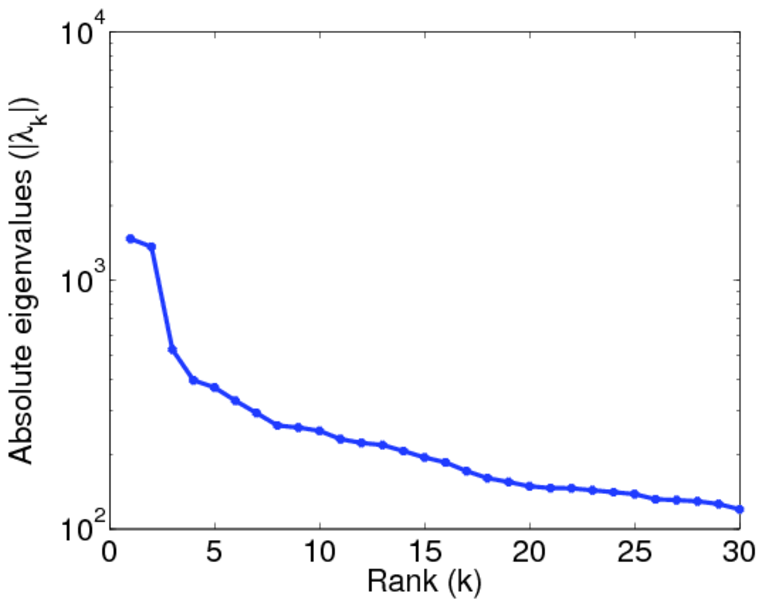
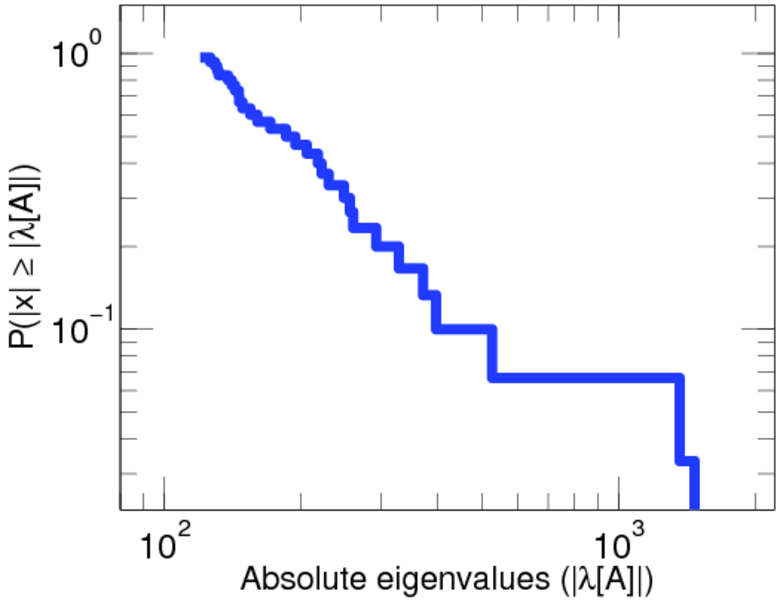
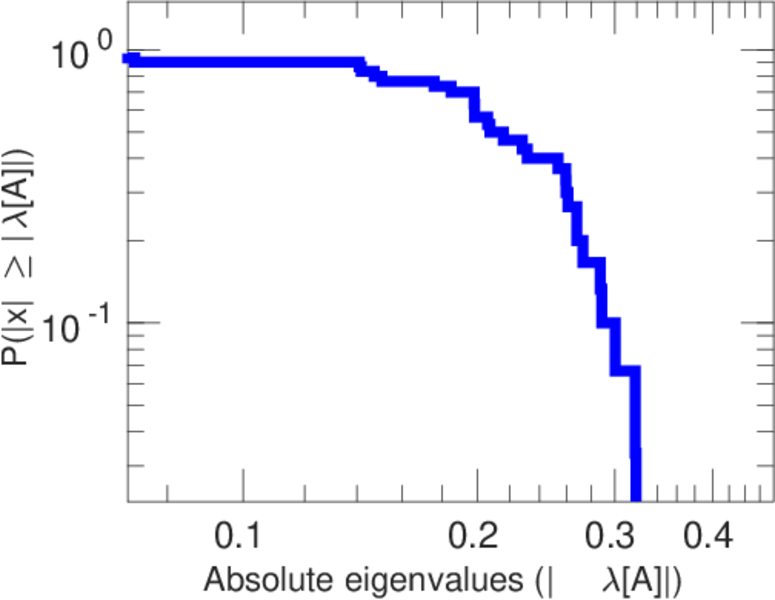
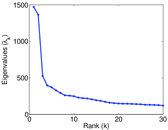
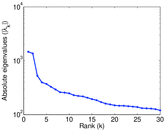
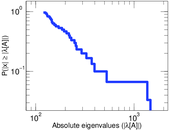
| Spectral separation | |λ1[A] / λ2[A]| = | 1.077 36
|
| Controllability | C = | 103,077
|
| Relative controllability | Cr = | 0.973 867
|
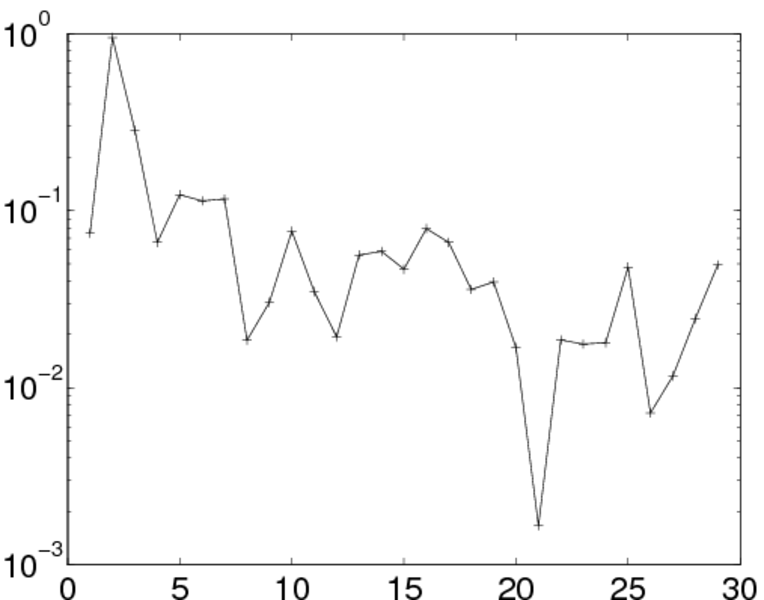
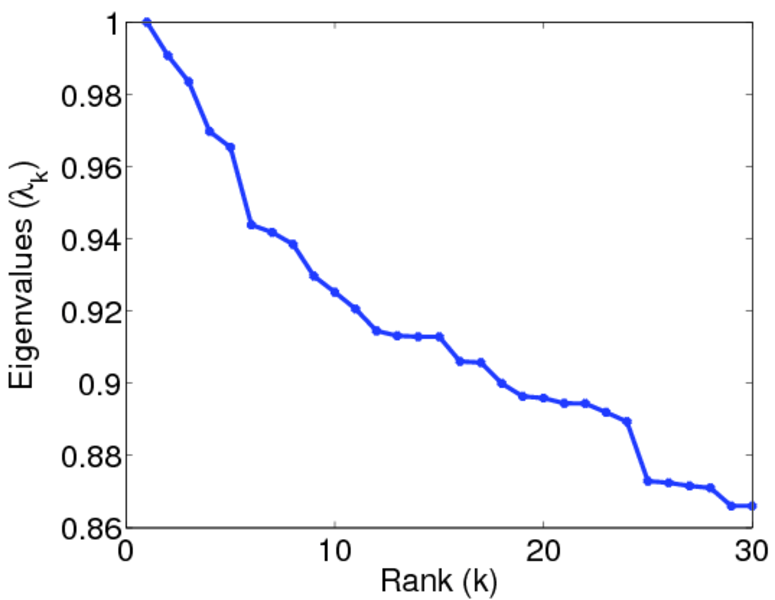
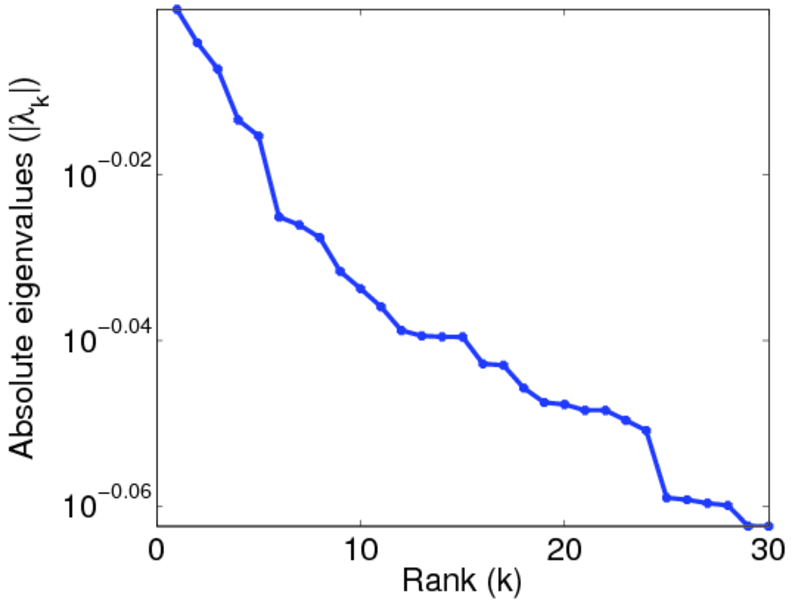
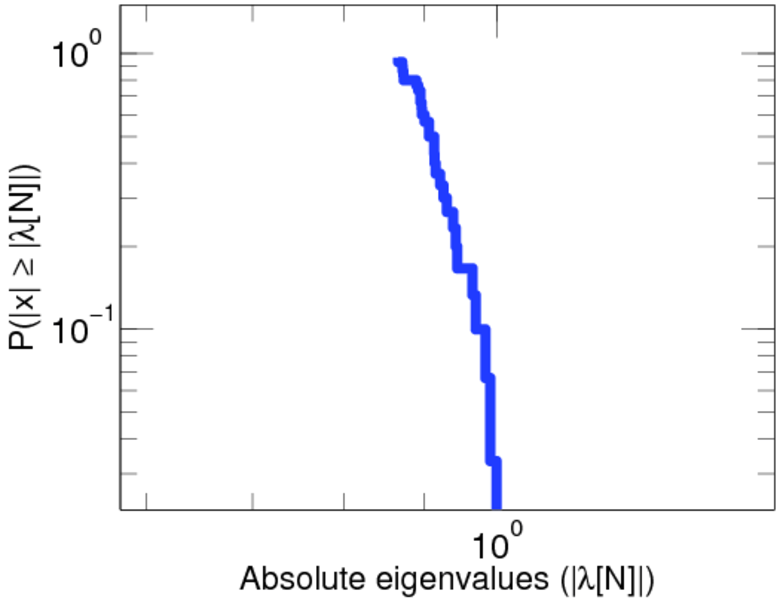
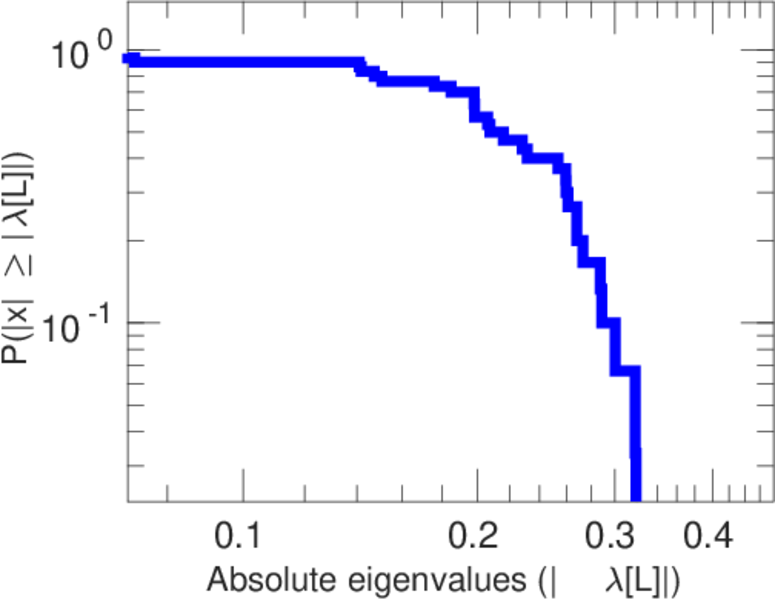
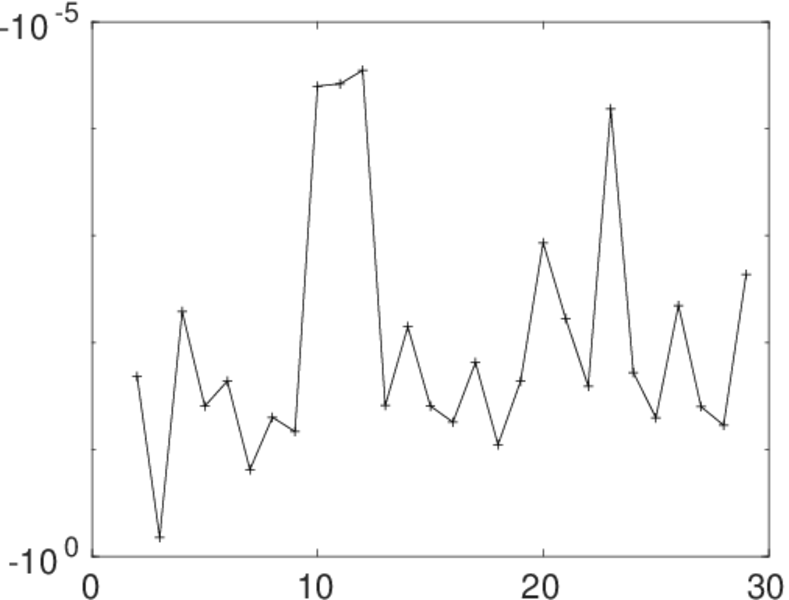
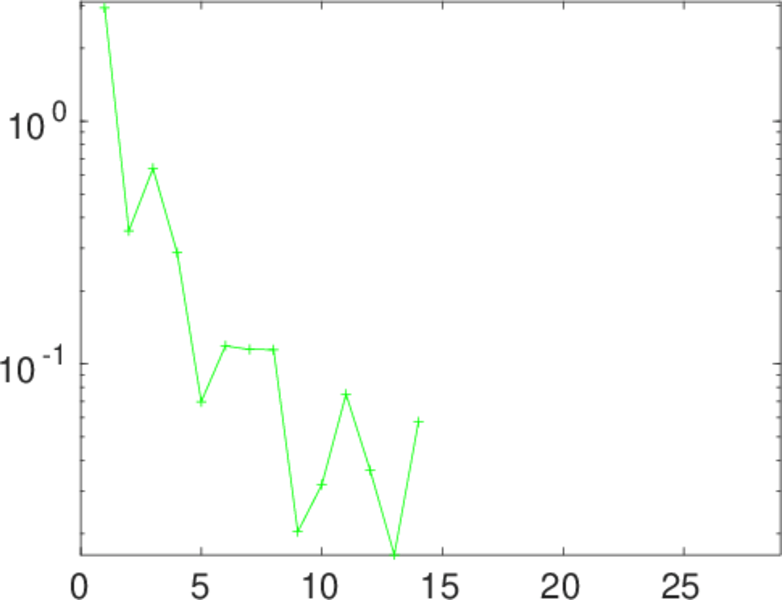
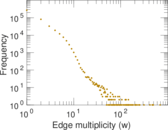
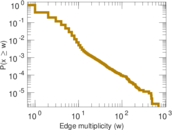
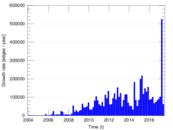
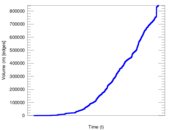
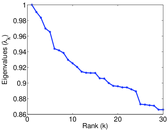
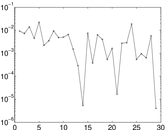
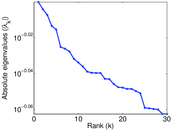
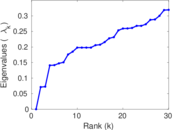
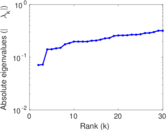
Plots


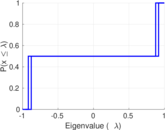
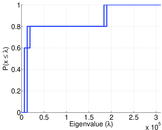


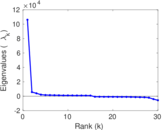
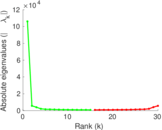
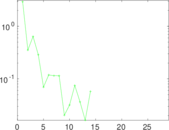
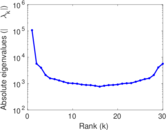
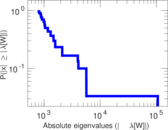
Matrix decompositions plots


Downloads
References
|
[1]
|
Jérôme Kunegis.
KONECT – The Koblenz Network Collection.
In Proc. Int. Conf. on World Wide Web Companion, pages
1343–1350, 2013.
[ http ]
|
|
[2]
|
Wikimedia Foundation.
Wikimedia downloads.
http://dumps.wikimedia.org/, January 2010.
|
 KONECT ‣ Networks ‣
Buy Me a Coffee
KONECT ‣ Networks ‣
Buy Me a Coffee