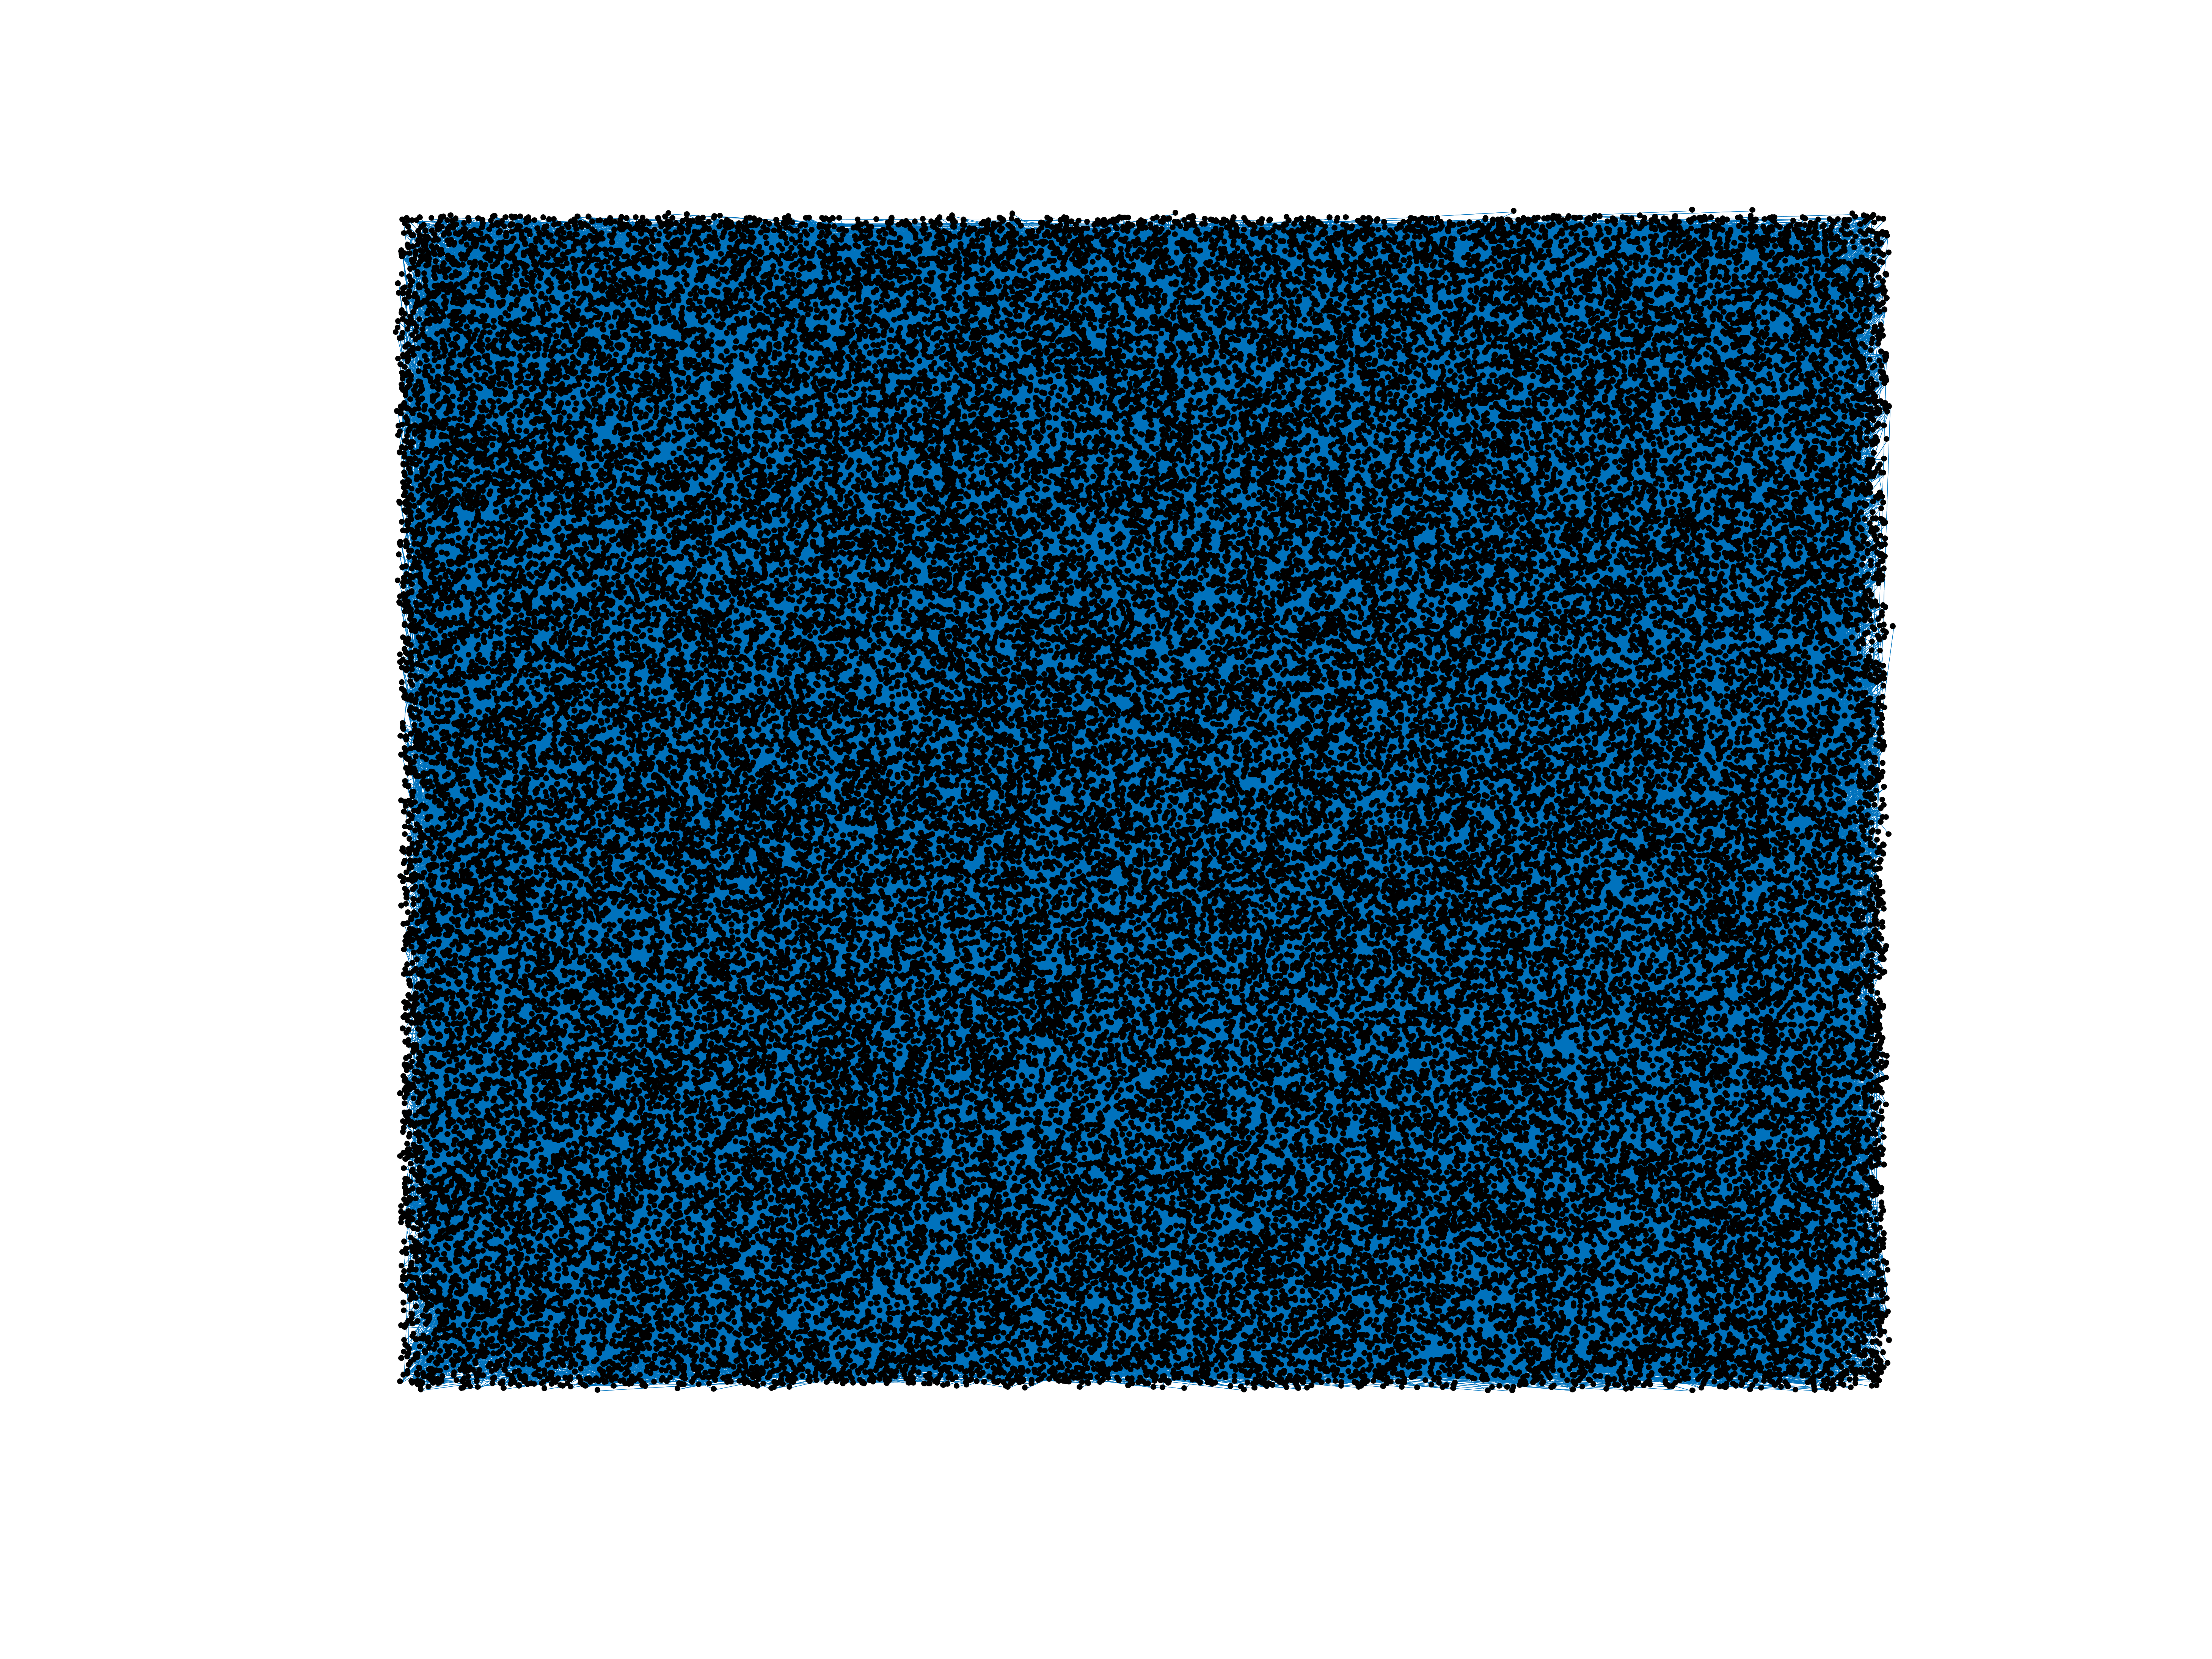
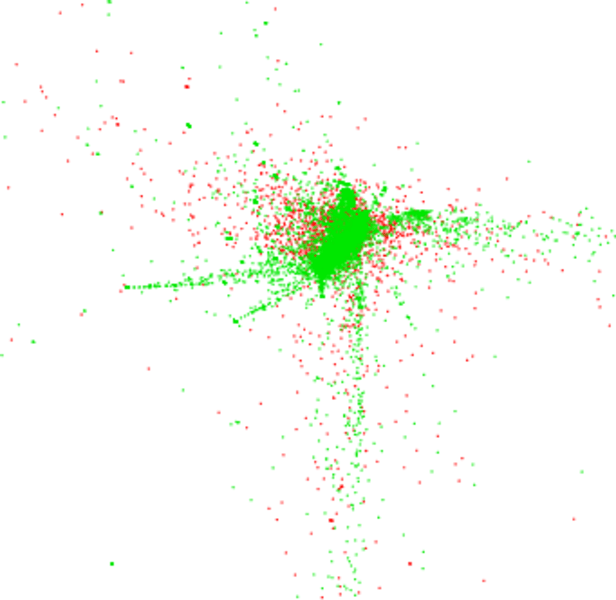
Wikipedia edits (cv)
This is the bipartite edit network of the Chuvash Wikipedia. It contains users
and pages from the Chuvash Wikipedia, connected by edit events. Each edge
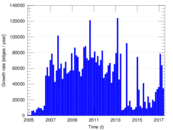
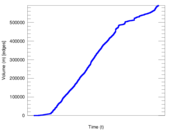
represents an edit. The dataset includes the timestamp of each edit.
Metadata
Statistics
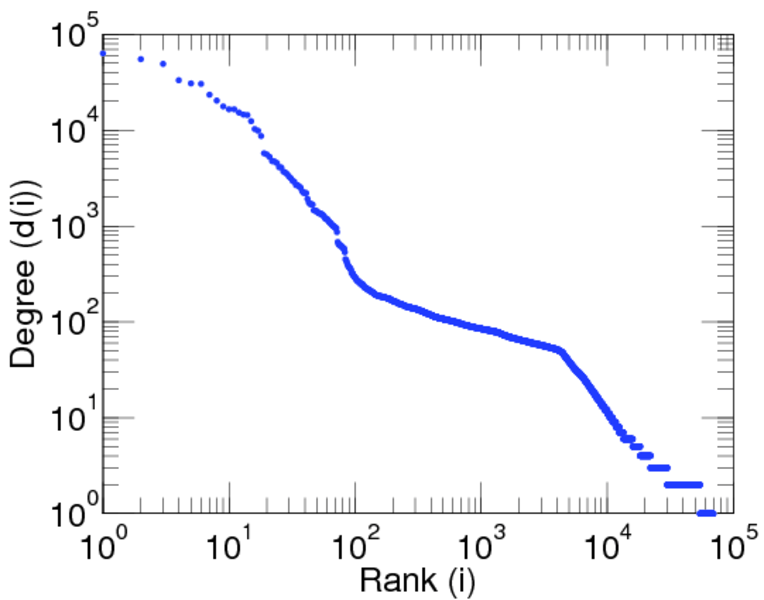
| Size | n = | 70,003
|
| Left size | n1 = | 2,266
|
| Right size | n2 = | 67,737
|
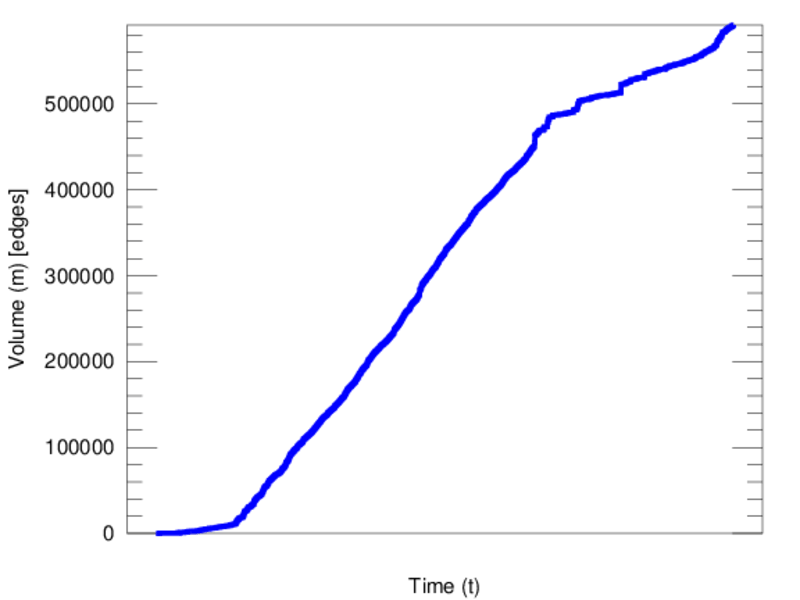
| Volume | m = | 591,878
|
| Unique edge count | m̿ = | 286,430
|
| Wedge count | s = | 1,548,103,349
|
| Claw count | z = | 11,229,432,951,521
|
| Cross count | x = | 74,503,298,214,840,912
|
| Square count | q = | 1,886,481,972
|
| 4-Tour count | T4 = | 21,284,867,252
|
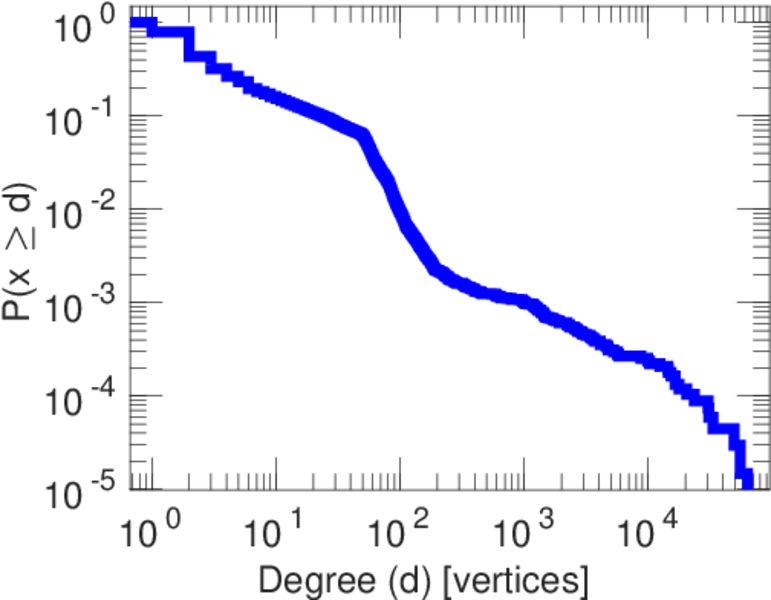
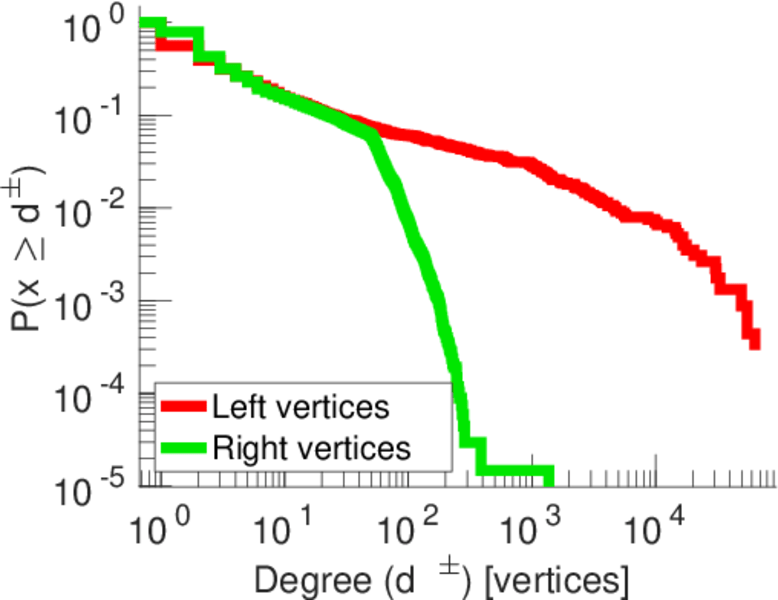
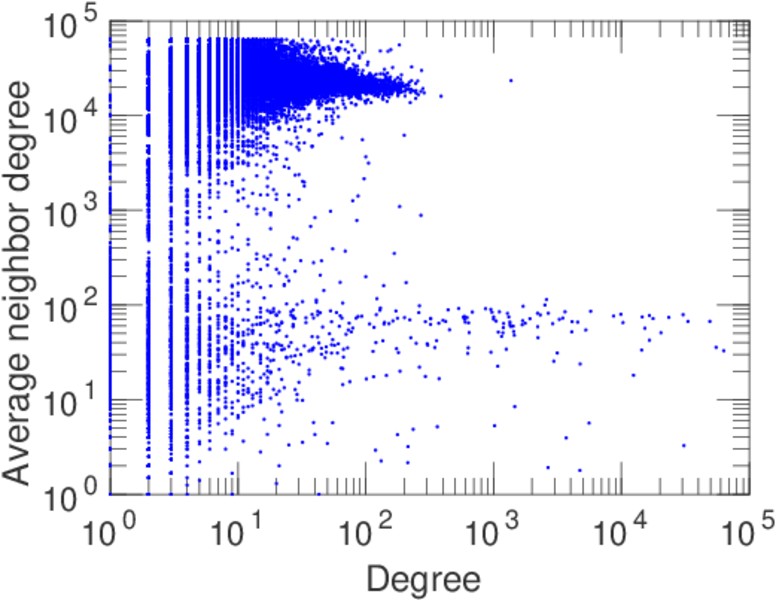
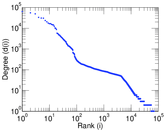
| Maximum degree | dmax = | 63,318
|
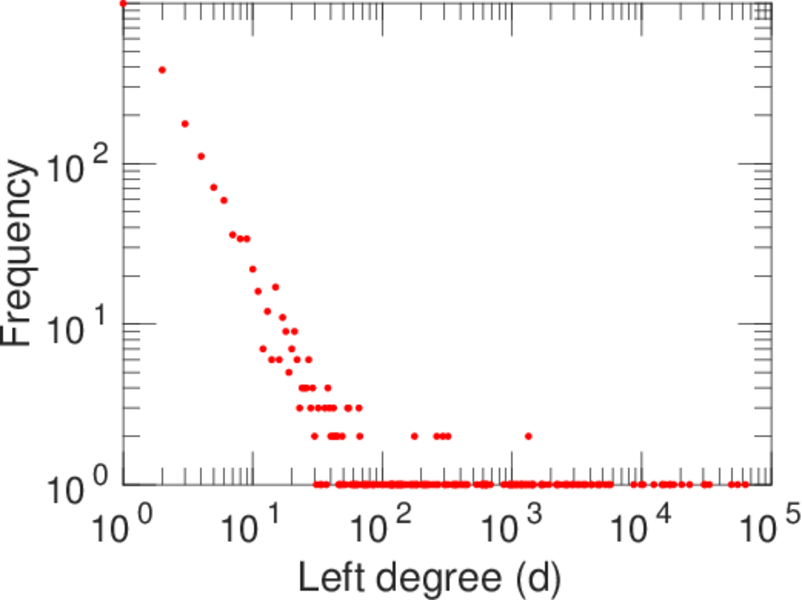
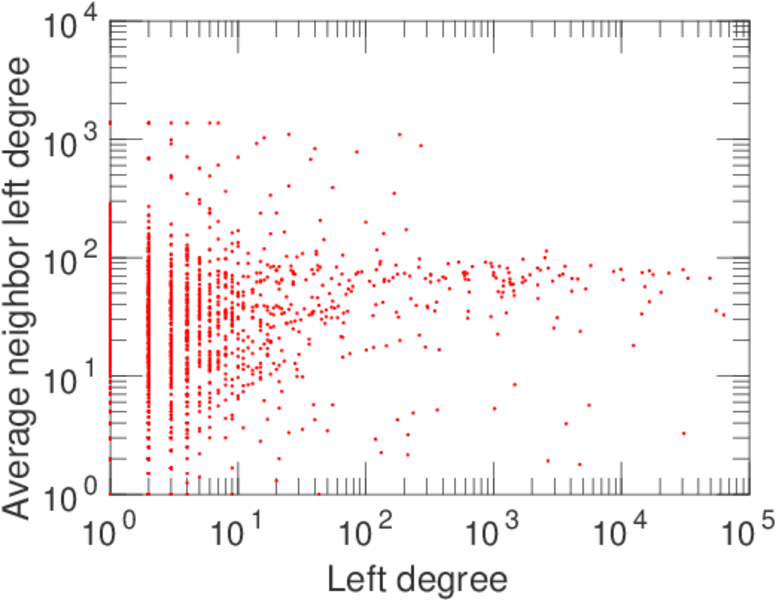
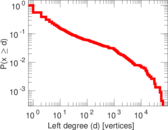
| Maximum left degree | d1max = | 63,318
|
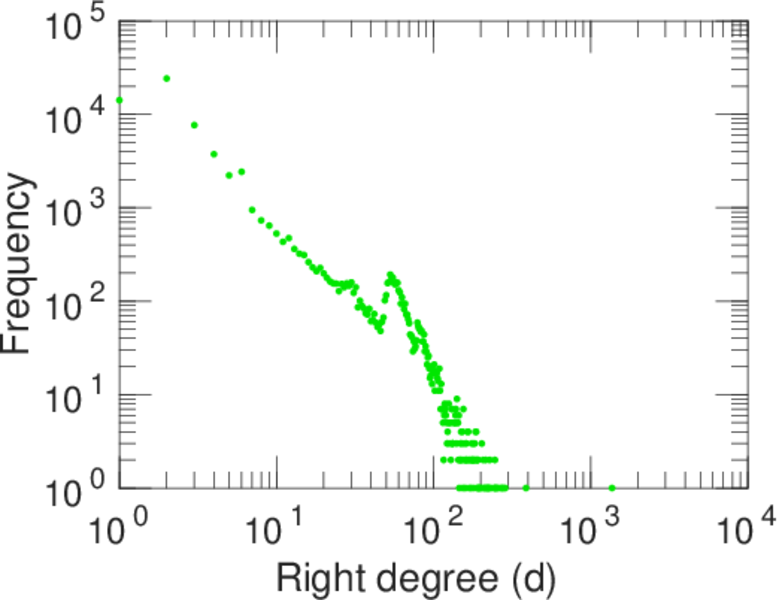
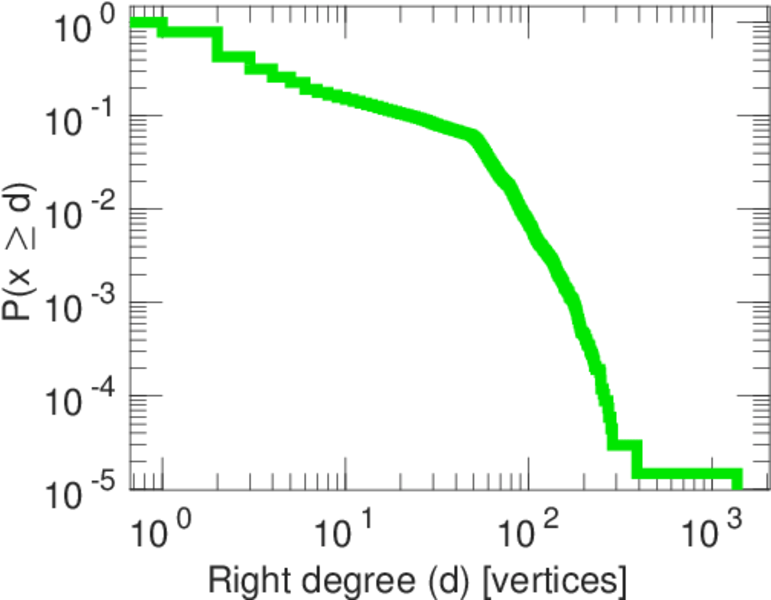
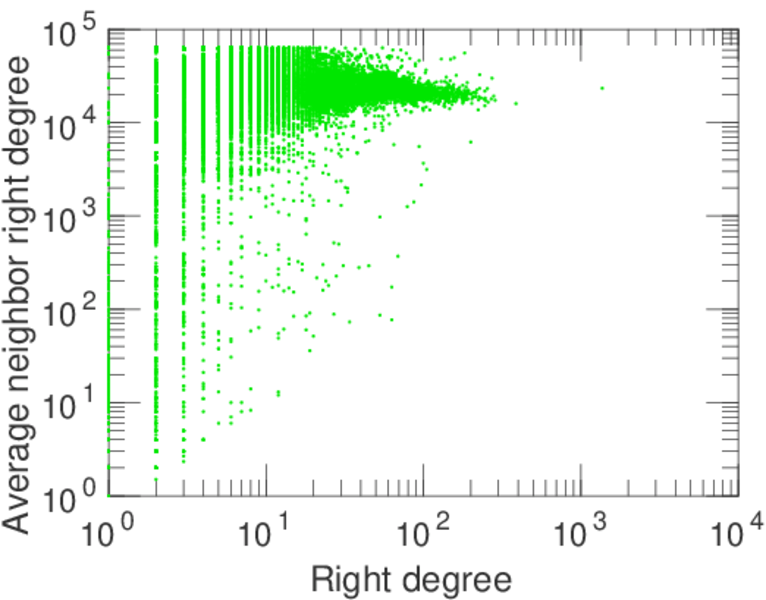
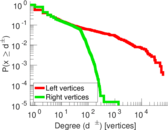
| Maximum right degree | d2max = | 1,370
|
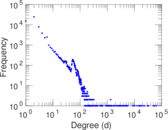
| Average degree | d = | 16.910 1
|
| Average left degree | d1 = | 261.199
|
| Average right degree | d2 = | 8.737 88
|
| Fill | p = | 0.001 866 09
|
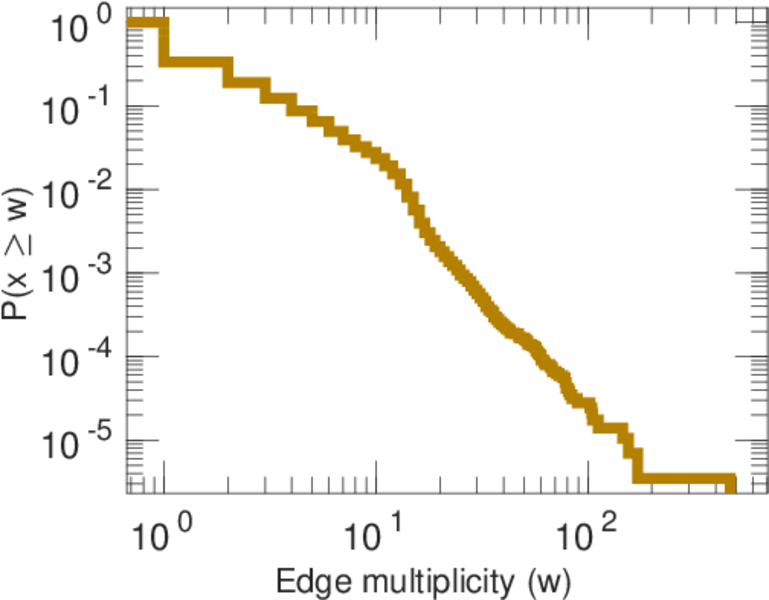
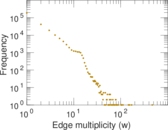
| Average edge multiplicity | m̃ = | 2.066 40
|
| Size of LCC | N = | 68,934
|
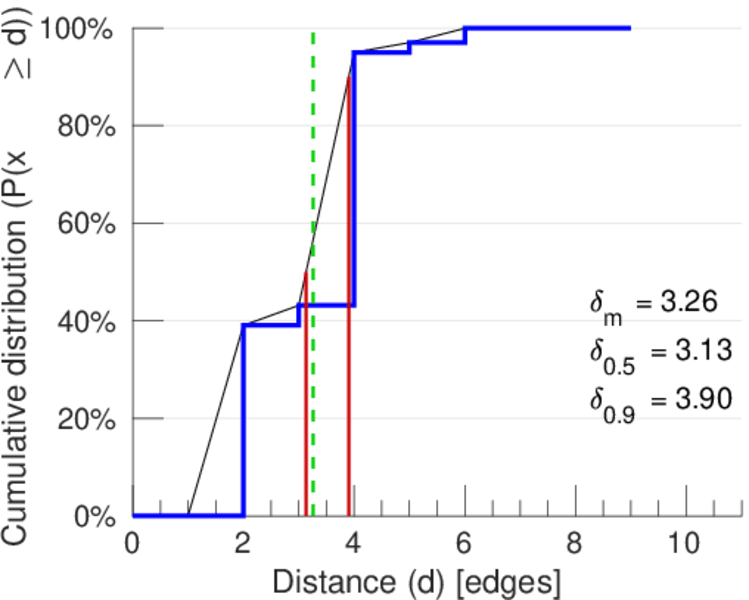
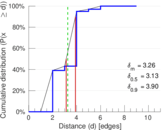
| Diameter | δ = | 11
|
| 50-Percentile effective diameter | δ0.5 = | 3.132 16
|
| 90-Percentile effective diameter | δ0.9 = | 3.903 55
|
| Median distance | δM = | 4
|
| Mean distance | δm = | 3.258 79
|
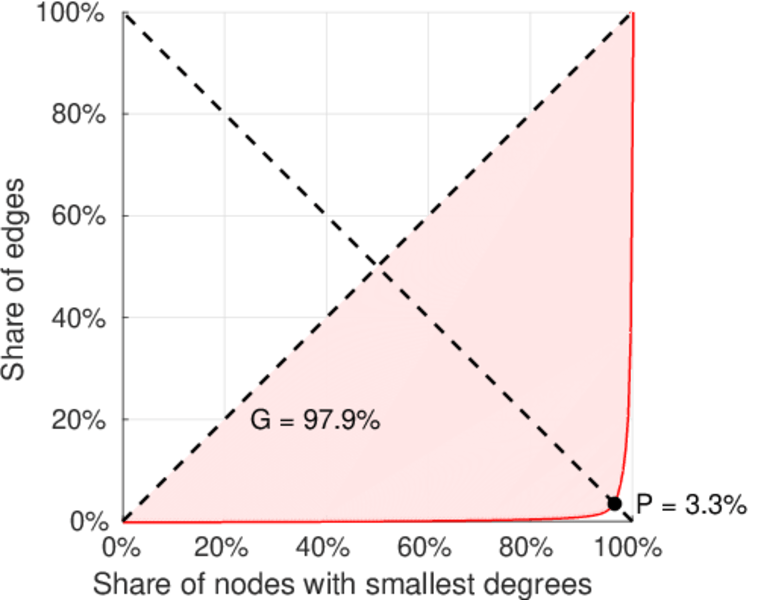
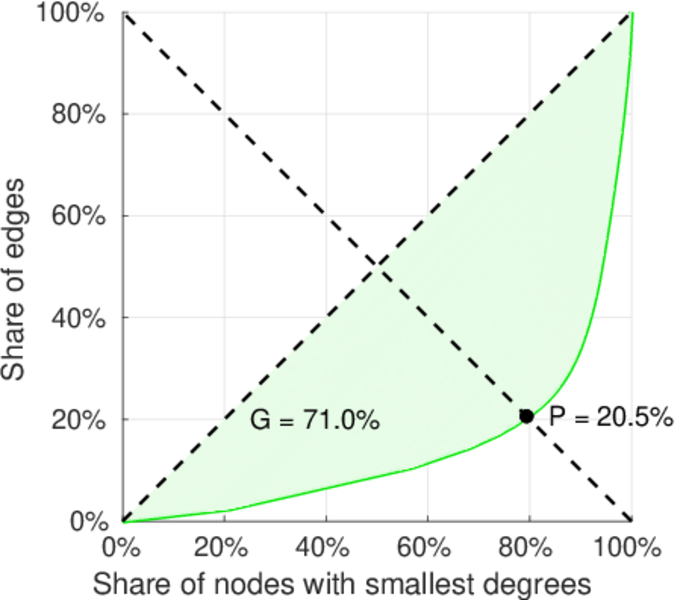
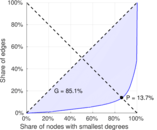
| Gini coefficient | G = | 0.852 606
|
| Balanced inequality ratio | P = | 0.135 248
|
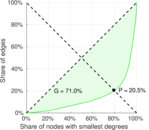
| Left balanced inequality ratio | P1 = | 0.032 827 7
|
| Right balanced inequality ratio | P2 = | 0.204 699
|
| Power law exponent | γ = | 2.113 05
|
| Tail power law exponent | γt = | 3.361 00
|
| Tail power law exponent with p | γ3 = | 3.361 00
|
| p-value | p = | 0.000 00
|
| Left tail power law exponent with p | γ3,1 = | 1.691 00
|
| Left p-value | p1 = | 0.000 00
|
| Right tail power law exponent with p | γ3,2 = | 8.911 00
|
| Right p-value | p2 = | 0.078 000 0
|
| Degree assortativity | ρ = | −0.469 400
|
| Degree assortativity p-value | pρ = | 0.000 00
|
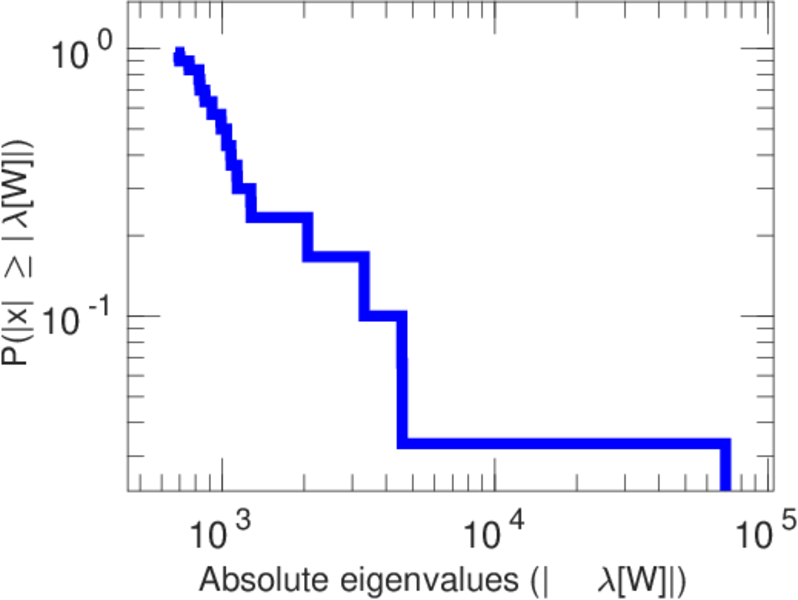
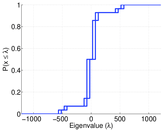
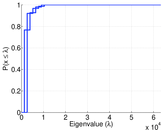
| Spectral norm | α = | 1,209.43
|
| Algebraic connectivity | a = | 0.043 564 0
|
| Controllability | C = | 65,391
|
| Relative controllability | Cr = | 0.938 892
|
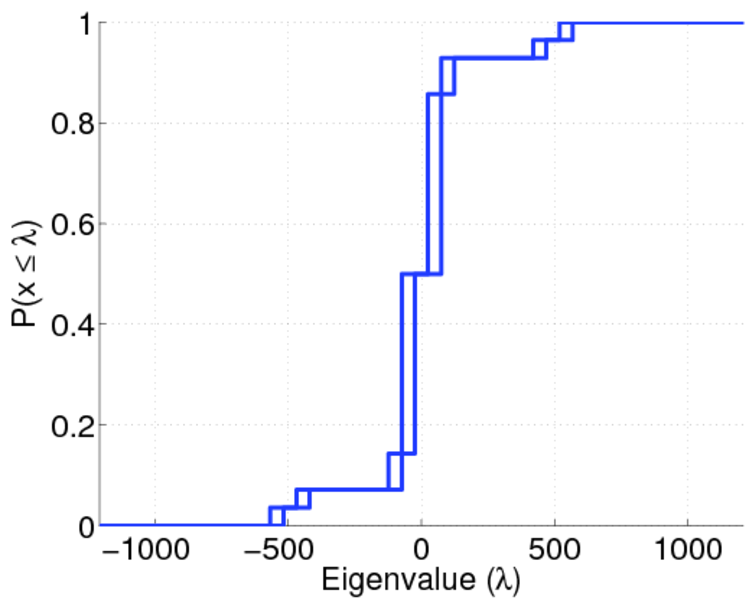
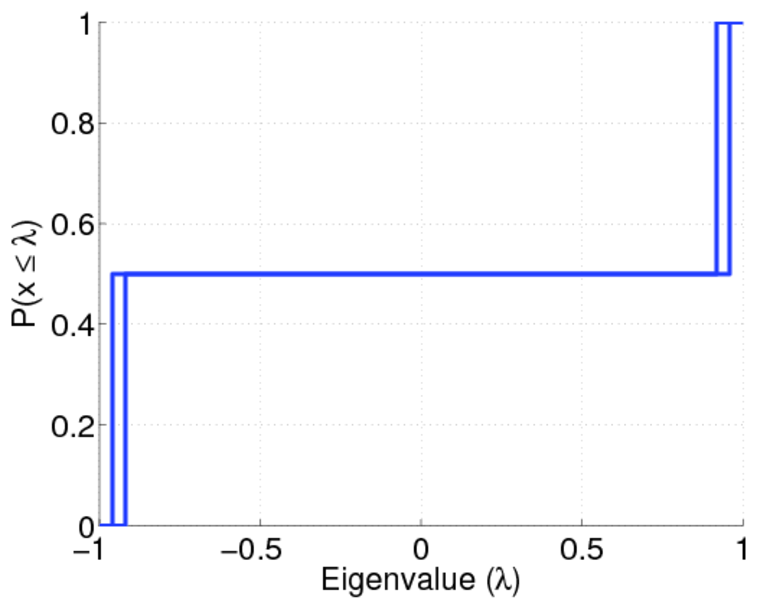
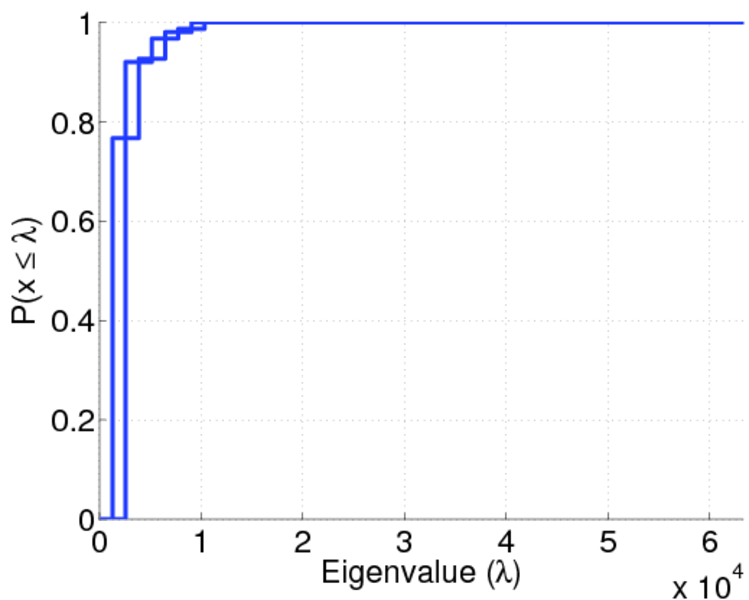
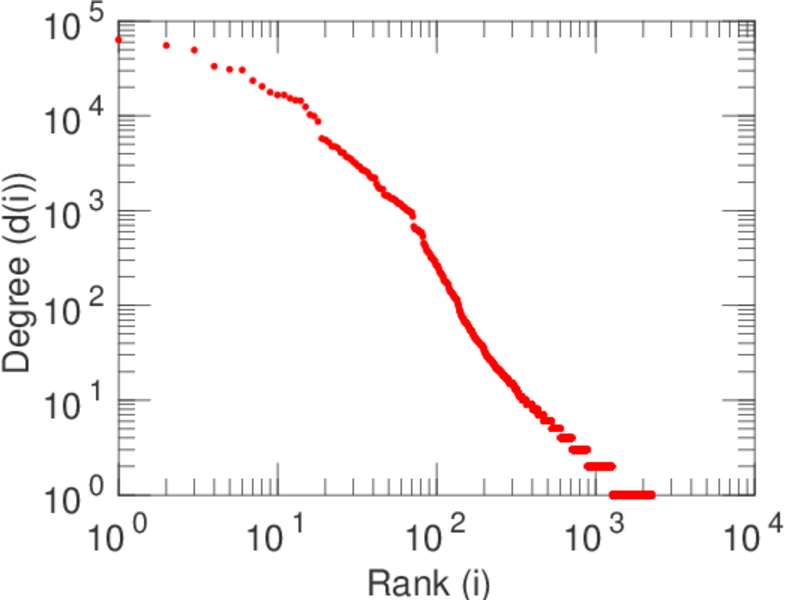
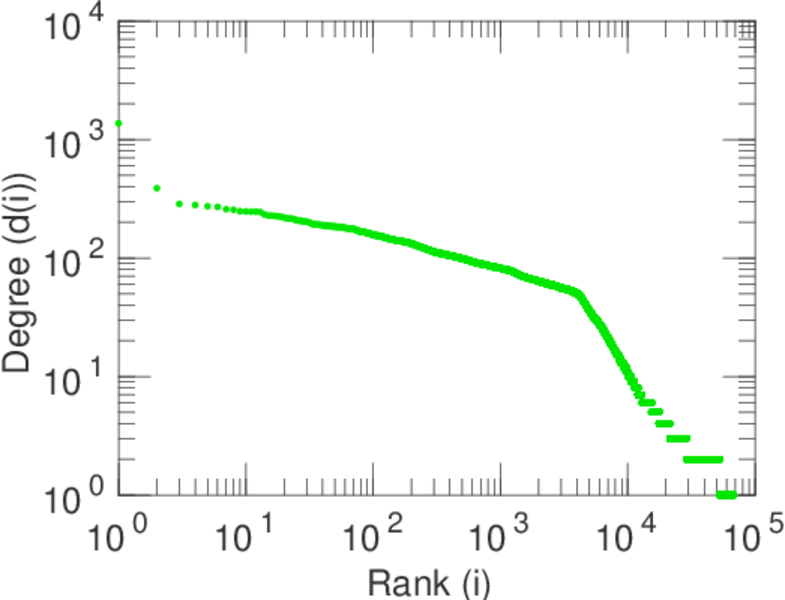
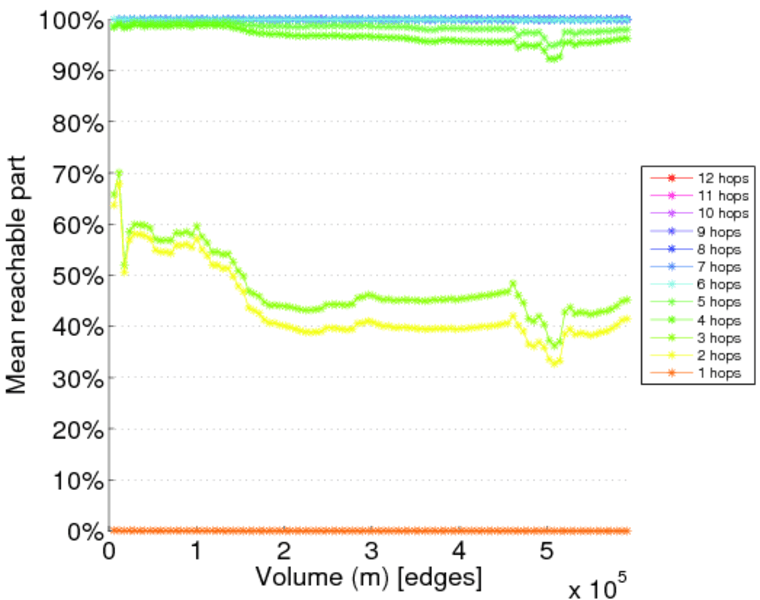
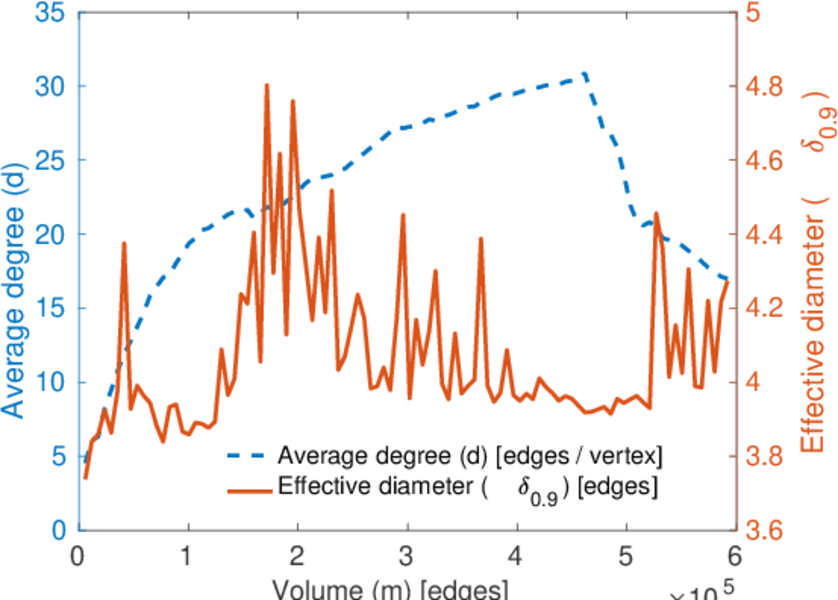
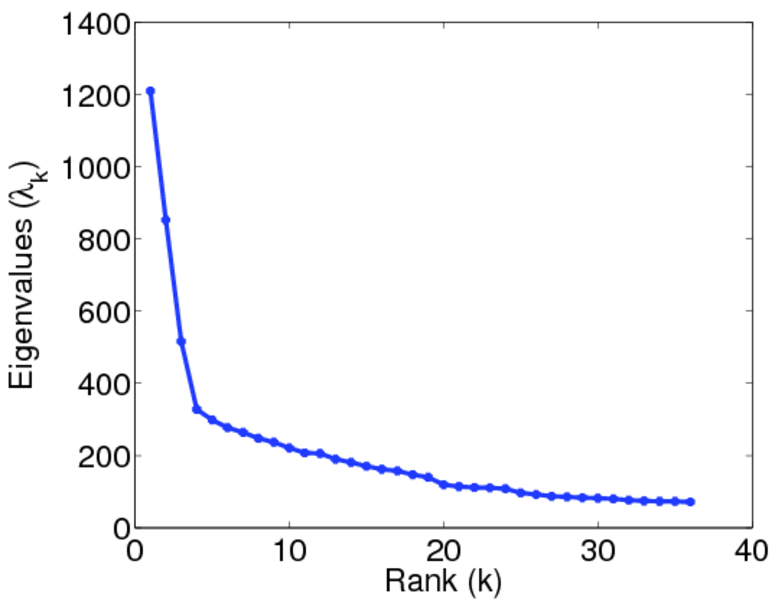
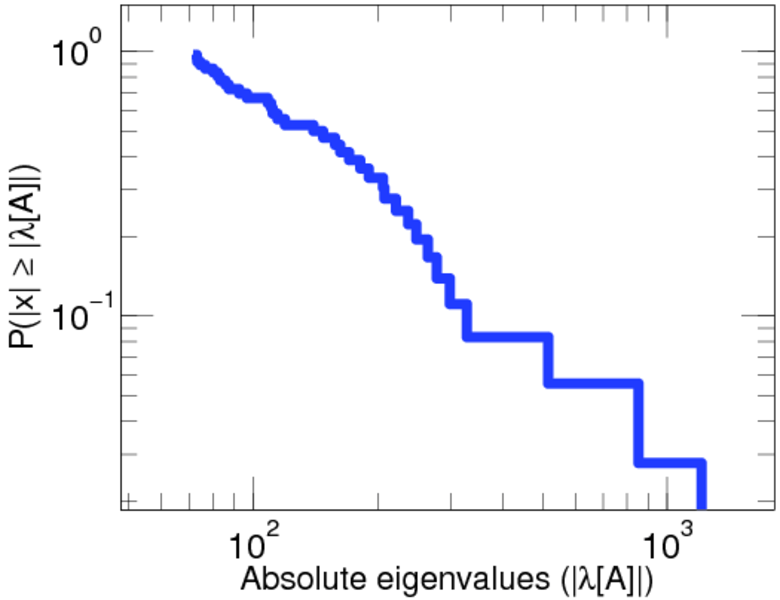
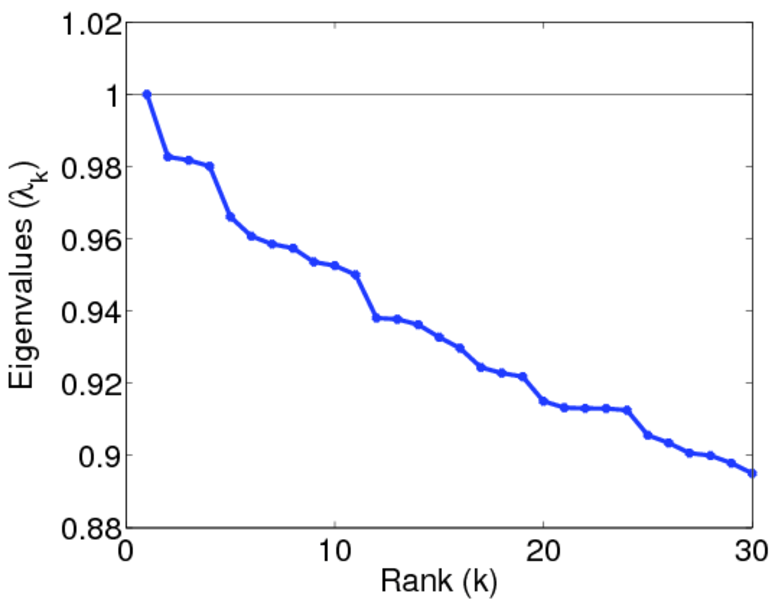
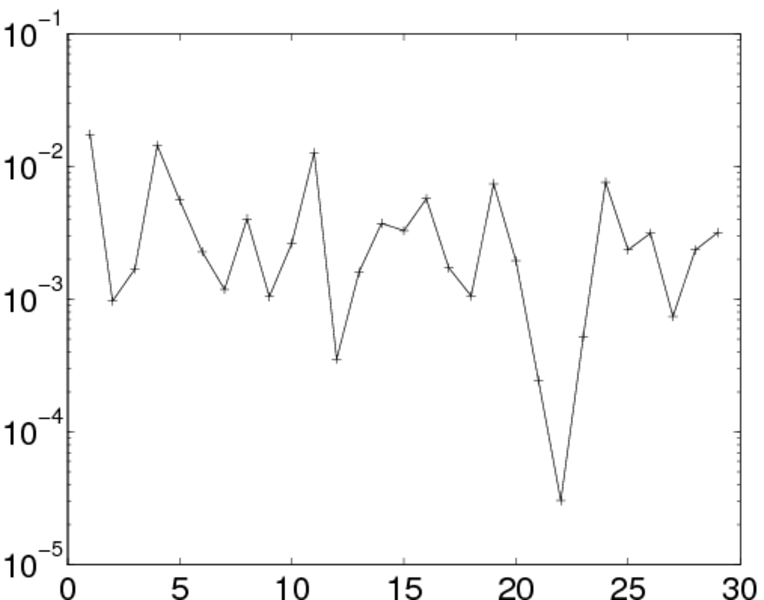
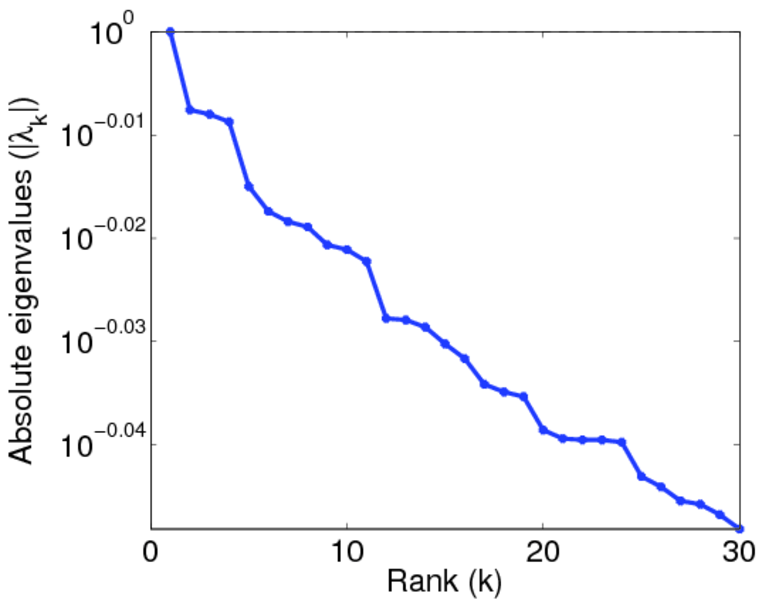
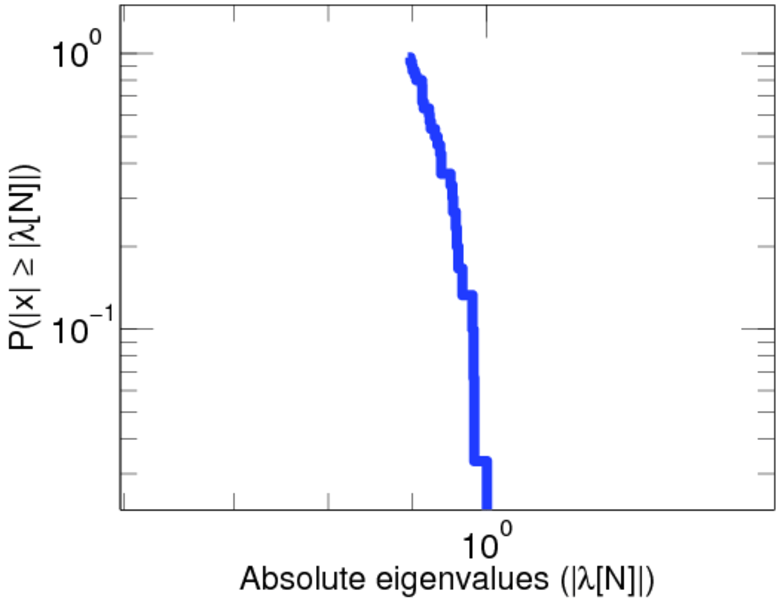
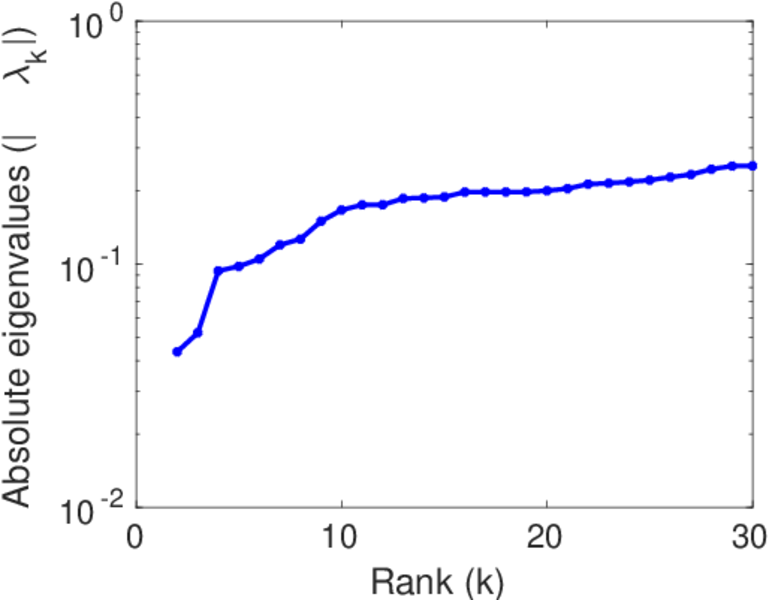
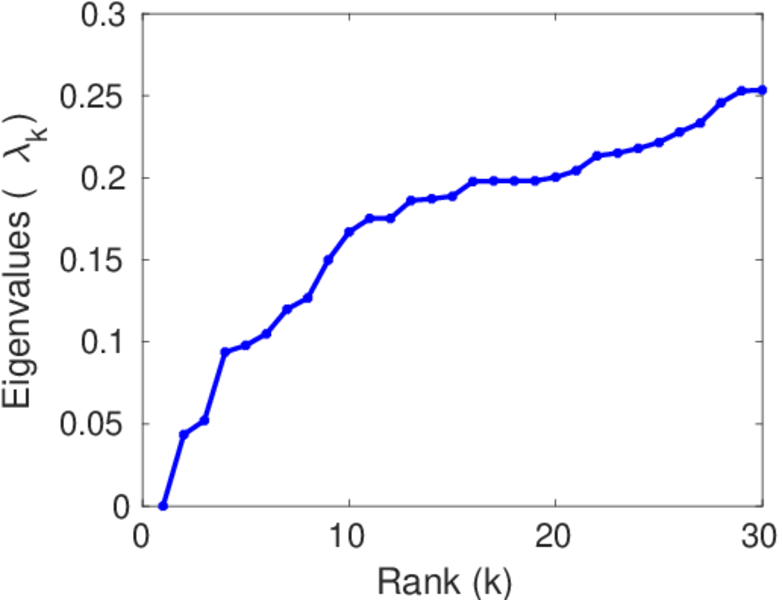
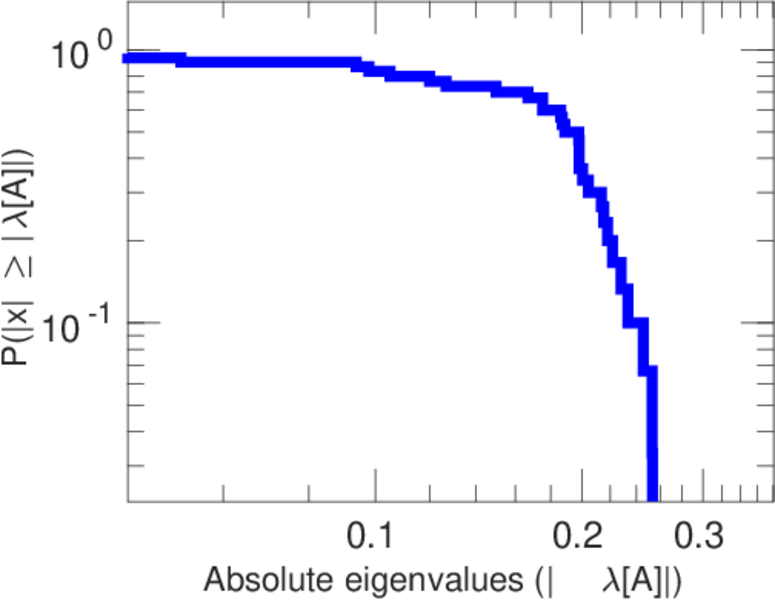
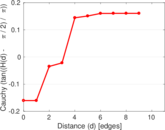
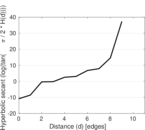
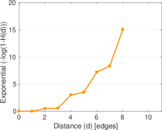
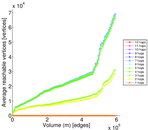
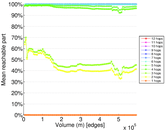
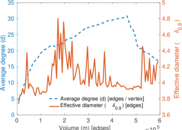
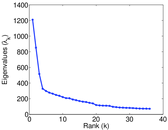
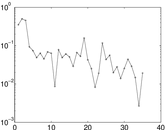
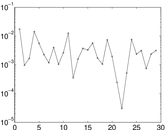
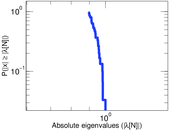
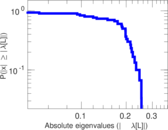
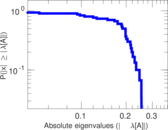
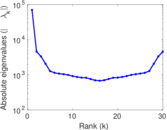
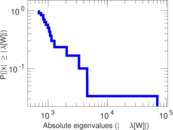
Plots


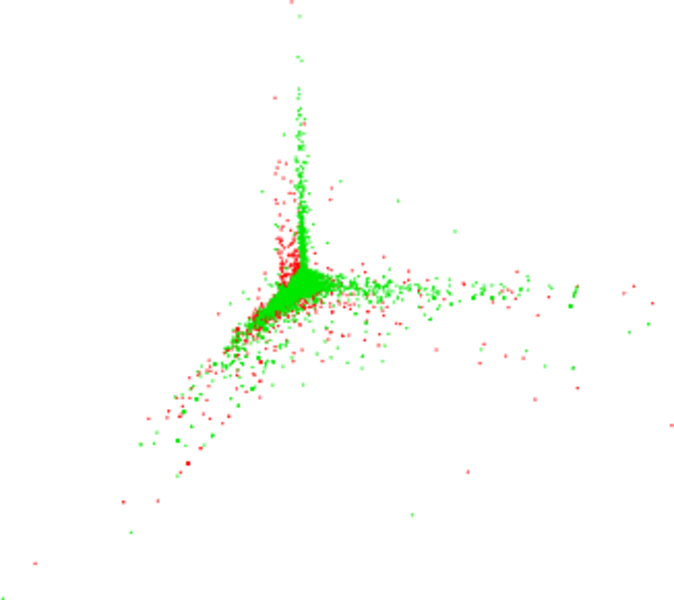
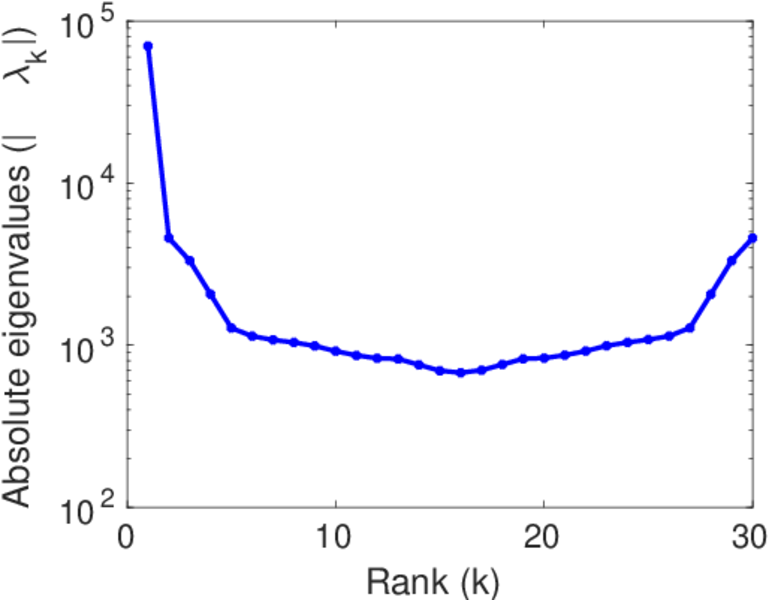
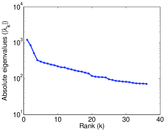
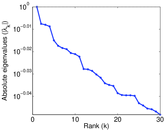
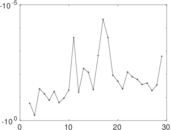
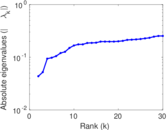
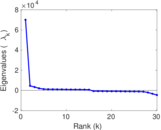
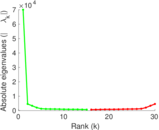
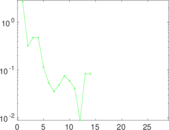
Matrix decompositions plots


Downloads
References
|
[1]
|
Jérôme Kunegis.
KONECT – The Koblenz Network Collection.
In Proc. Int. Conf. on World Wide Web Companion, pages
1343–1350, 2013.
[ http ]
|
|
[2]
|
Wikimedia Foundation.
Wikimedia downloads.
http://dumps.wikimedia.org/, January 2010.
|
 KONECT ‣ Networks ‣
Buy Me a Coffee
KONECT ‣ Networks ‣
Buy Me a Coffee