Wikipedia edits (cy)
This is the bipartite edit network of the Welsh Wikipedia. It contains users
and pages from the Welsh Wikipedia, connected by edit events. Each edge
represents an edit. The dataset includes the timestamp of each edit.
Metadata
Statistics
| Size | n = | 208,087
|
| Left size | n1 = | 5,445
|
| Right size | n2 = | 202,642
|
| Volume | m = | 2,767,004
|
| Unique edge count | m̿ = | 979,109
|
| Wedge count | s = | 13,498,204,503
|
| Claw count | z = | 292,097,112,413,717
|
| Cross count | x = | 6,634,120,022,693,724,160
|
| Square count | q = | 15,119,863,031
|
| 4-Tour count | T4 = | 174,955,343,246
|
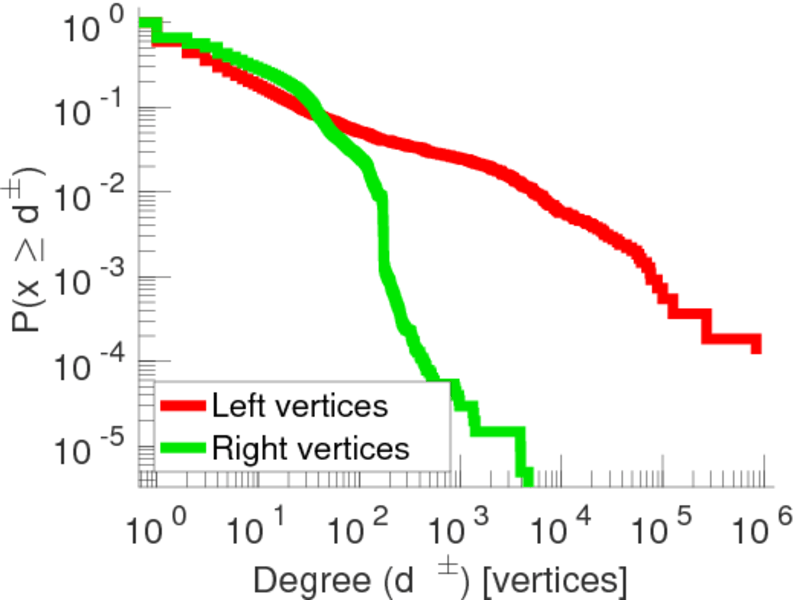
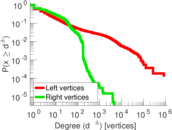
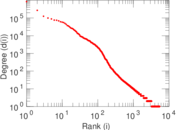
| Maximum degree | dmax = | 843,214
|
| Maximum left degree | d1max = | 843,214
|
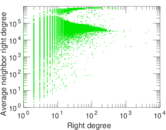
| Maximum right degree | d2max = | 4,705
|
| Average degree | d = | 26.594 7
|
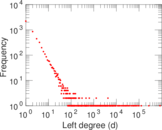
| Average left degree | d1 = | 508.173
|
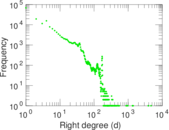
| Average right degree | d2 = | 13.654 6
|
| Fill | p = | 0.000 887 368
|
| Average edge multiplicity | m̃ = | 2.826 04
|
| Size of LCC | N = | 206,776
|
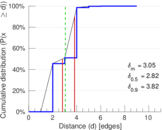
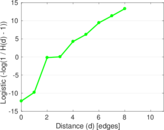
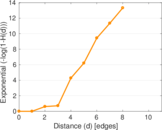
| Diameter | δ = | 12
|
| 50-Percentile effective diameter | δ0.5 = | 2.815 10
|
| 90-Percentile effective diameter | δ0.9 = | 3.818 99
|
| Median distance | δM = | 3
|
| Mean distance | δm = | 3.050 00
|
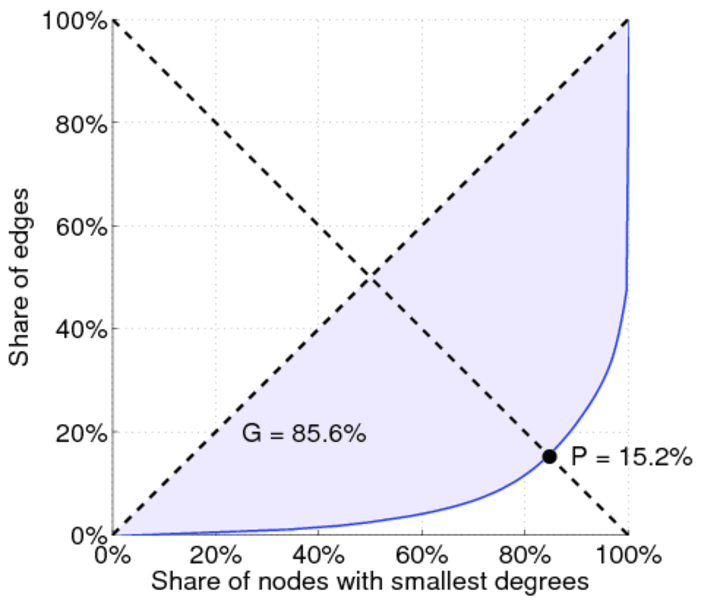
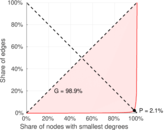
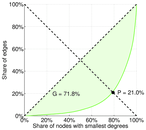
| Gini coefficient | G = | 0.856 885
|
| Balanced inequality ratio | P = | 0.152 148
|
| Left balanced inequality ratio | P1 = | 0.020 623 4
|
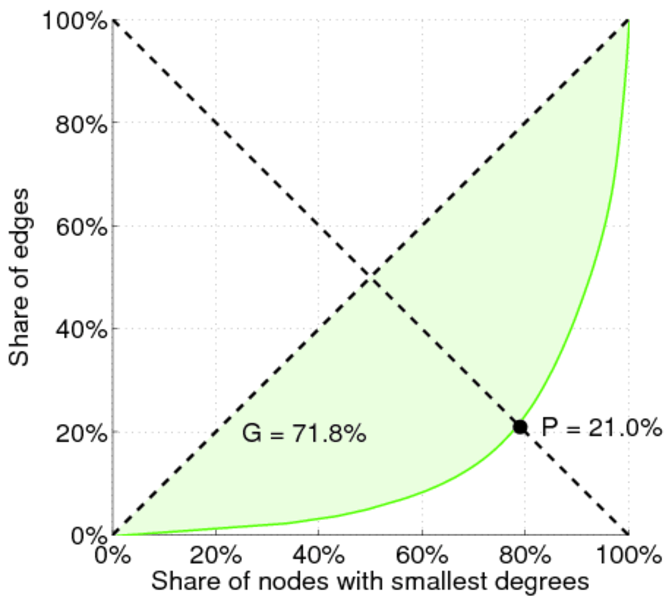
| Right balanced inequality ratio | P2 = | 0.209 617
|
| Relative edge distribution entropy | Her = | 0.709 558
|
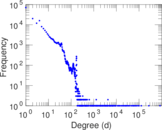
| Power law exponent | γ = | 2.039 13
|
| Tail power law exponent | γt = | 3.271 00
|
| Tail power law exponent with p | γ3 = | 3.271 00
|
| p-value | p = | 0.000 00
|
| Left tail power law exponent with p | γ3,1 = | 1.681 00
|
| Left p-value | p1 = | 0.000 00
|
| Right tail power law exponent with p | γ3,2 = | 4.621 00
|
| Right p-value | p2 = | 0.000 00
|
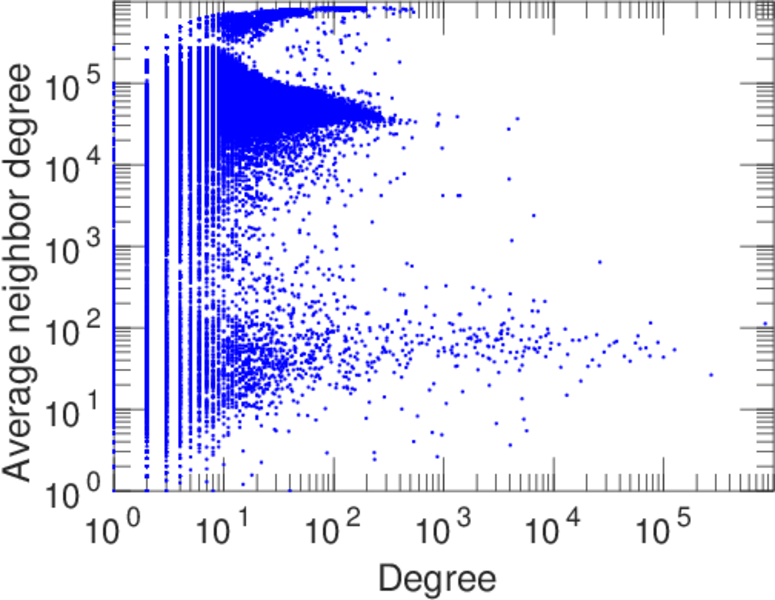
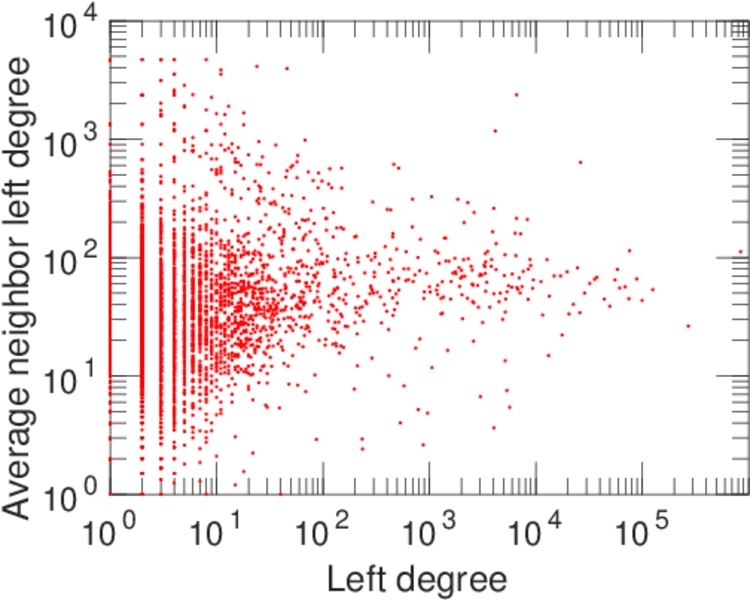
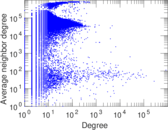
| Degree assortativity | ρ = | −0.313 663
|
| Degree assortativity p-value | pρ = | 0.000 00
|
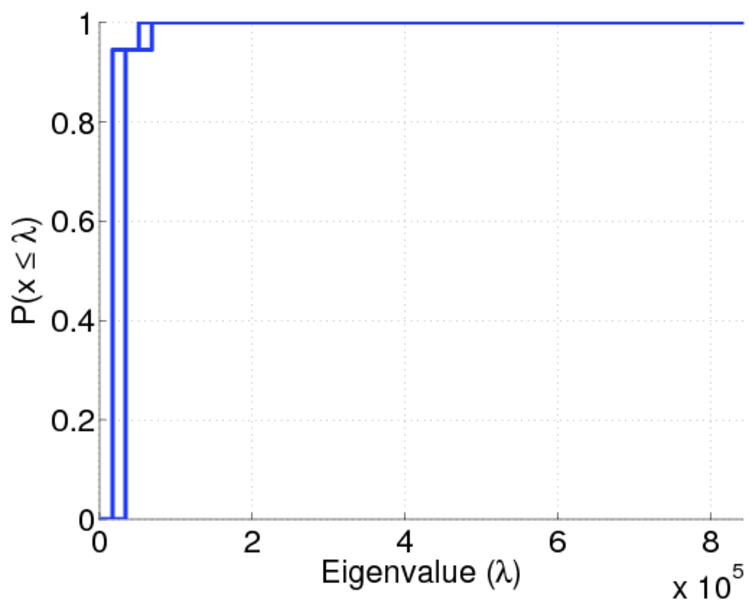
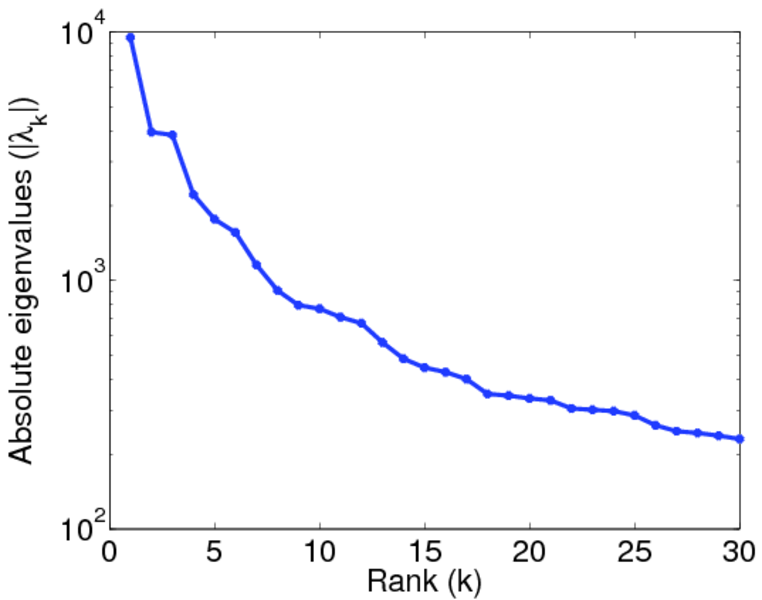
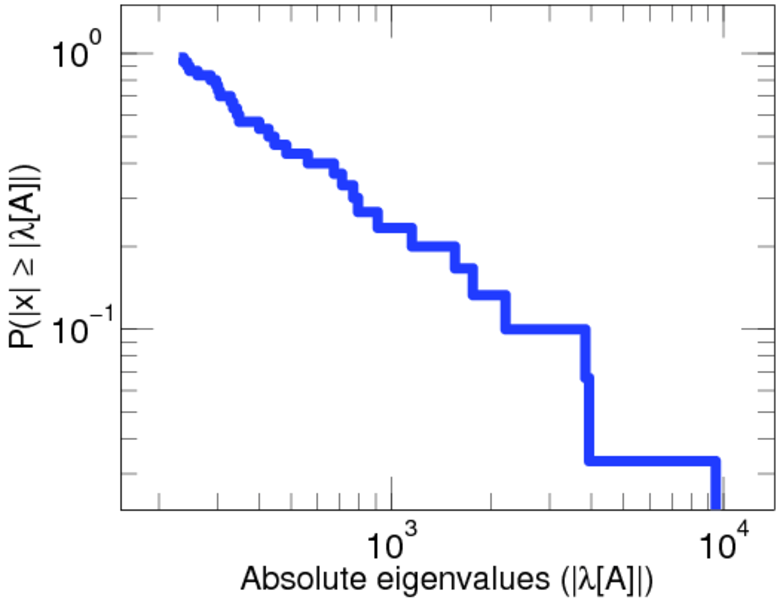
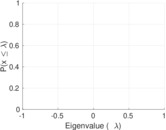
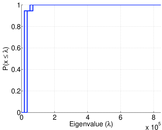
| Spectral norm | α = | 9,487.20
|
| Algebraic connectivity | a = | 0.002 634 75
|
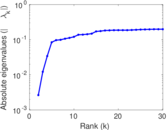
| Spectral separation | |λ1[A] / λ2[A]| = | 2.404 94
|
| Controllability | C = | 197,422
|
| Relative controllability | Cr = | 0.950 872
|
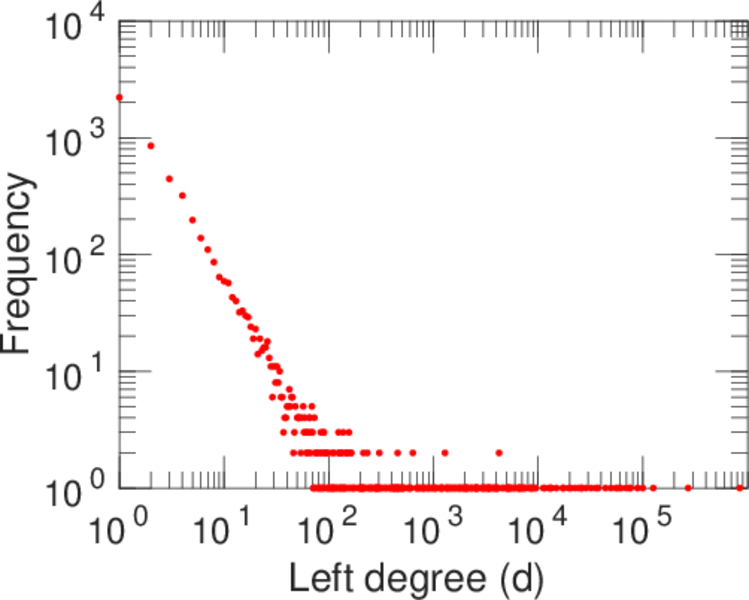
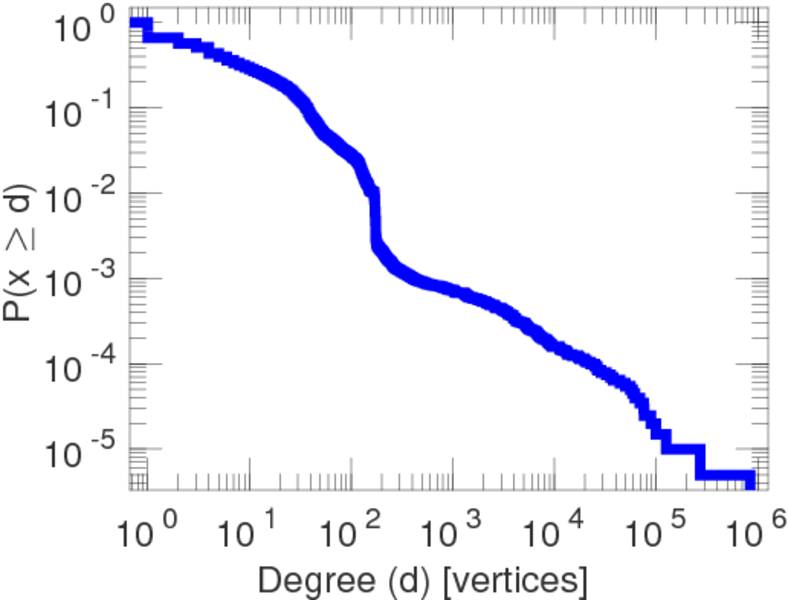
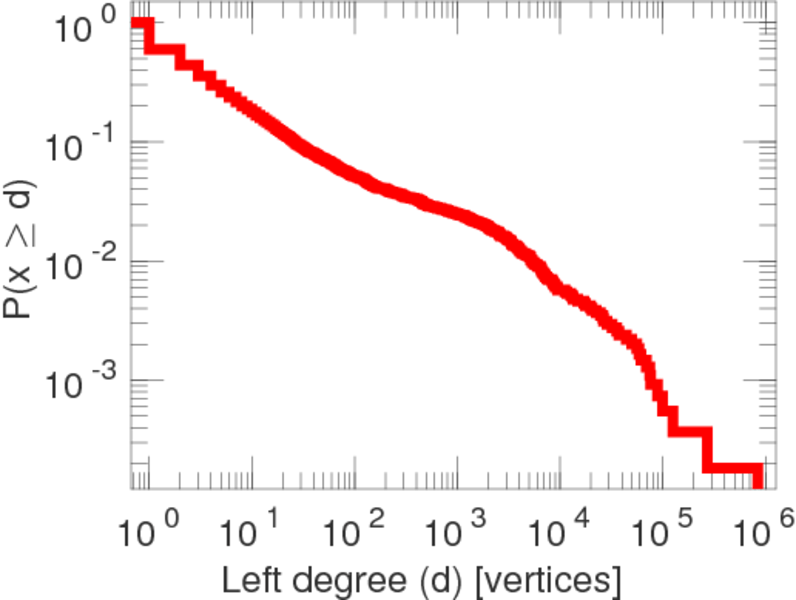
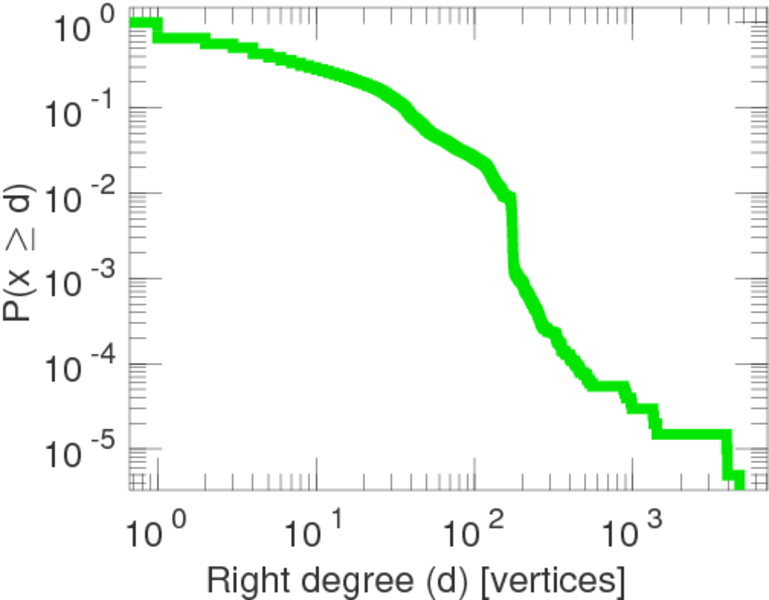
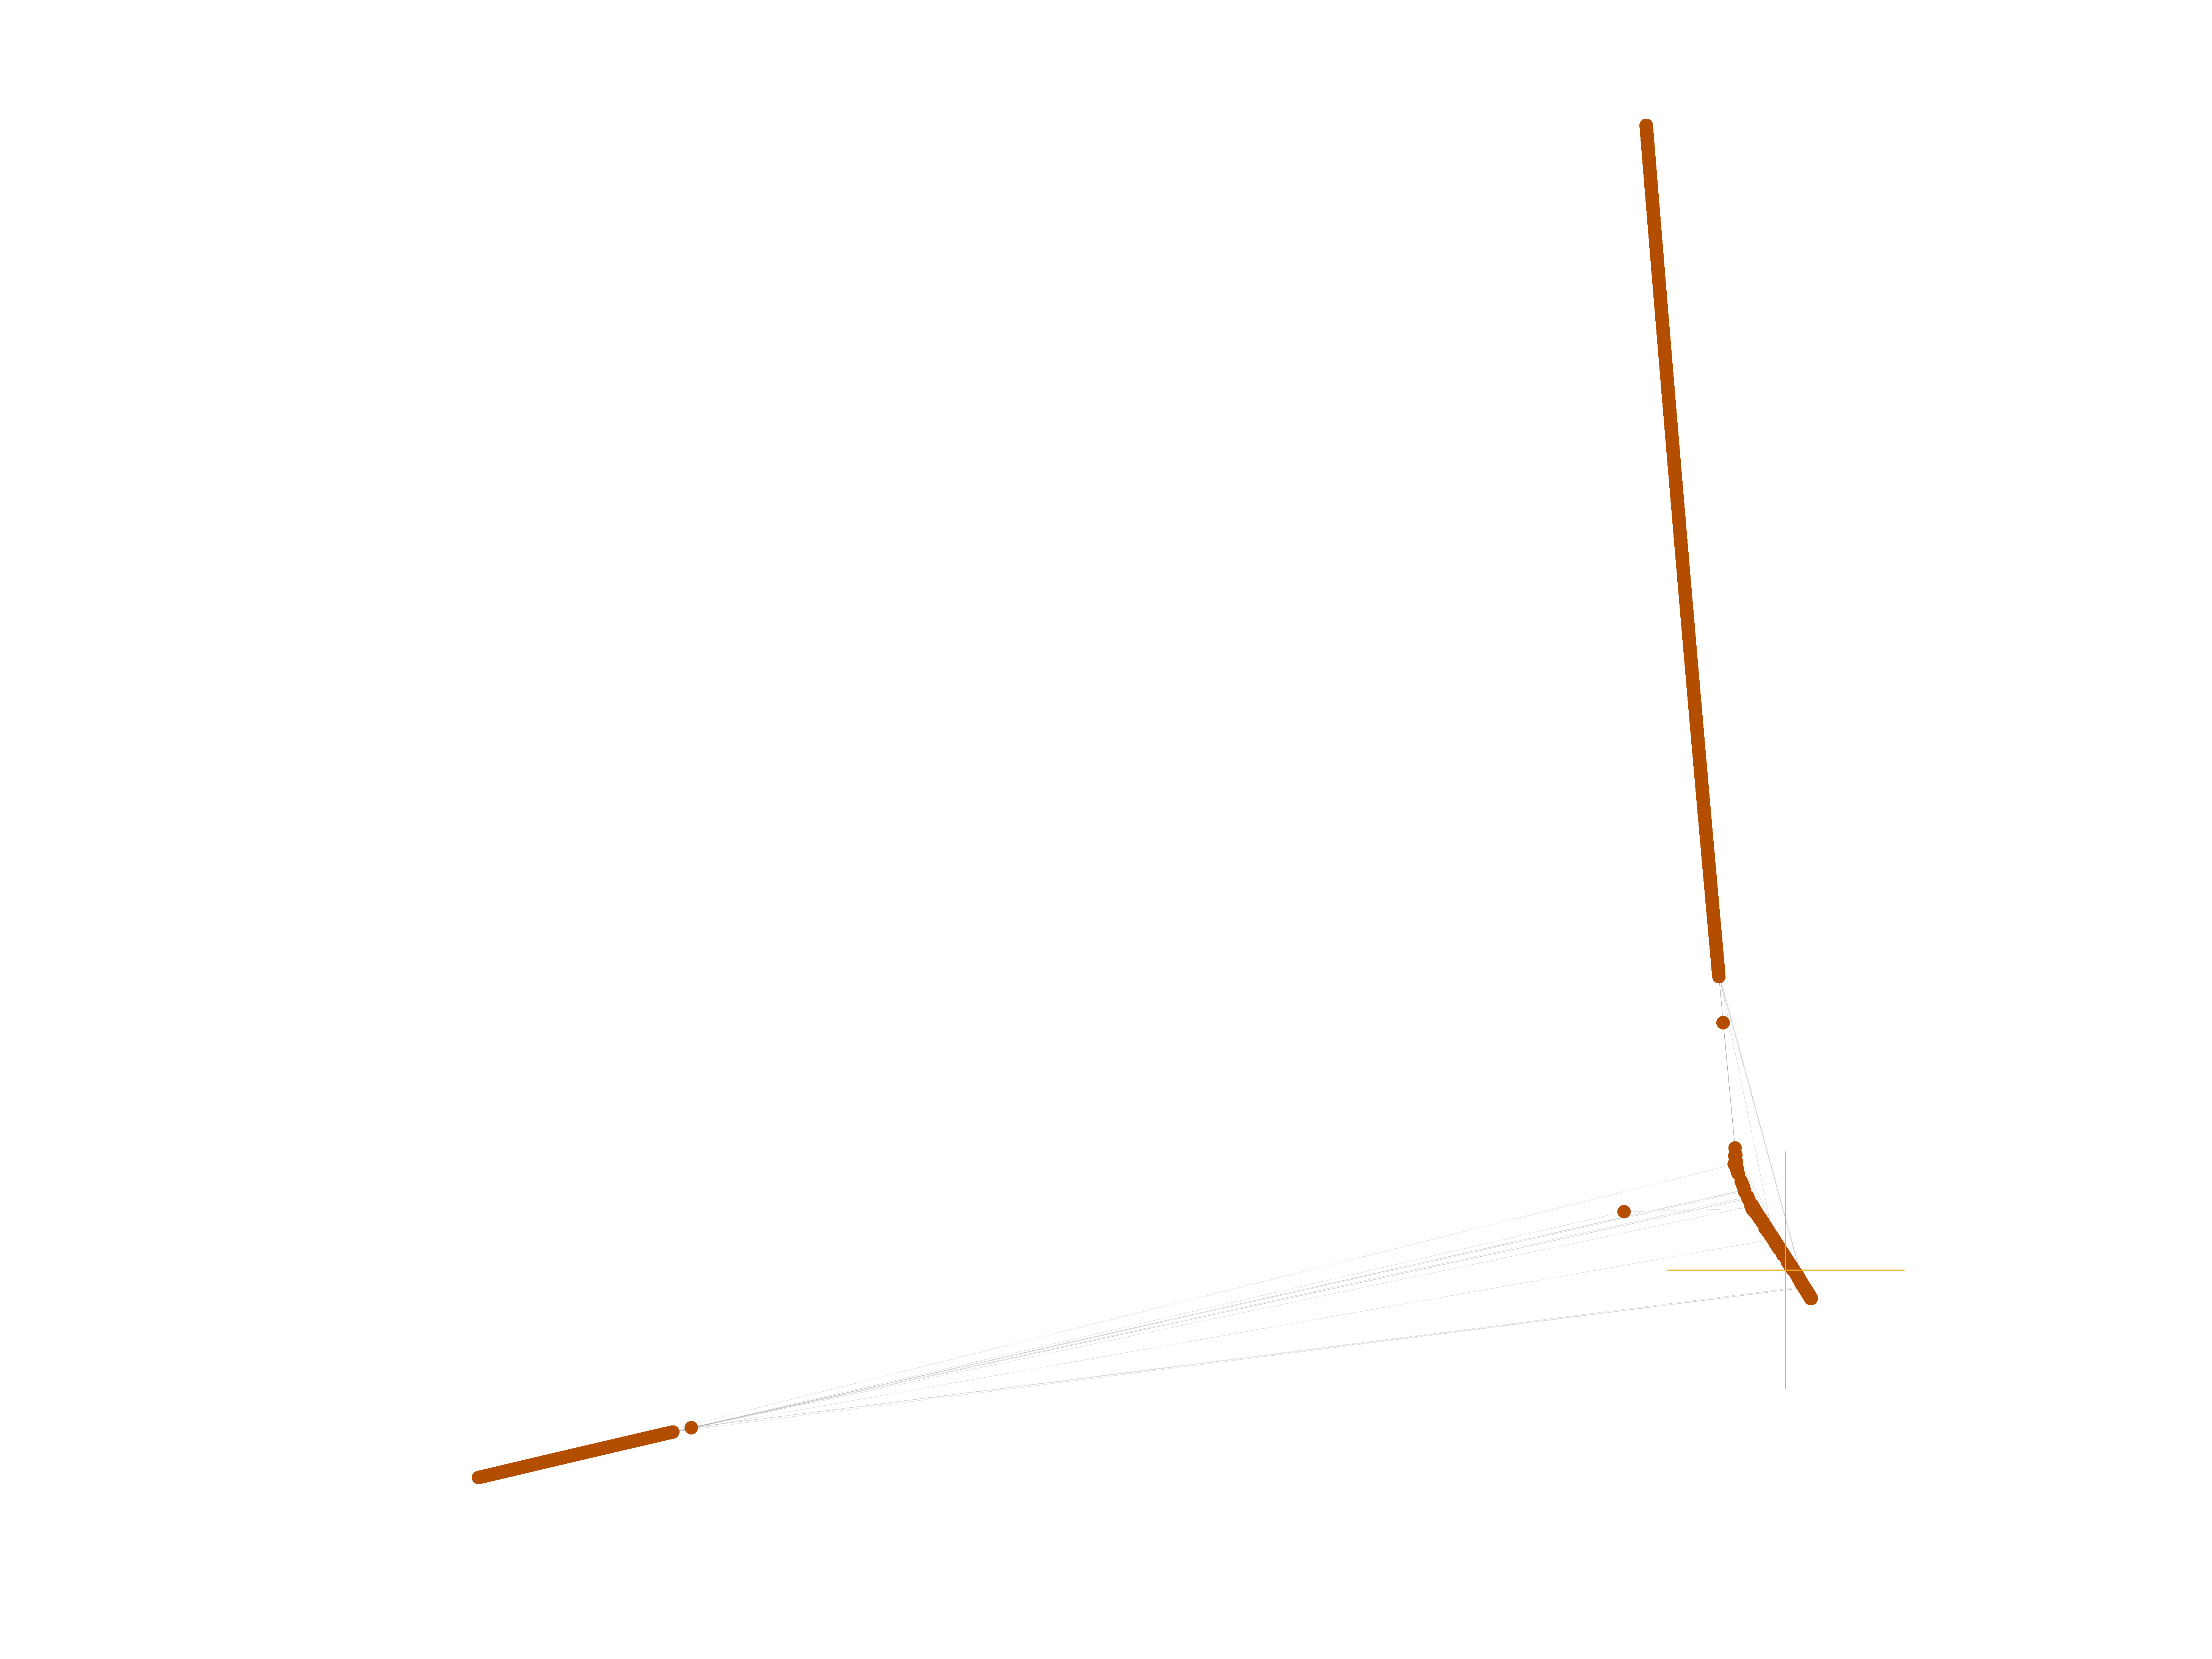
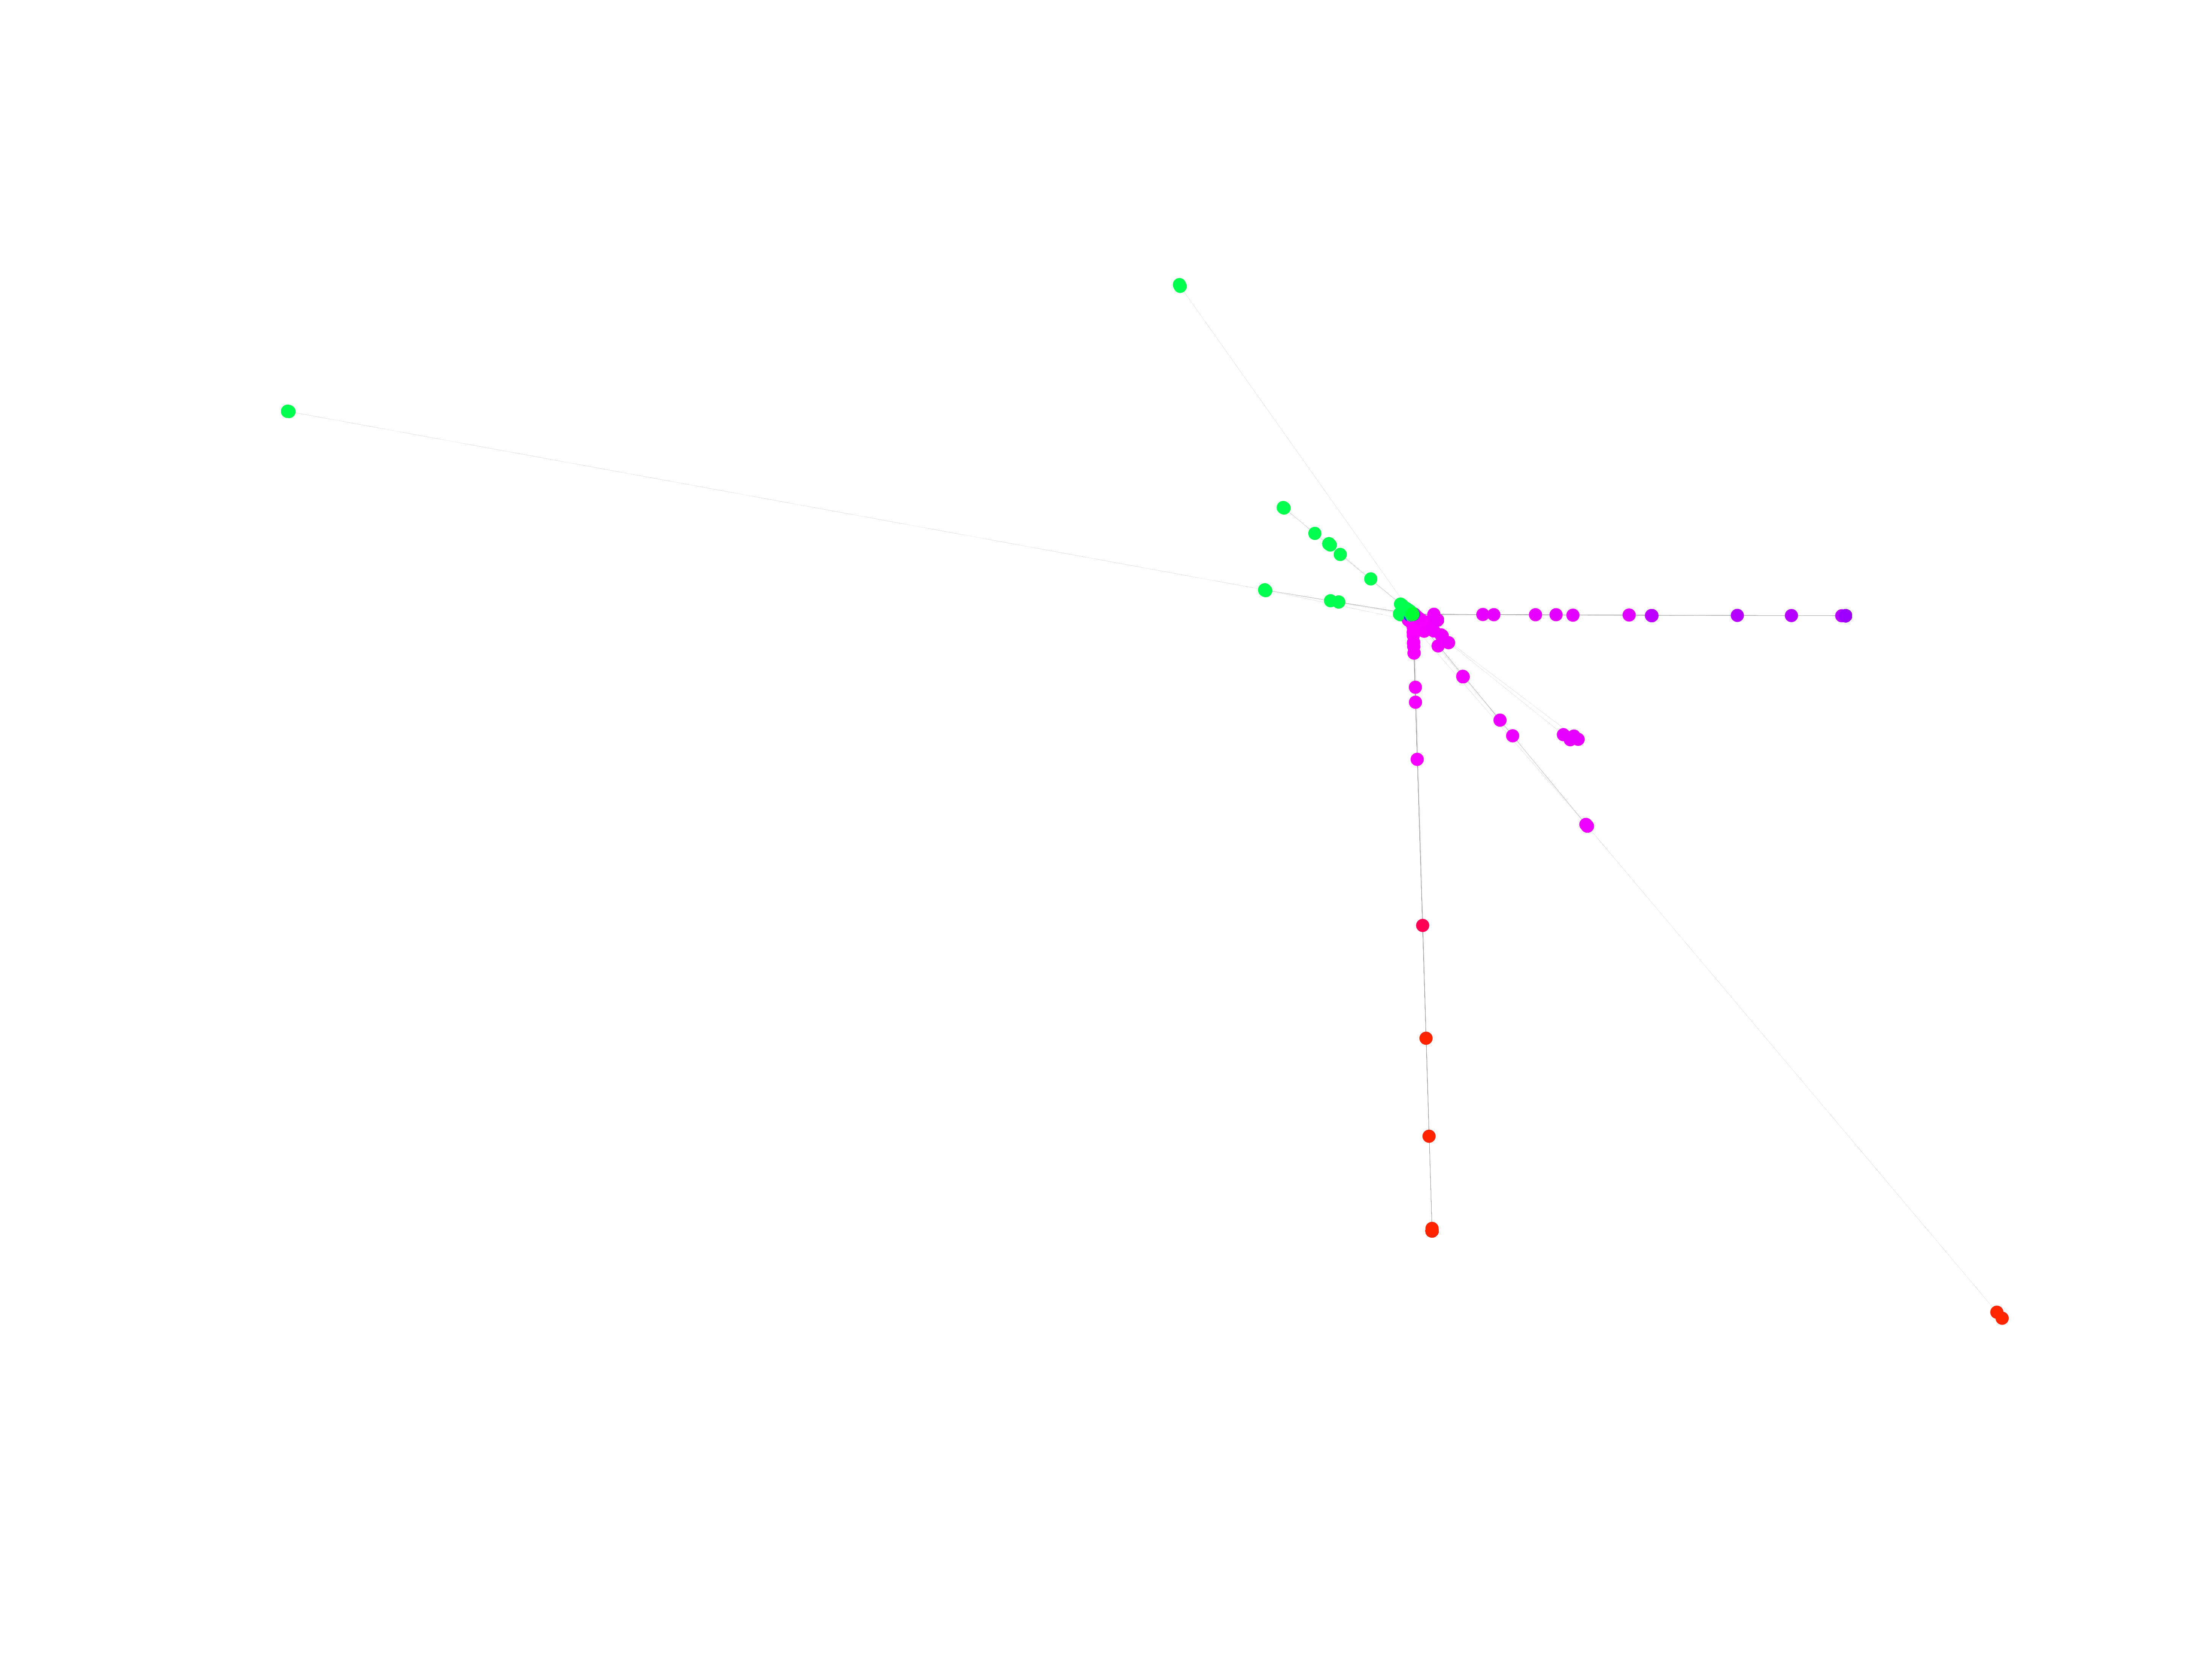
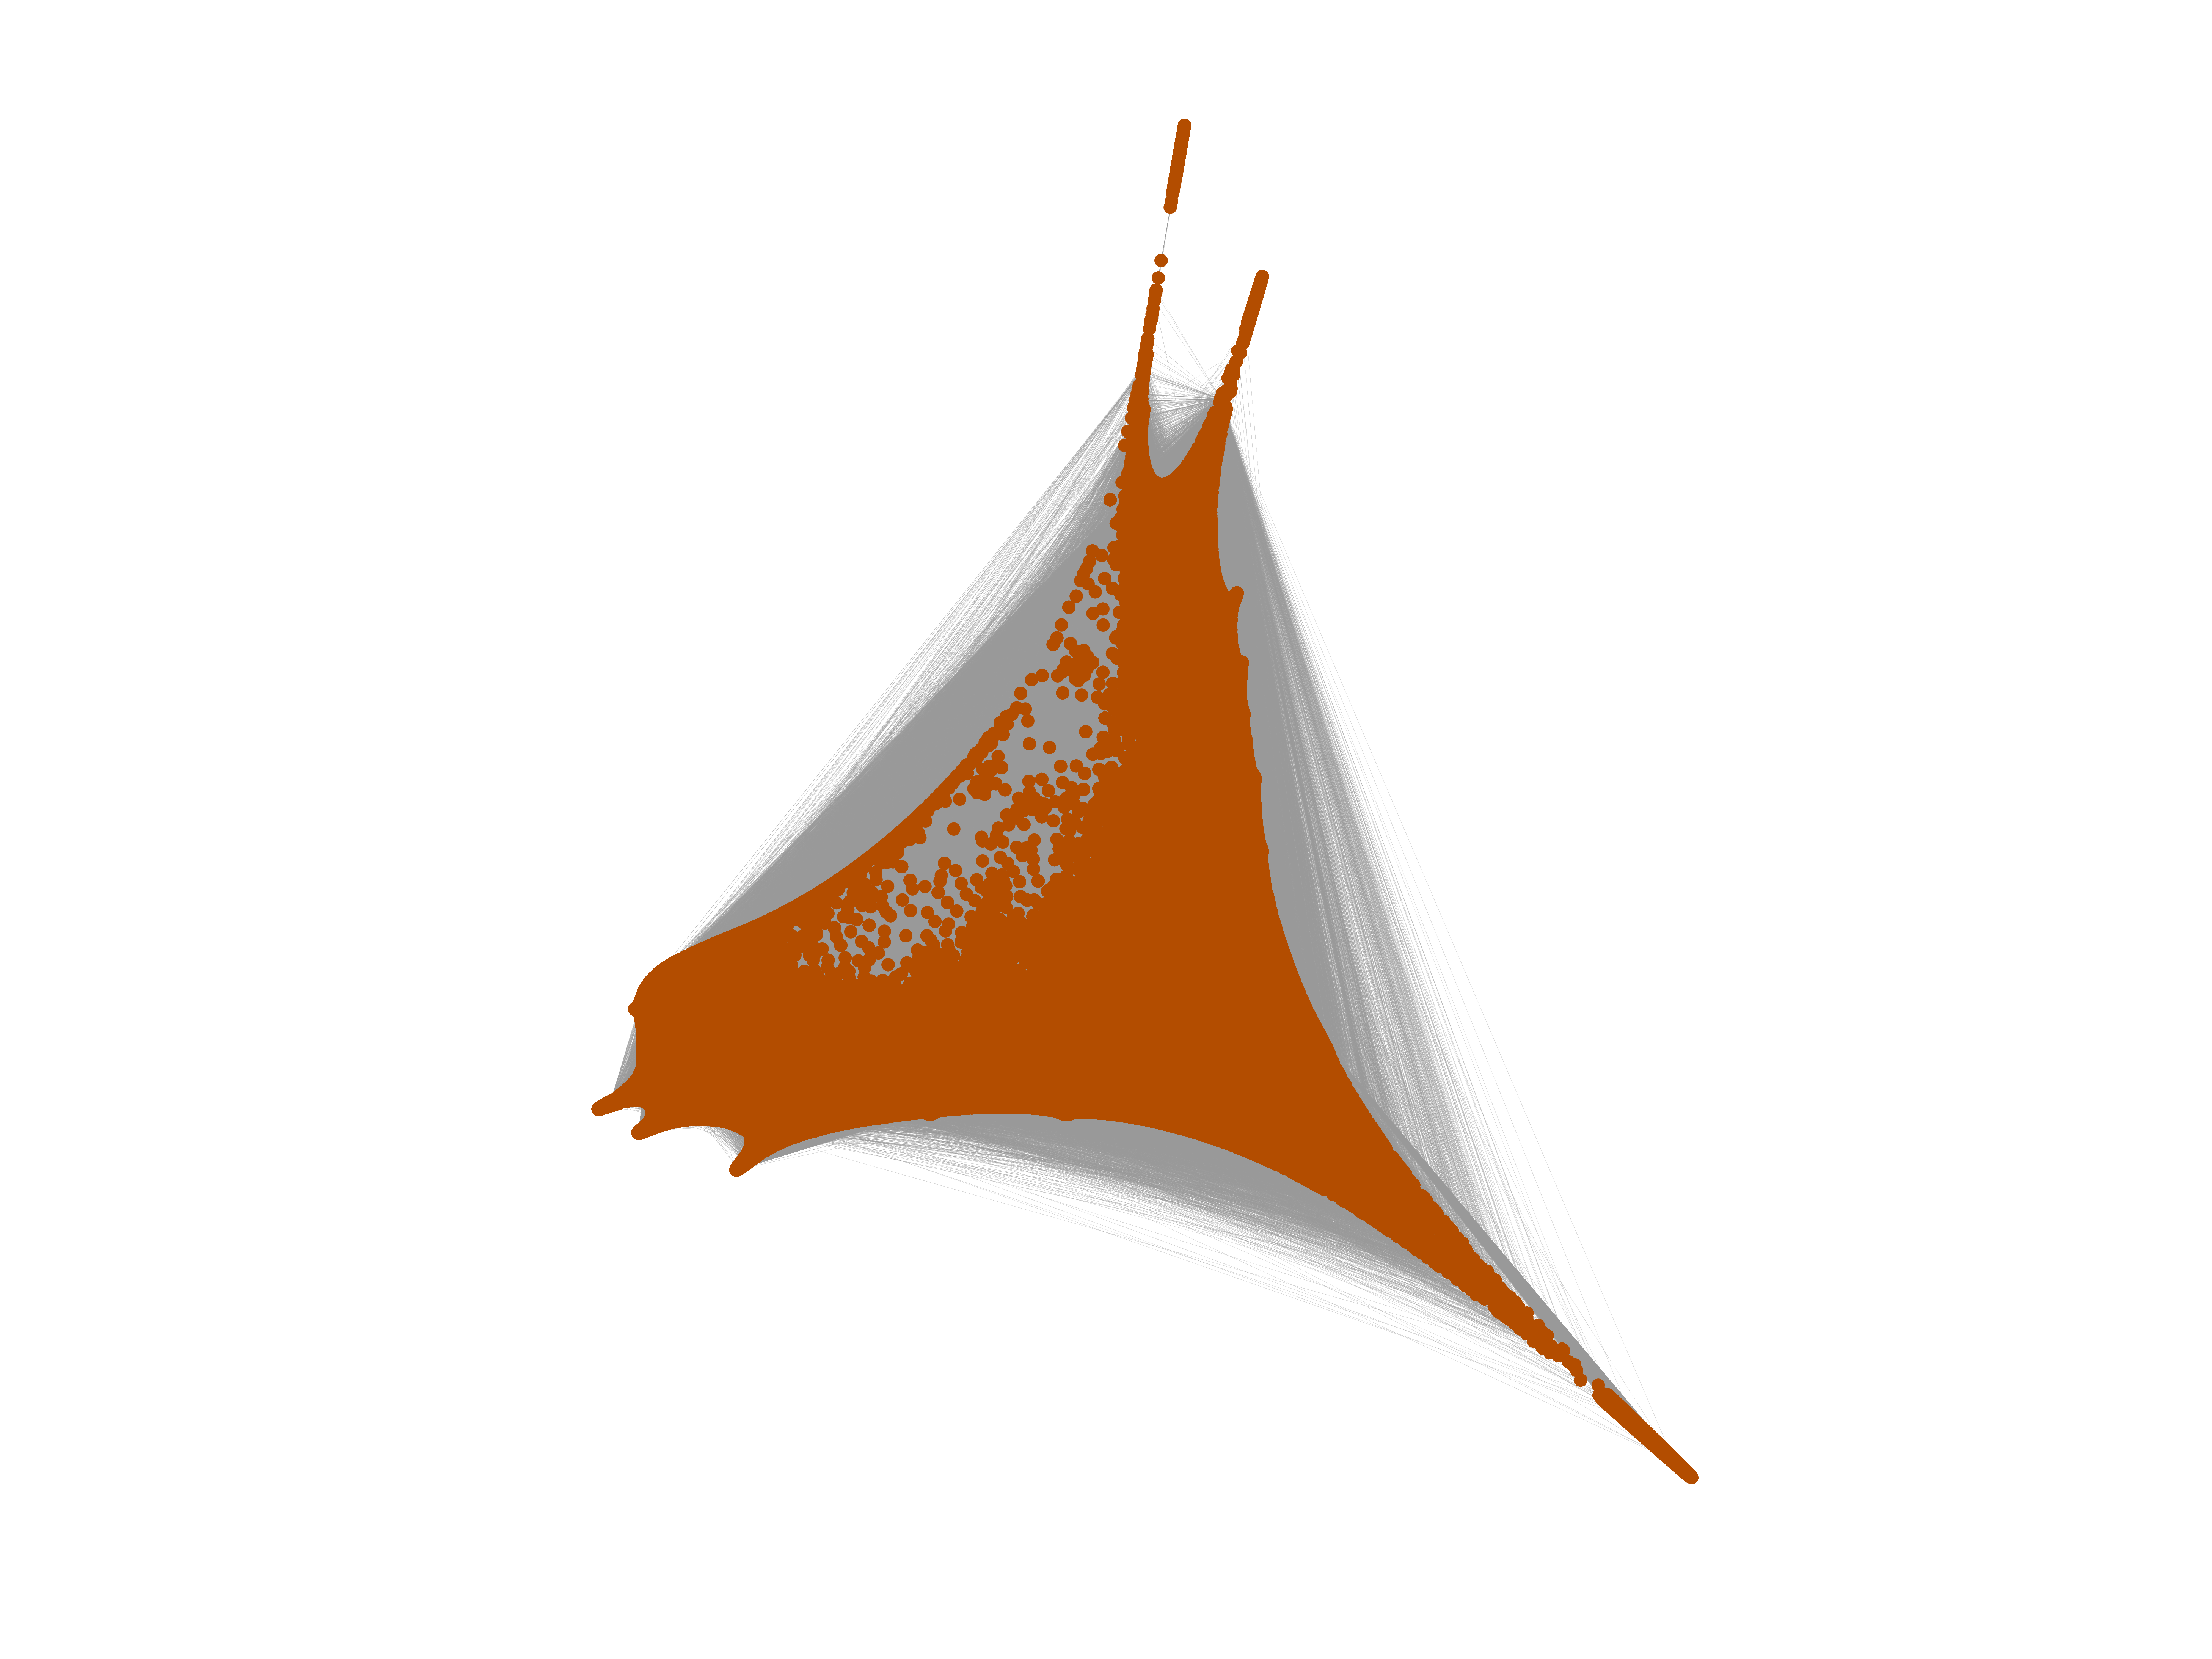
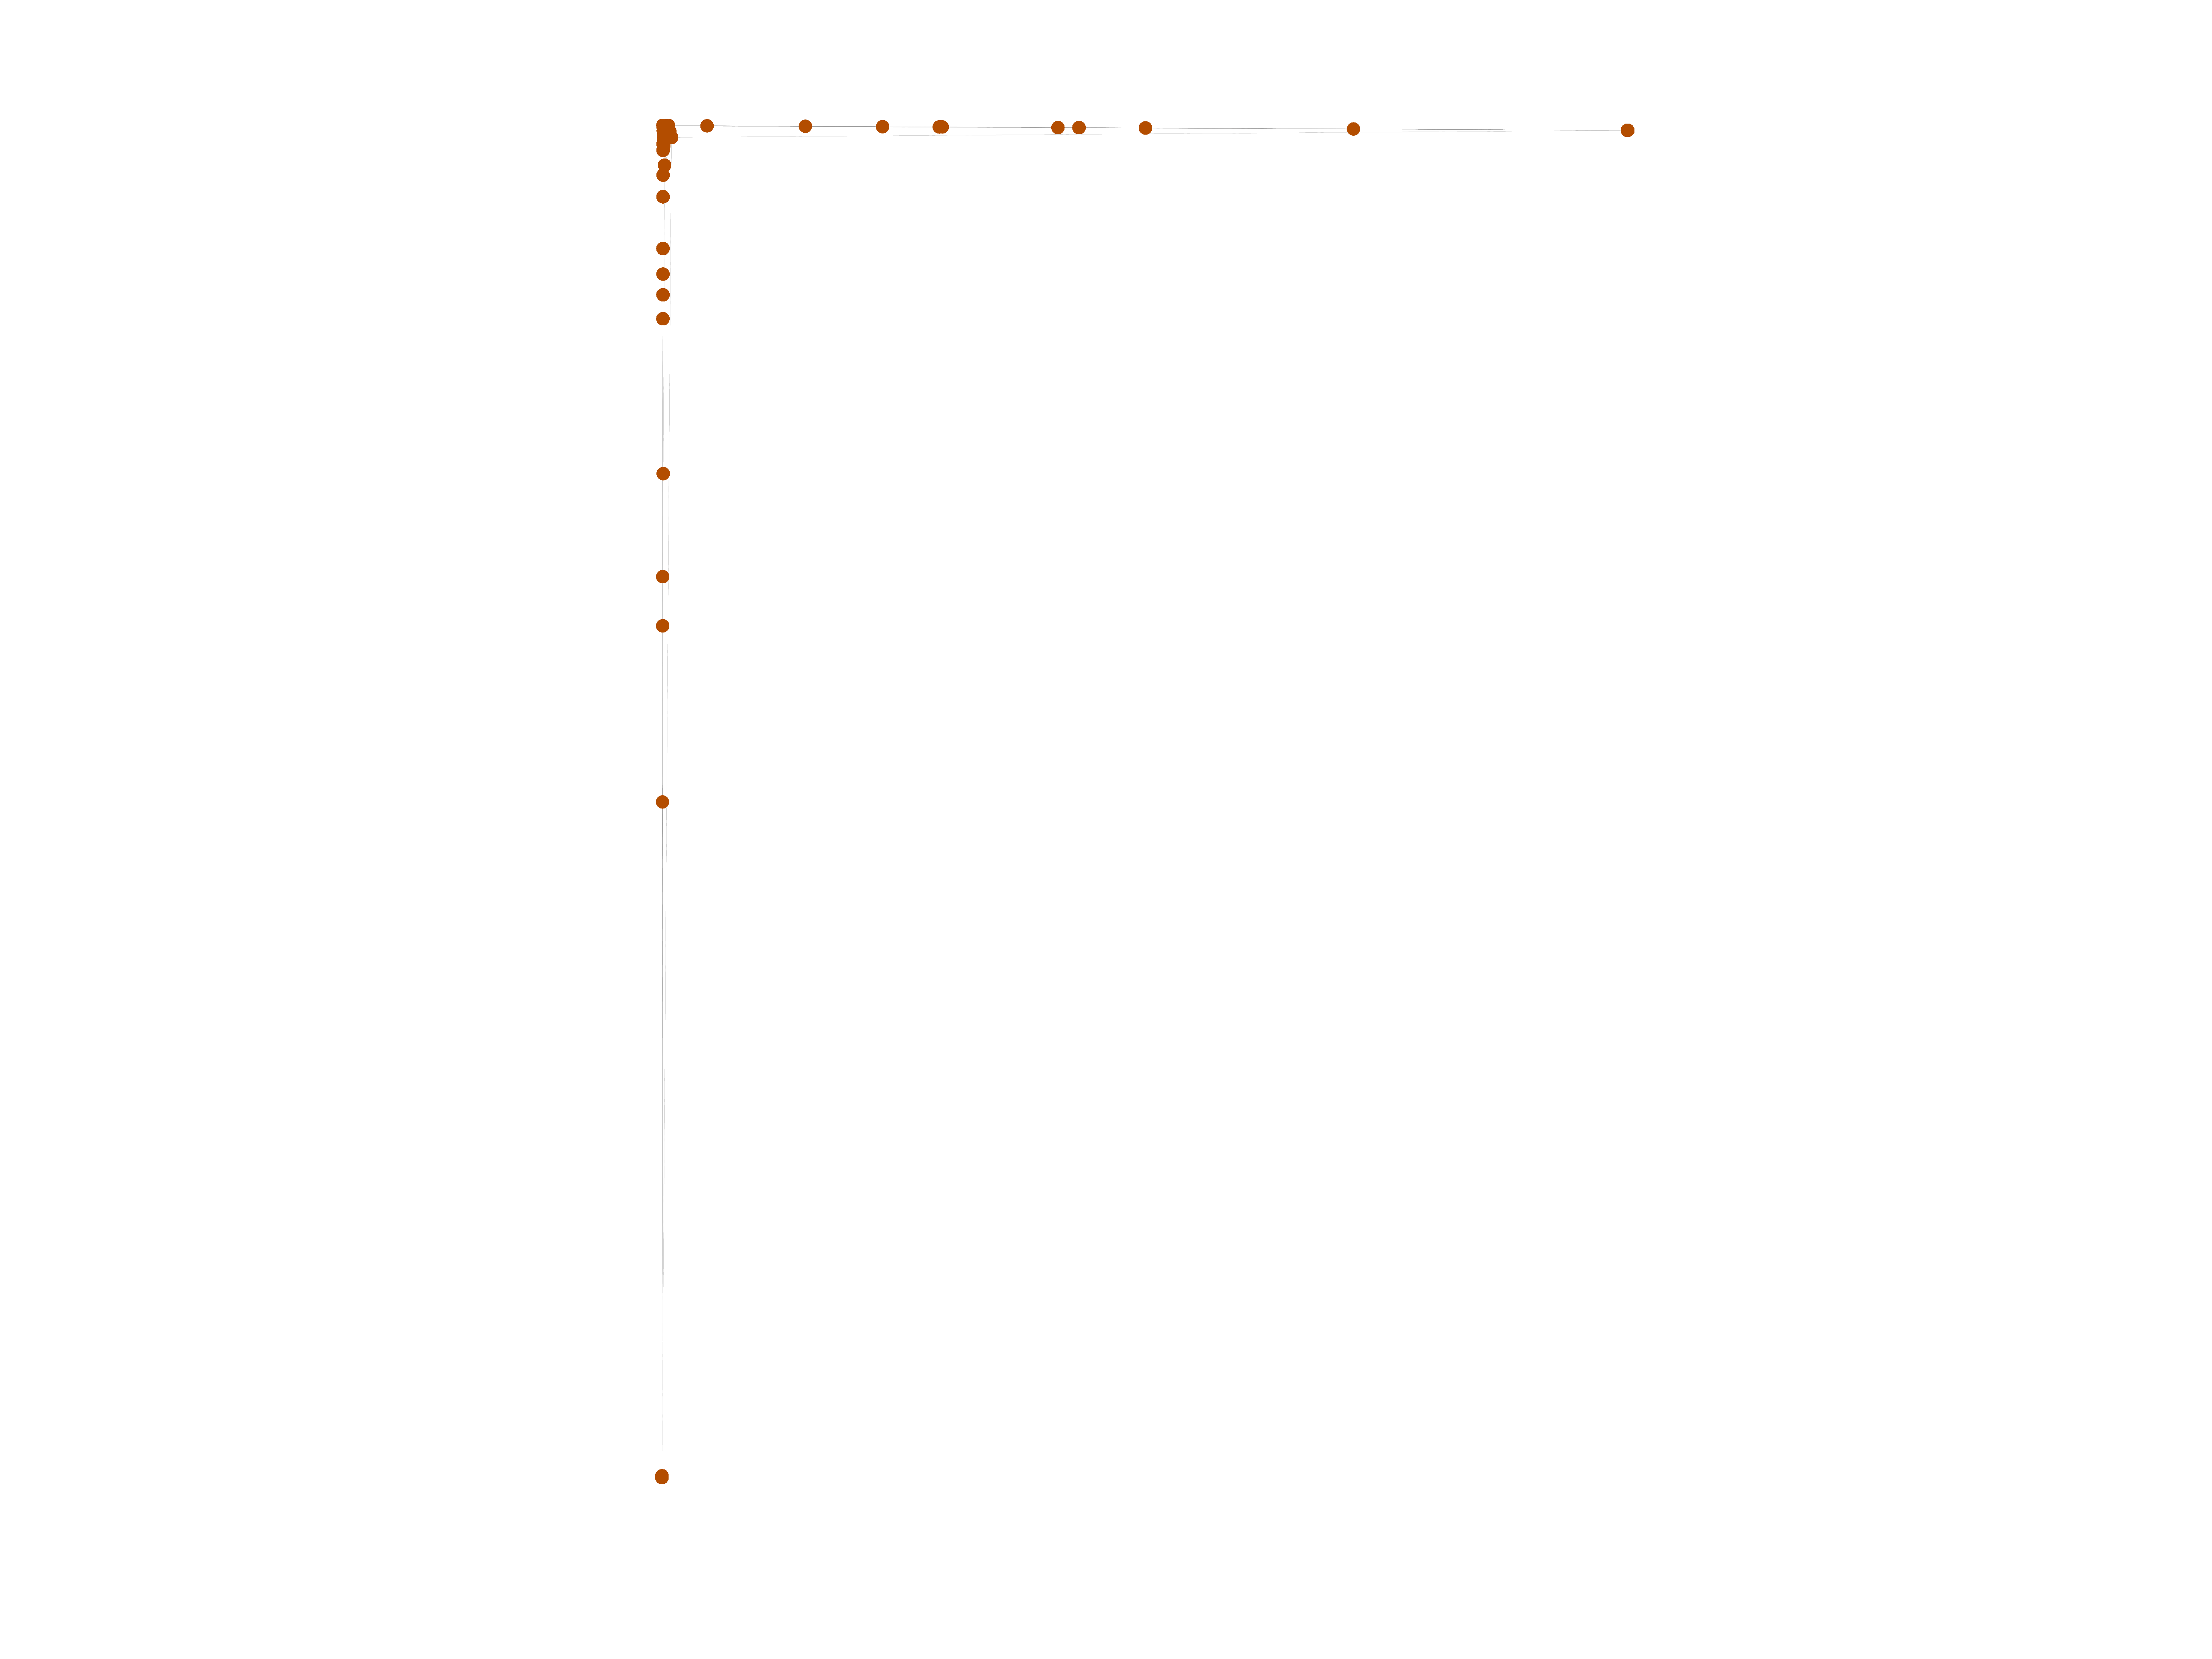
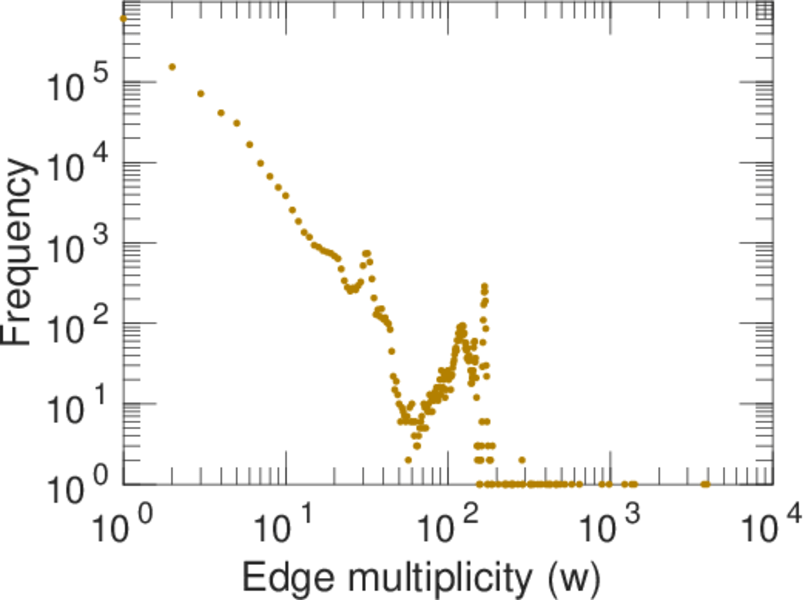
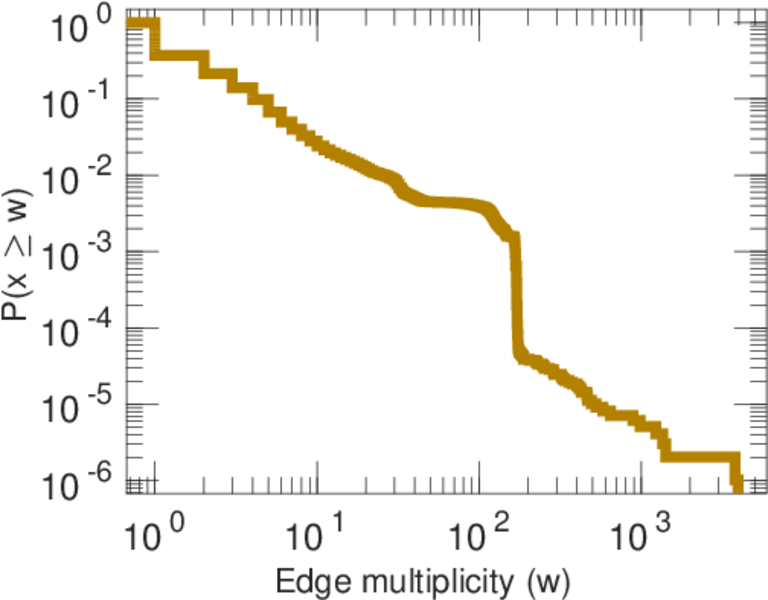
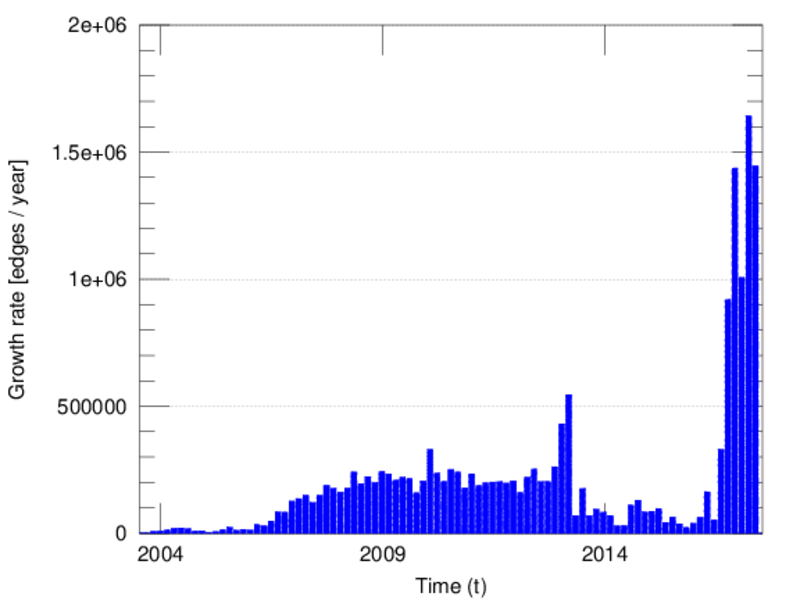
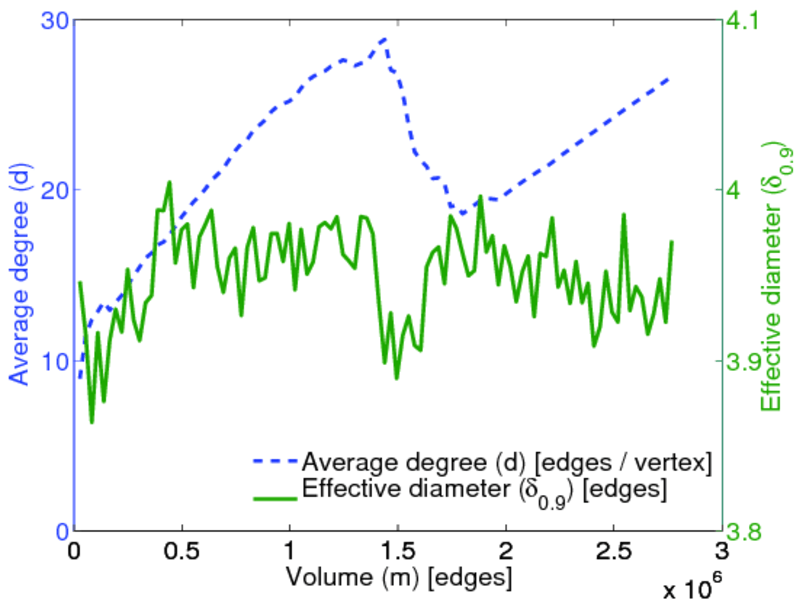
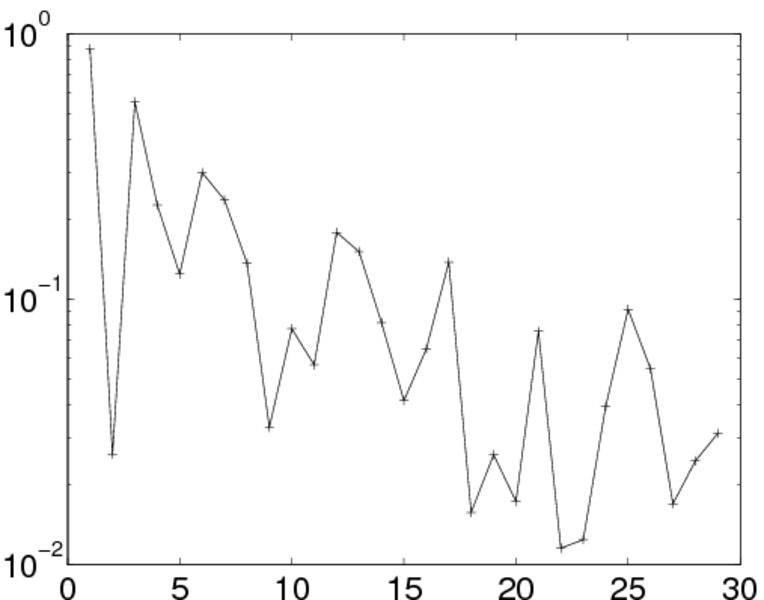
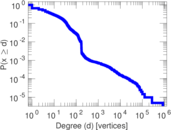
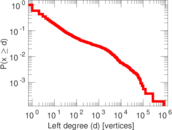
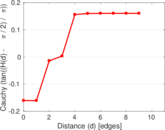
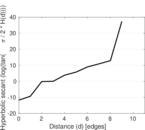
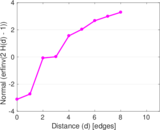
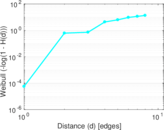
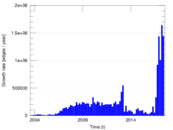
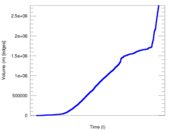
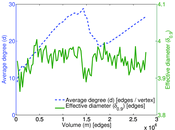
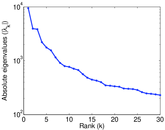
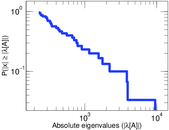
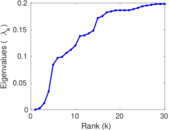
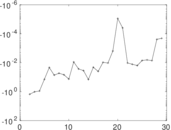
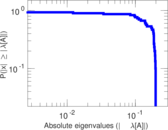
Plots


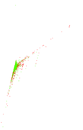
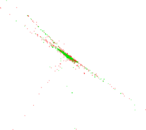

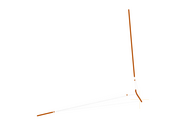
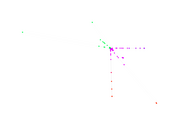

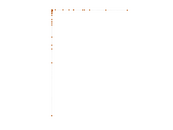


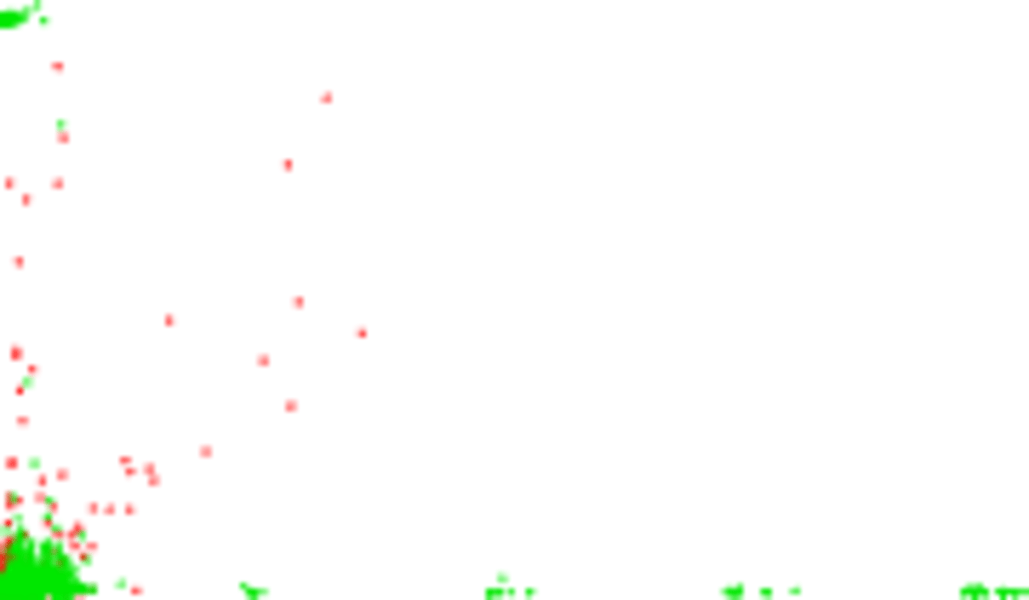
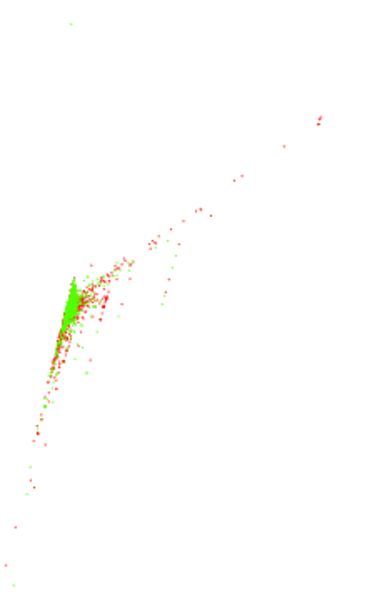
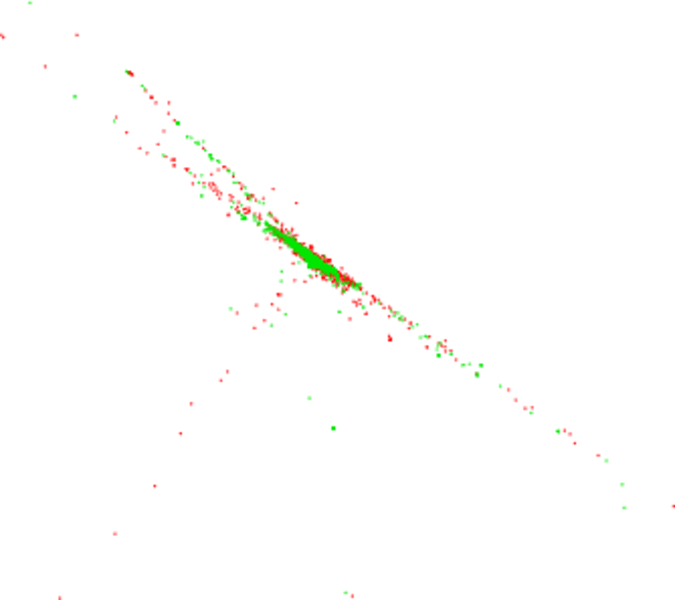
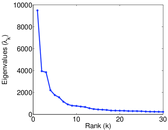
Matrix decompositions plots

Downloads
References
|
[1]
|
Jérôme Kunegis.
KONECT – The Koblenz Network Collection.
In Proc. Int. Conf. on World Wide Web Companion, pages
1343–1350, 2013.
[ http ]
|
|
[2]
|
Wikimedia Foundation.
Wikimedia downloads.
http://dumps.wikimedia.org/, January 2010.
|
 KONECT ‣ Networks ‣
Buy Me a Coffee
KONECT ‣ Networks ‣
Buy Me a Coffee