Wikiquote edits (cy)
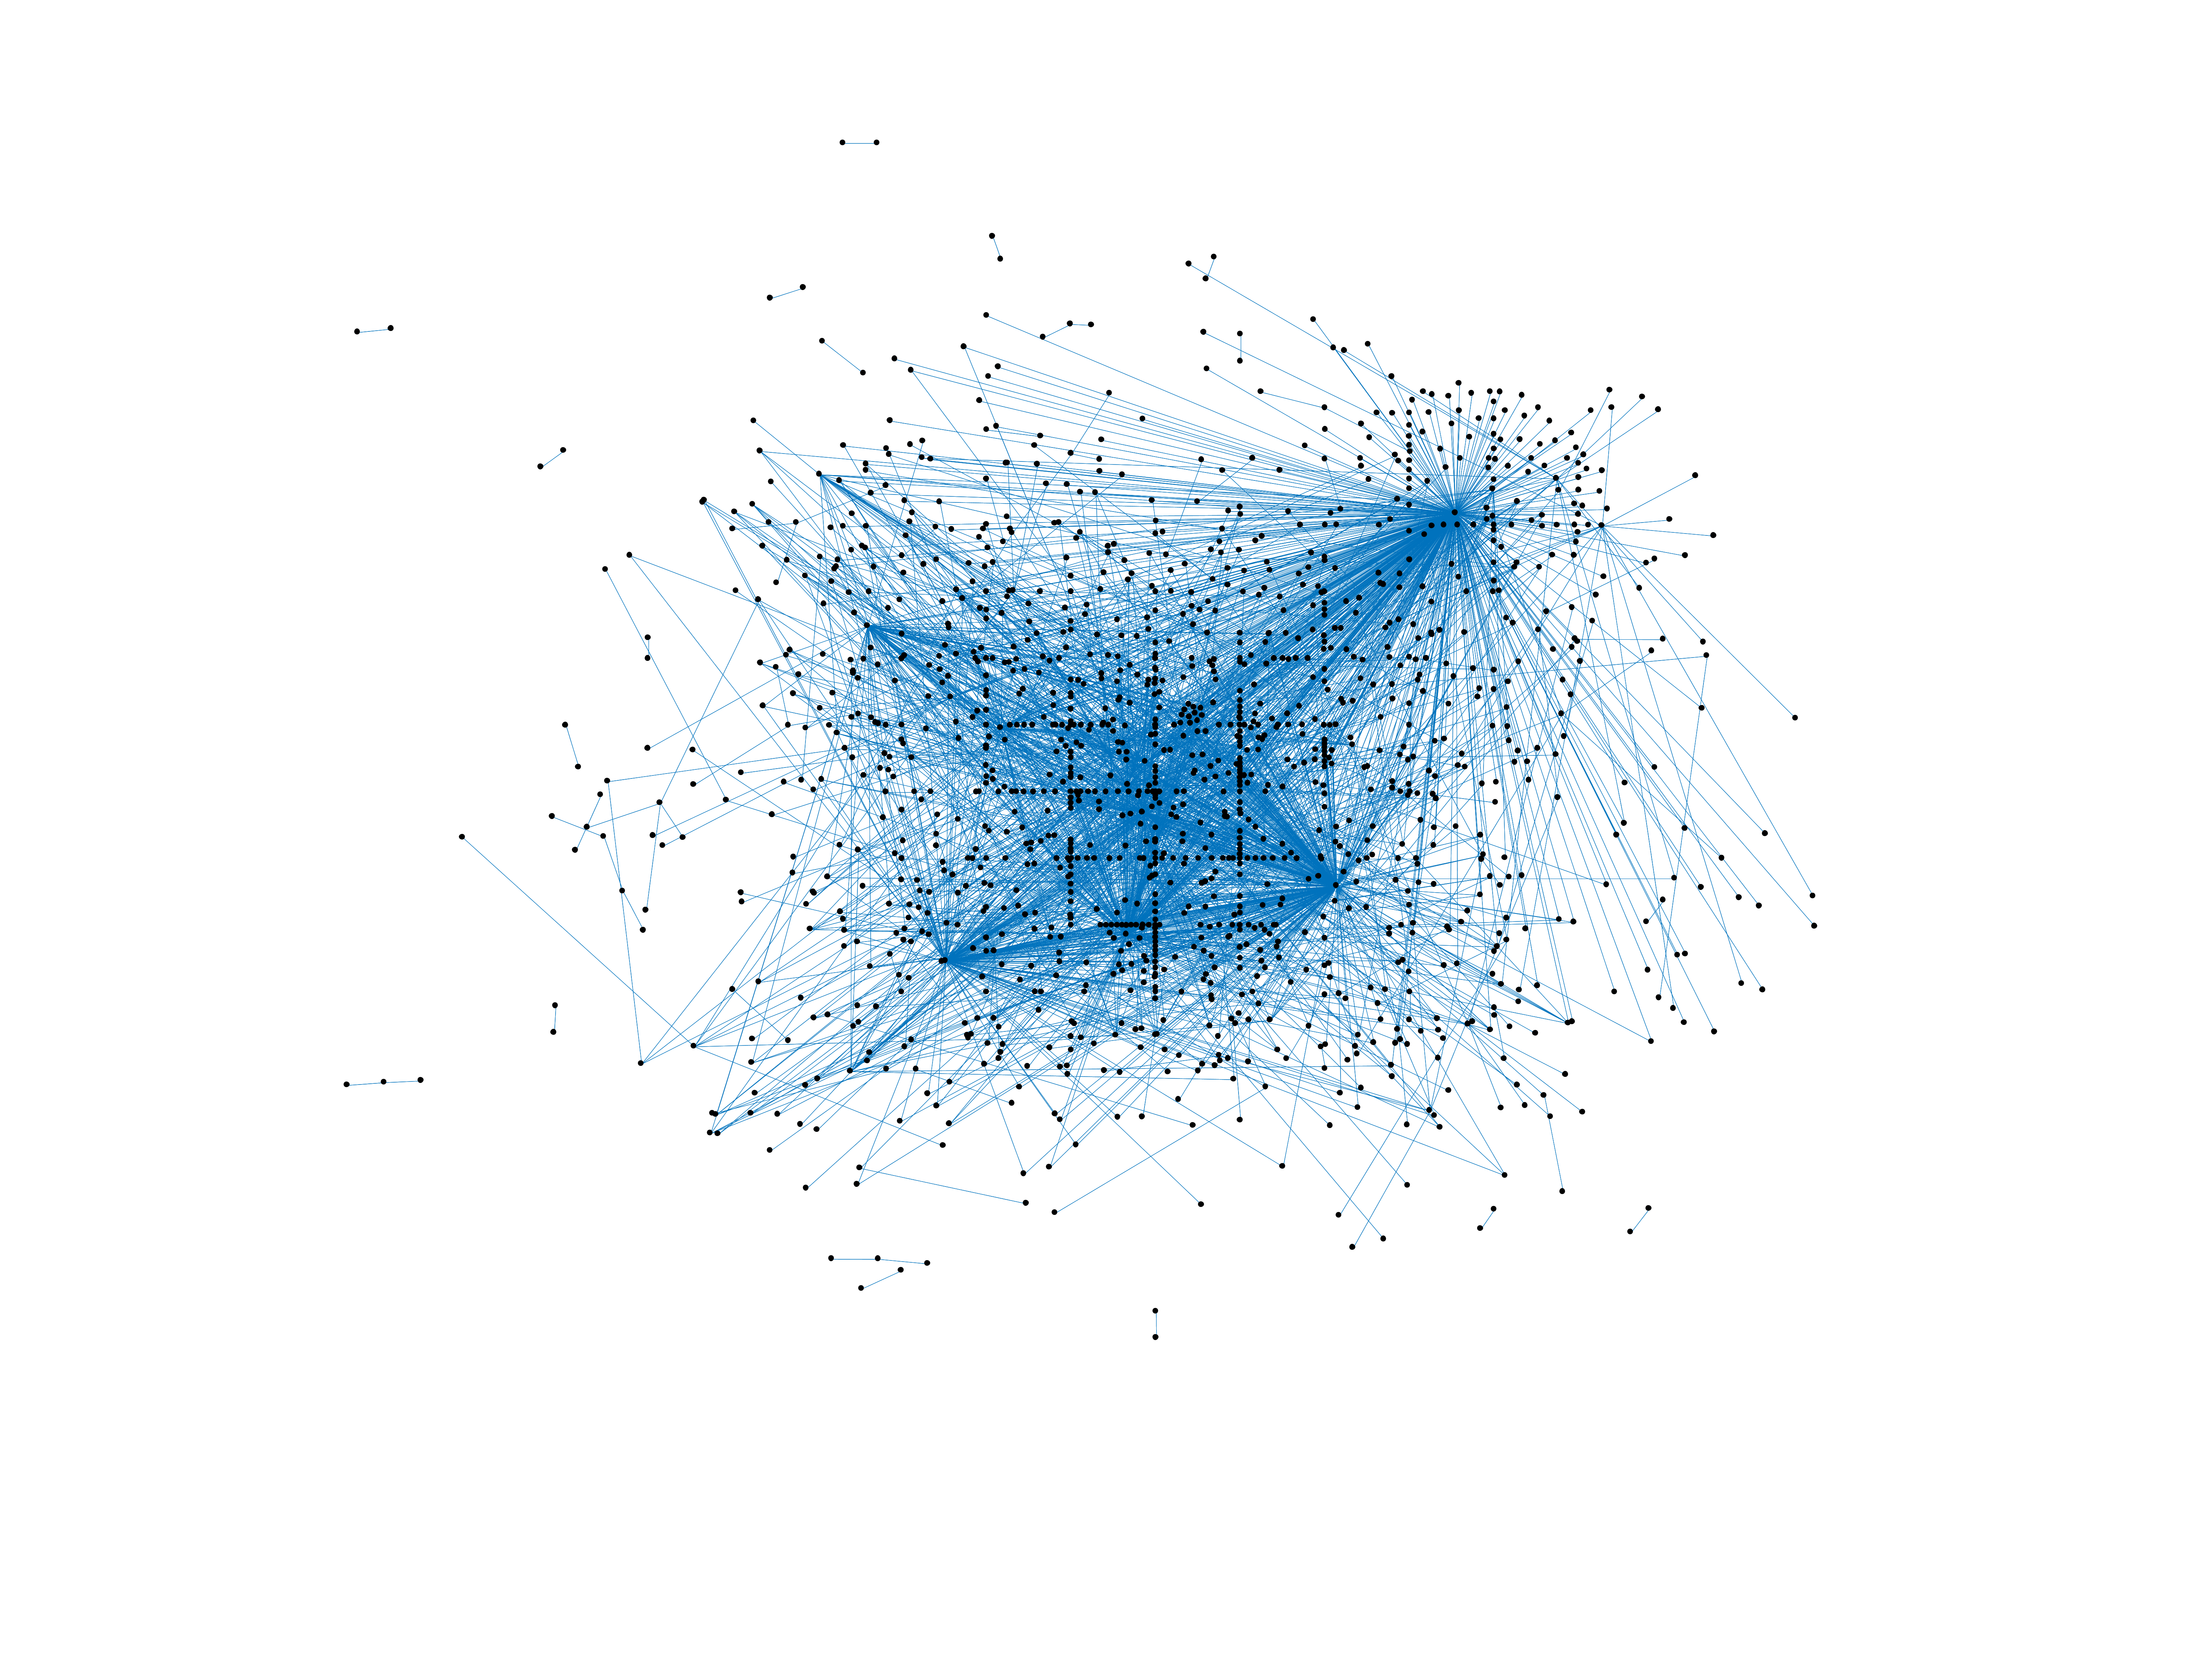
This is the bipartite edit network of the Welsh Wikiquote. It contains users
and pages from the Welsh Wikiquote, connected by edit events. Each edge
represents an edit. The dataset includes the timestamp of each edit.
Metadata
Statistics
| Size | n = | 1,557
|
| Left size | n1 = | 208
|
| Right size | n2 = | 1,349
|
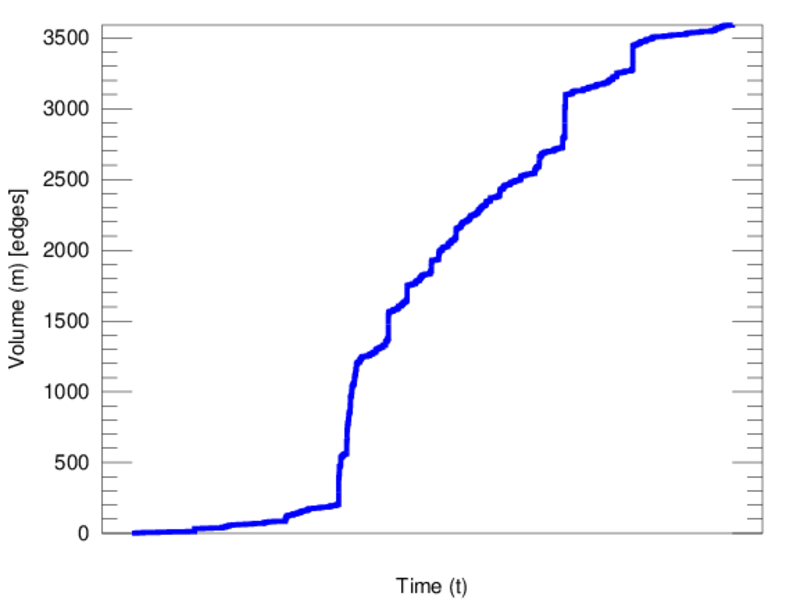
| Volume | m = | 3,591
|
| Unique edge count | m̿ = | 2,492
|
| Wedge count | s = | 263,535
|
| Claw count | z = | 30,882,623
|
| Cross count | x = | 3,100,979,019
|
| Square count | q = | 79,443
|
| 4-Tour count | T4 = | 1,694,800
|
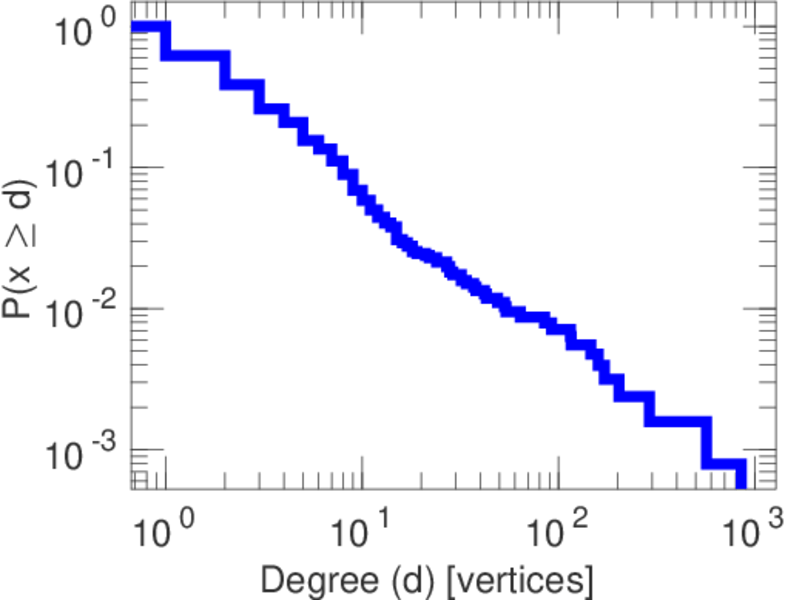
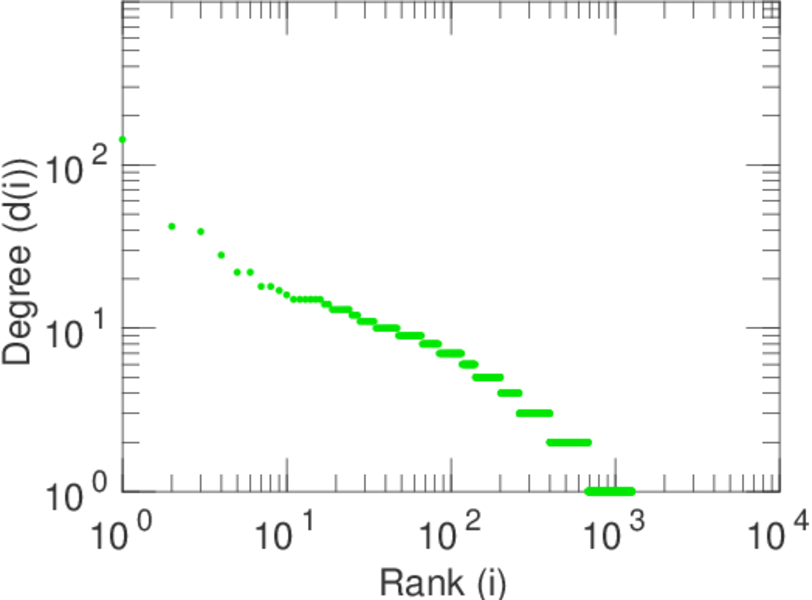
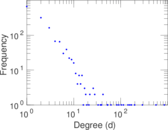
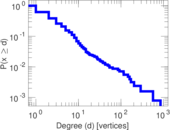
| Maximum degree | dmax = | 849
|
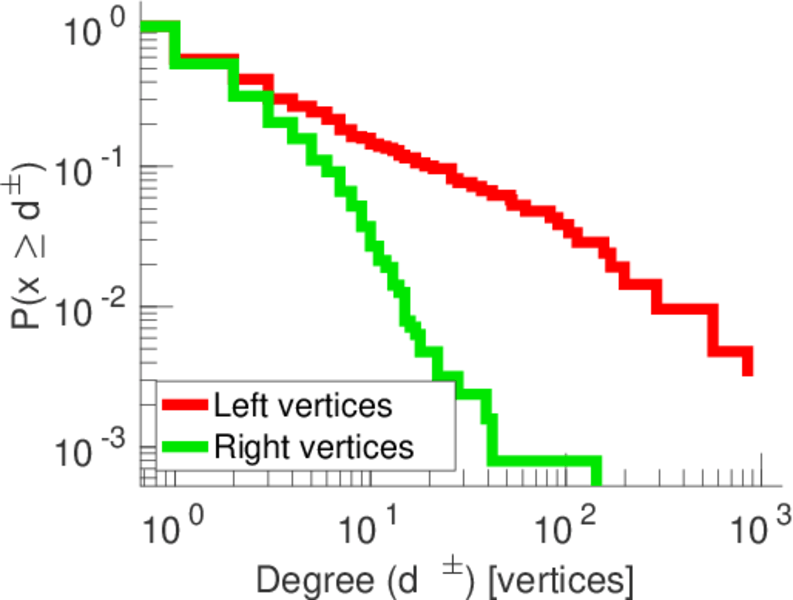
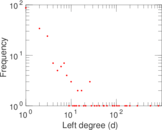
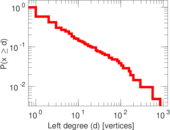
| Maximum left degree | d1max = | 849
|
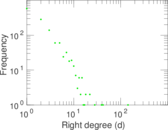
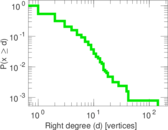
| Maximum right degree | d2max = | 143
|
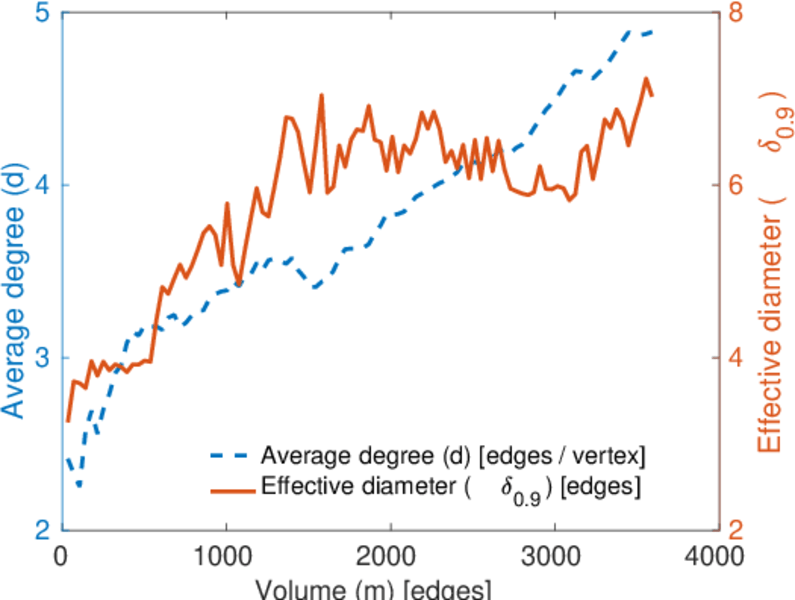
| Average degree | d = | 4.612 72
|
| Average left degree | d1 = | 17.264 4
|
| Average right degree | d2 = | 2.661 97
|
| Fill | p = | 0.008 881 22
|
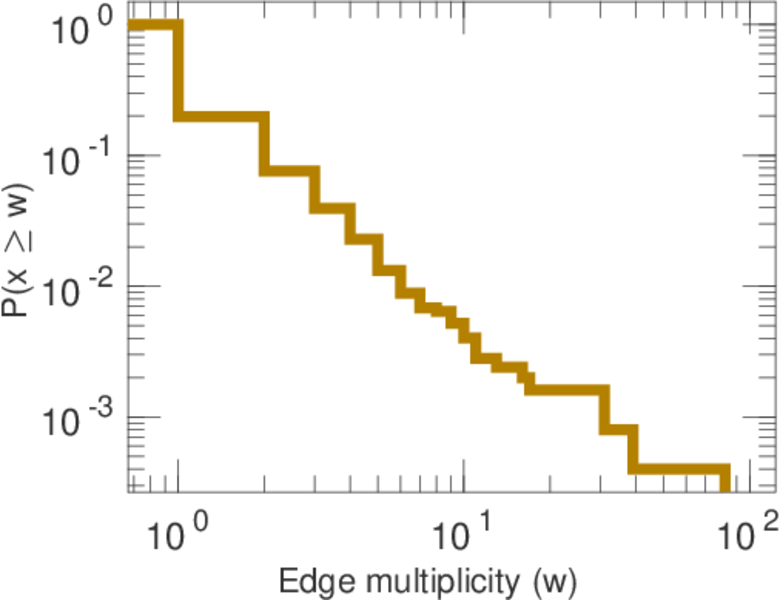
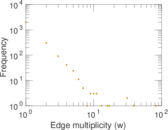
| Average edge multiplicity | m̃ = | 1.441 01
|
| Size of LCC | N = | 1,277
|
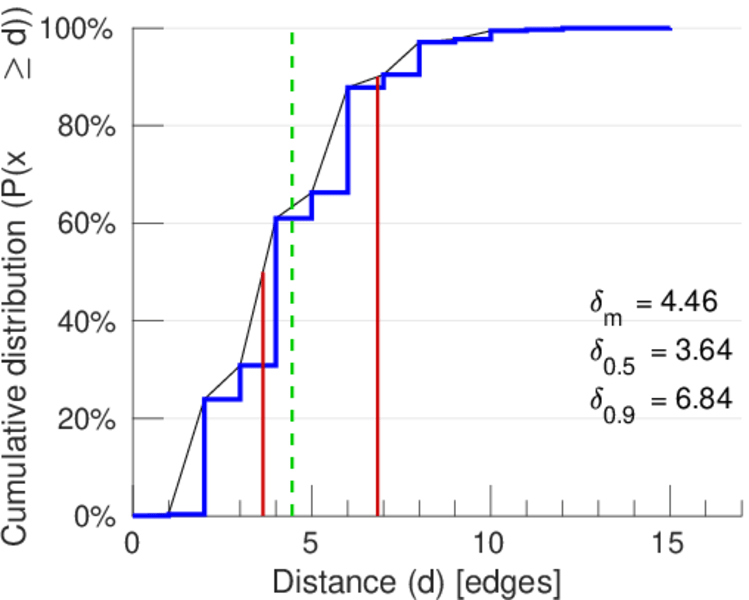
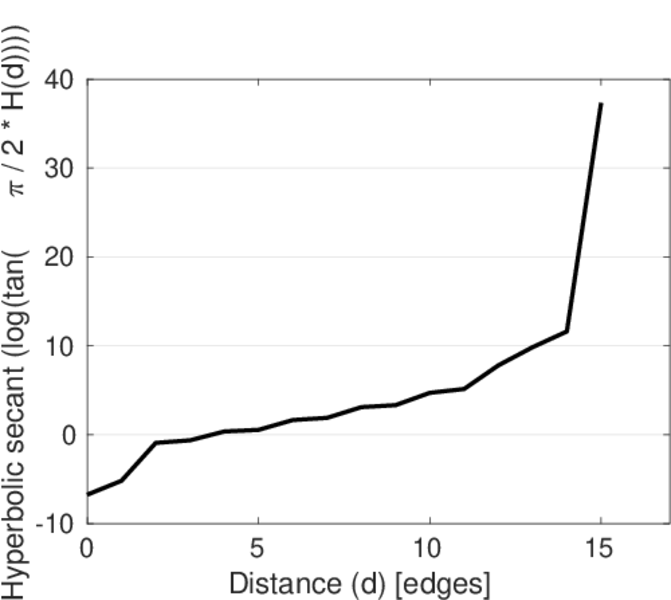
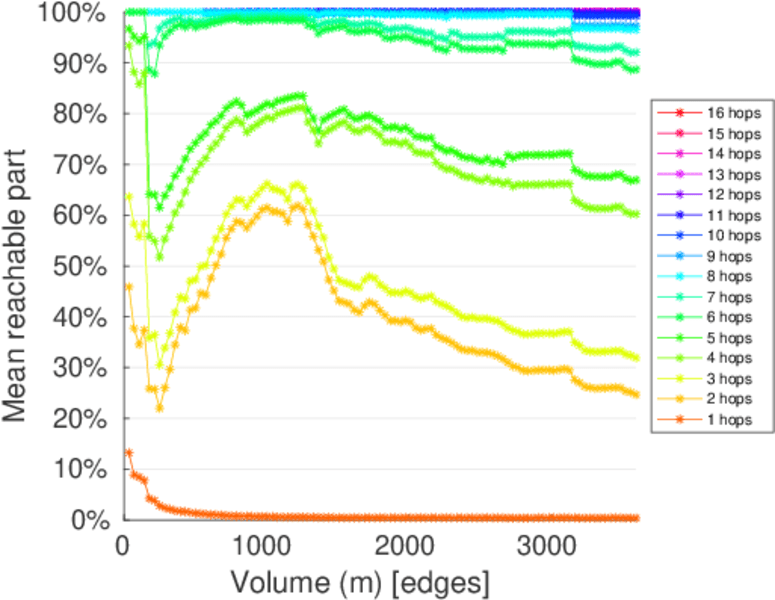
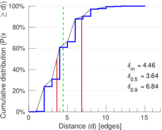
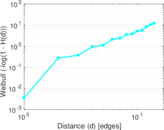
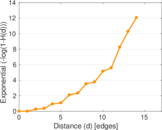
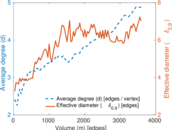
| Diameter | δ = | 16
|
| 50-Percentile effective diameter | δ0.5 = | 3.635 33
|
| 90-Percentile effective diameter | δ0.9 = | 6.840 23
|
| Median distance | δM = | 4
|
| Mean distance | δm = | 4.455 30
|
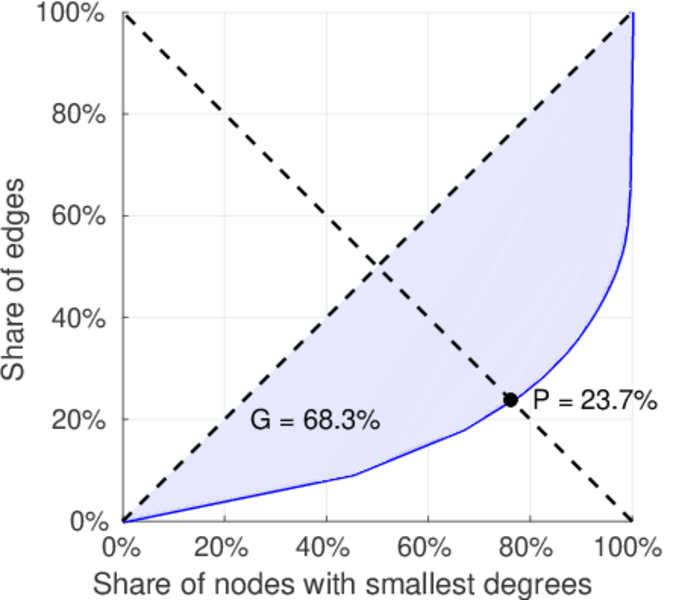
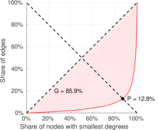
| Gini coefficient | G = | 0.693 265
|
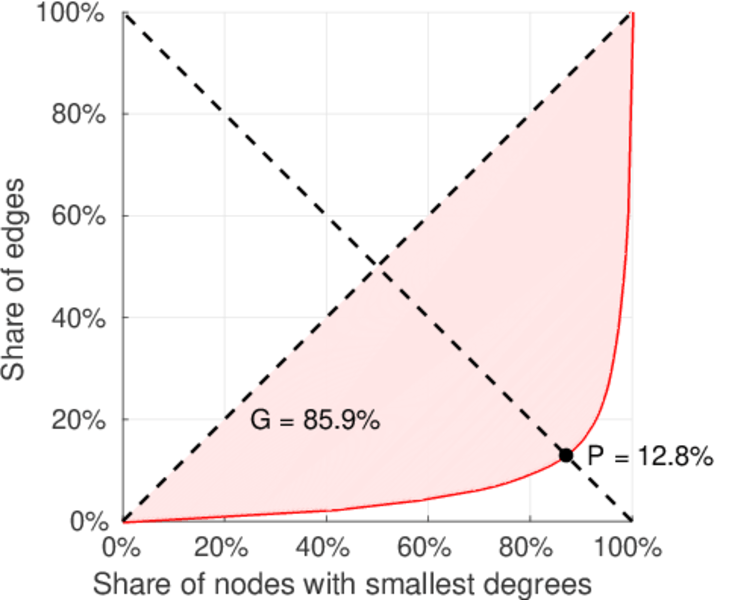
| Balanced inequality ratio | P = | 0.233 222
|
| Left balanced inequality ratio | P1 = | 0.127 820
|
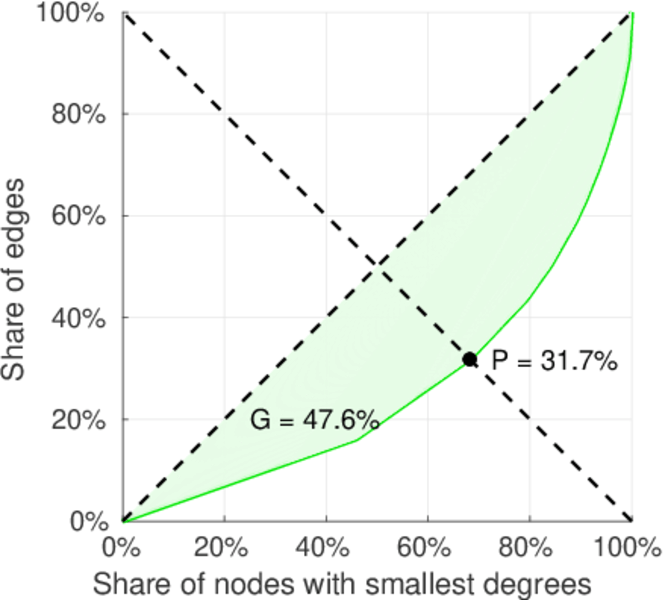
| Right balanced inequality ratio | P2 = | 0.316 625
|
| Relative edge distribution entropy | Her = | 0.797 198
|
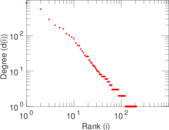
| Power law exponent | γ = | 2.866 20
|
| Tail power law exponent | γt = | 2.481 00
|
| Tail power law exponent with p | γ3 = | 2.481 00
|
| p-value | p = | 0.000 00
|
| Left tail power law exponent with p | γ3,1 = | 1.751 00
|
| Left p-value | p1 = | 0.202 000
|
| Right tail power law exponent with p | γ3,2 = | 6.311 00
|
| Right p-value | p2 = | 0.872 000
|
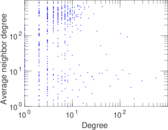
| Degree assortativity | ρ = | −0.085 092 6
|
| Degree assortativity p-value | pρ = | 2.105 45 × 10−5
|
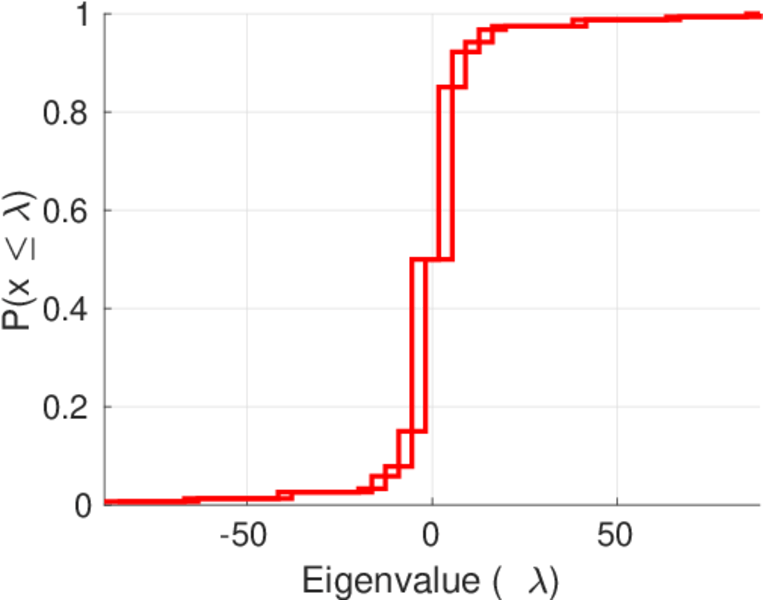
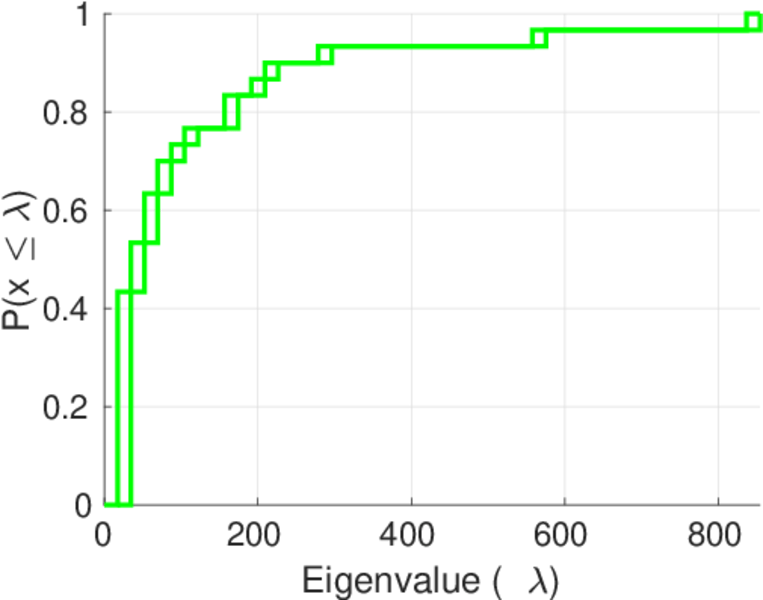
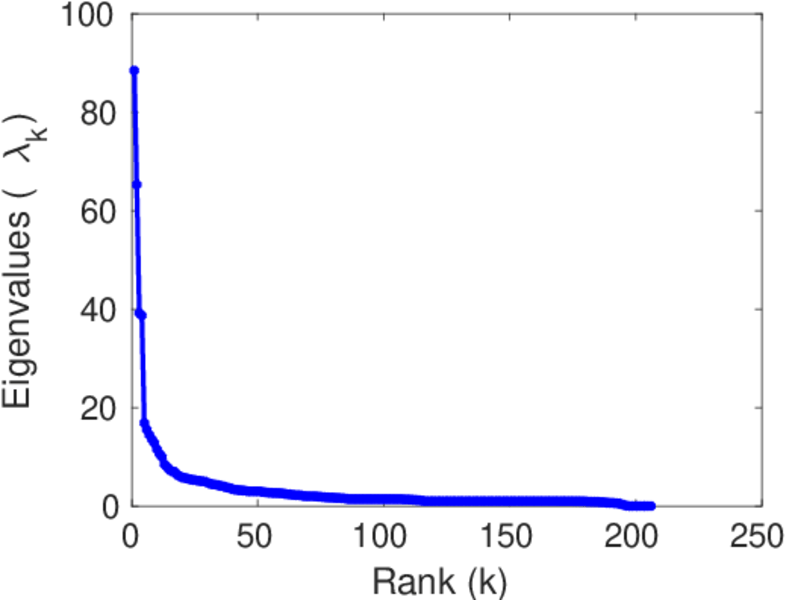
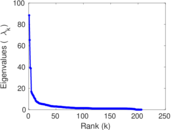
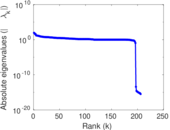
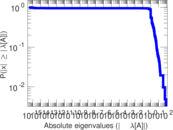
| Spectral norm | α = | 88.453 3
|
| Algebraic connectivity | a = | 0.010 559 4
|
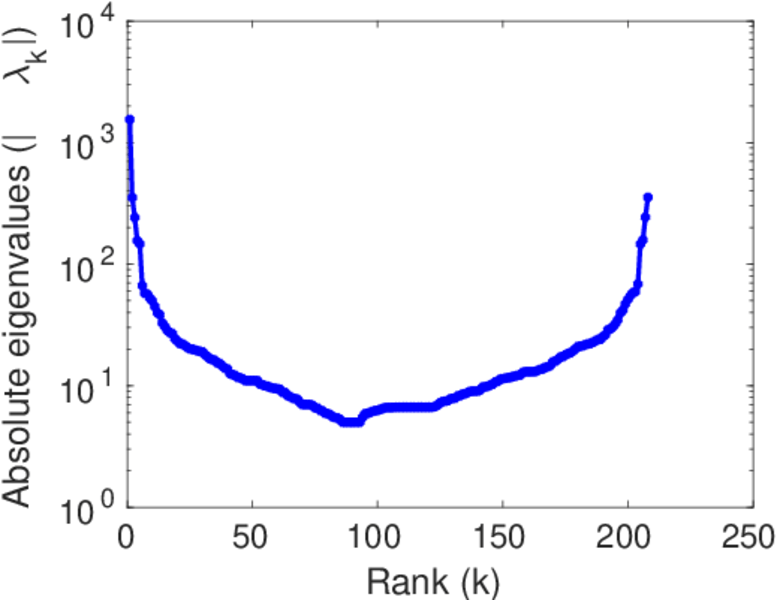
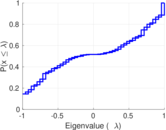
| Spectral separation | |λ1[A] / λ2[A]| = | 1.355 17
|
| Controllability | C = | 1,078
|
| Relative controllability | Cr = | 0.733 333
|
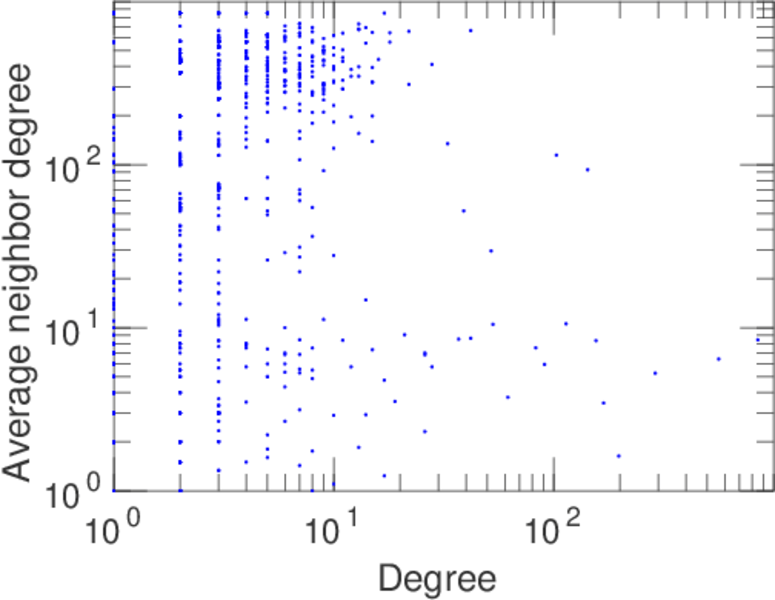
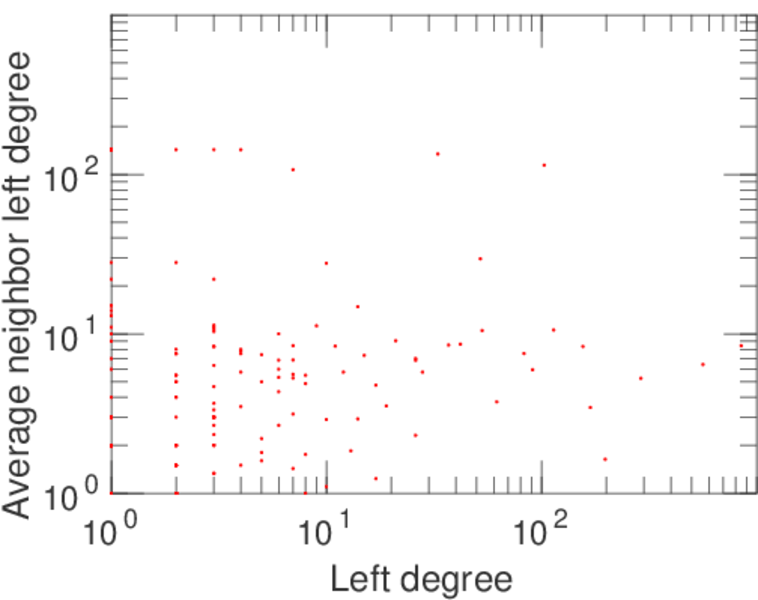
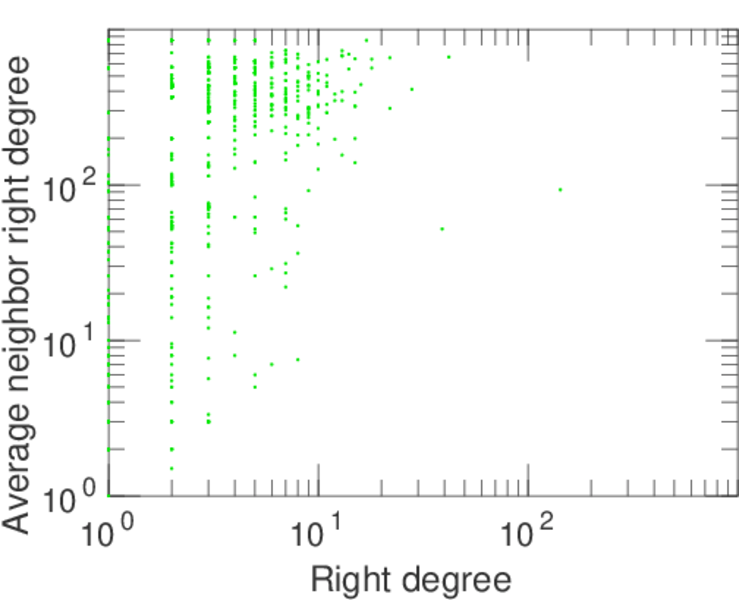
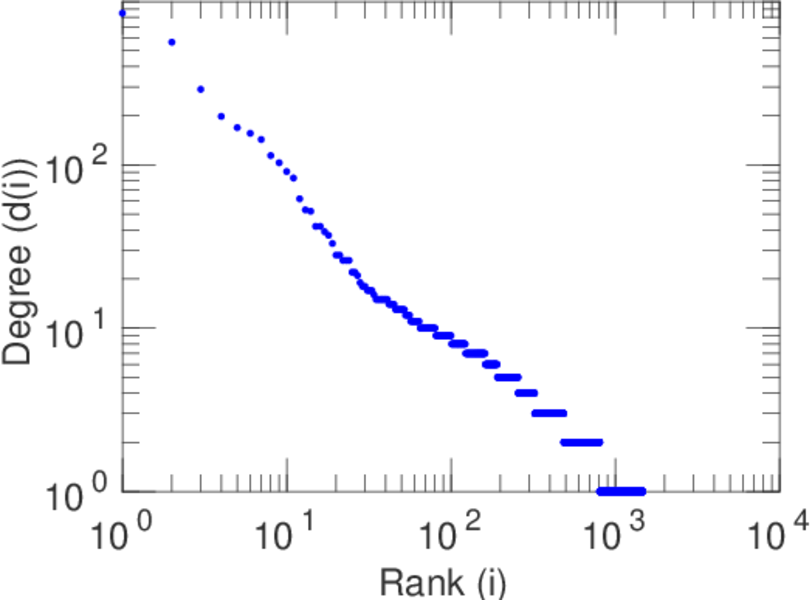
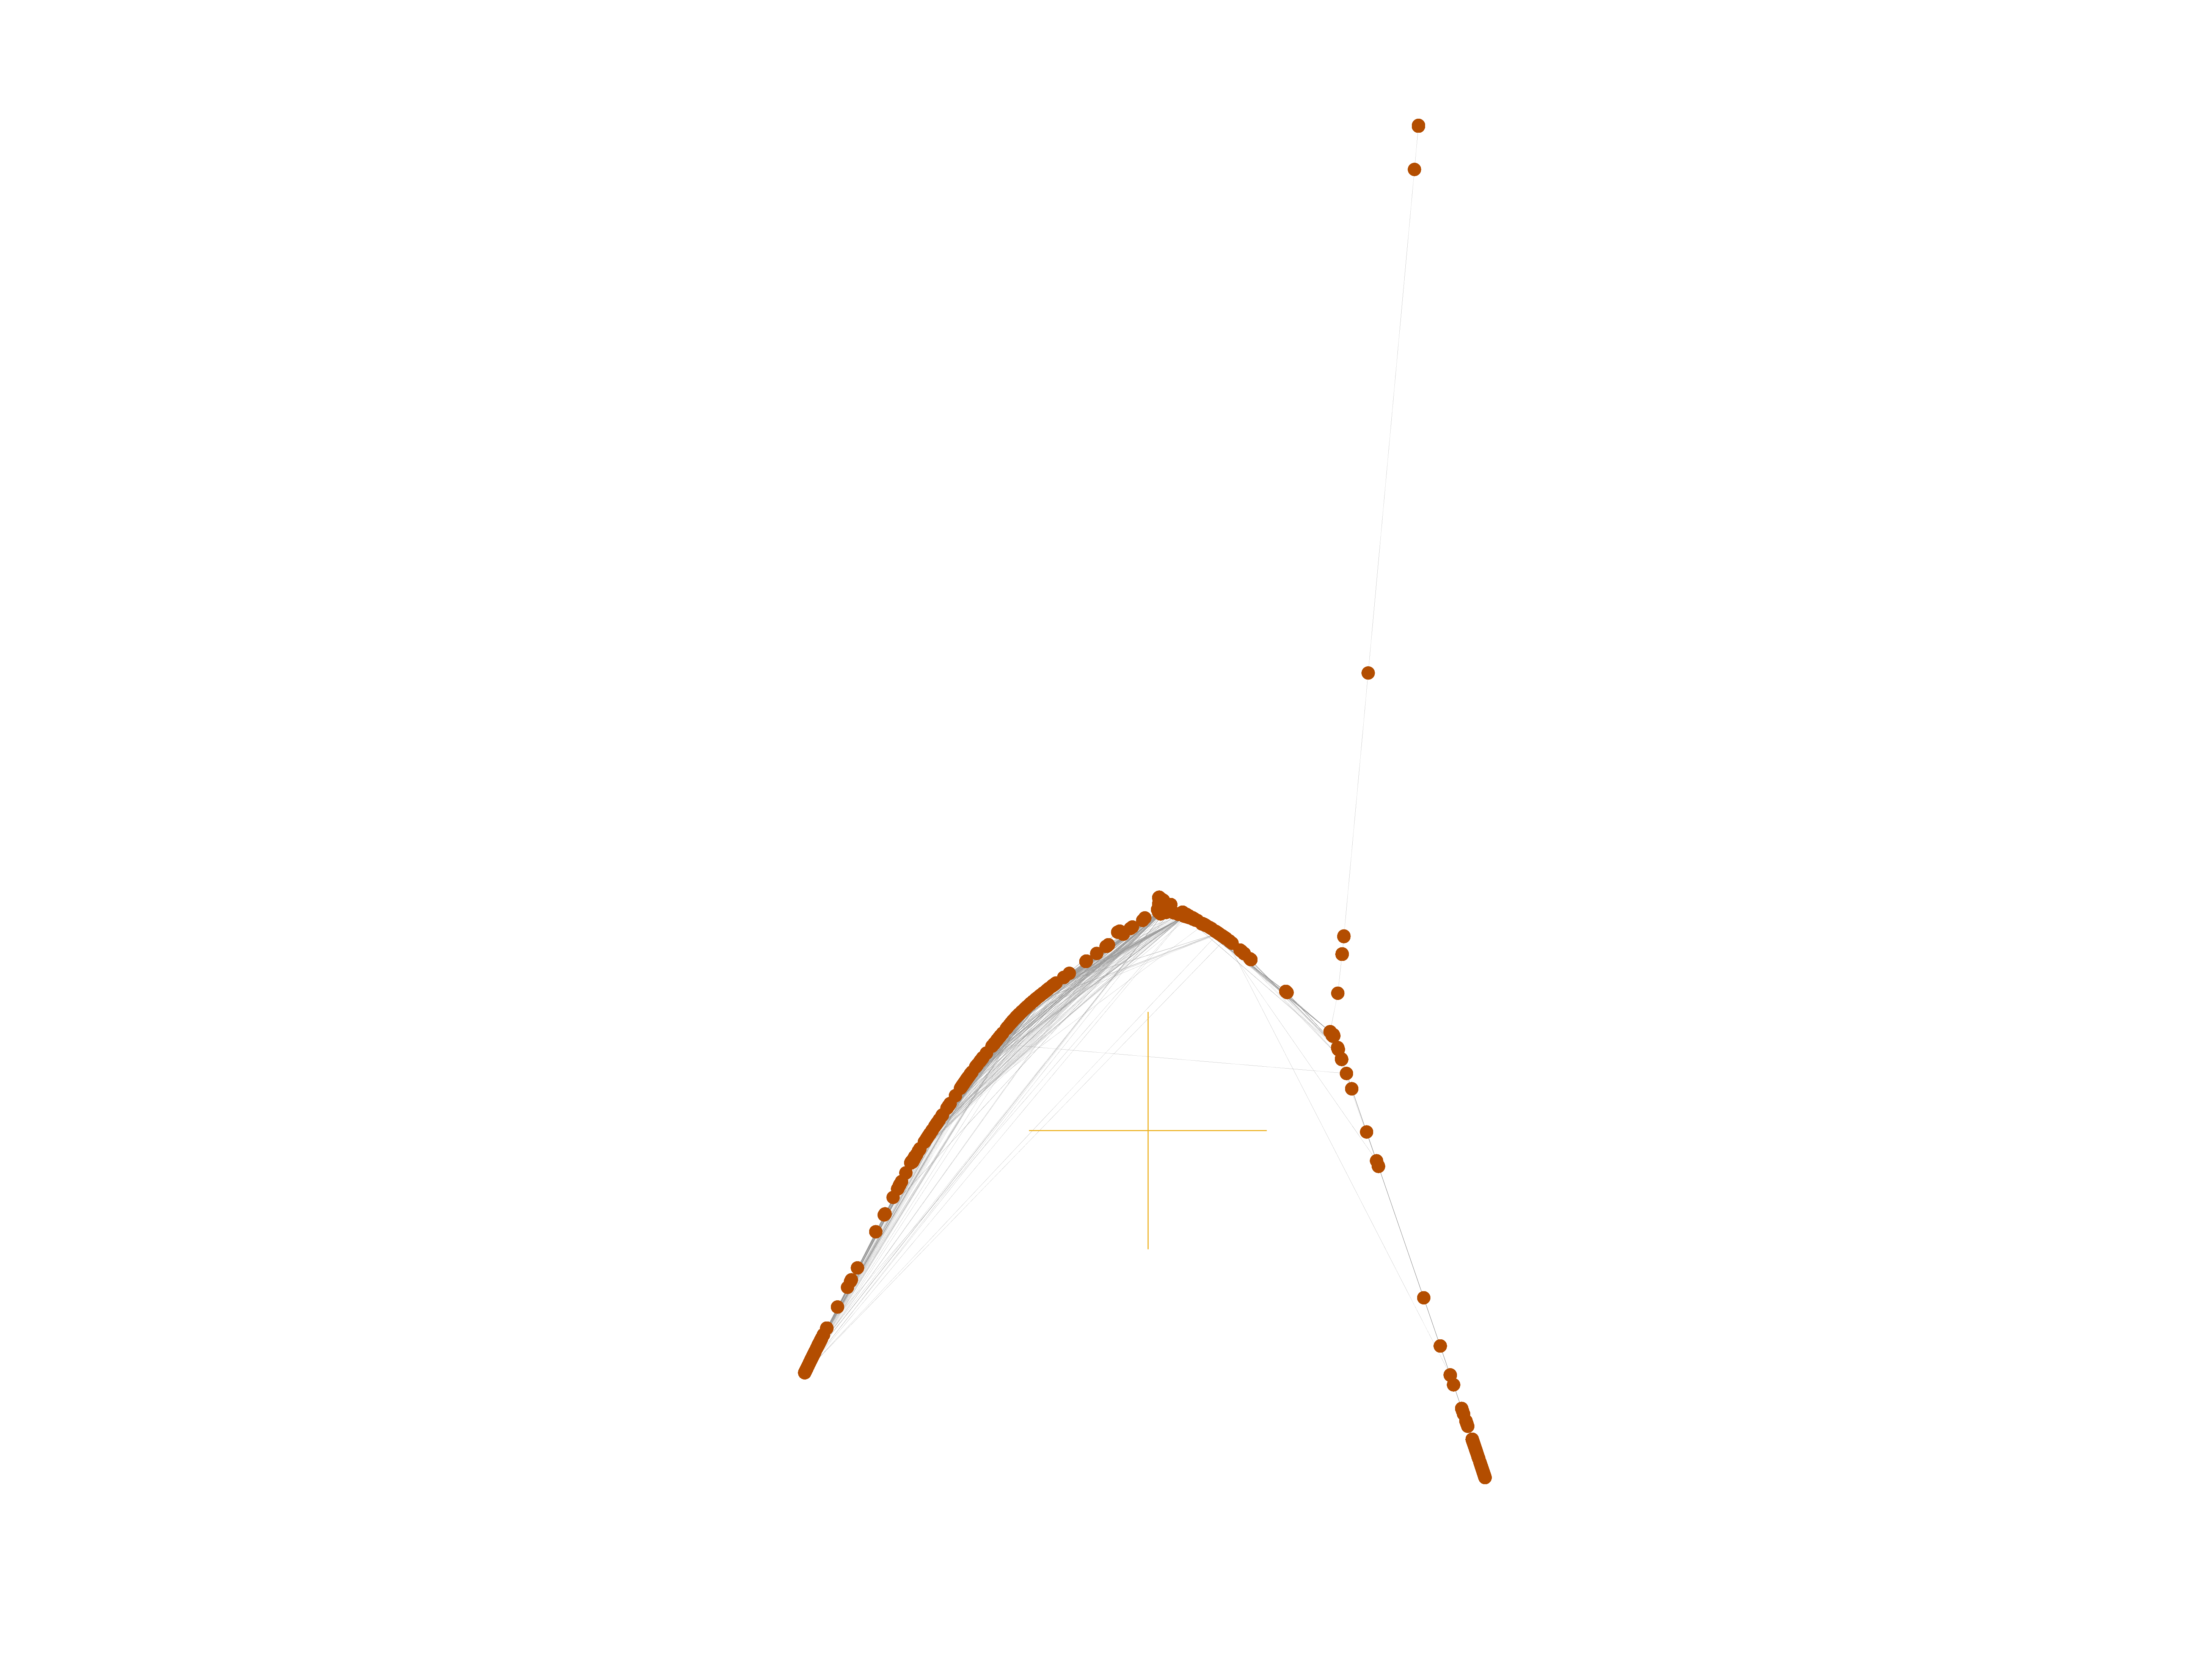
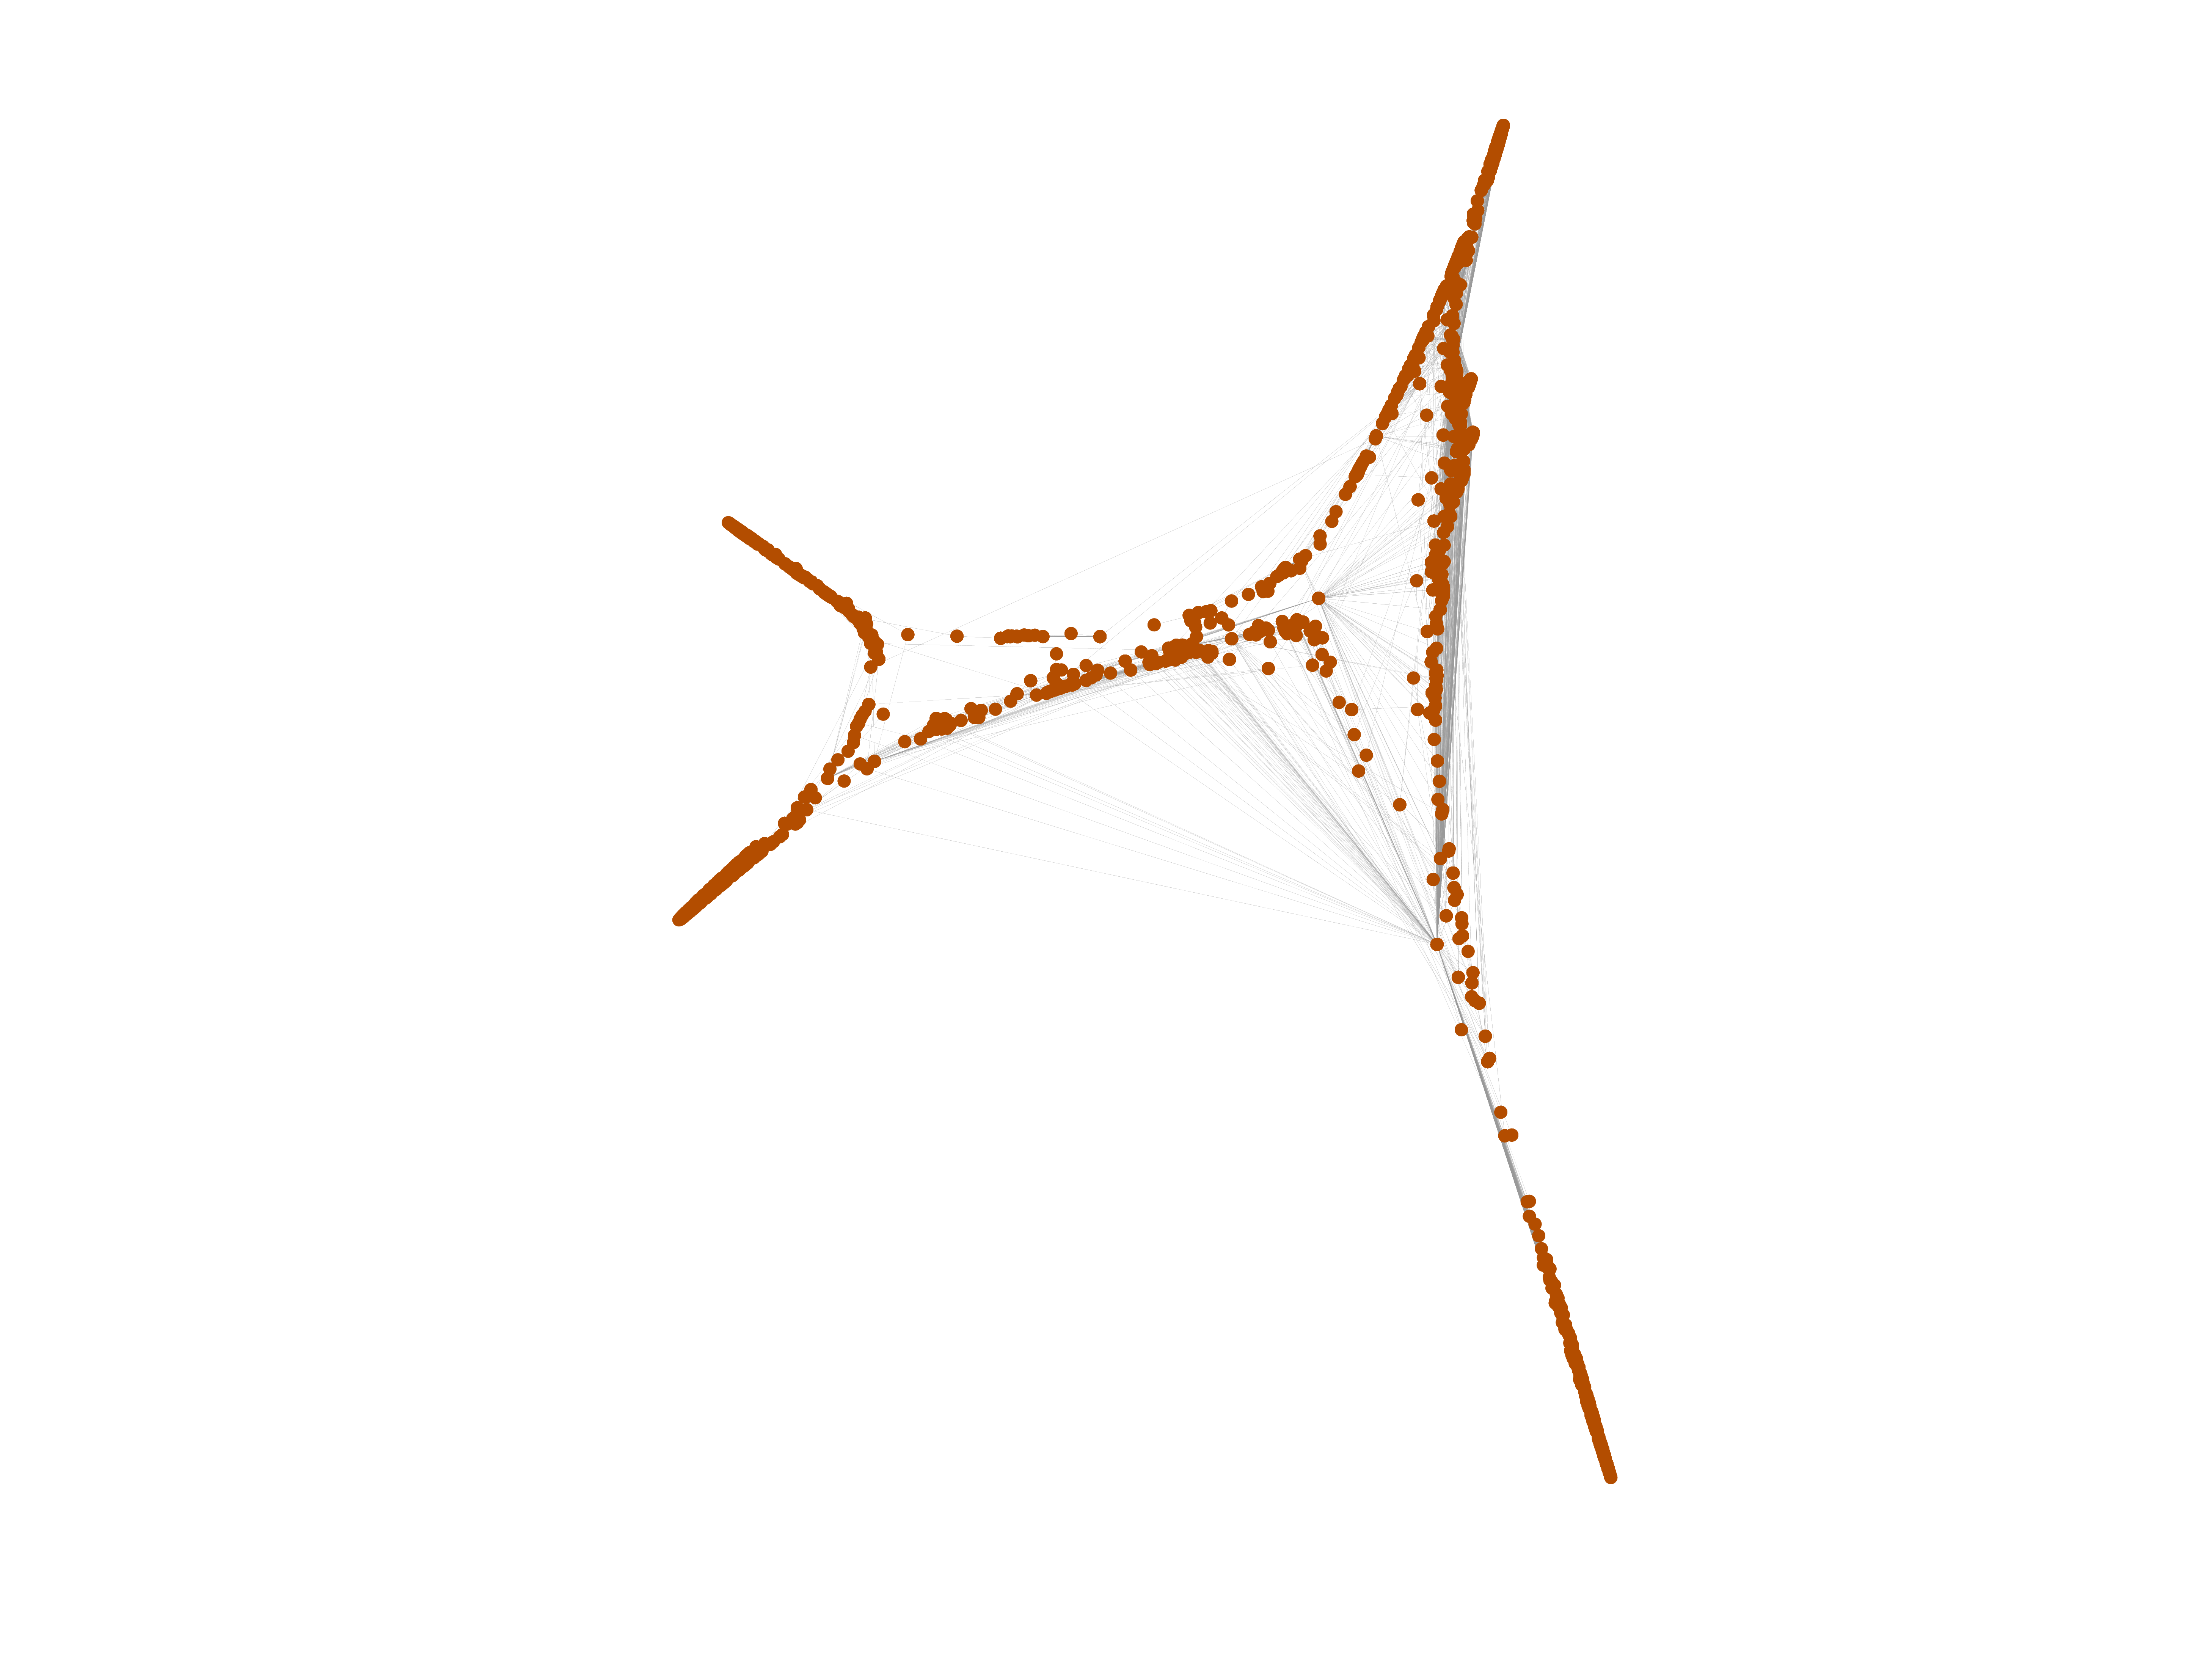
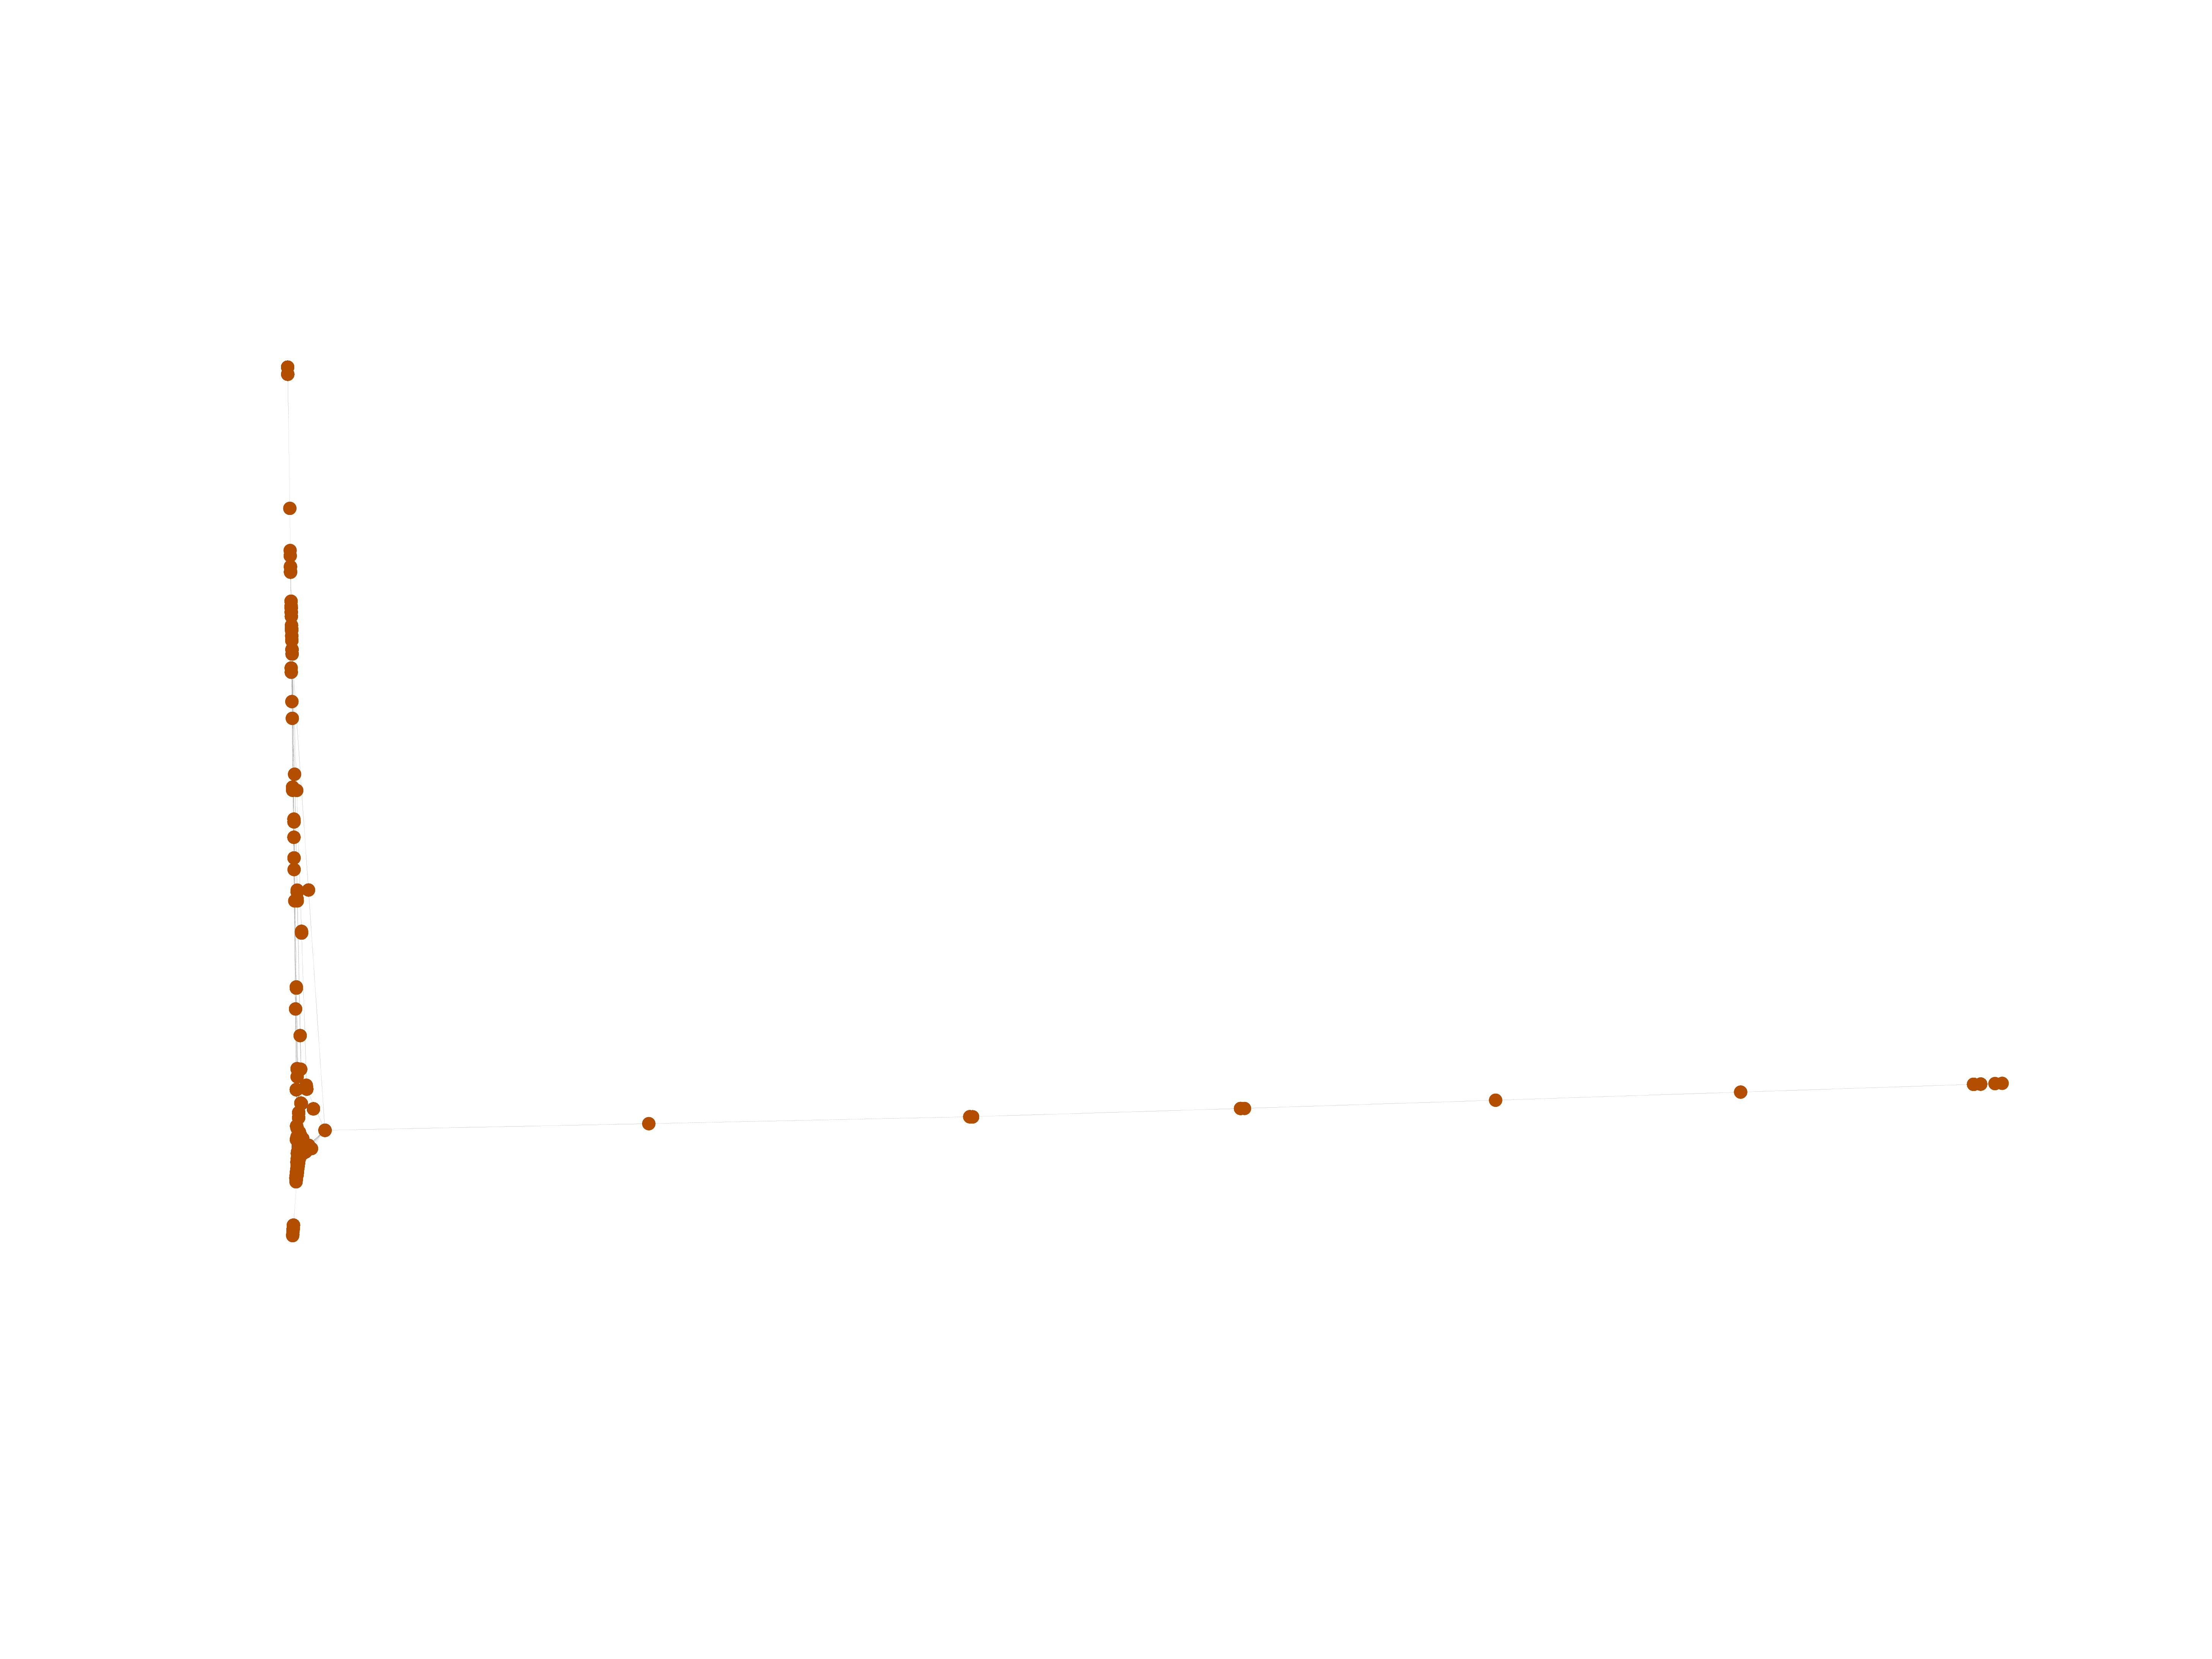
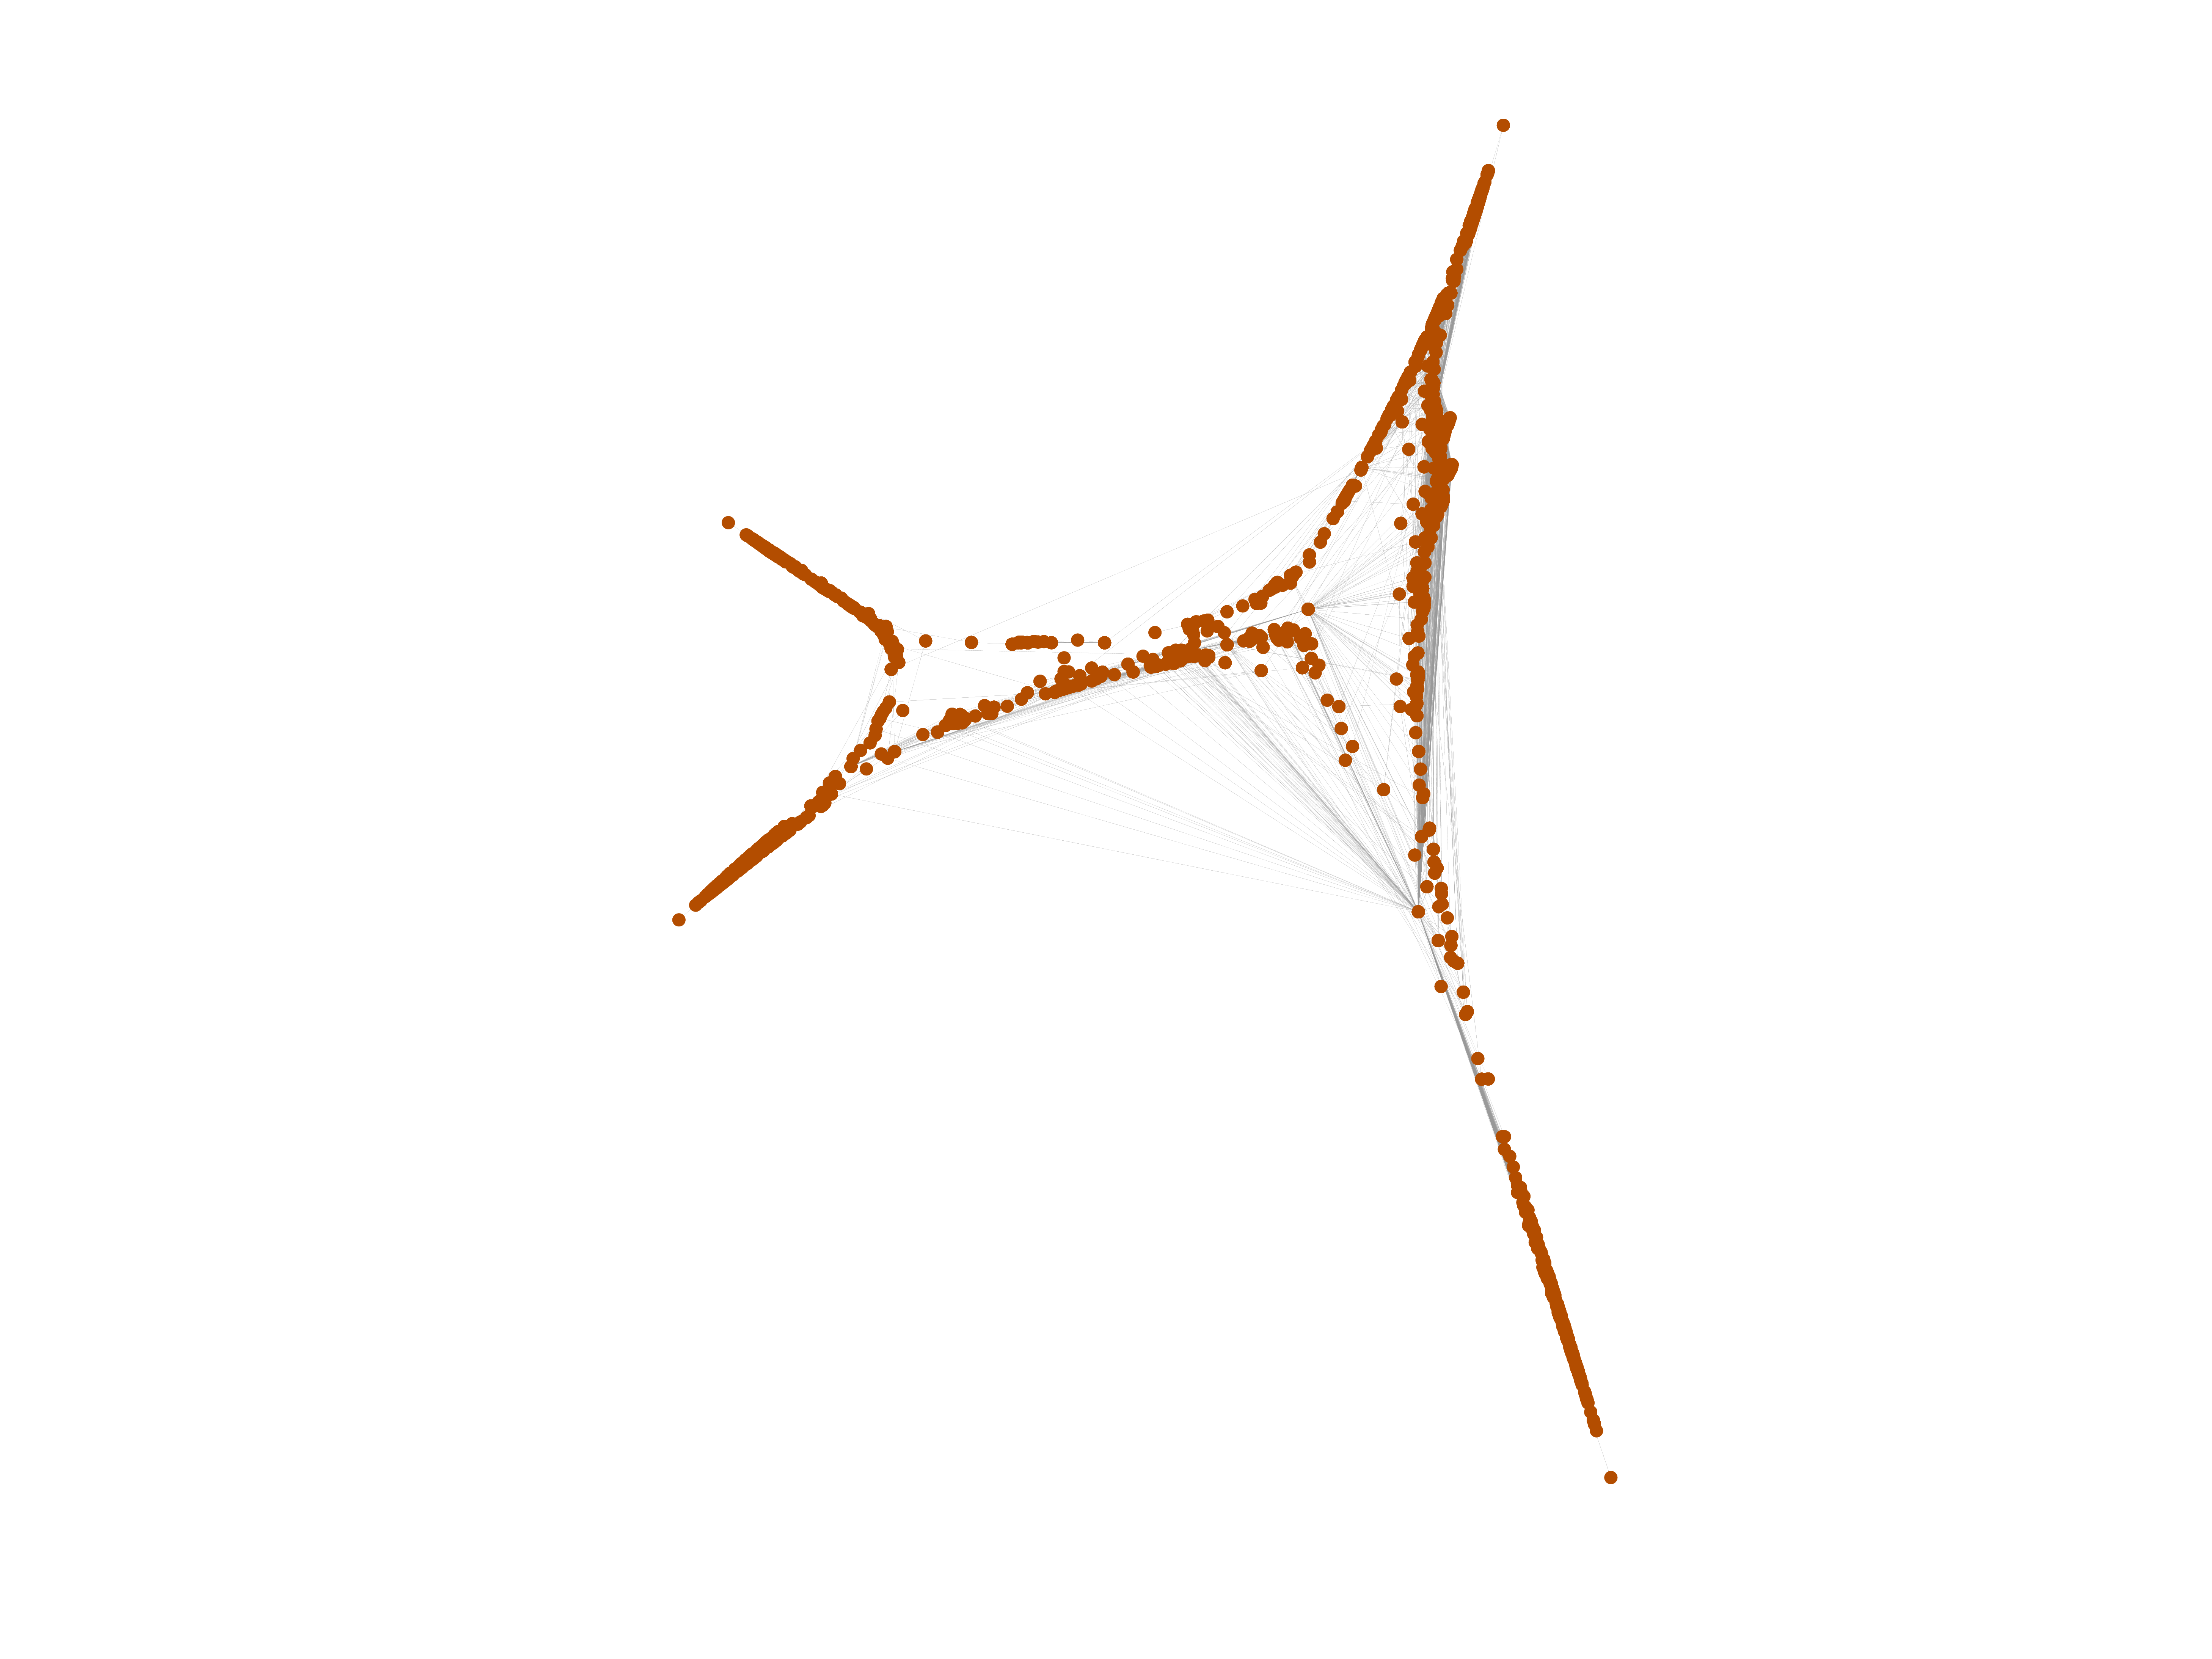
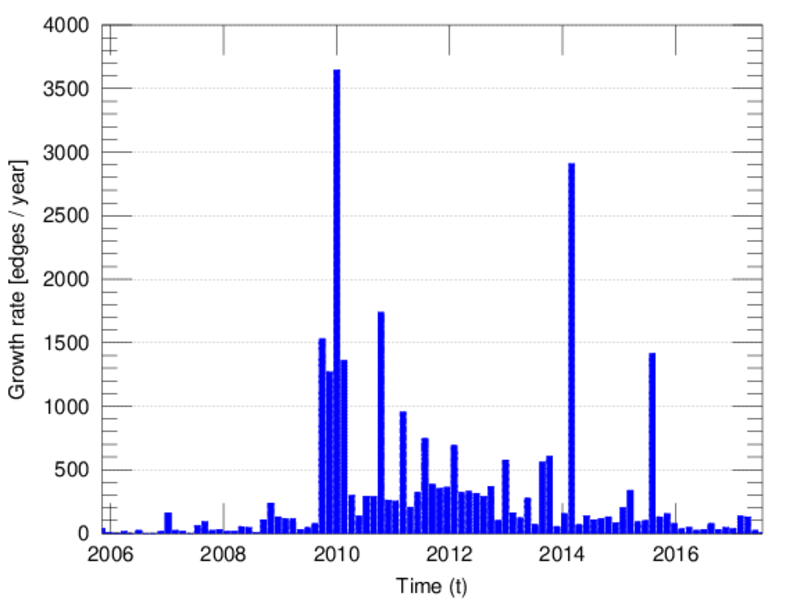
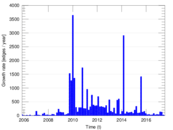
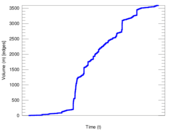
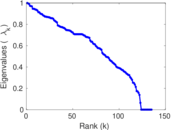
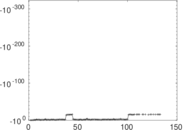
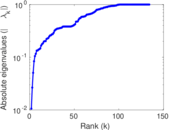
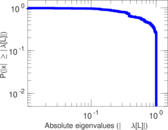
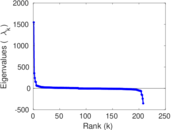
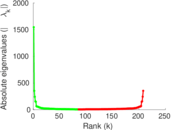
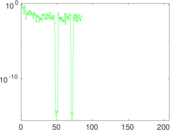
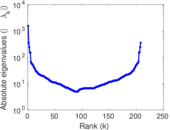
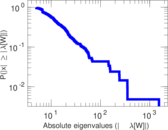
Plots


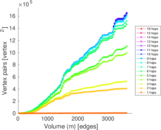
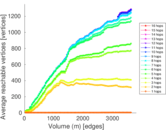

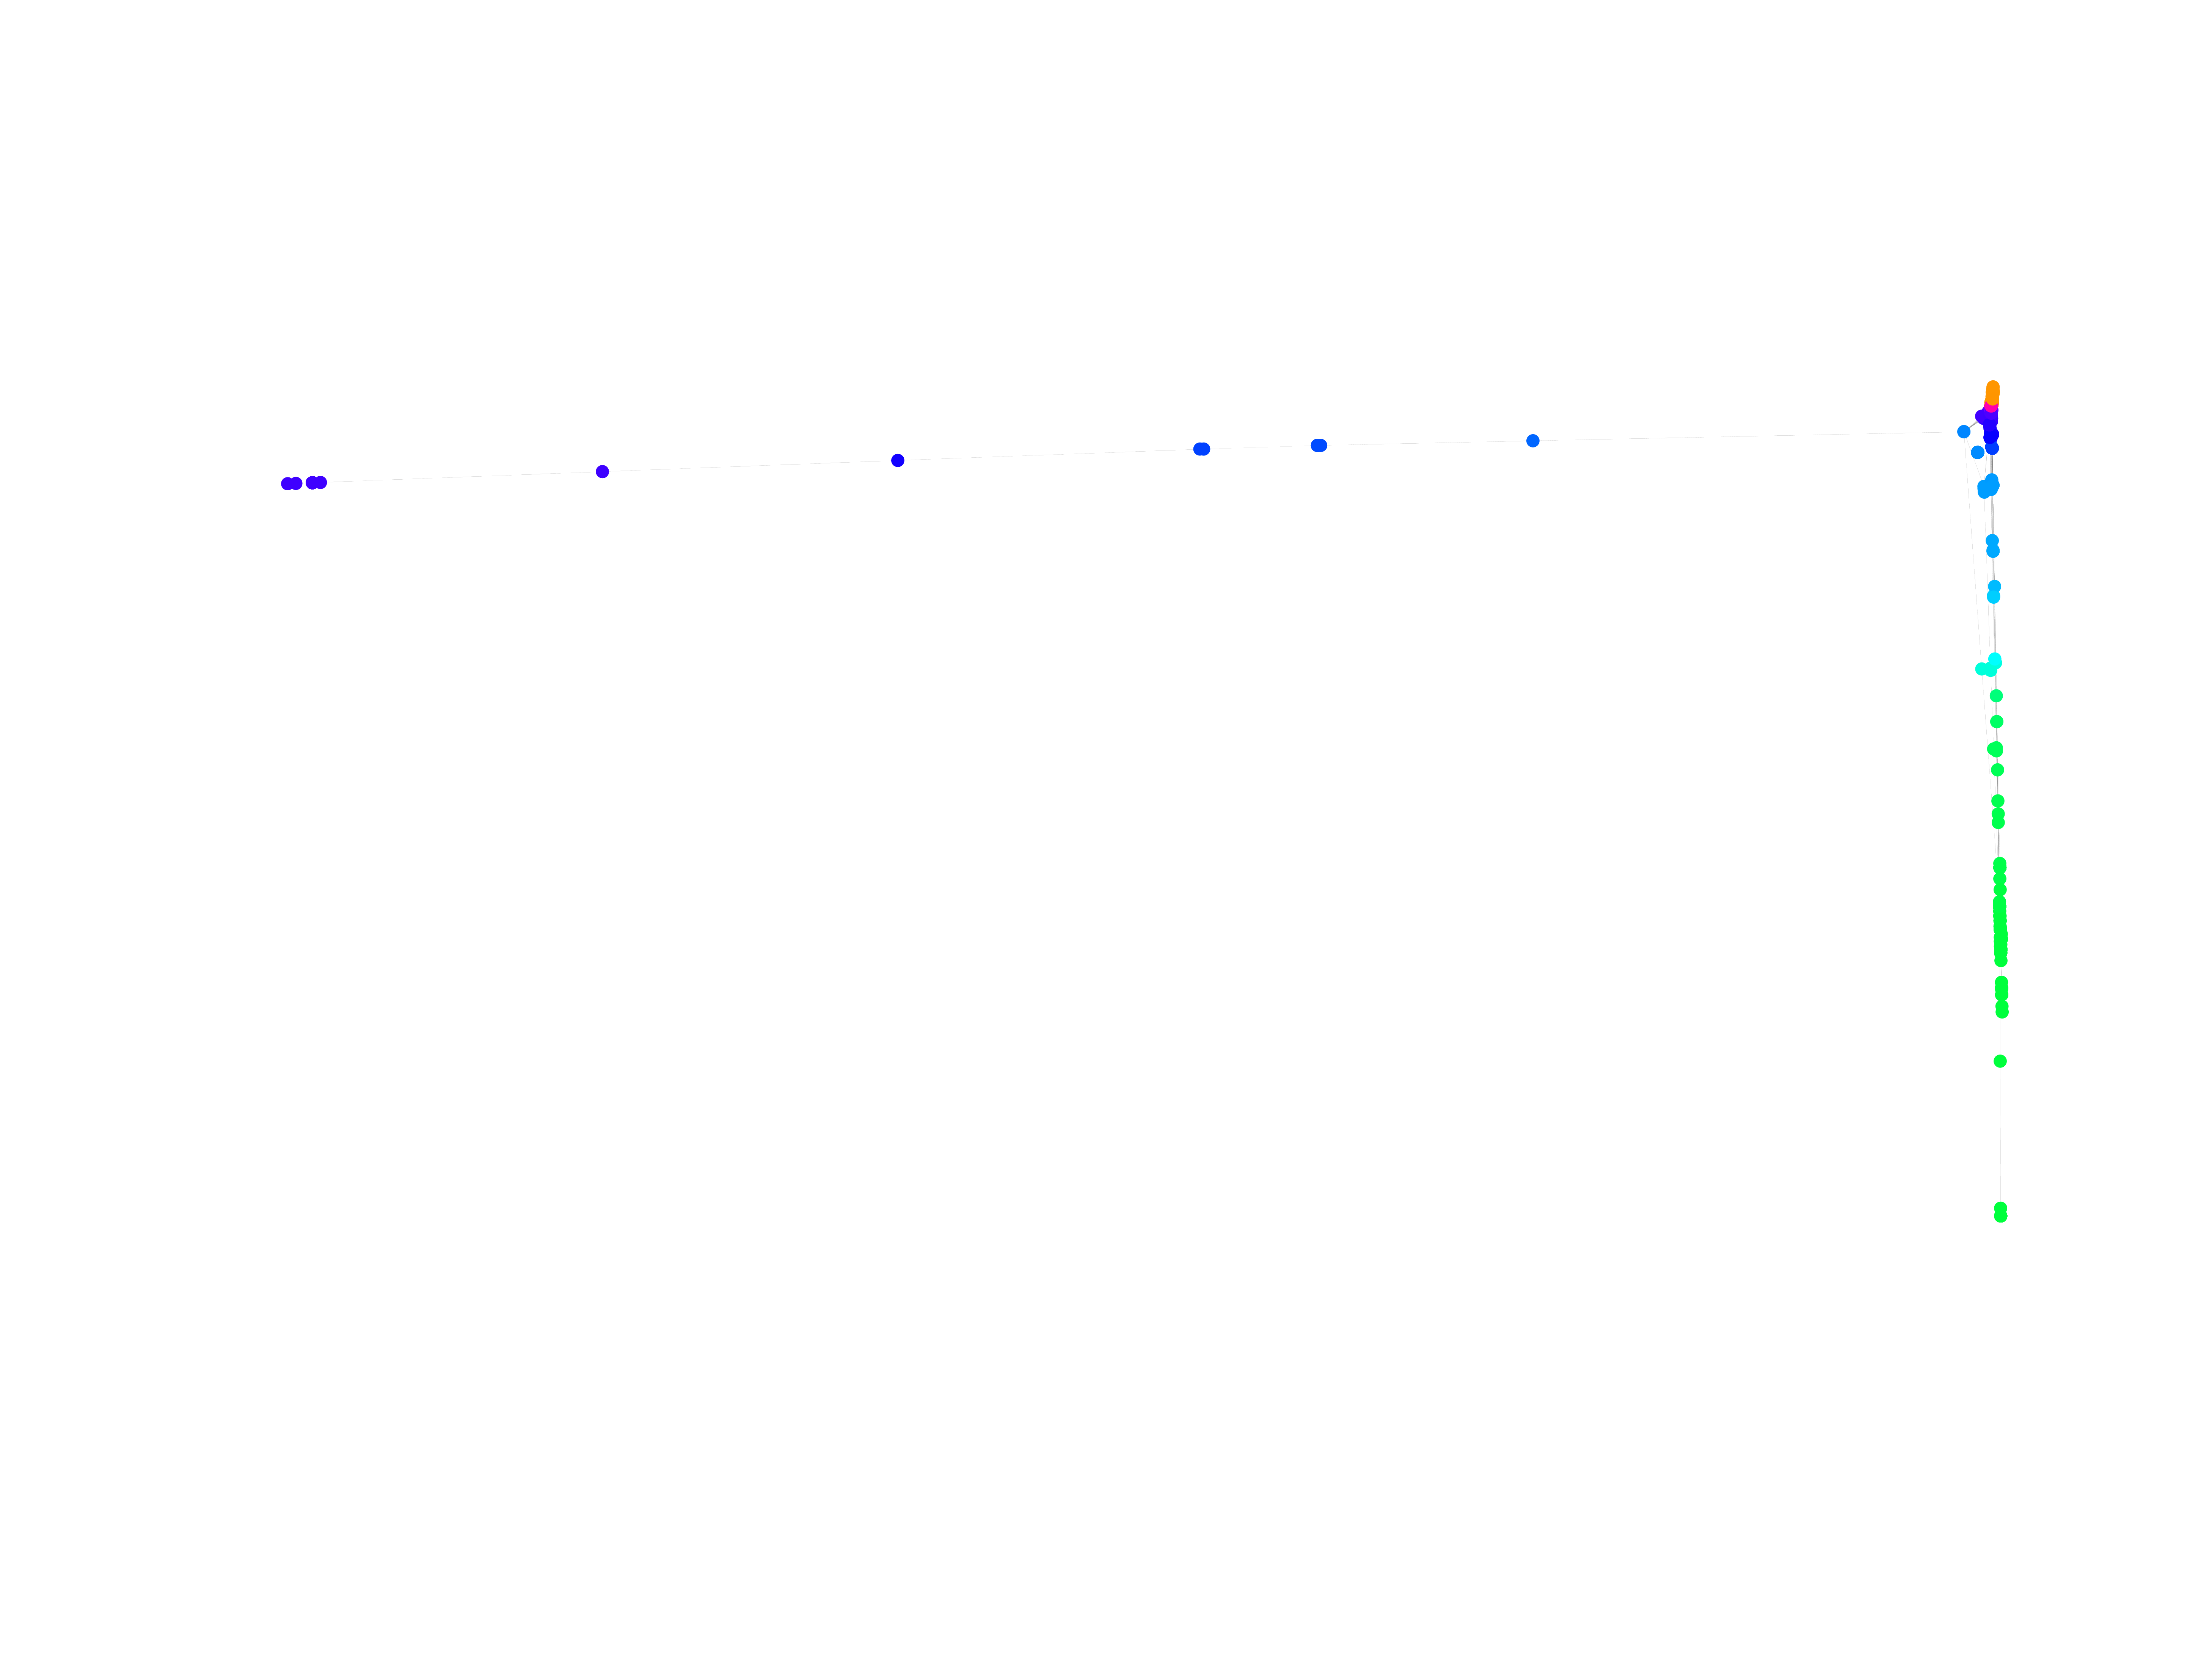
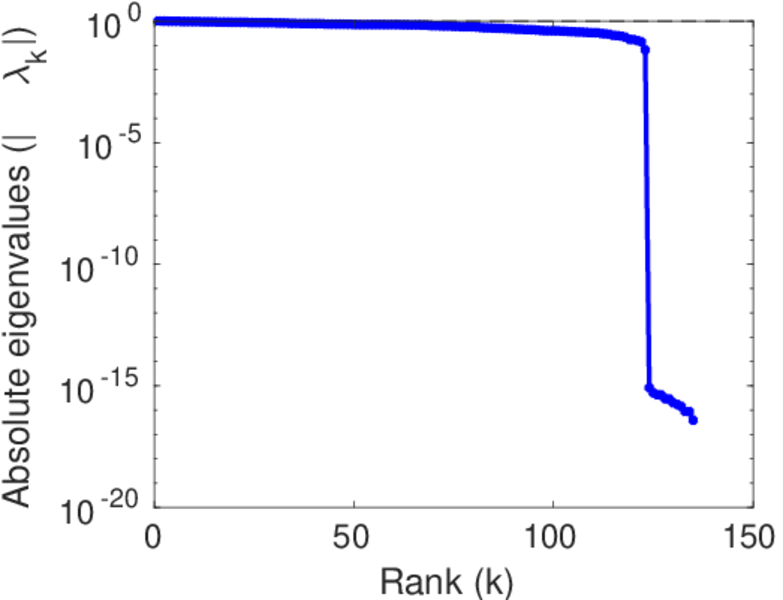
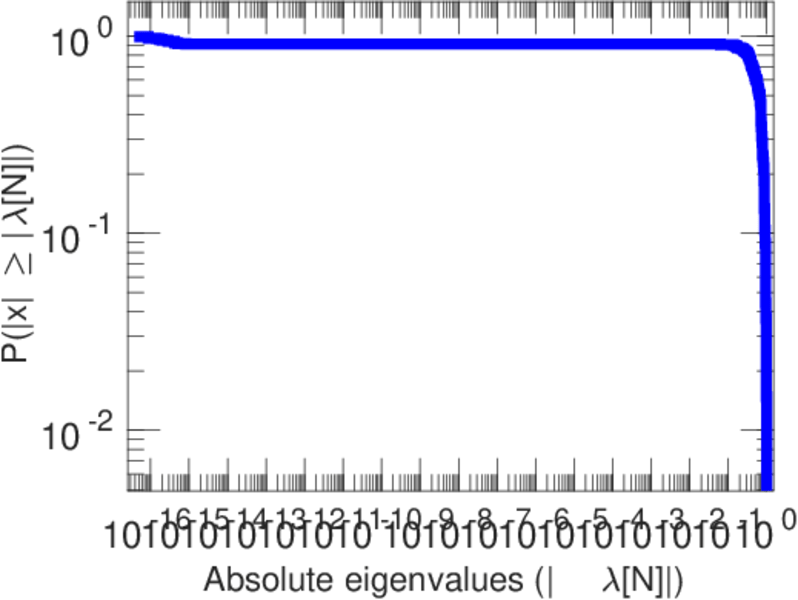
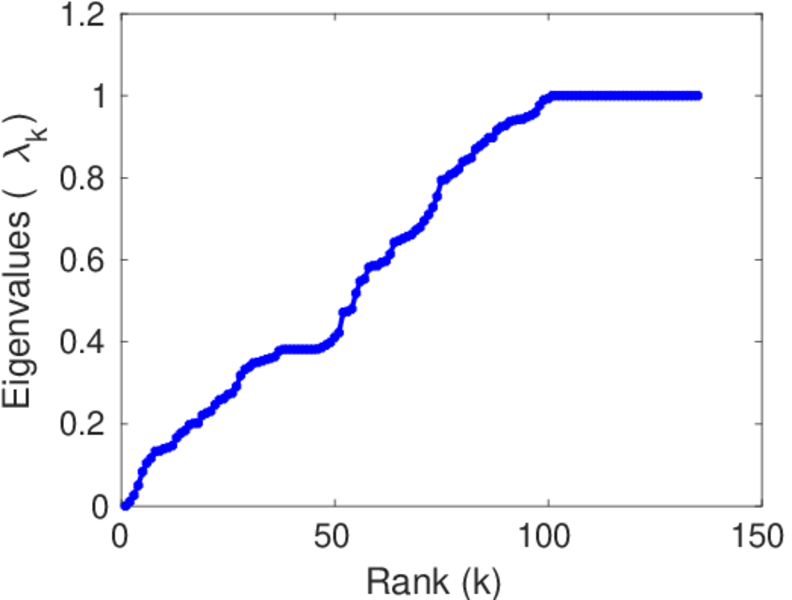
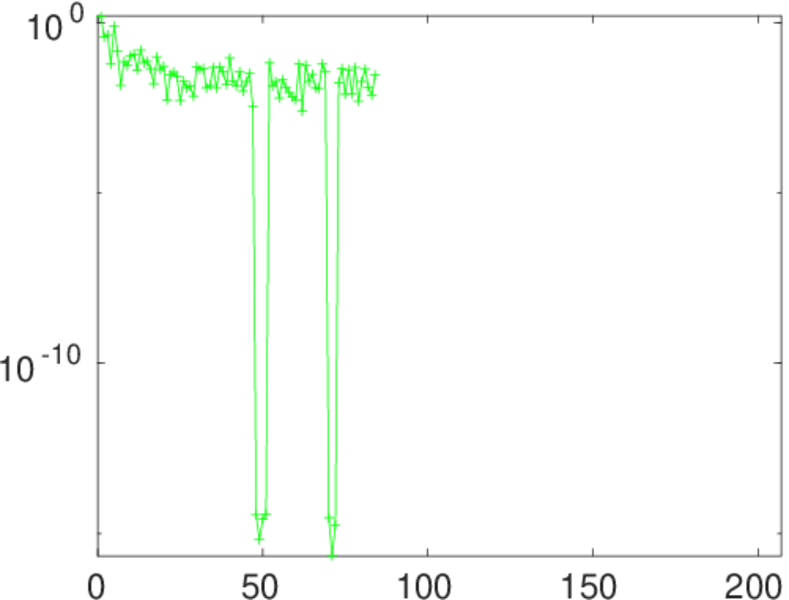
Matrix decompositions plots


Downloads
References
|
[1]
|
Jérôme Kunegis.
KONECT – The Koblenz Network Collection.
In Proc. Int. Conf. on World Wide Web Companion, pages
1343–1350, 2013.
[ http ]
|
|
[2]
|
Wikimedia Foundation.
Wikimedia downloads.
http://dumps.wikimedia.org/, January 2010.
|
 KONECT ‣ Networks ‣
Buy Me a Coffee
KONECT ‣ Networks ‣
Buy Me a Coffee