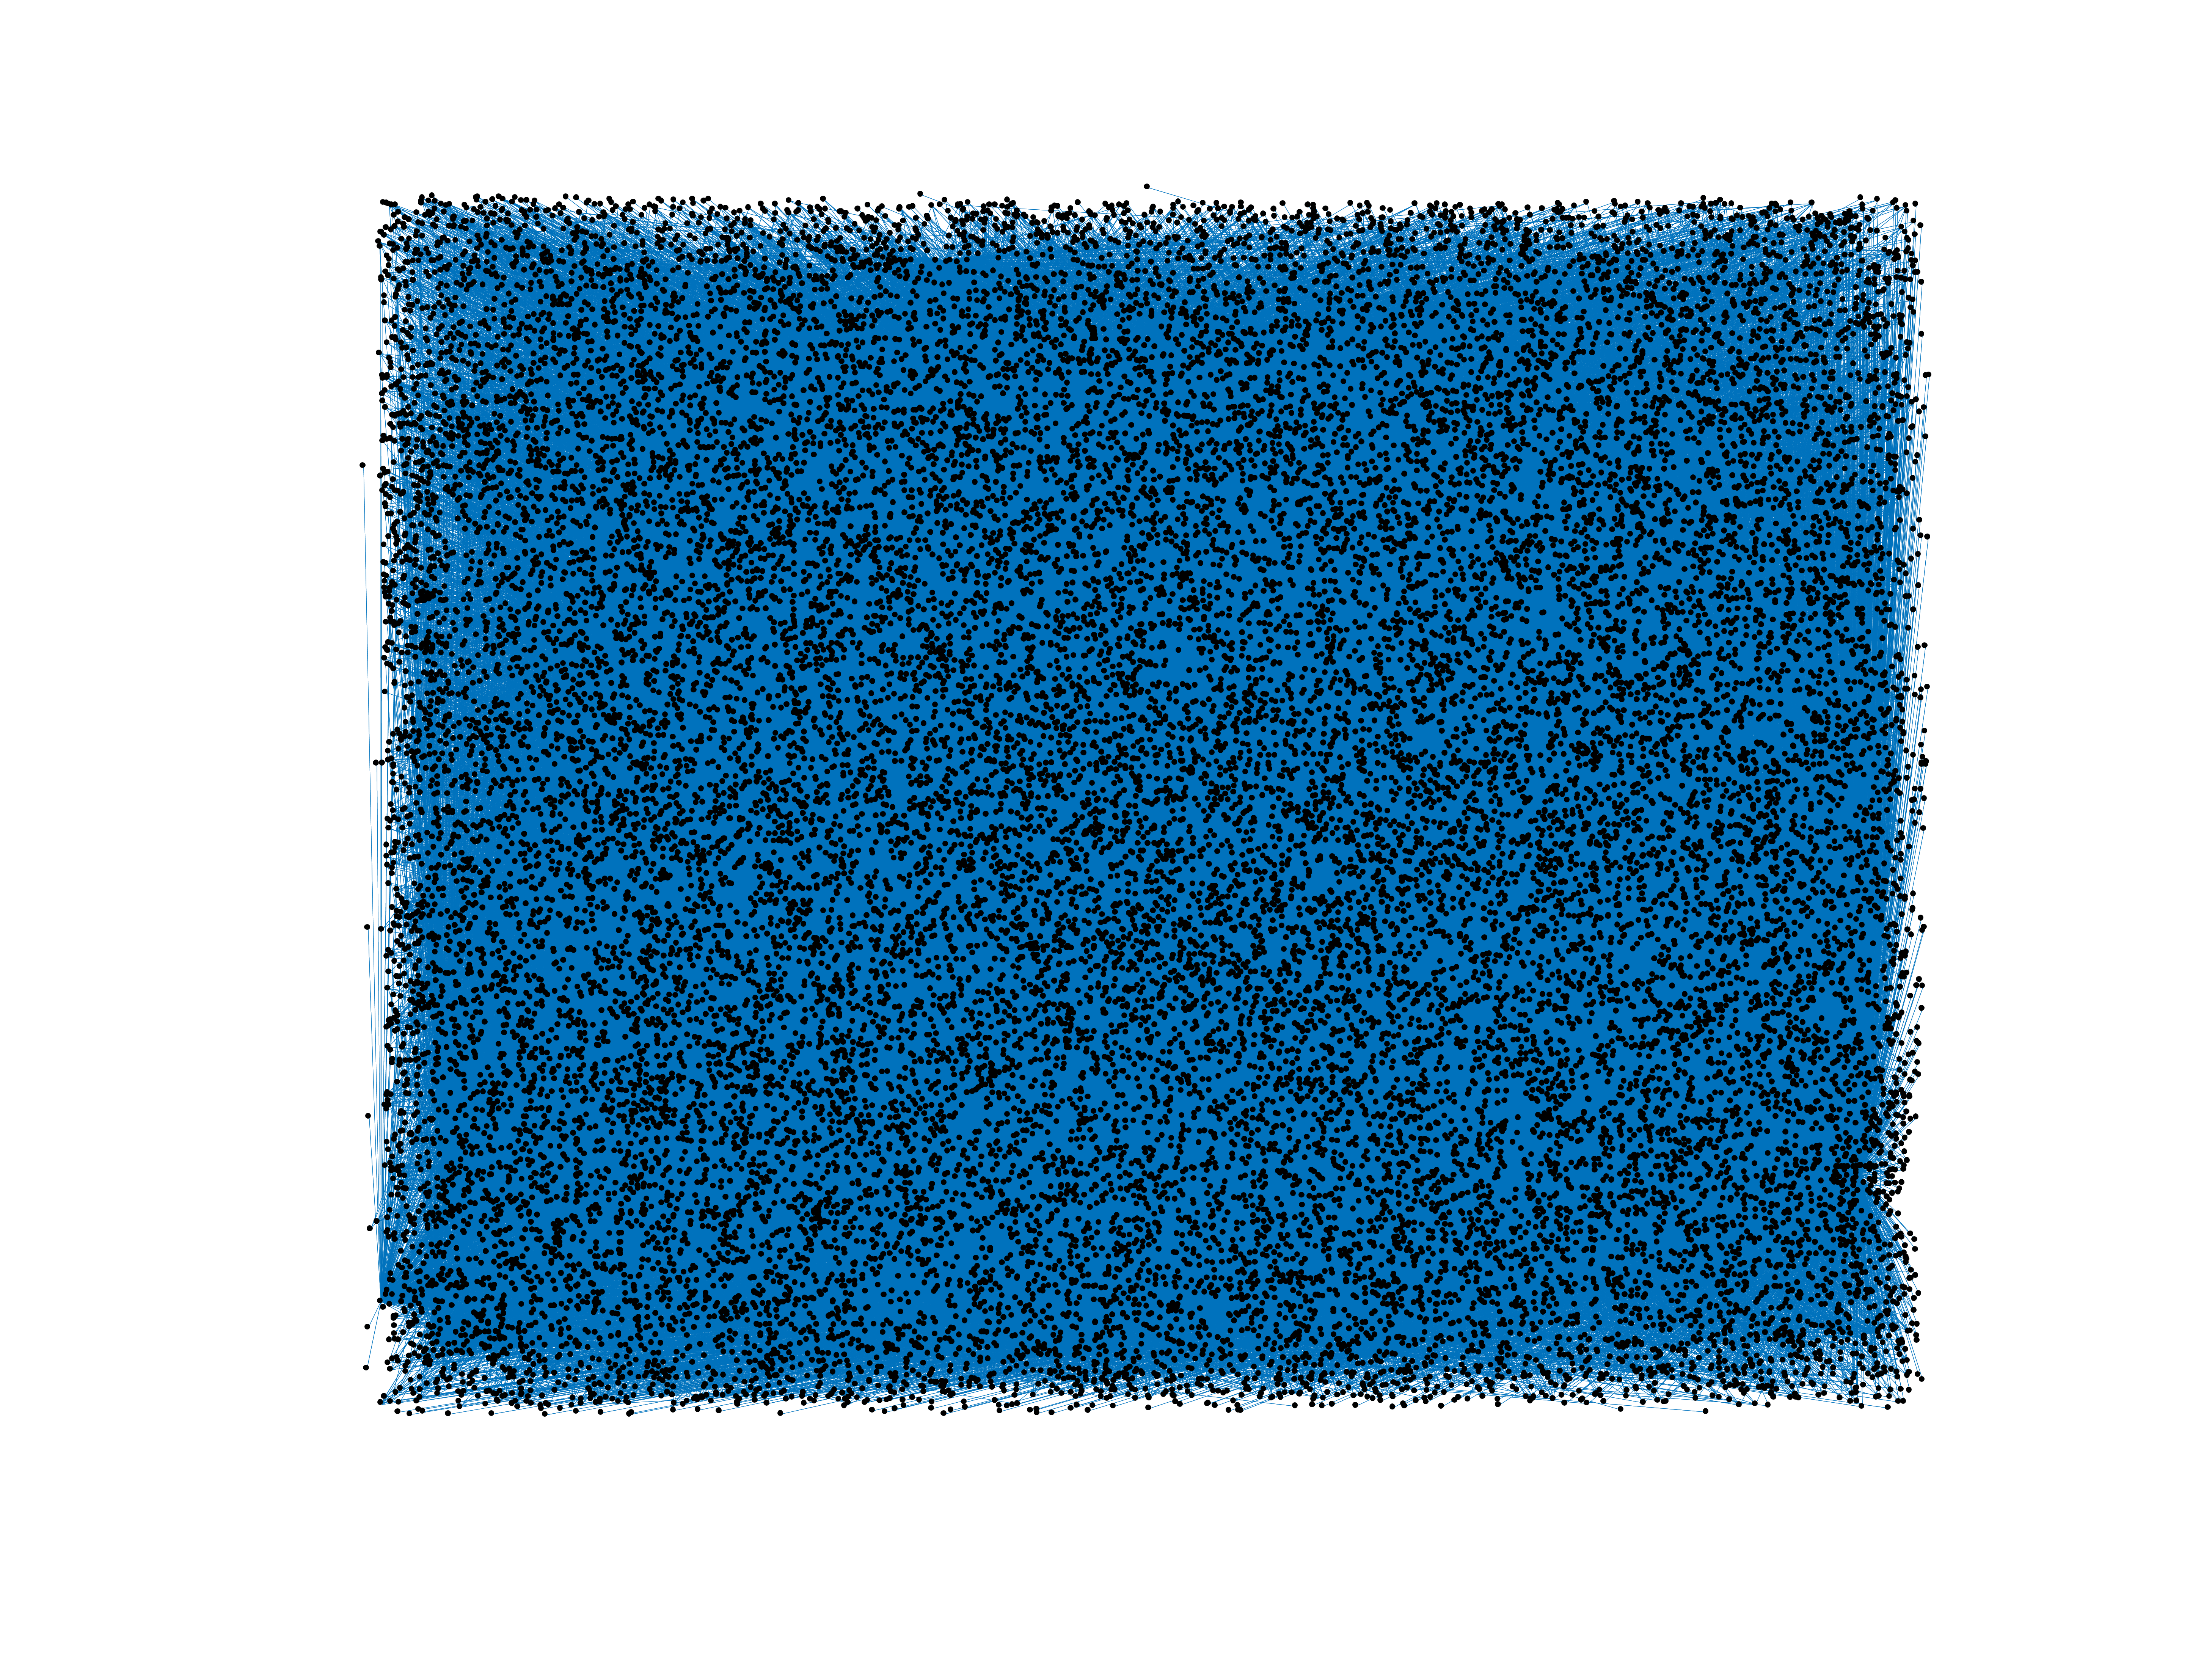
Wiktionary edits (cy)
This is the bipartite edit network of the Welsh Wiktionary. It contains users
and pages from the Welsh Wiktionary, connected by edit events. Each edge
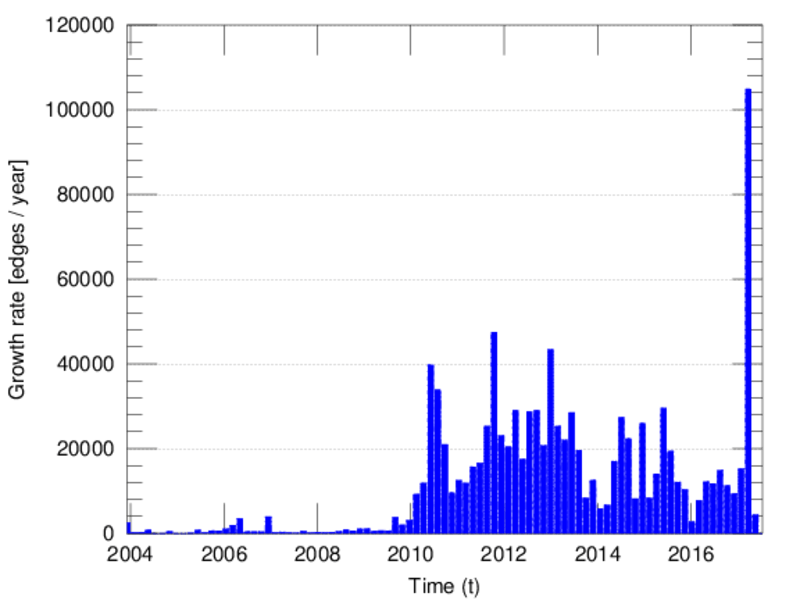
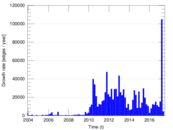
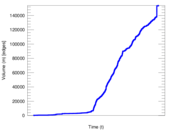
represents an edit. The dataset includes the timestamp of each edit.
Metadata
Statistics
| Size | n = | 27,506
|
| Left size | n1 = | 332
|
| Right size | n2 = | 27,174
|
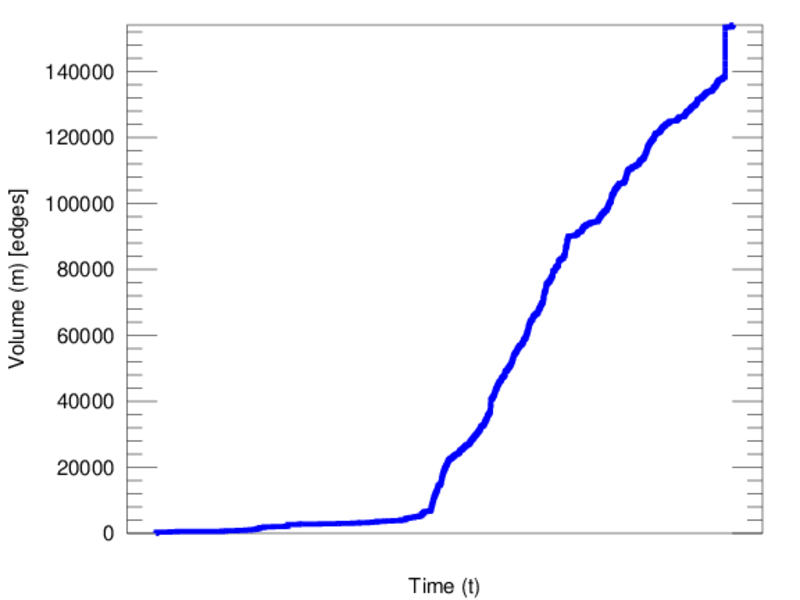
| Volume | m = | 154,093
|
| Unique edge count | m̿ = | 81,170
|
| Wedge count | s = | 492,324,809
|
| Claw count | z = | 3,122,079,134,932
|
| Cross count | x = | 17,016,297,381,354,070
|
| Square count | q = | 286,003,854
|
| 4-Tour count | T4 = | 4,257,494,288
|
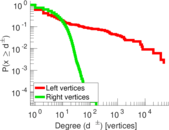
| Maximum degree | dmax = | 48,019
|
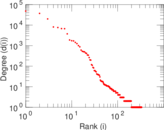
| Maximum left degree | d1max = | 48,019
|
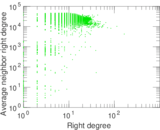
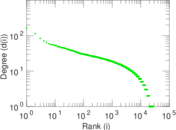
| Maximum right degree | d2max = | 166
|
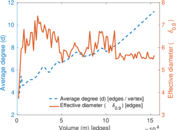
| Average degree | d = | 11.204 3
|
| Average left degree | d1 = | 464.136
|
| Average right degree | d2 = | 5.670 60
|
| Fill | p = | 0.008 997 13
|
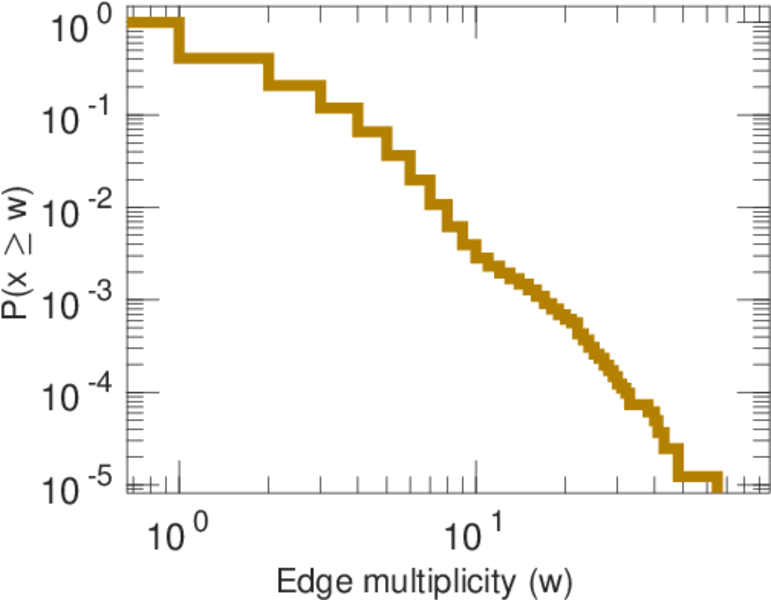
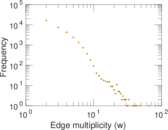
| Average edge multiplicity | m̃ = | 1.898 40
|
| Size of LCC | N = | 27,216
|
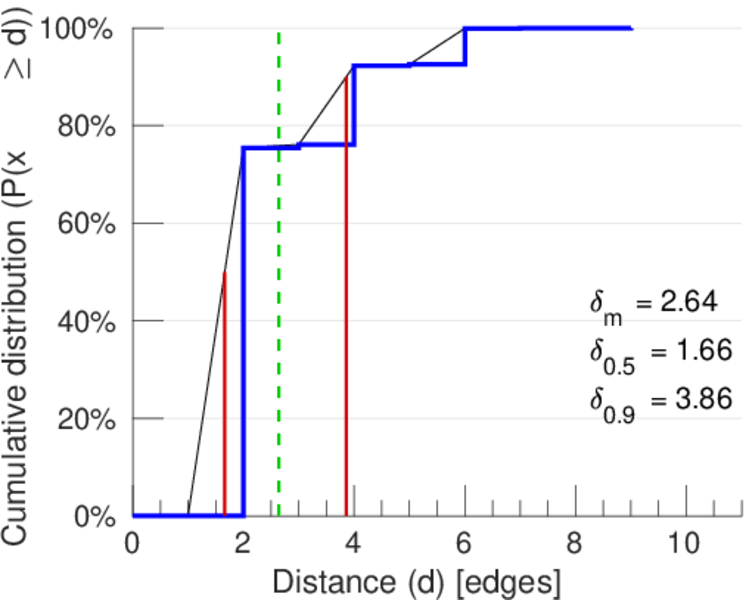
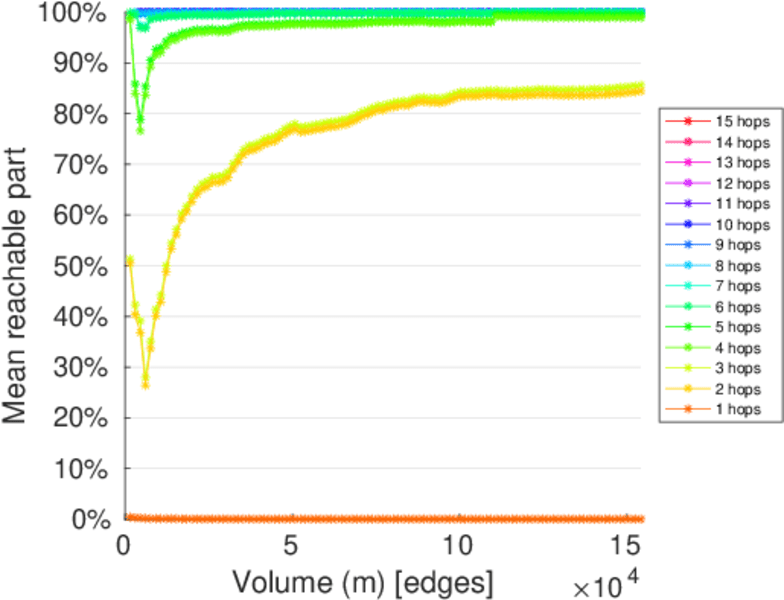
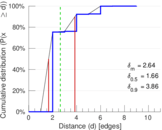
| Diameter | δ = | 12
|
| 50-Percentile effective diameter | δ0.5 = | 1.662 84
|
| 90-Percentile effective diameter | δ0.9 = | 3.859 30
|
| Median distance | δM = | 2
|
| Mean distance | δm = | 2.637 55
|
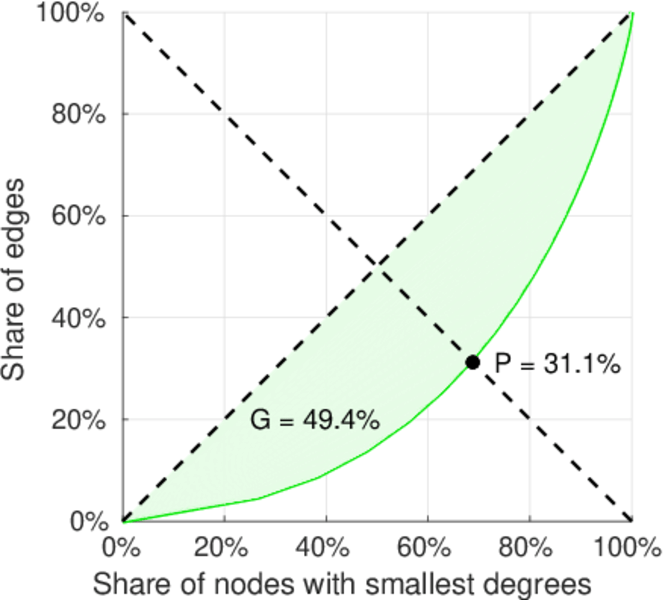
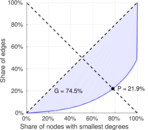
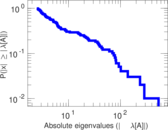
| Gini coefficient | G = | 0.743 042
|
| Balanced inequality ratio | P = | 0.221 000
|
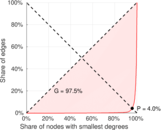
| Left balanced inequality ratio | P1 = | 0.040 138 1
|
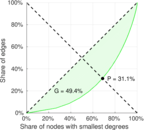
| Right balanced inequality ratio | P2 = | 0.310 579
|
| Relative edge distribution entropy | Her = | 0.674 441
|
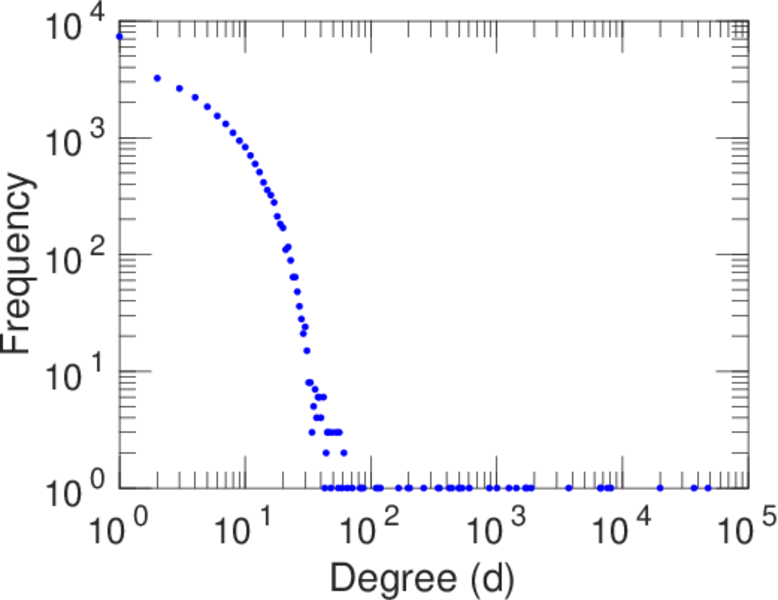
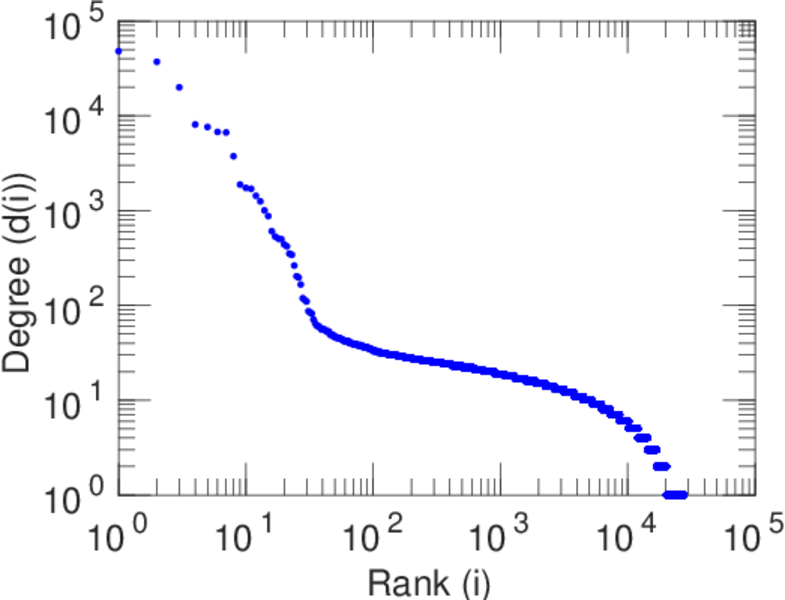
| Power law exponent | γ = | 2.218 90
|
| Tail power law exponent | γt = | 4.391 00
|
| Tail power law exponent with p | γ3 = | 4.391 00
|
| p-value | p = | 0.000 00
|
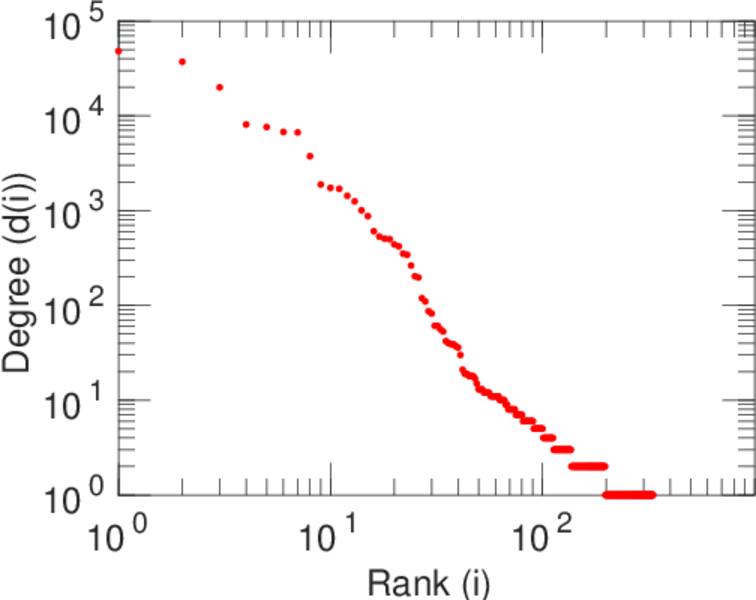
| Left tail power law exponent with p | γ3,1 = | 1.591 00
|
| Left p-value | p1 = | 0.000 00
|
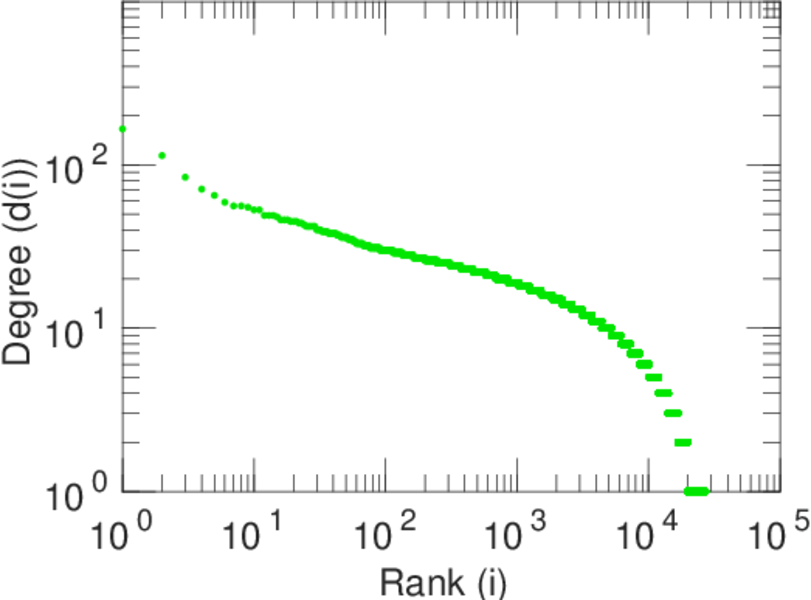
| Right tail power law exponent with p | γ3,2 = | 8.911 00
|
| Right p-value | p2 = | 0.076 000 0
|
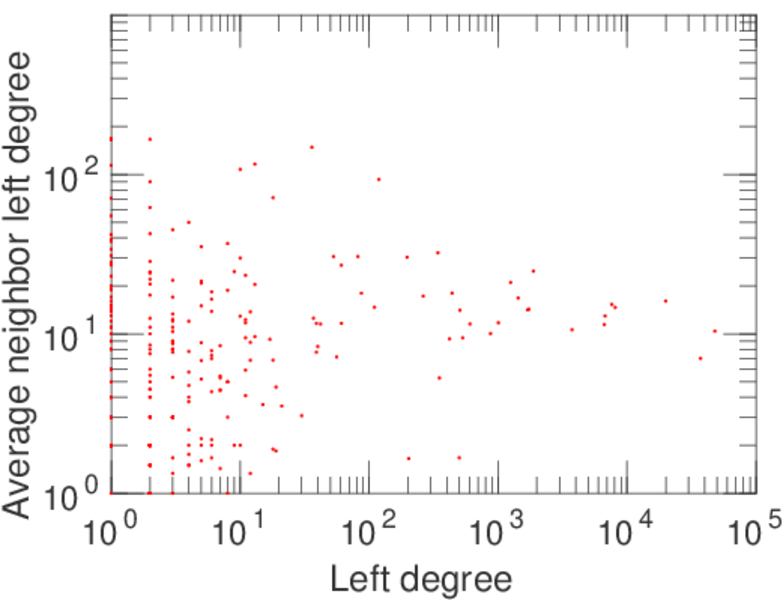
| Degree assortativity | ρ = | −0.462 201
|
| Degree assortativity p-value | pρ = | 0.000 00
|
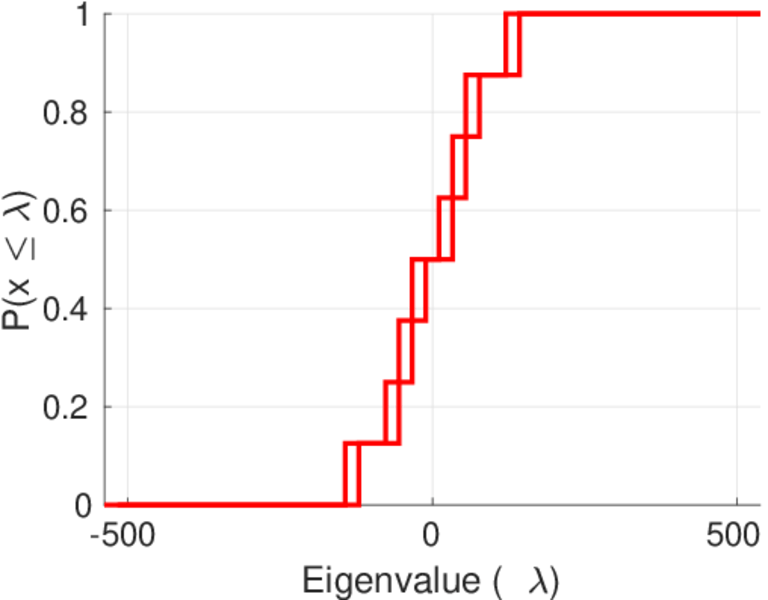
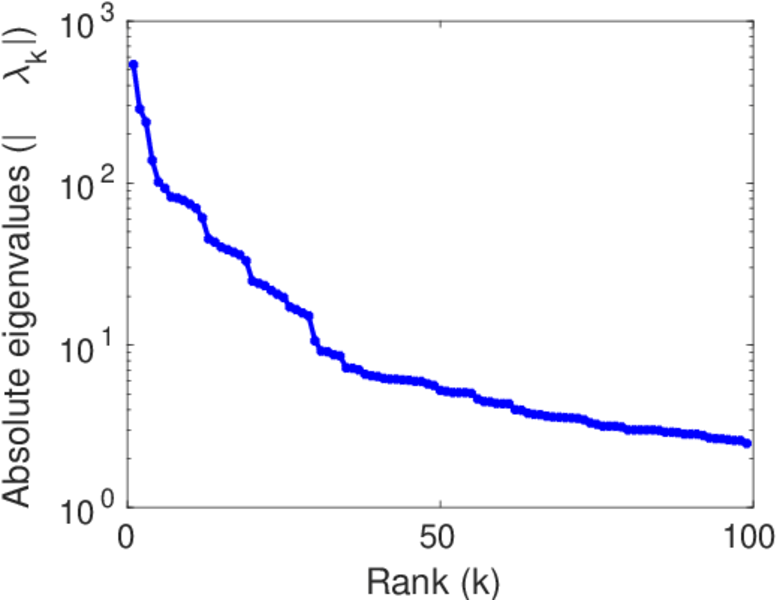
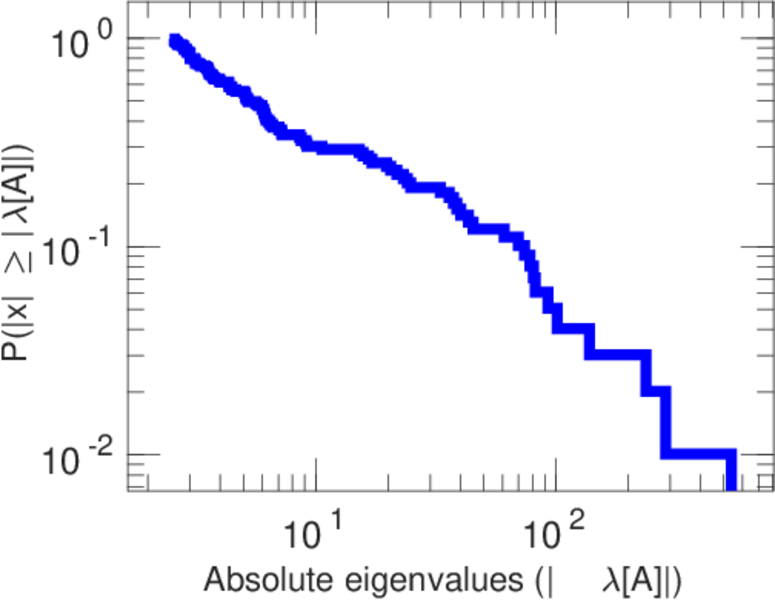
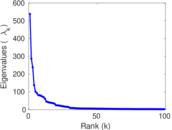
| Spectral norm | α = | 537.814
|
| Algebraic connectivity | a = | 0.013 672 1
|
| Spectral separation | |λ1[A] / λ2[A]| = | 1.876 69
|
| Controllability | C = | 26,837
|
| Relative controllability | Cr = | 0.976 850
|
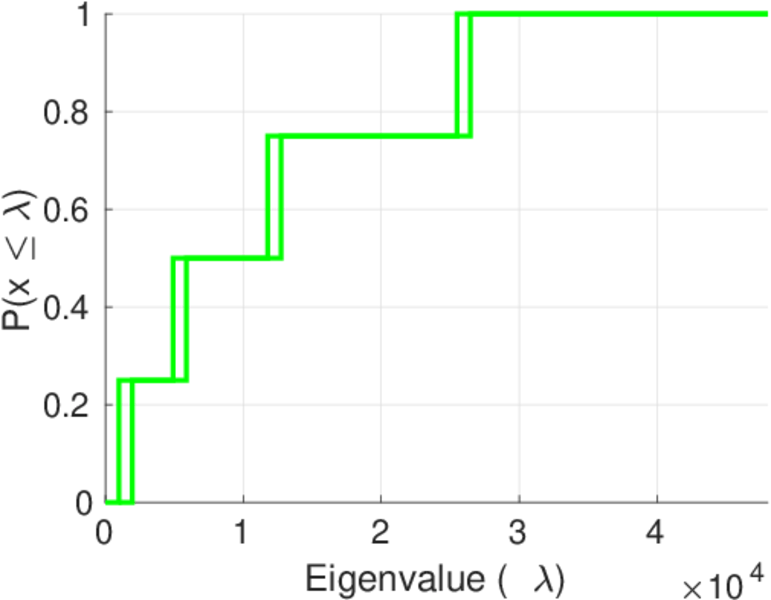
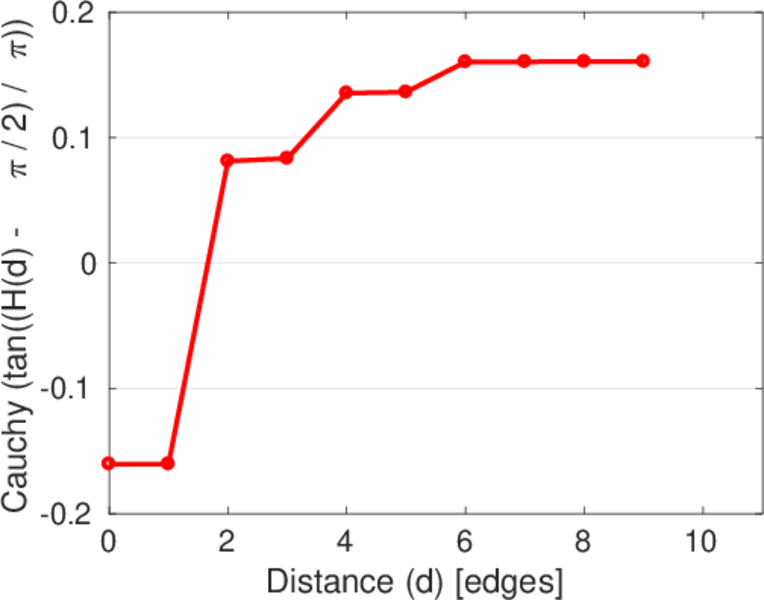
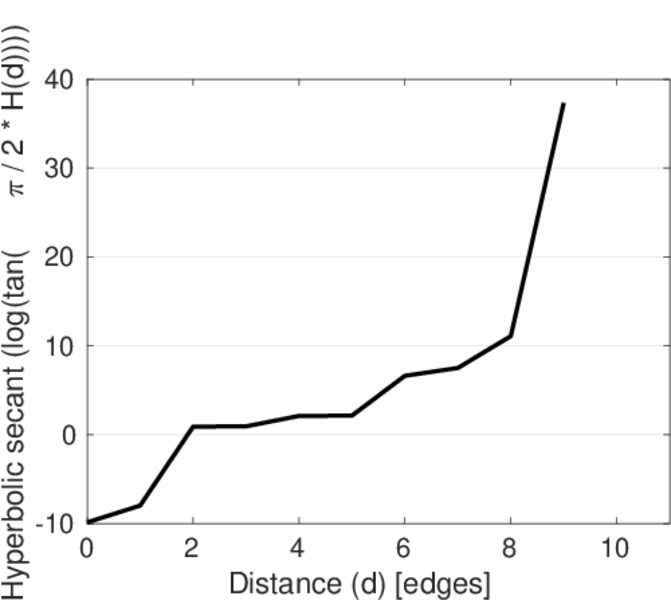
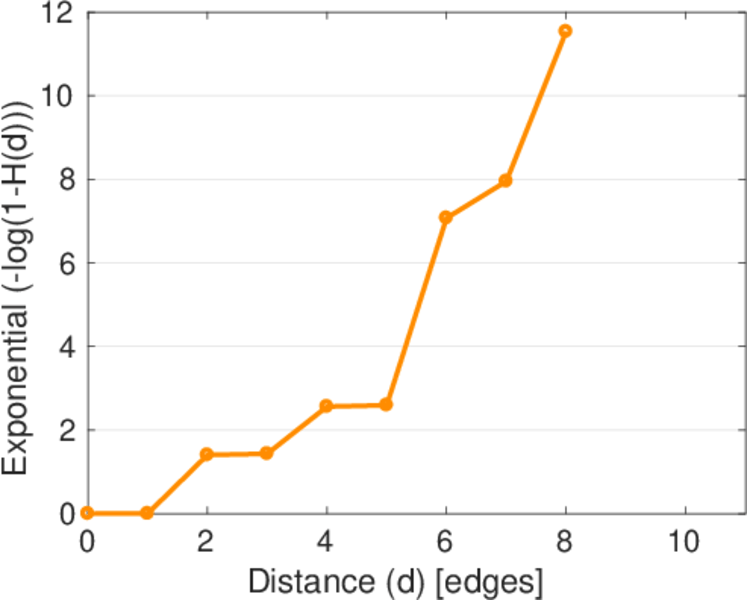
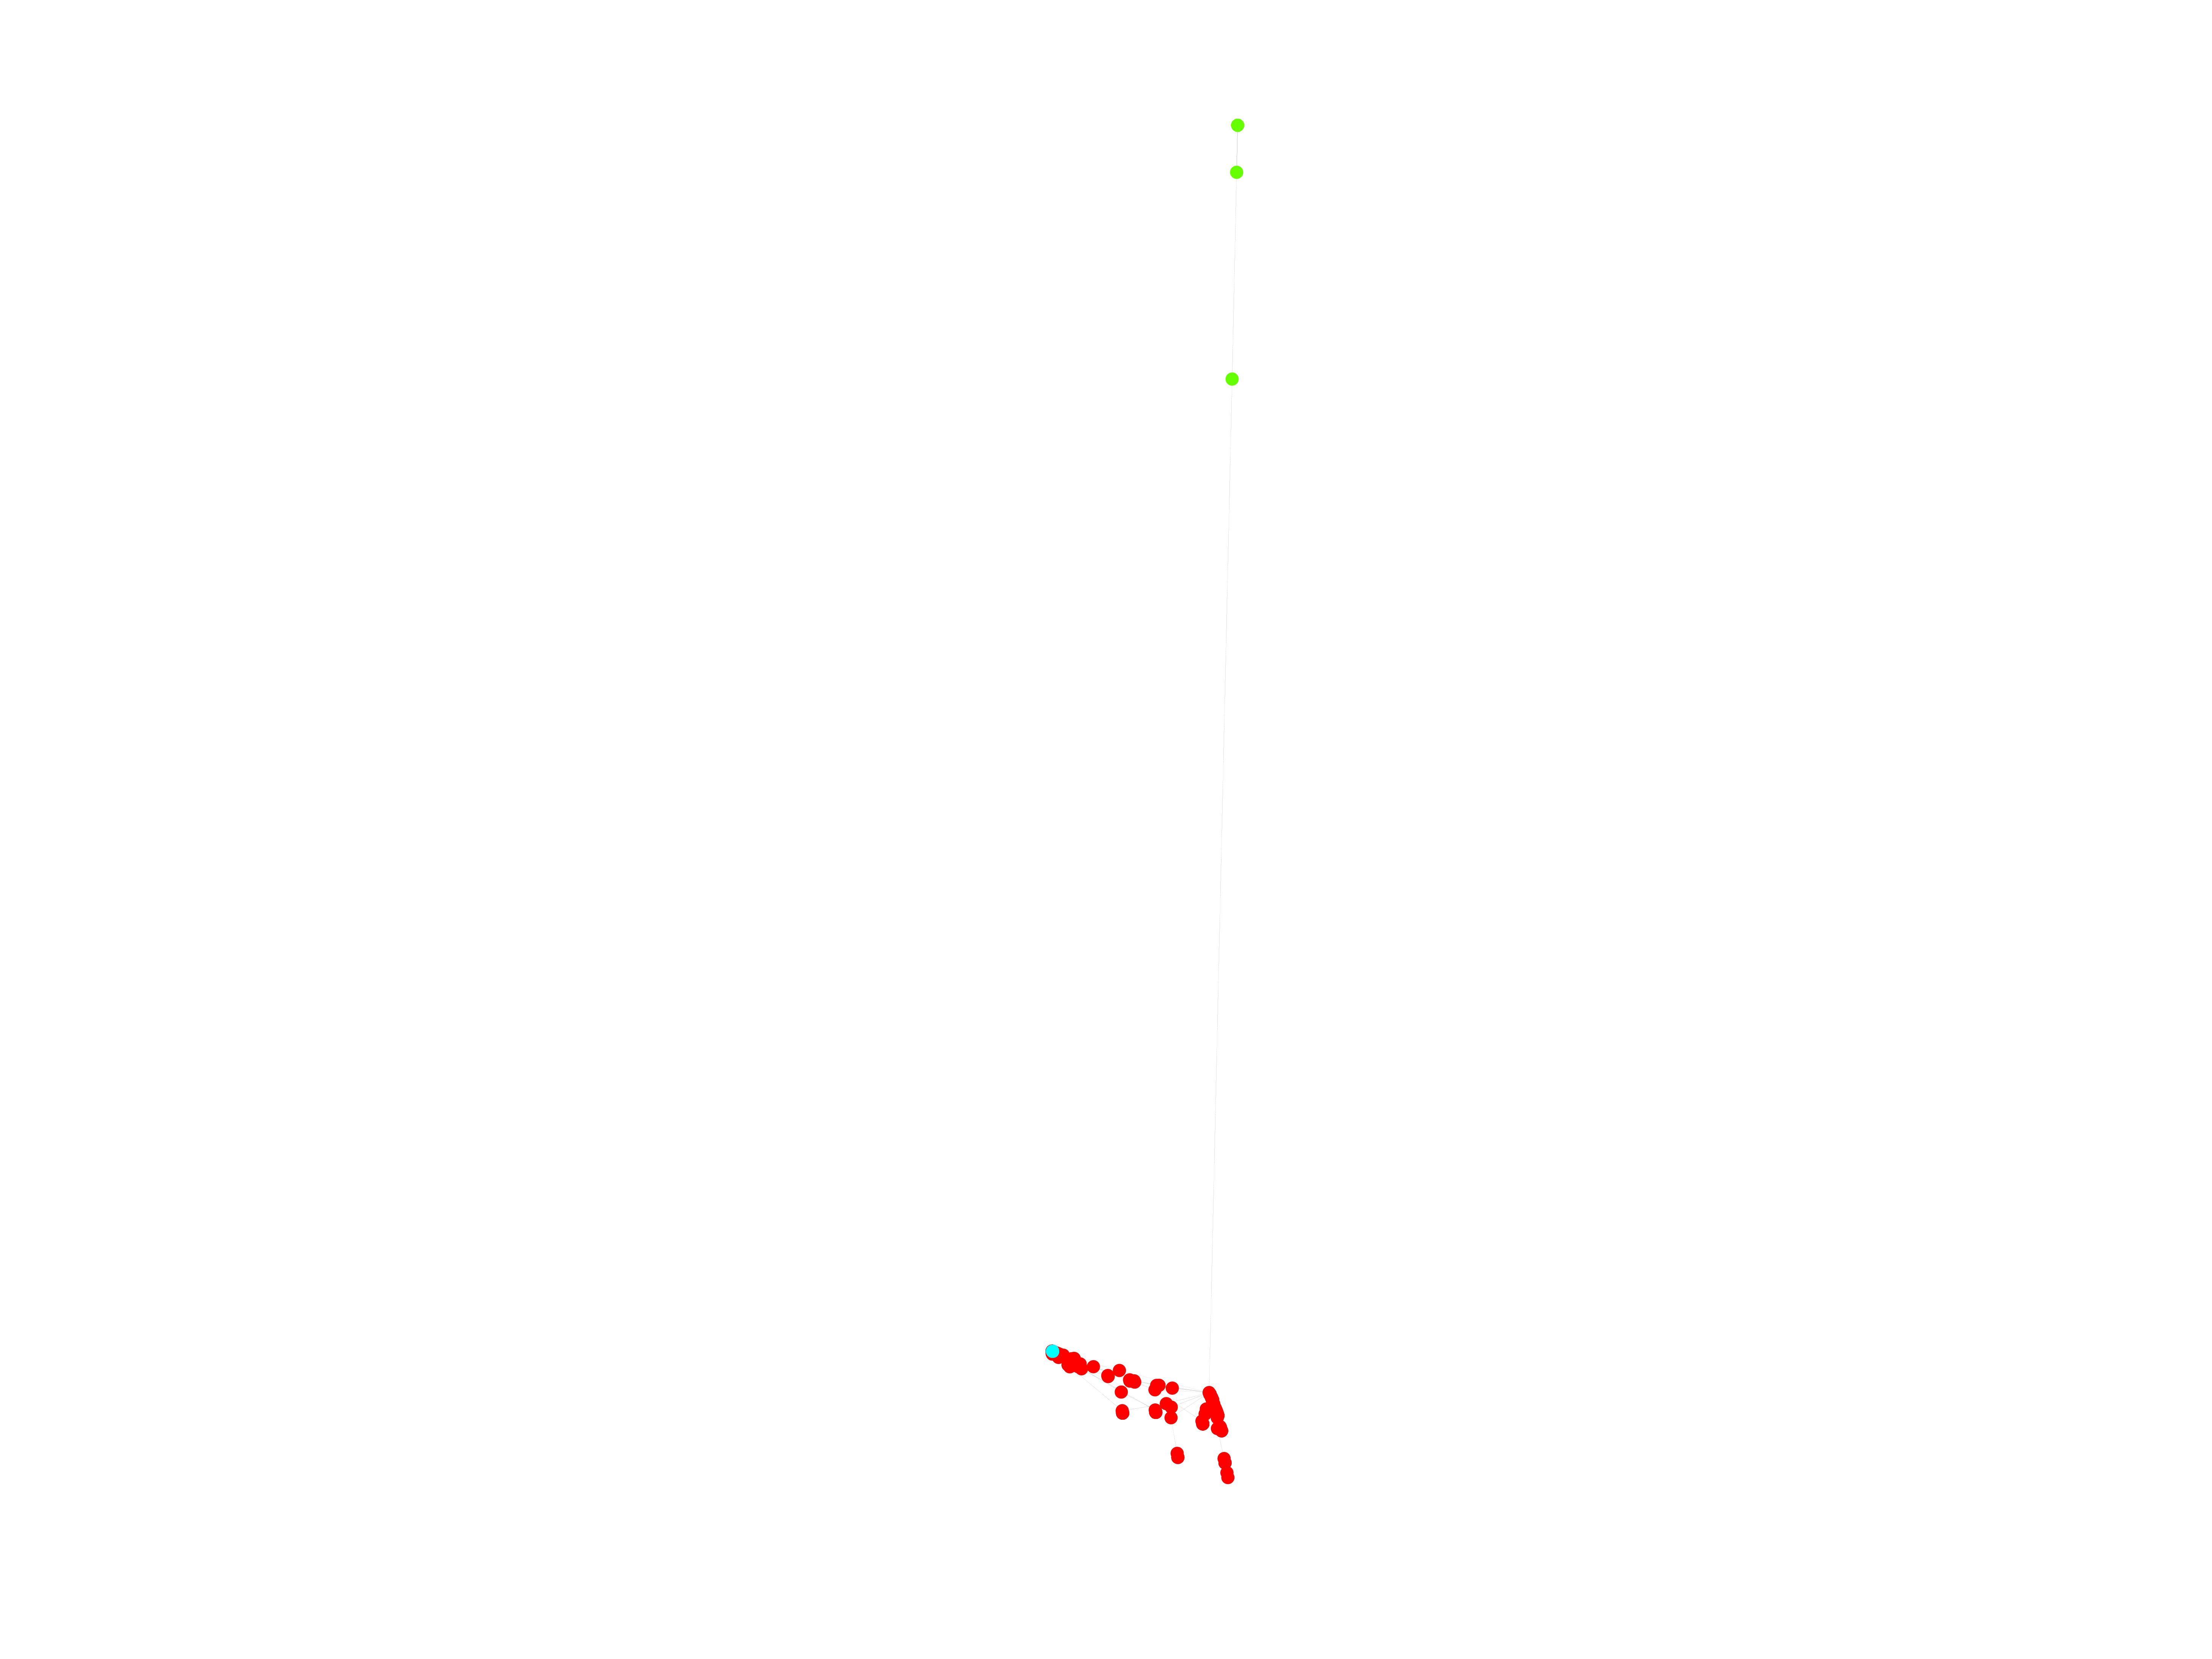
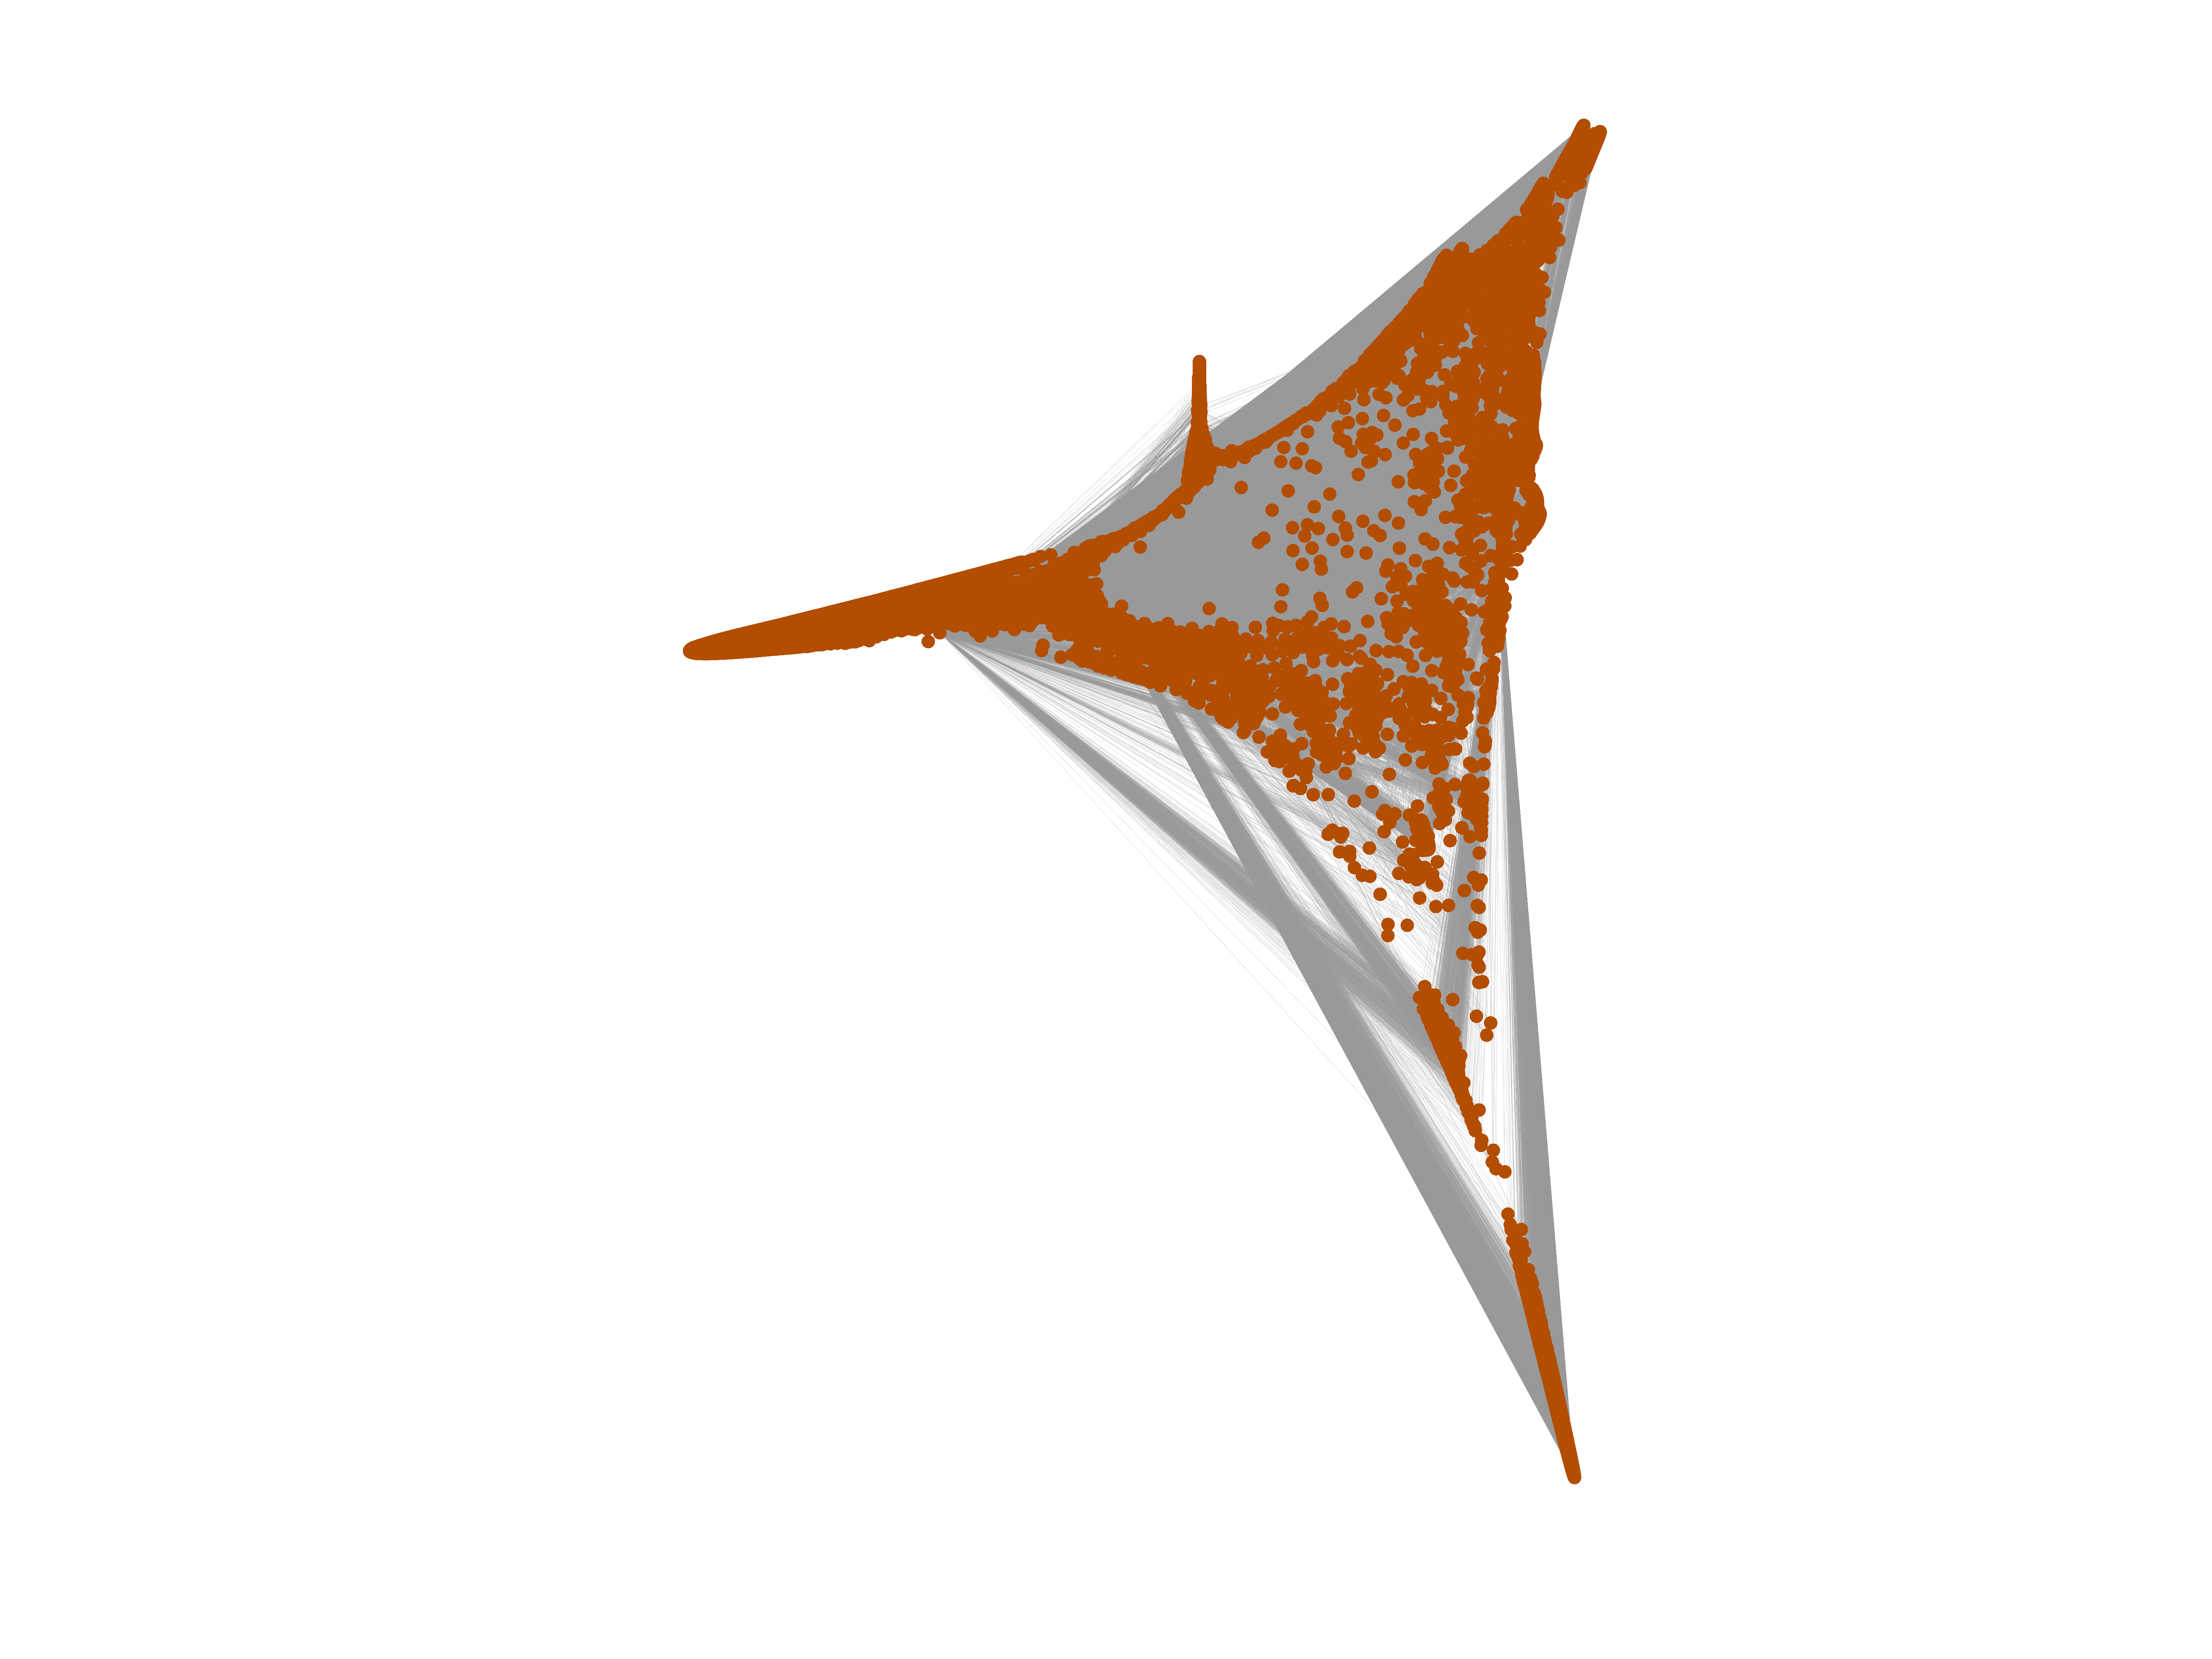
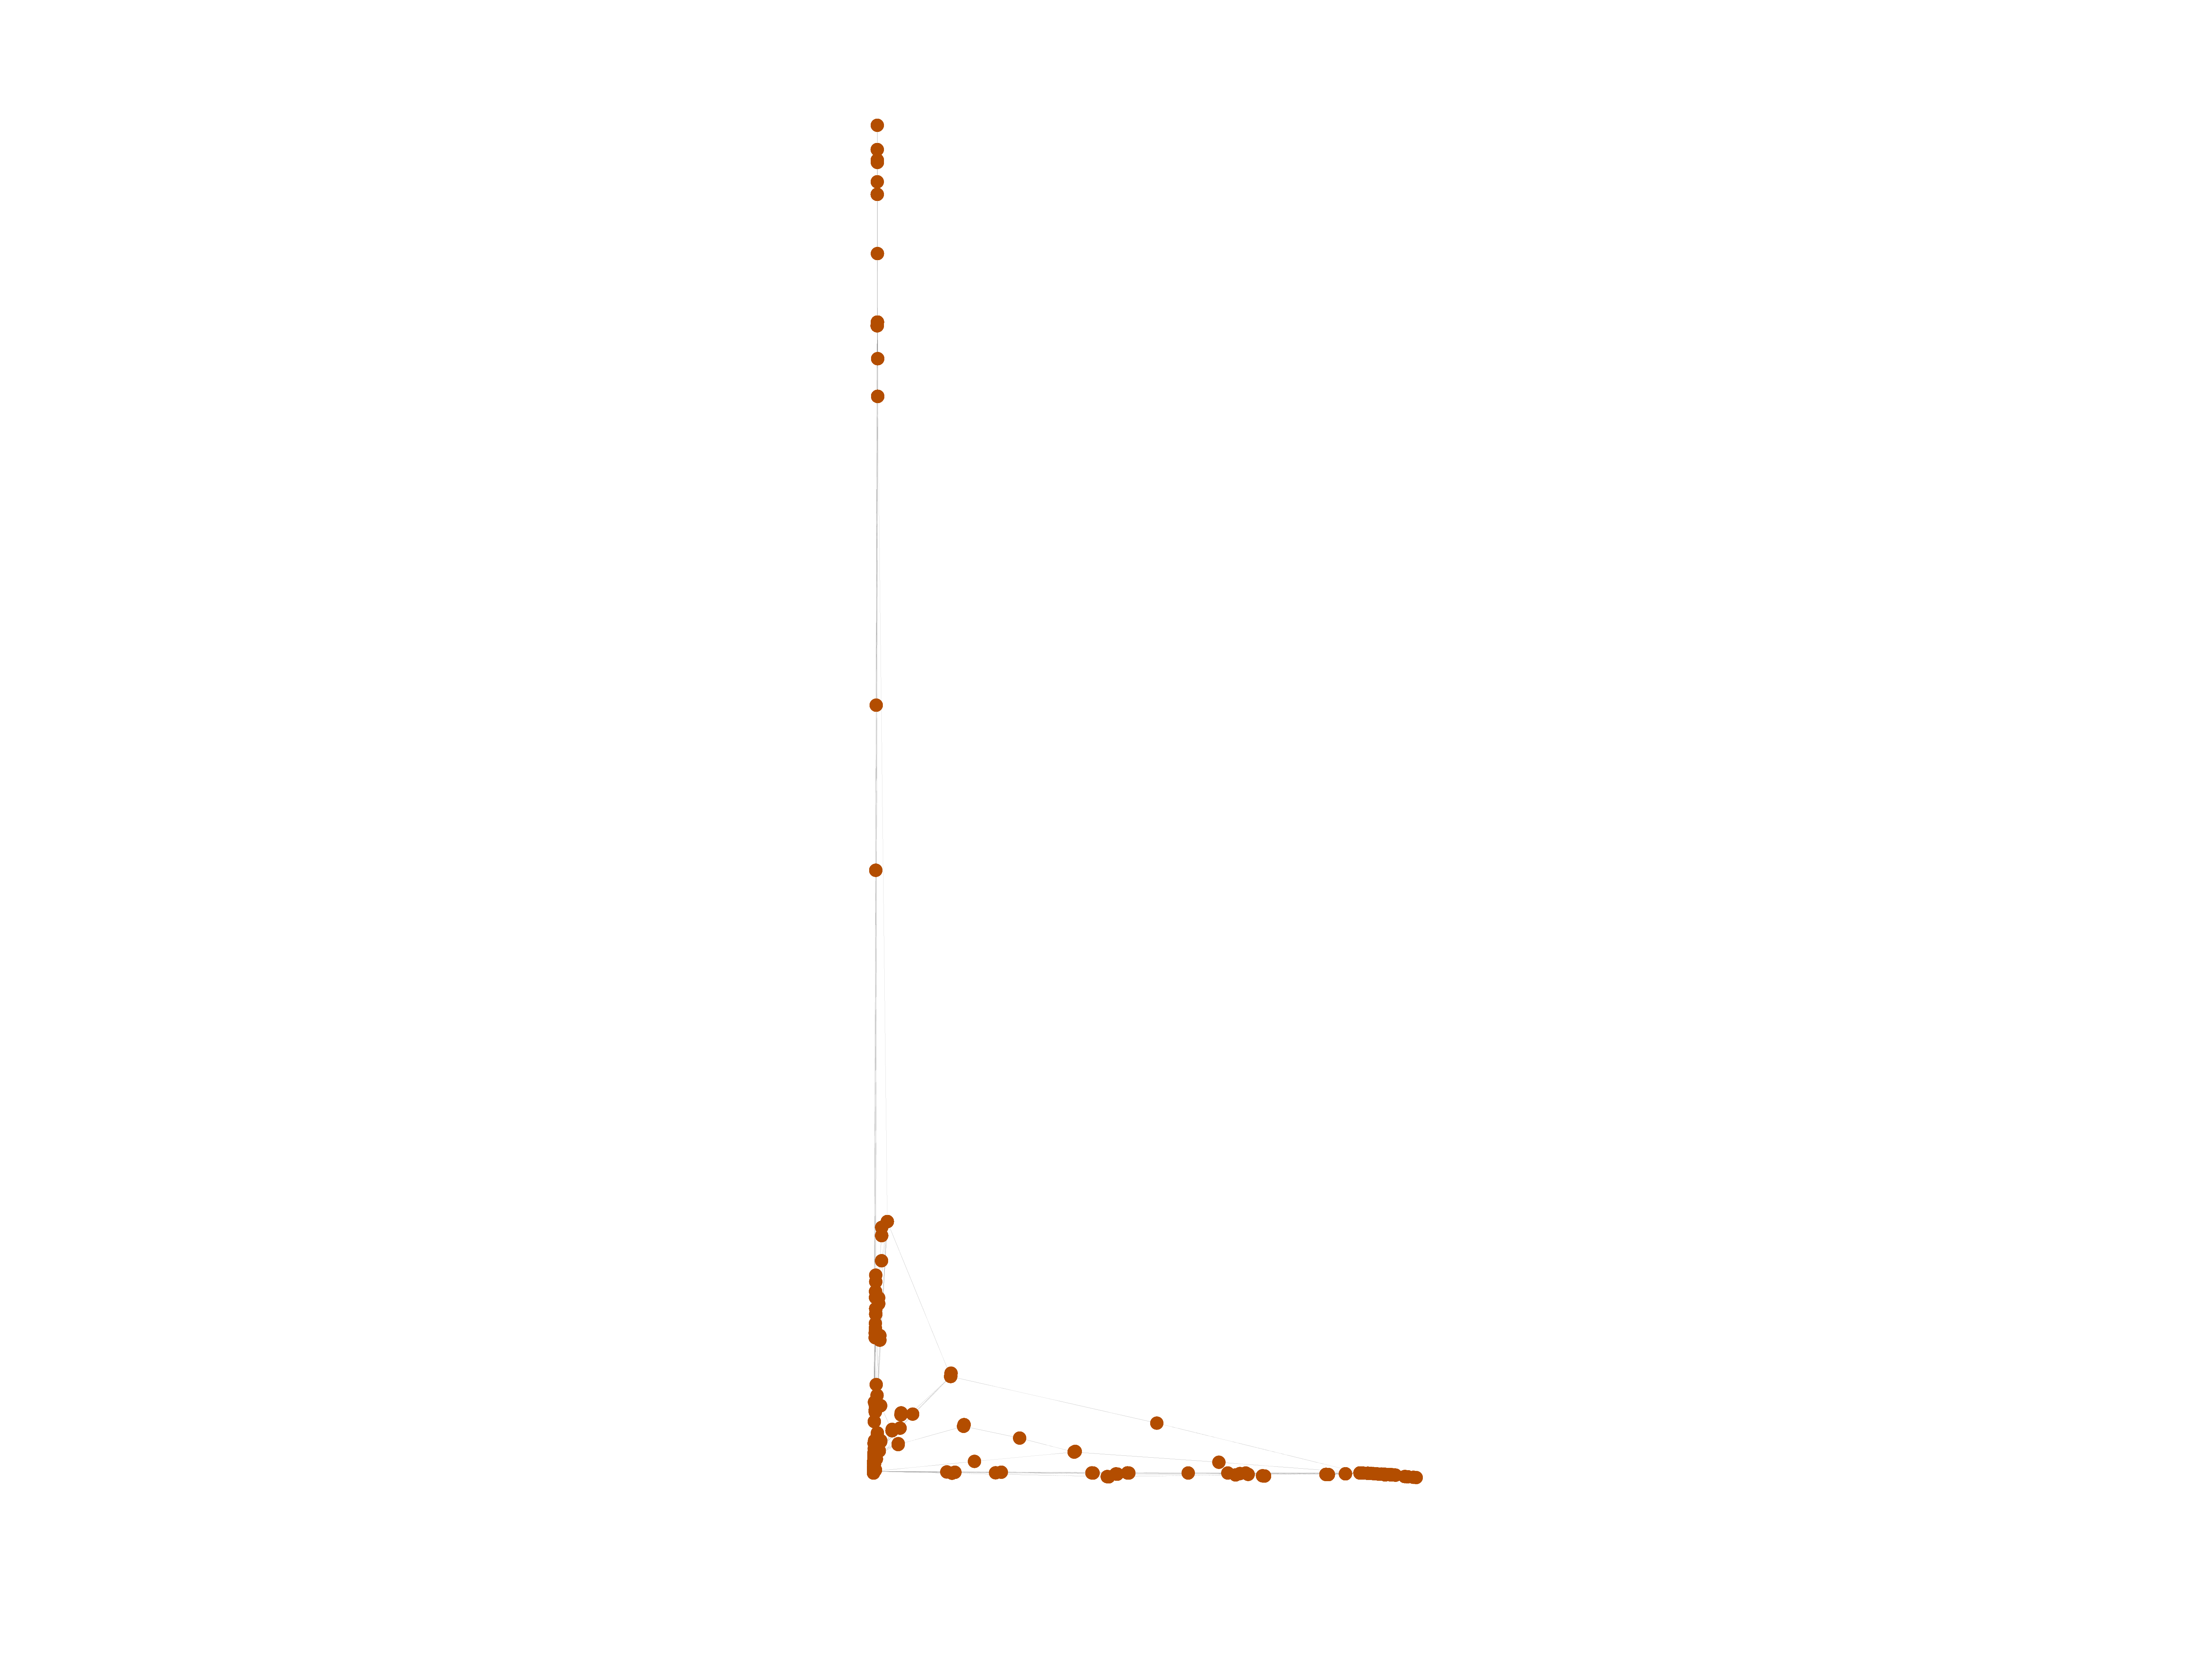
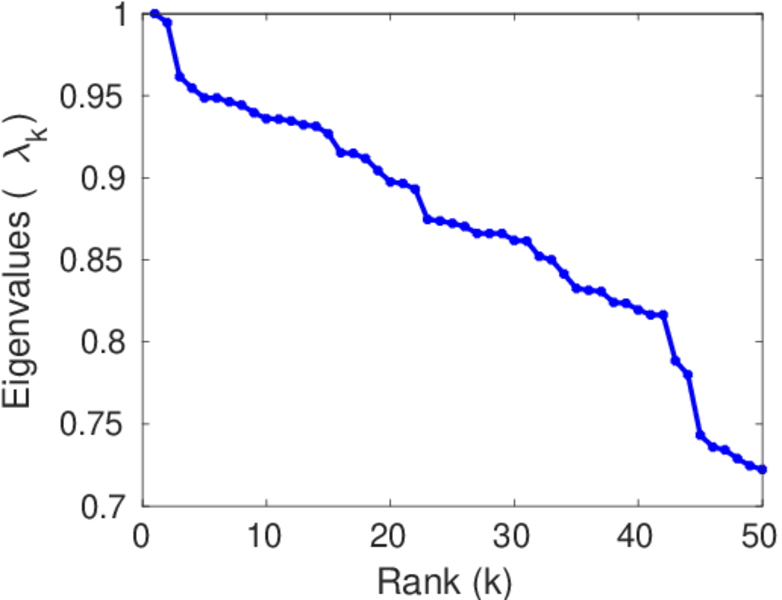
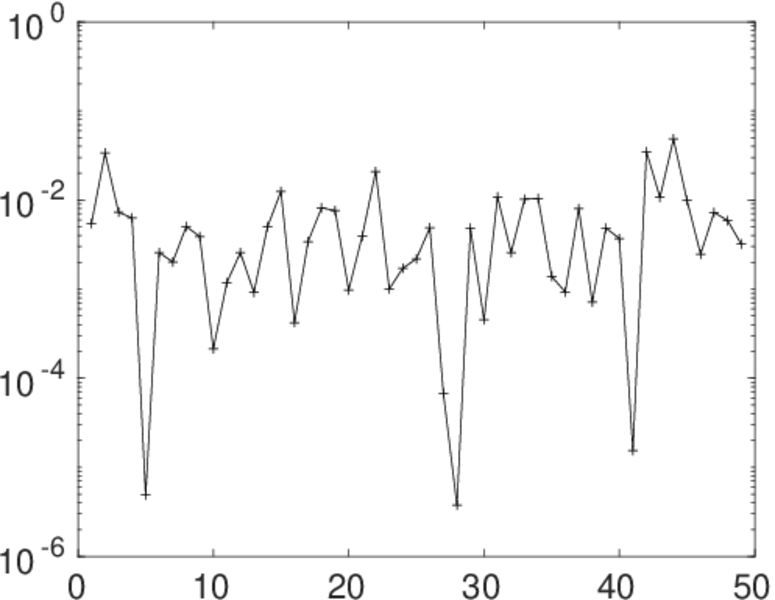
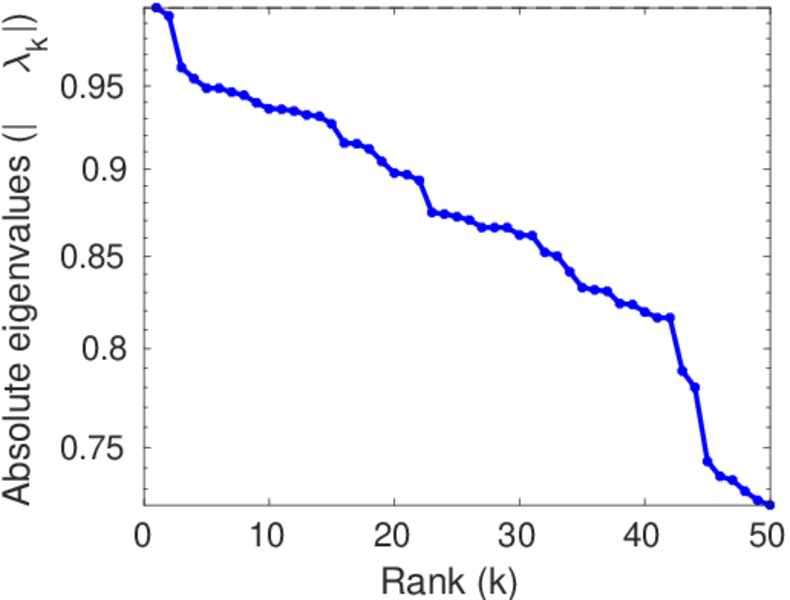
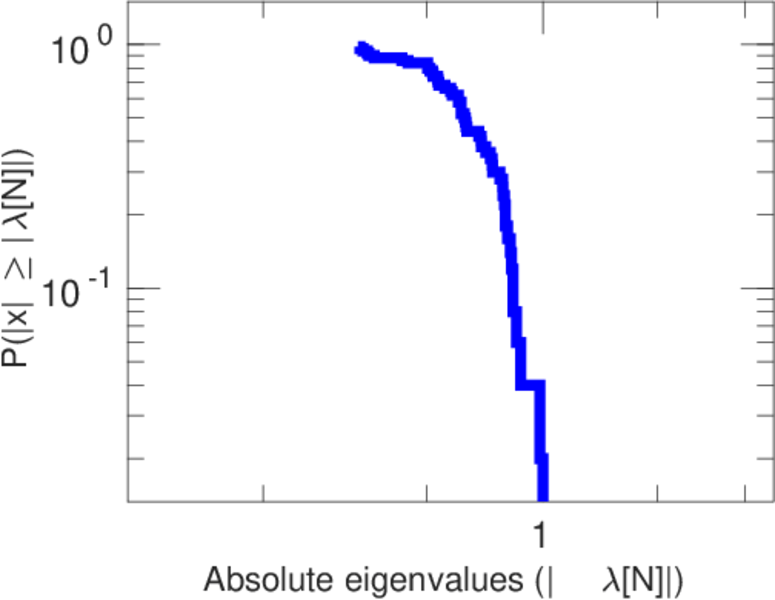
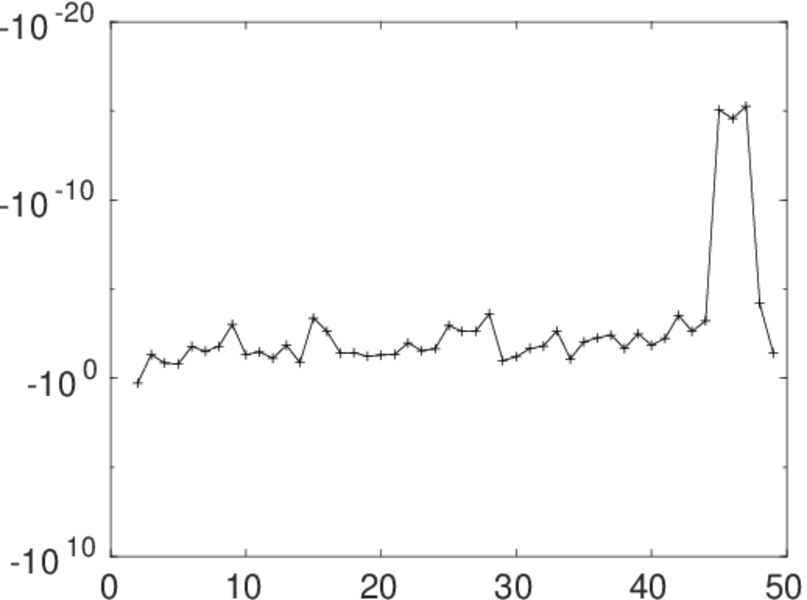
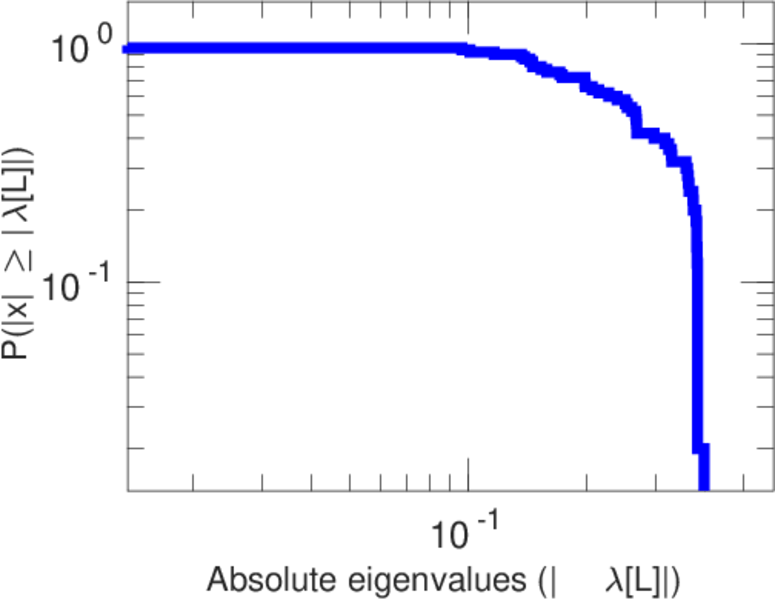
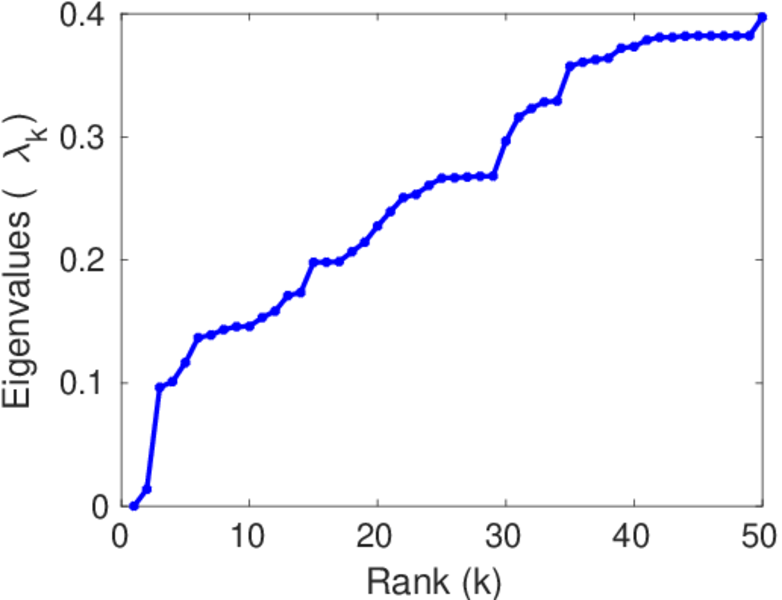
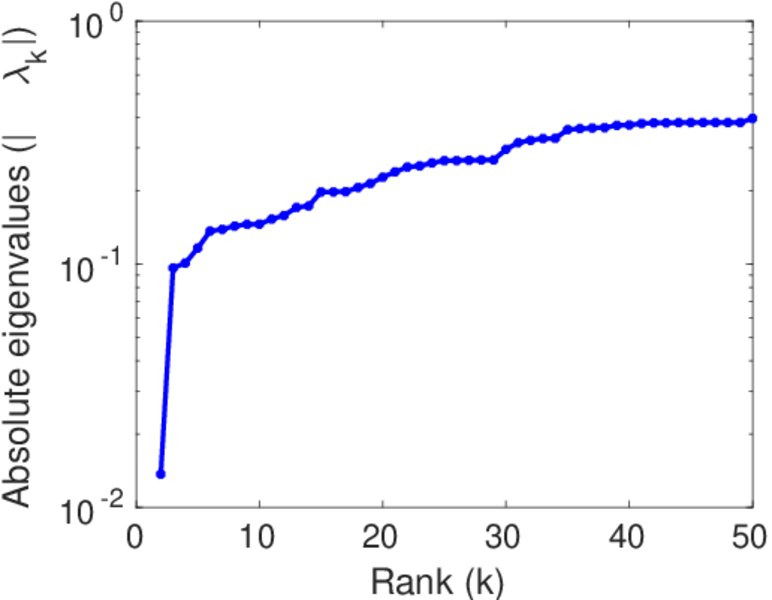
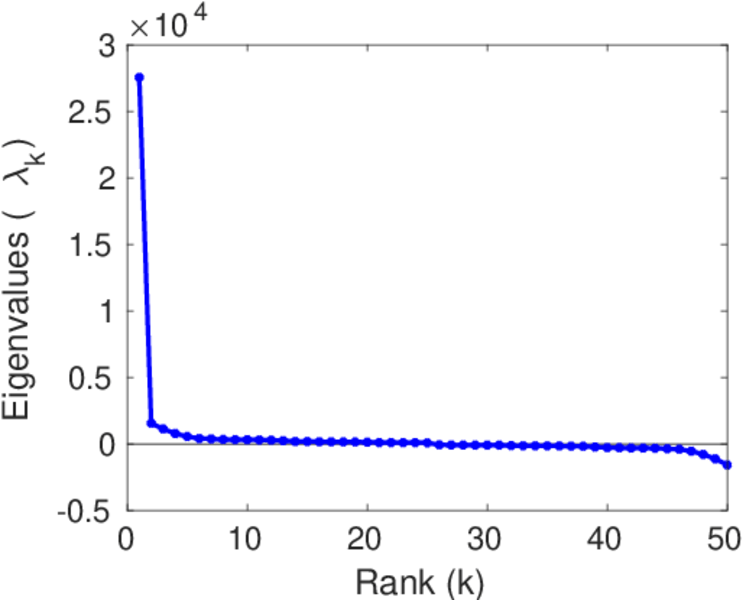
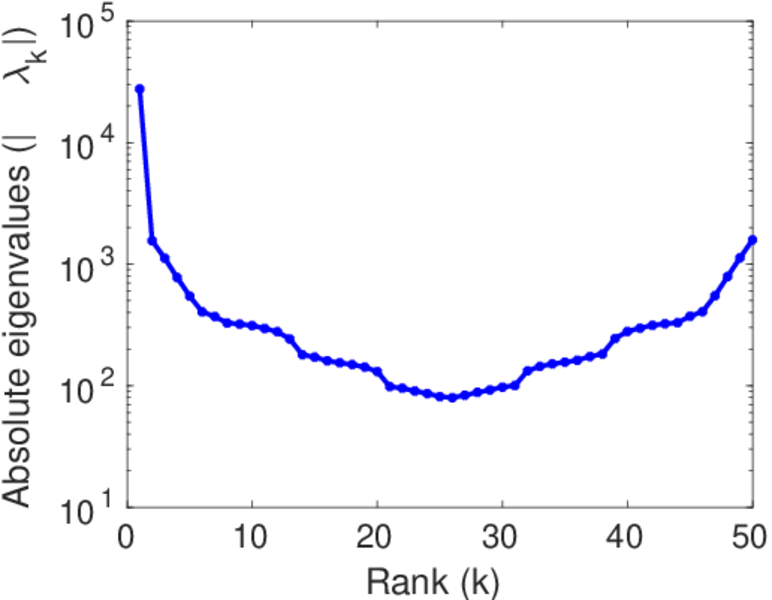
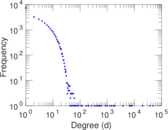
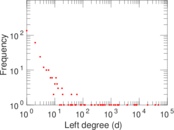
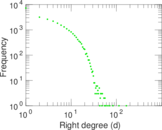
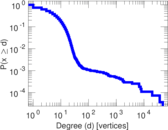
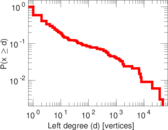
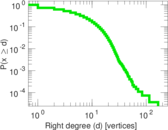
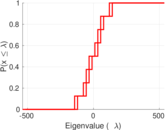
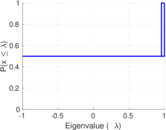
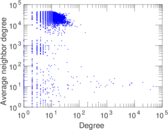
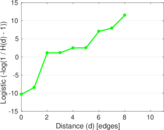
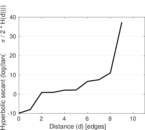
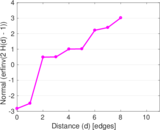
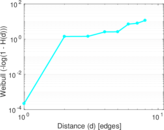
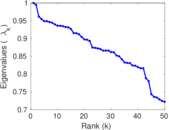
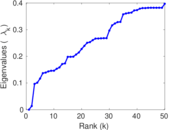
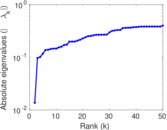
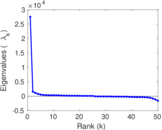
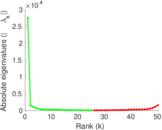
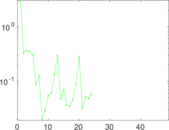
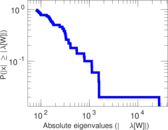
Plots


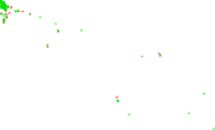


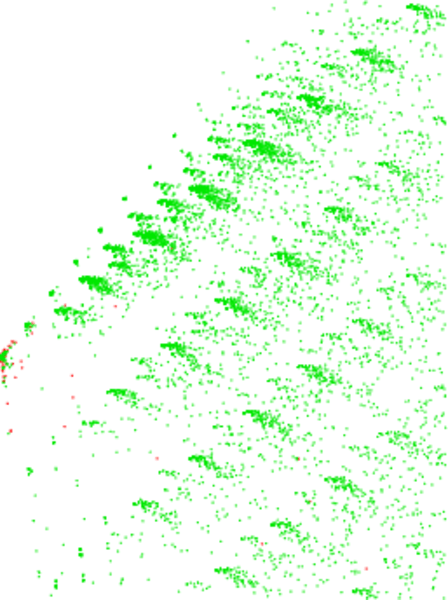
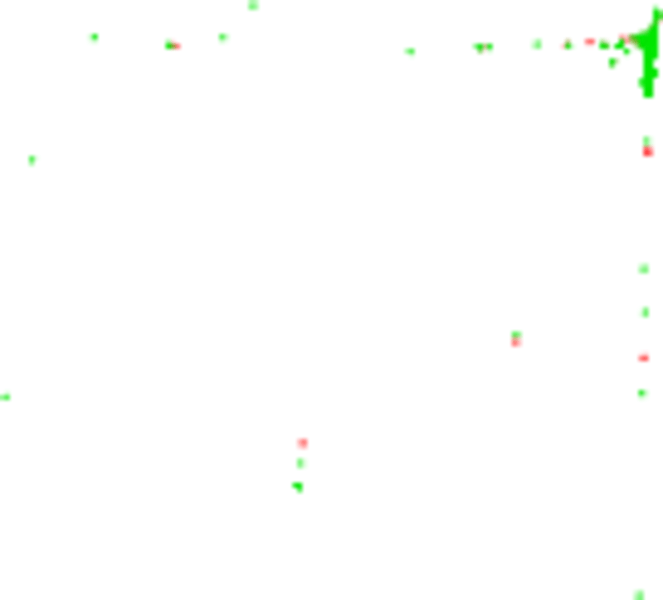
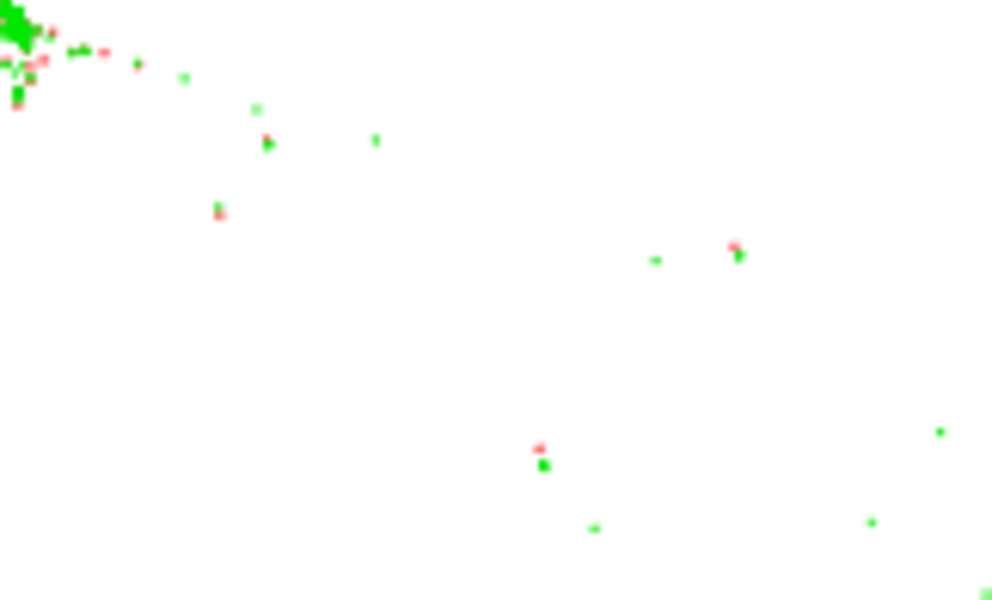
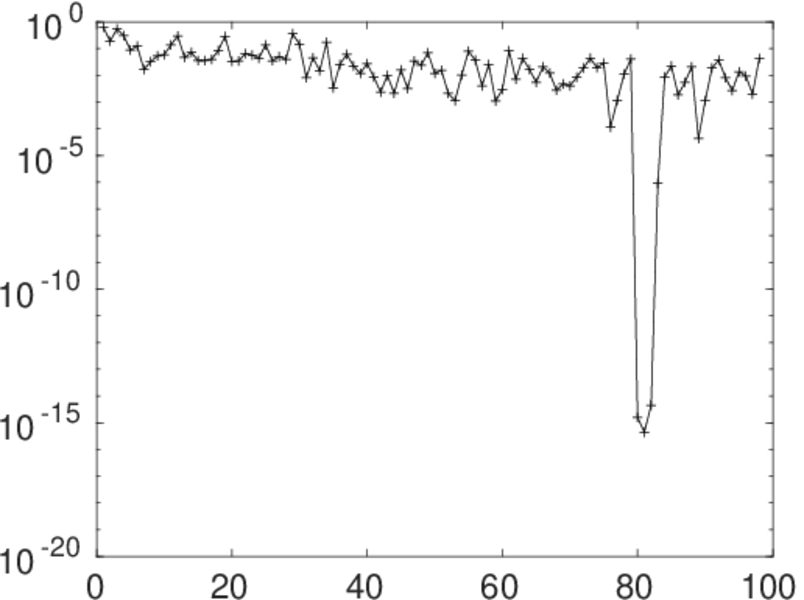
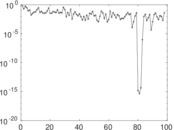
Matrix decompositions plots


Downloads
References
|
[1]
|
Jérôme Kunegis.
KONECT – The Koblenz Network Collection.
In Proc. Int. Conf. on World Wide Web Companion, pages
1343–1350, 2013.
[ http ]
|
|
[2]
|
Wikimedia Foundation.
Wikimedia downloads.
http://dumps.wikimedia.org/, January 2010.
|
 KONECT ‣ Networks ‣
Buy Me a Coffee
KONECT ‣ Networks ‣
Buy Me a Coffee