Wiktionary edits (da)
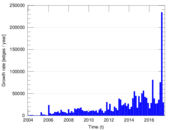
This is the bipartite edit network of the Danish Wiktionary. It contains users
and pages from the Danish Wiktionary, connected by edit events. Each edge
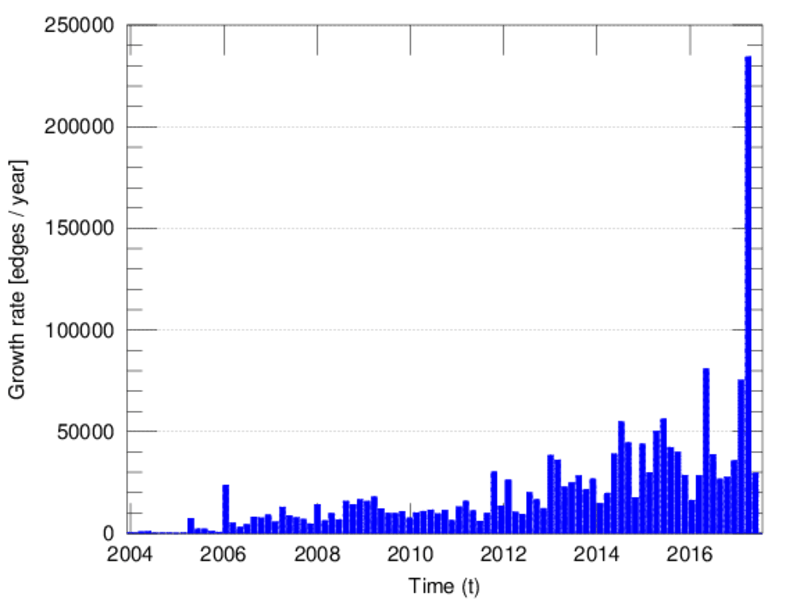
represents an edit. The dataset includes the timestamp of each edit.
Metadata
Statistics
| Size | n = | 50,397
|
| Left size | n1 = | 805
|
| Right size | n2 = | 49,592
|
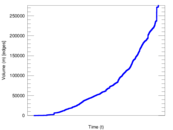
| Volume | m = | 276,040
|
| Unique edge count | m̿ = | 186,842
|
| Wedge count | s = | 1,133,085,739
|
| Claw count | z = | 8,608,892,296,990
|
| Cross count | x = | 61,503,414,691,291,104
|
| Square count | q = | 702,571,371
|
| 4-Tour count | T4 = | 10,153,287,868
|
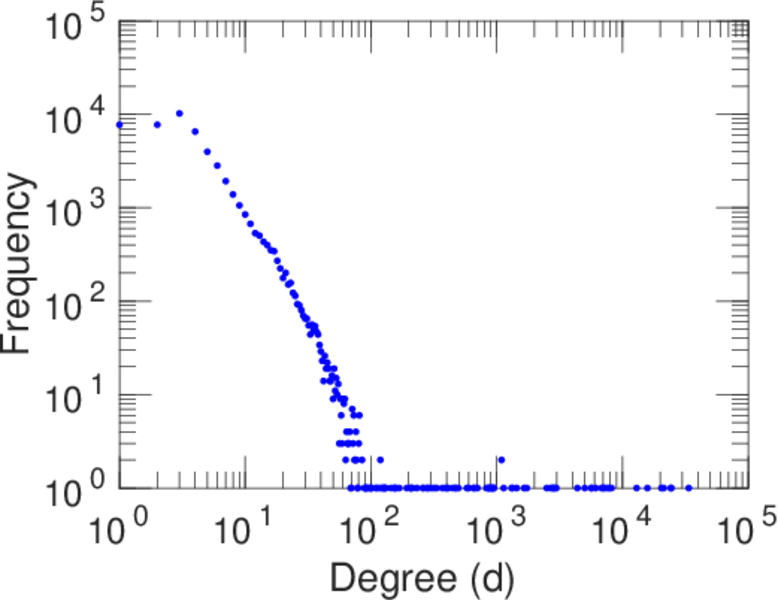
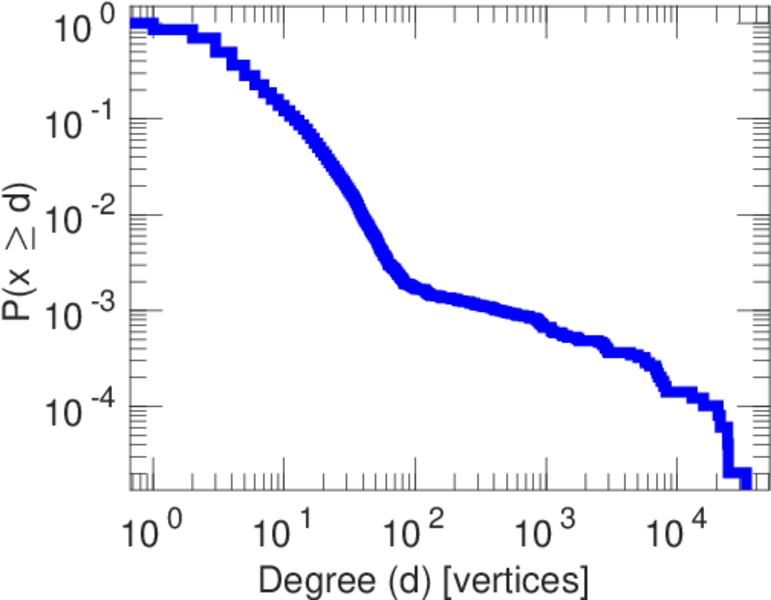
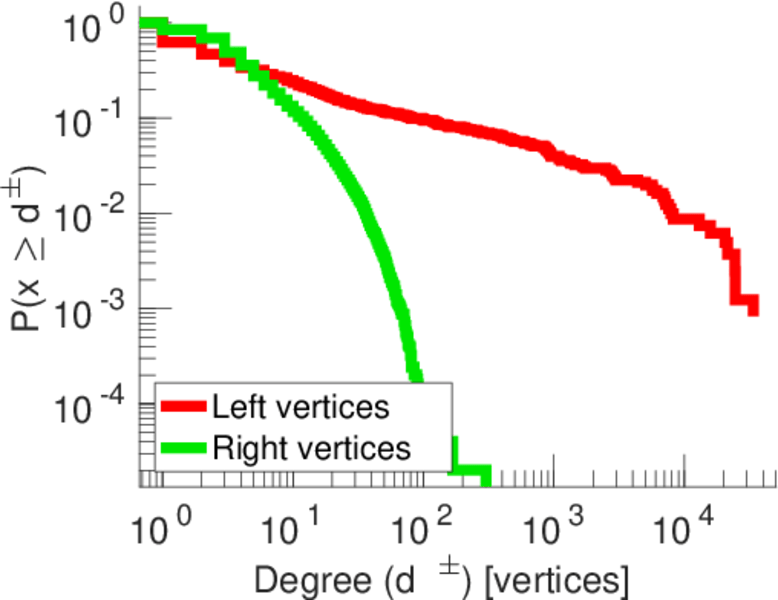
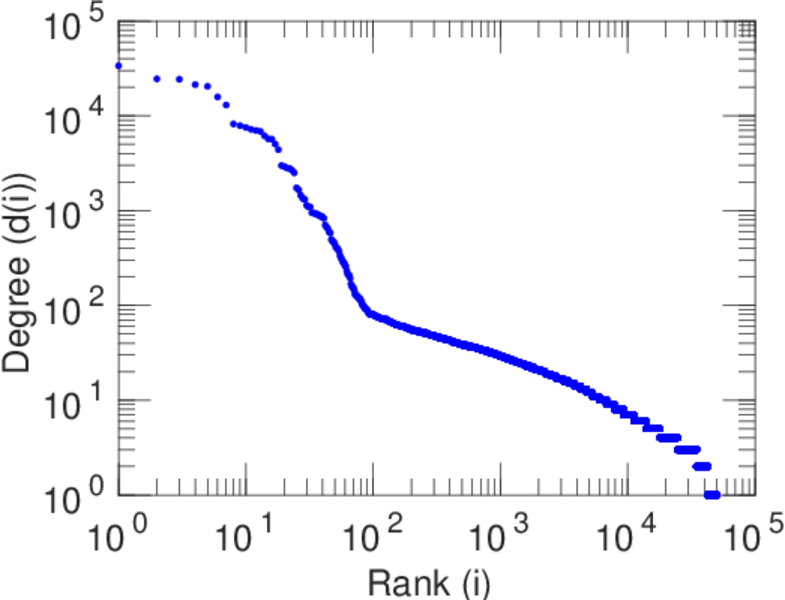
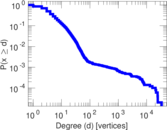
| Maximum degree | dmax = | 33,722
|
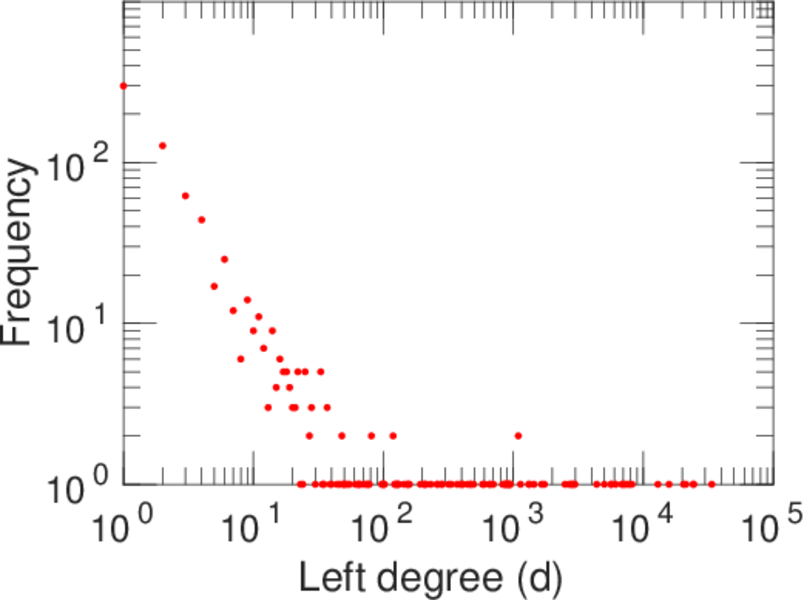
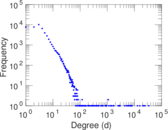
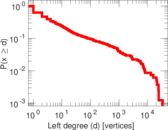
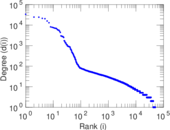
| Maximum left degree | d1max = | 33,722
|
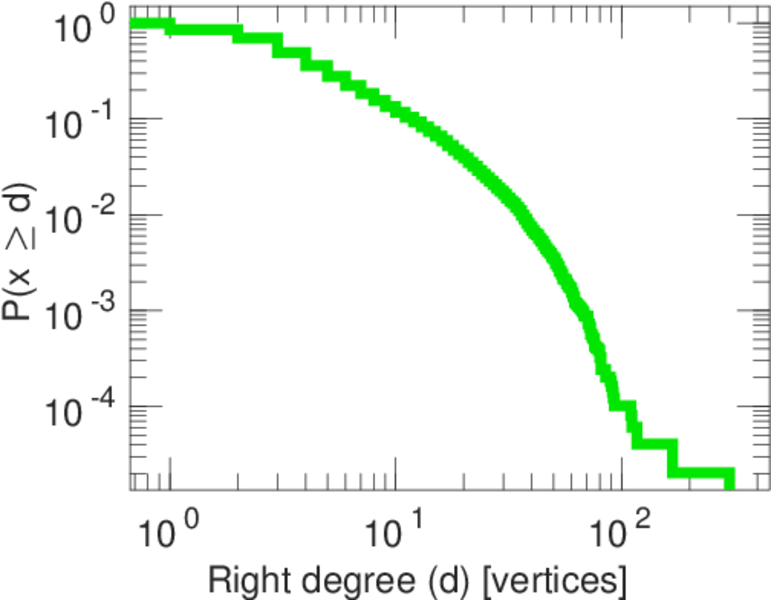
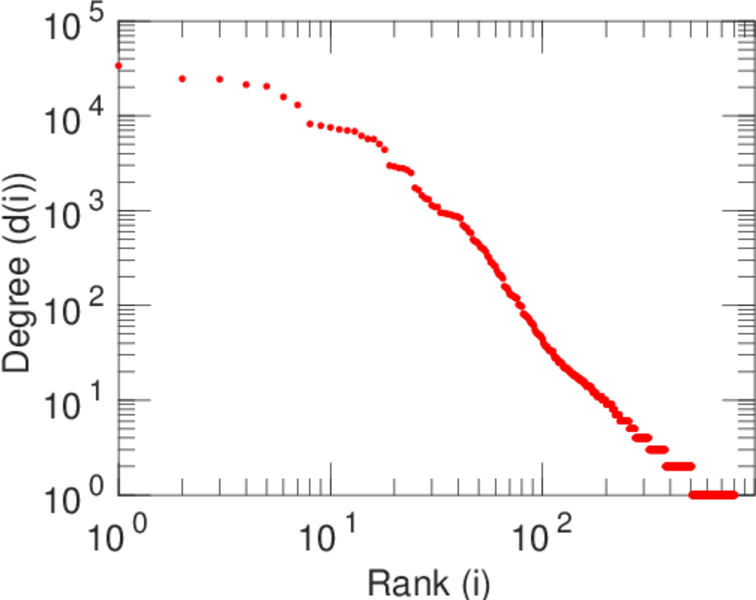
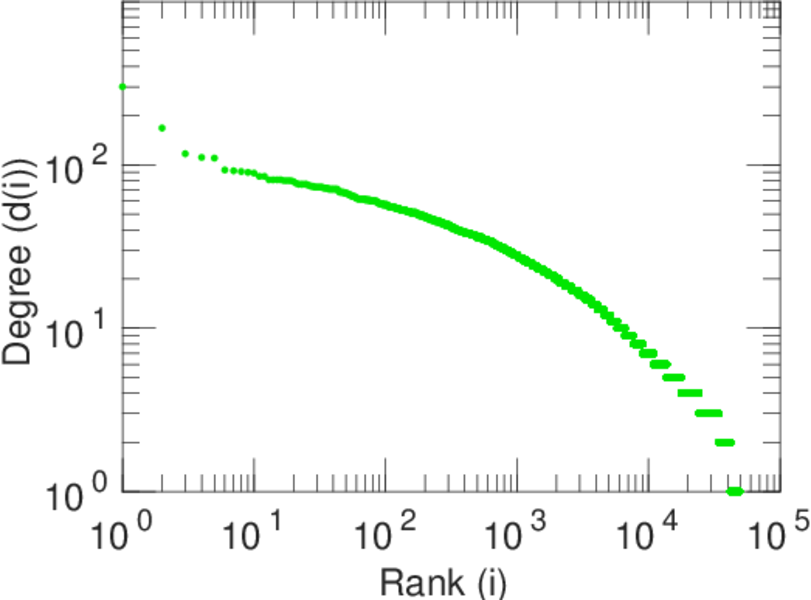
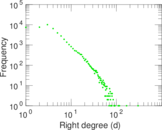
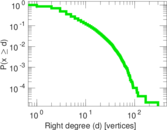
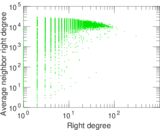
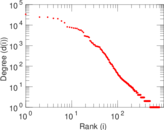
| Maximum right degree | d2max = | 301
|
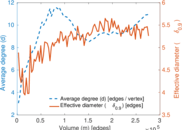
| Average degree | d = | 10.954 6
|
| Average left degree | d1 = | 342.907
|
| Average right degree | d2 = | 5.566 22
|
| Fill | p = | 0.004 680 23
|
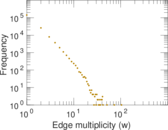
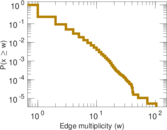
| Average edge multiplicity | m̃ = | 1.477 40
|
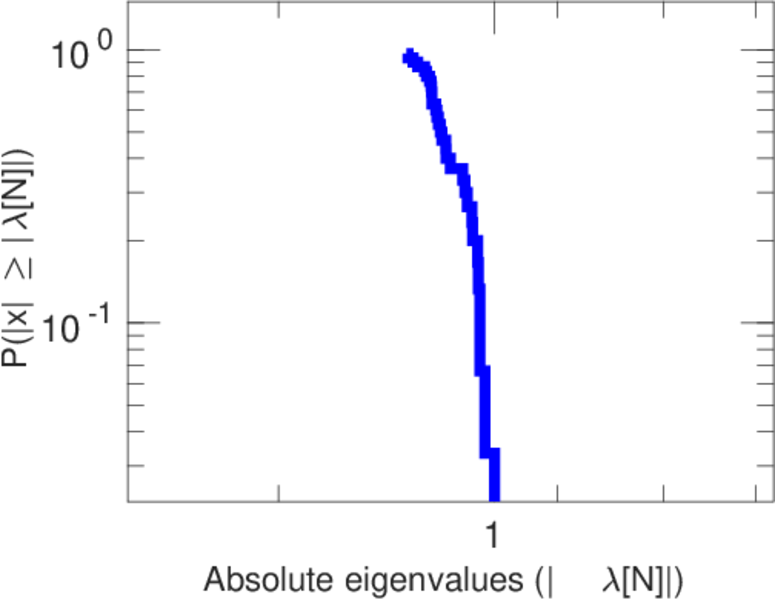
| Size of LCC | N = | 49,839
|
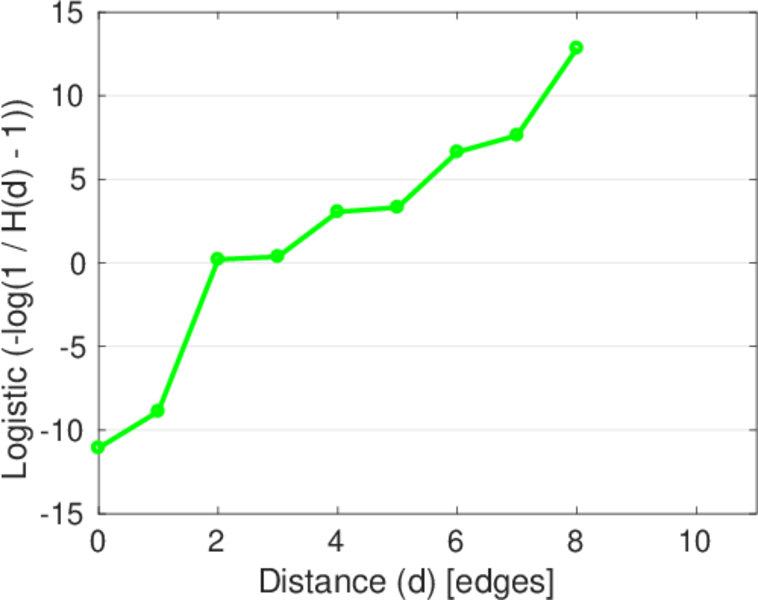
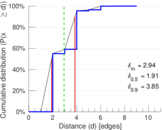
| Diameter | δ = | 11
|
| 50-Percentile effective diameter | δ0.5 = | 1.908 77
|
| 90-Percentile effective diameter | δ0.9 = | 3.849 70
|
| Median distance | δM = | 2
|
| Mean distance | δm = | 2.941 11
|
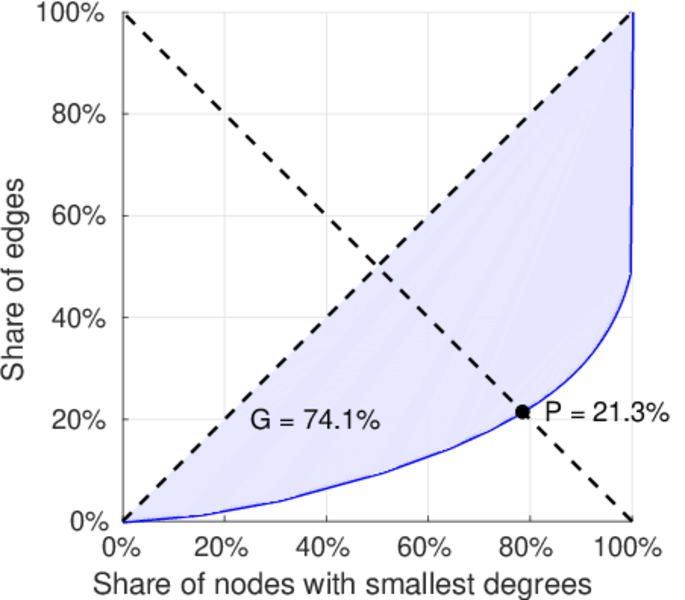
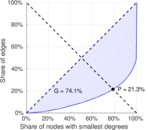
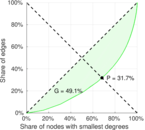
| Gini coefficient | G = | 0.741 810
|
| Balanced inequality ratio | P = | 0.213 063
|
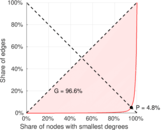
| Left balanced inequality ratio | P1 = | 0.047 873 5
|
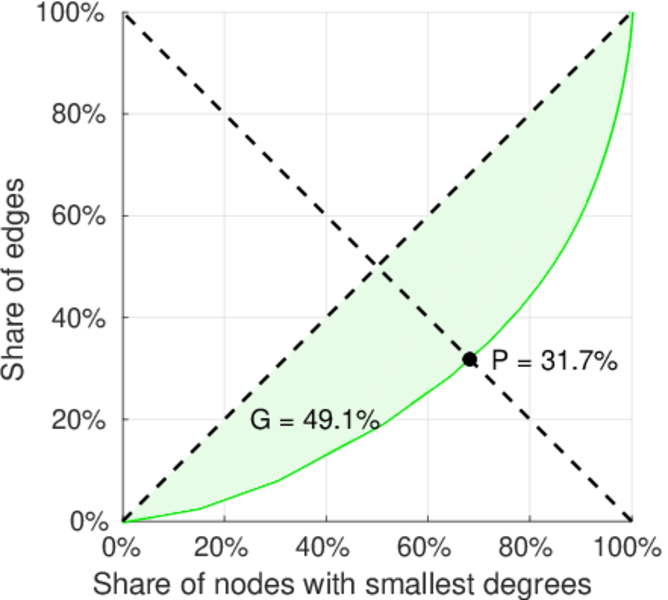
| Right balanced inequality ratio | P2 = | 0.316 552
|
| Relative edge distribution entropy | Her = | 0.709 776
|
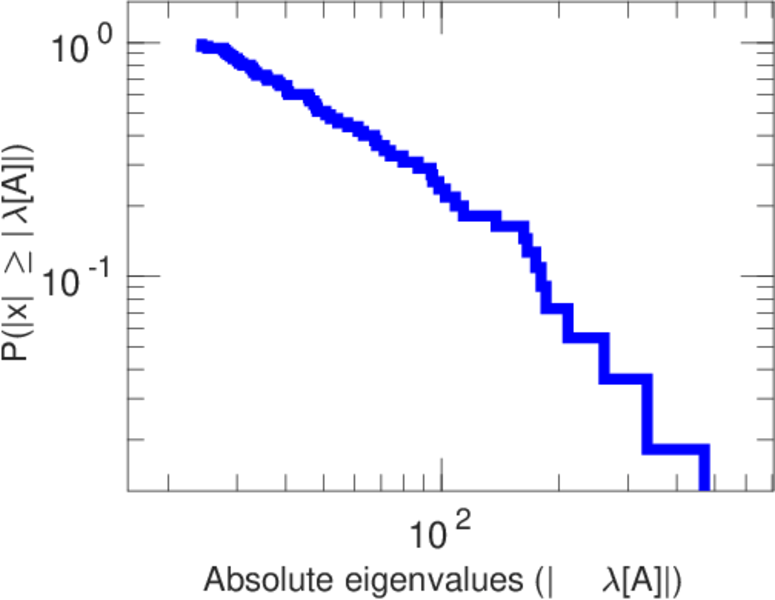
| Power law exponent | γ = | 1.925 36
|
| Tail power law exponent | γt = | 2.931 00
|
| Tail power law exponent with p | γ3 = | 2.931 00
|
| p-value | p = | 0.000 00
|
| Left tail power law exponent with p | γ3,1 = | 1.551 00
|
| Left p-value | p1 = | 0.000 00
|
| Right tail power law exponent with p | γ3,2 = | 3.031 00
|
| Right p-value | p2 = | 0.000 00
|
| Degree assortativity | ρ = | −0.214 606
|
| Degree assortativity p-value | pρ = | 0.000 00
|
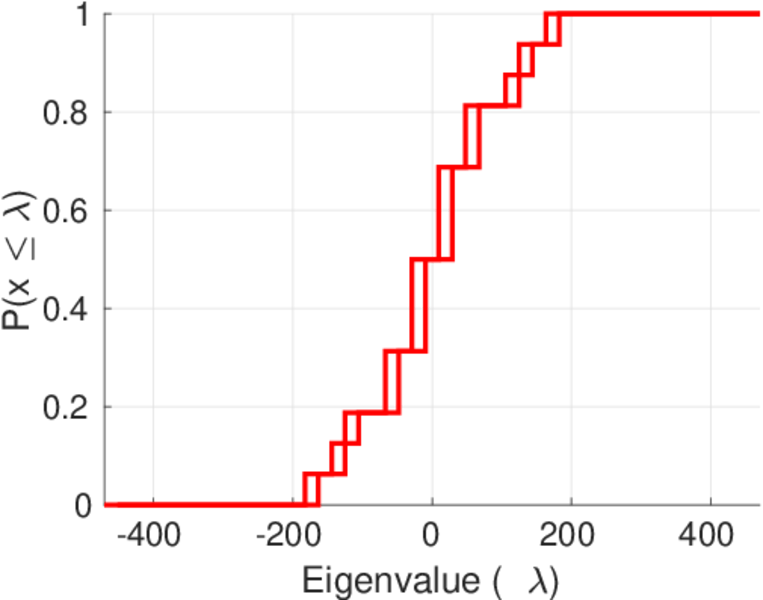
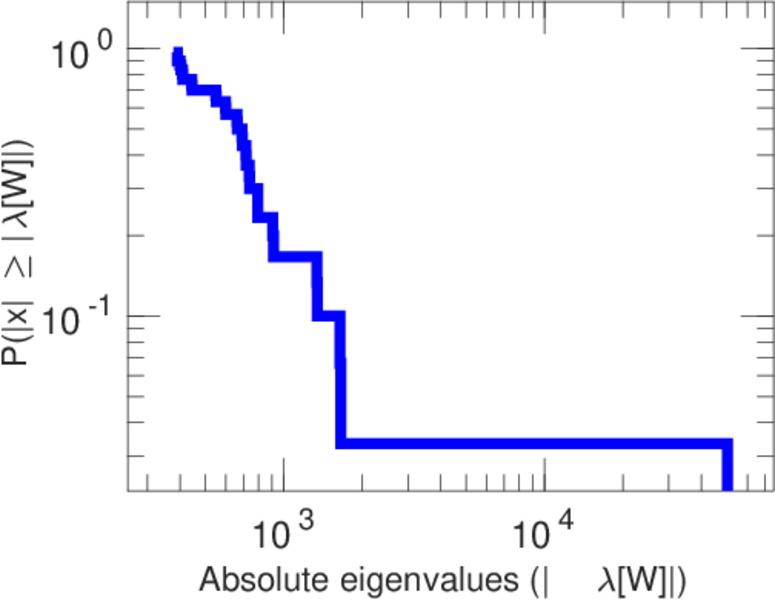
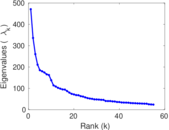
| Spectral norm | α = | 470.753
|
| Algebraic connectivity | a = | 0.034 843 3
|
| Spectral separation | |λ1[A] / λ2[A]| = | 1.400 94
|
| Controllability | C = | 48,635
|
| Relative controllability | Cr = | 0.968 535
|
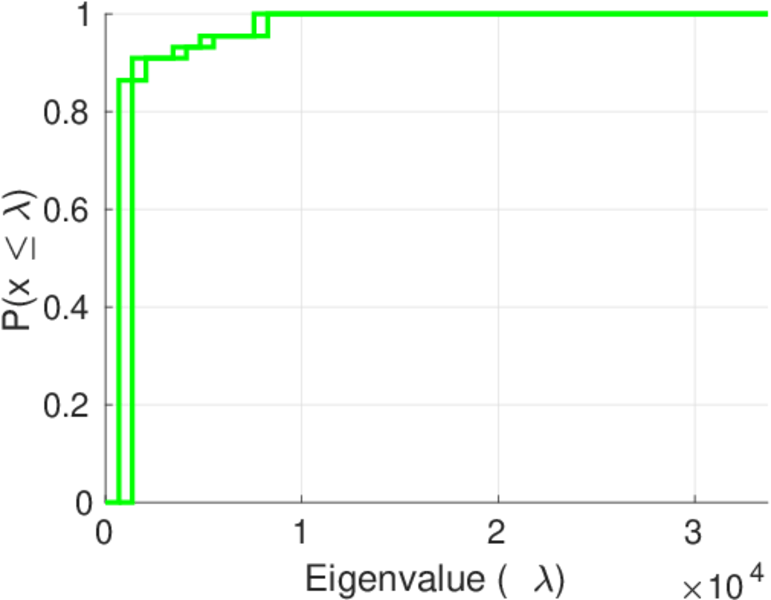
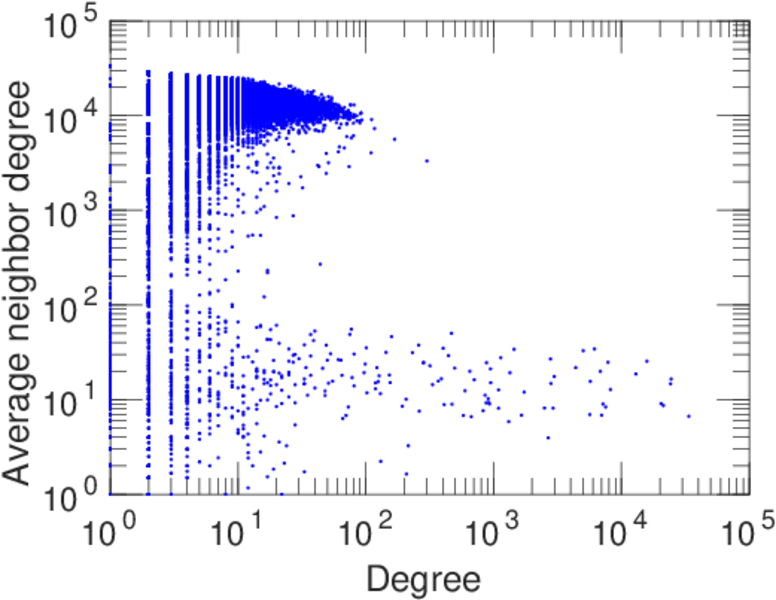
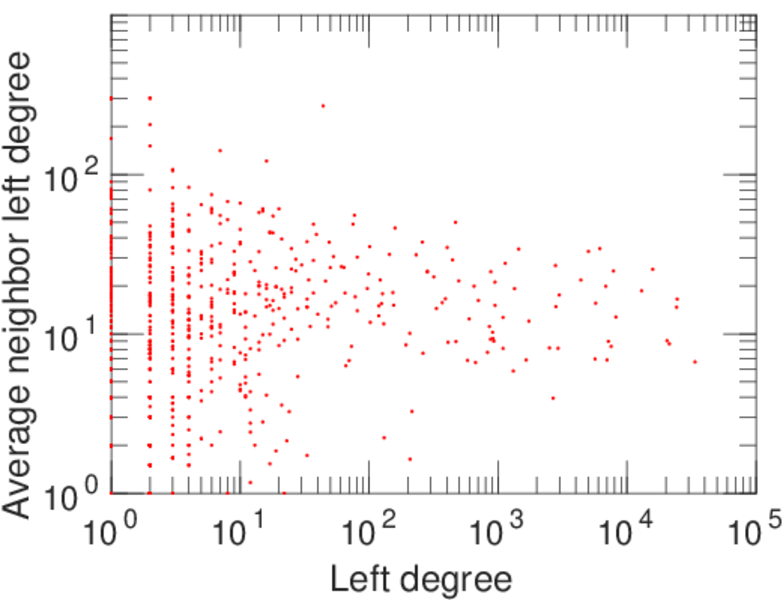
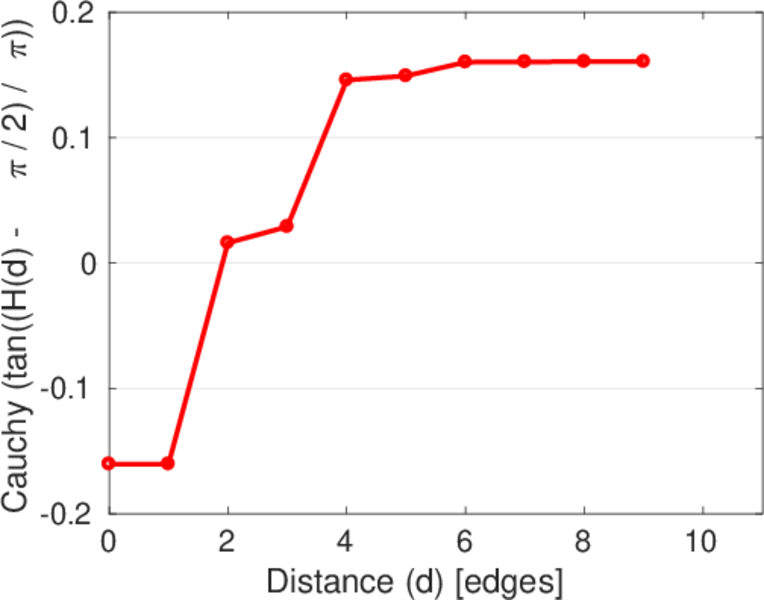
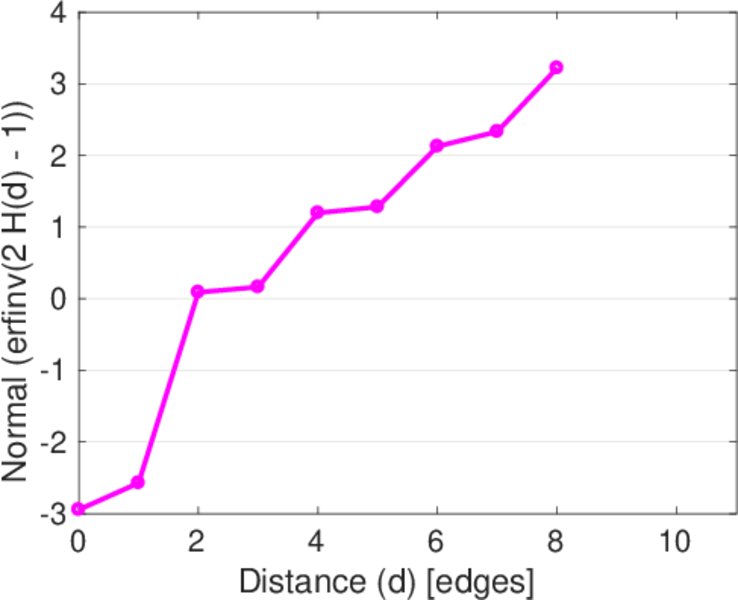
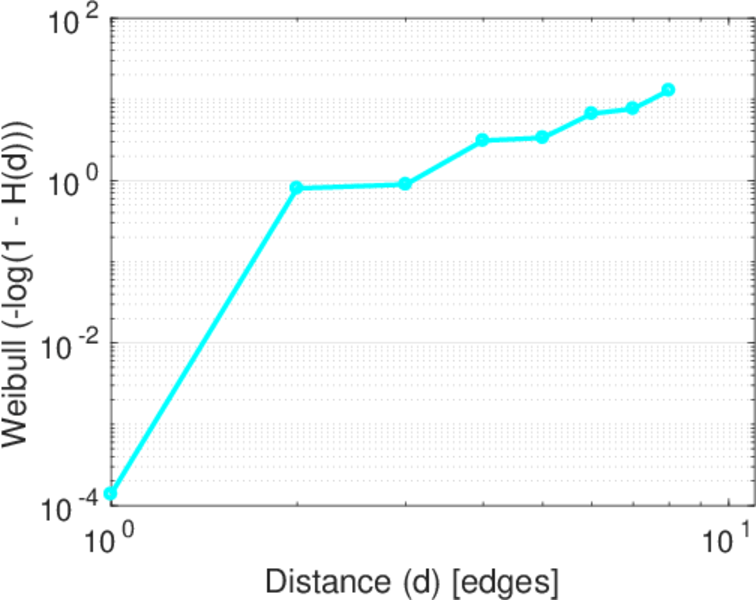
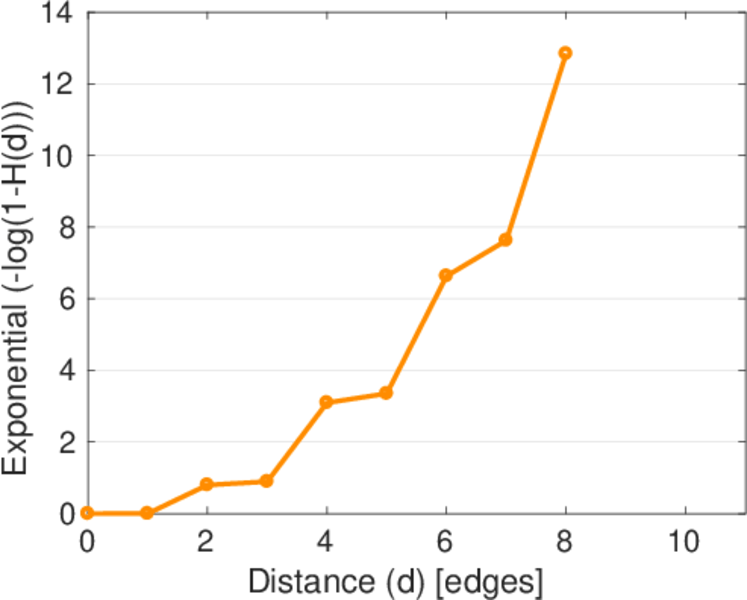
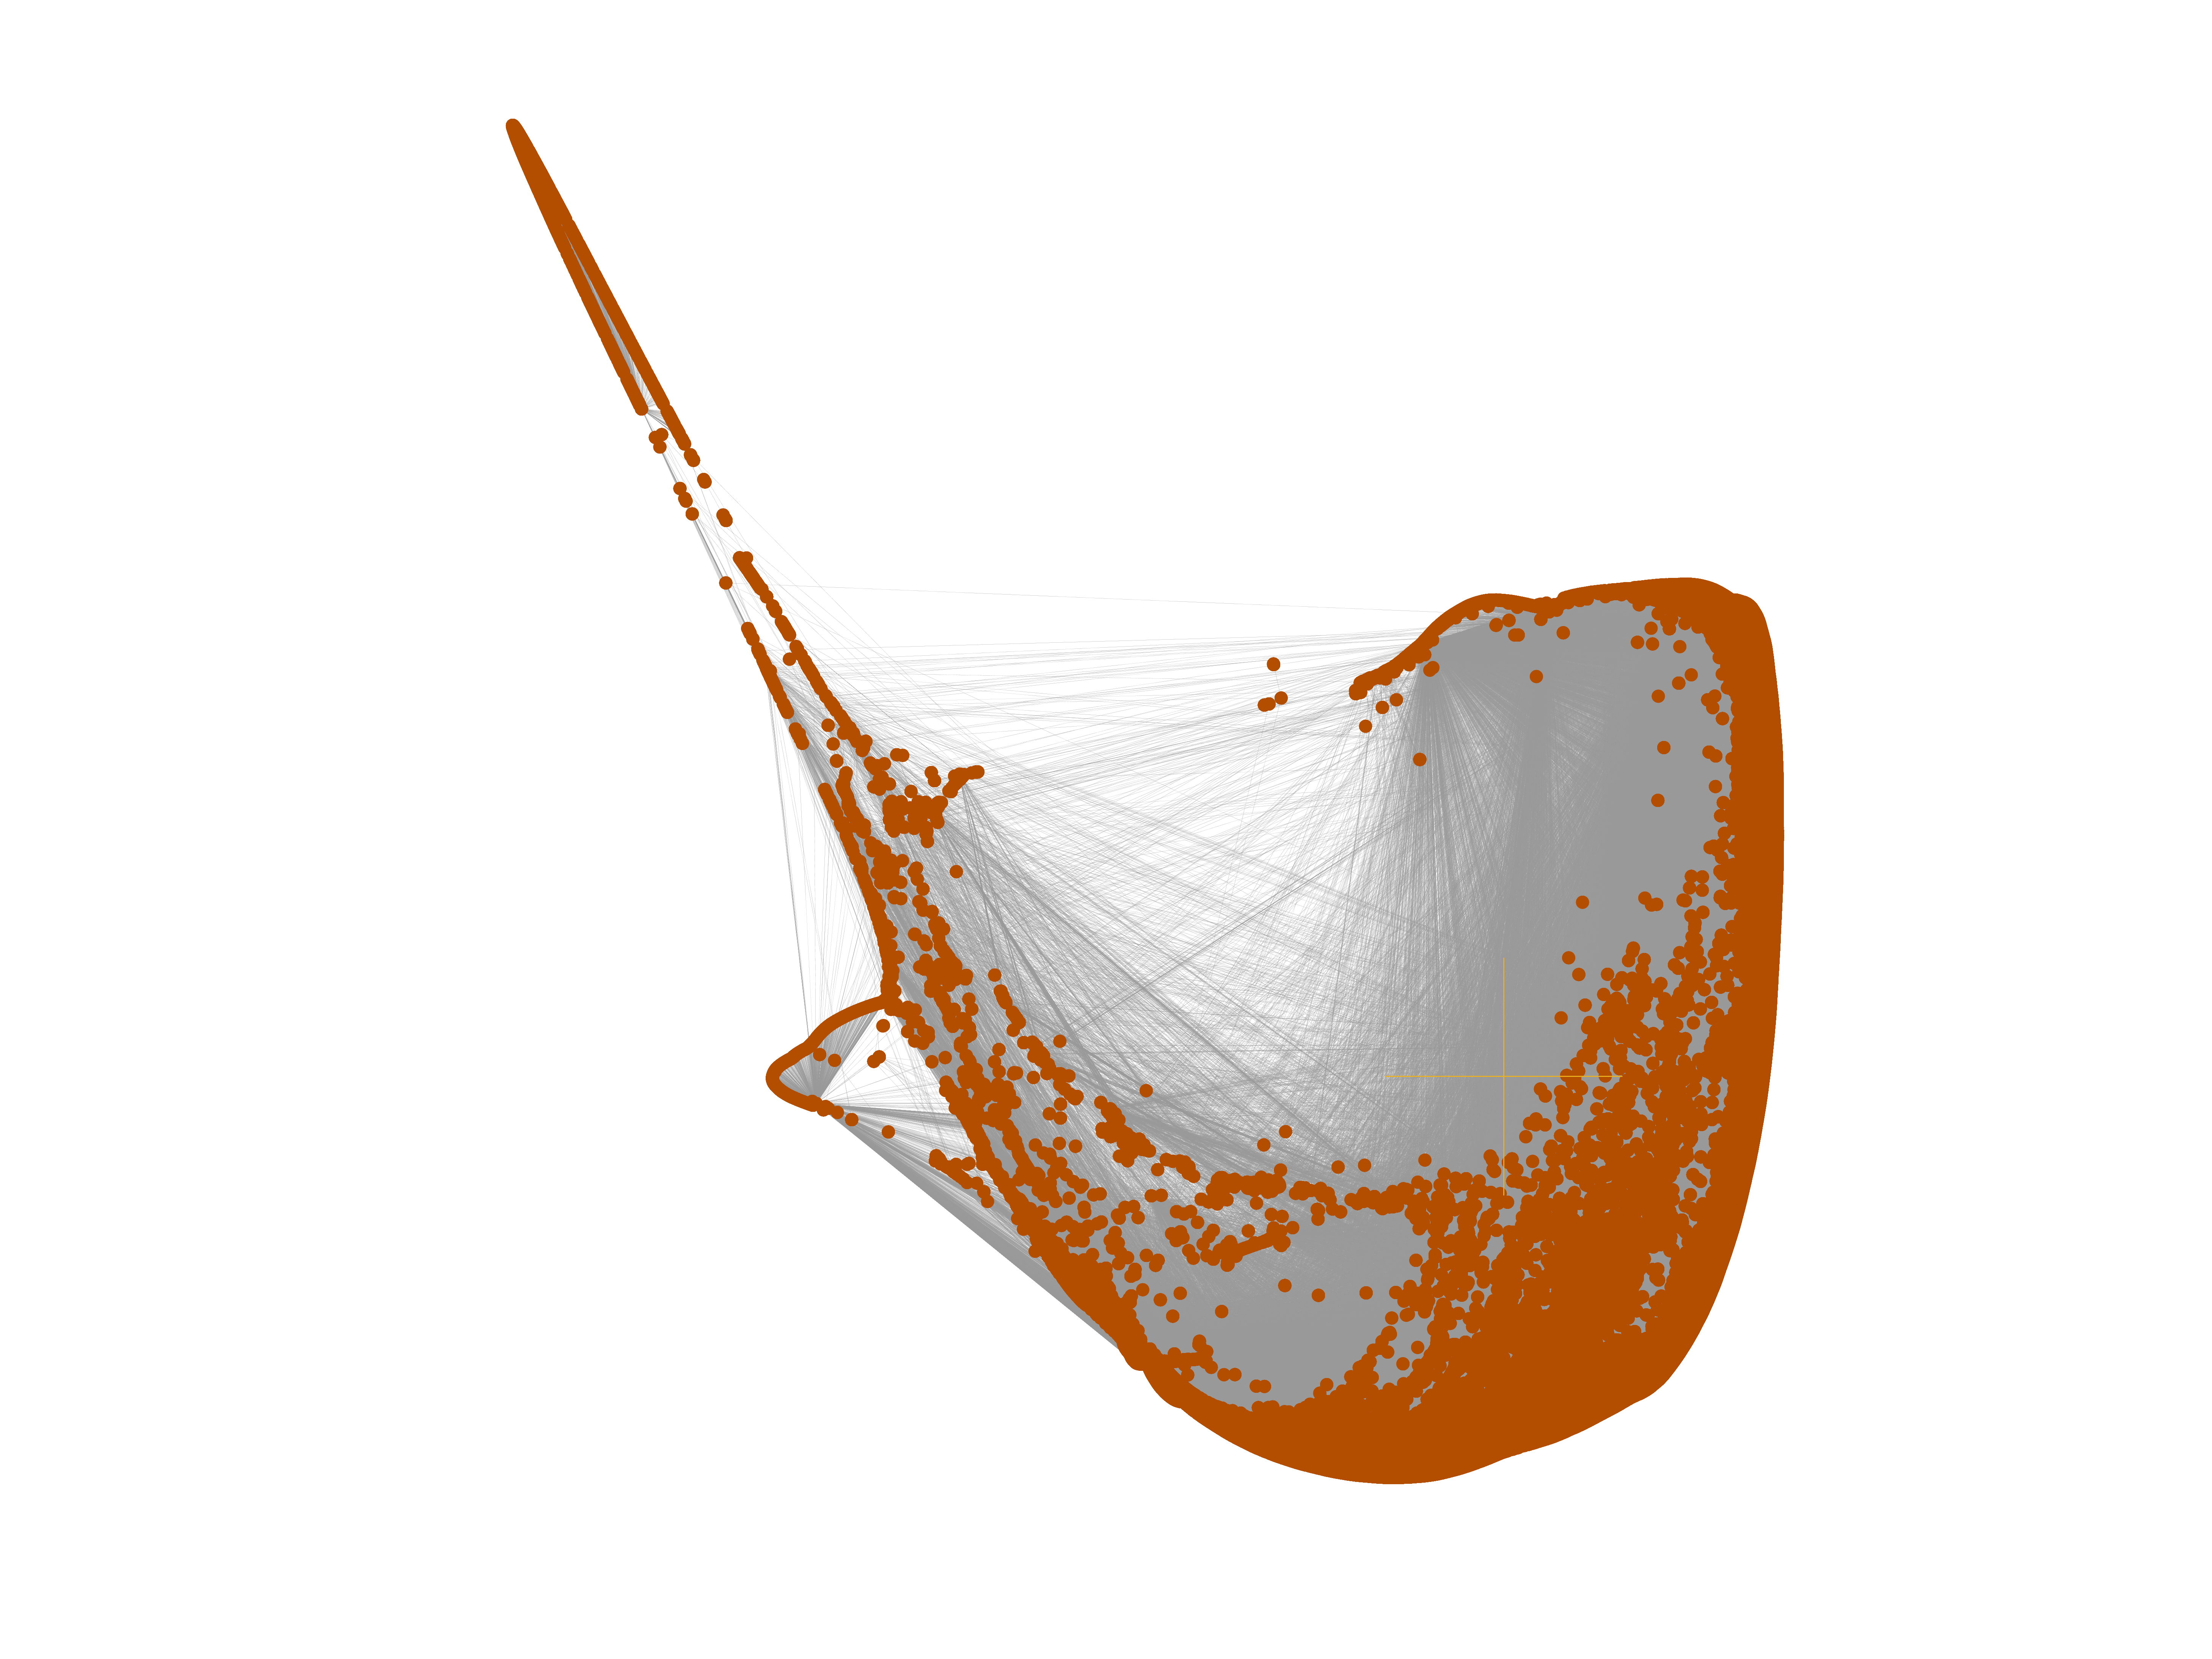
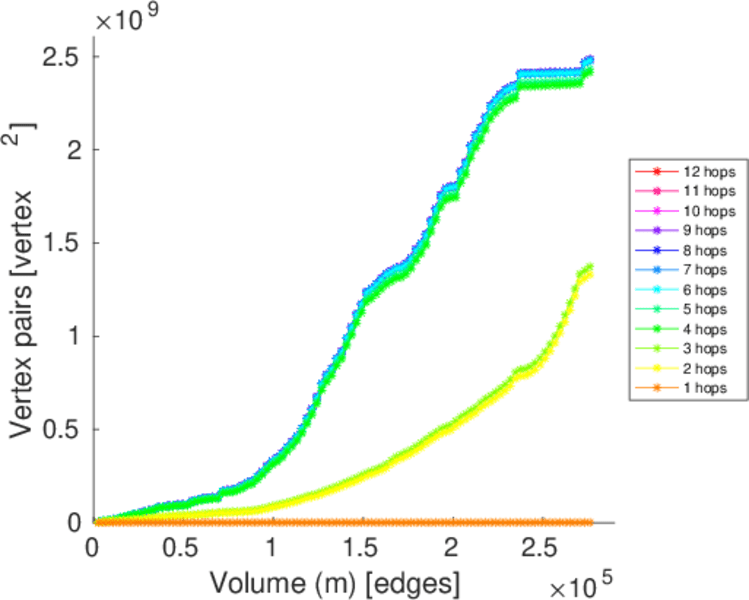
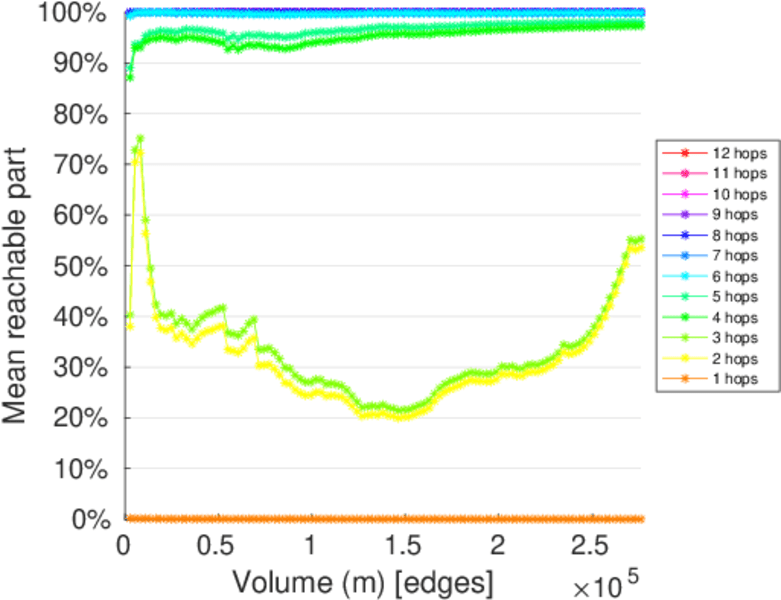
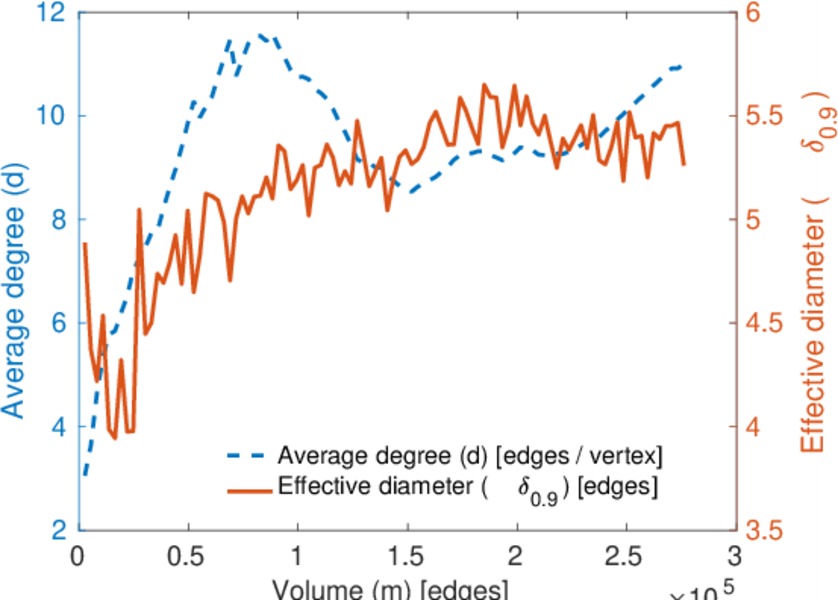
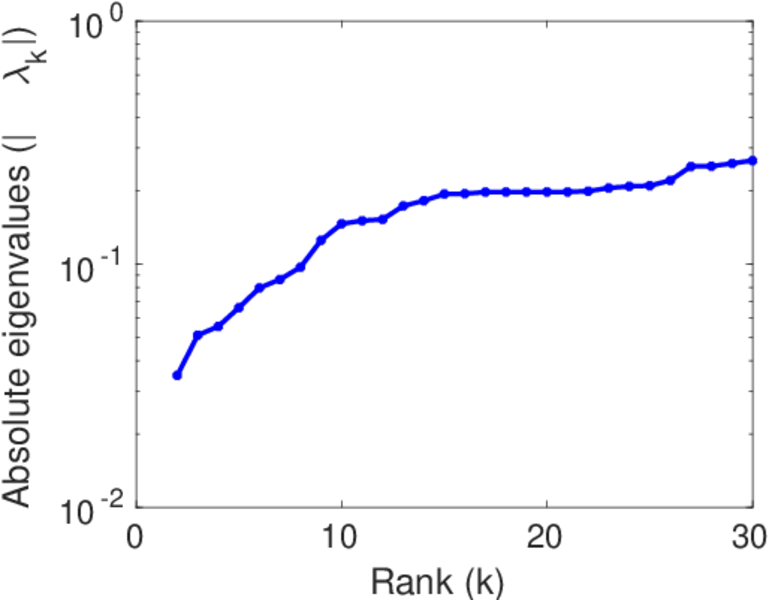
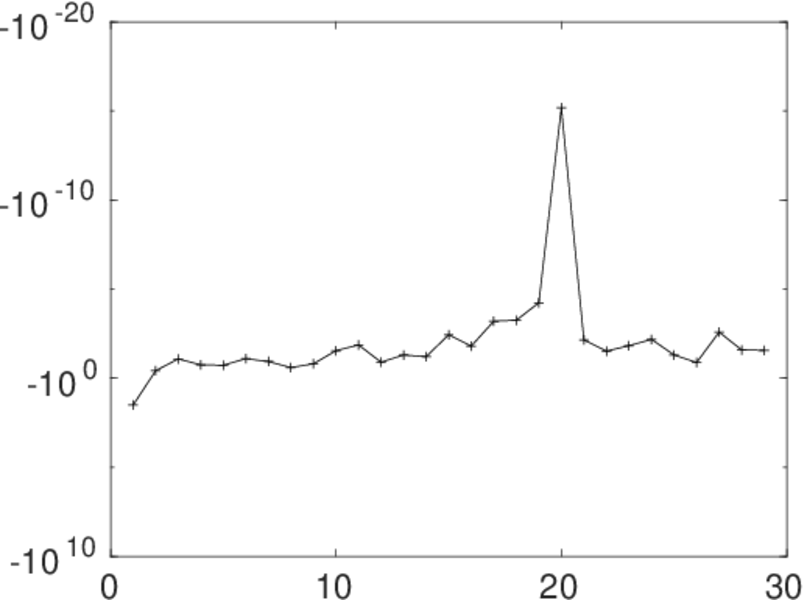
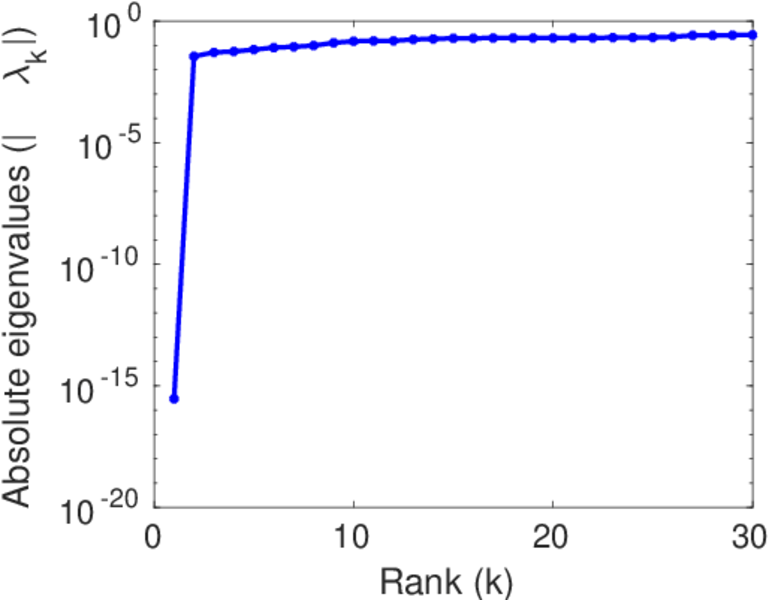
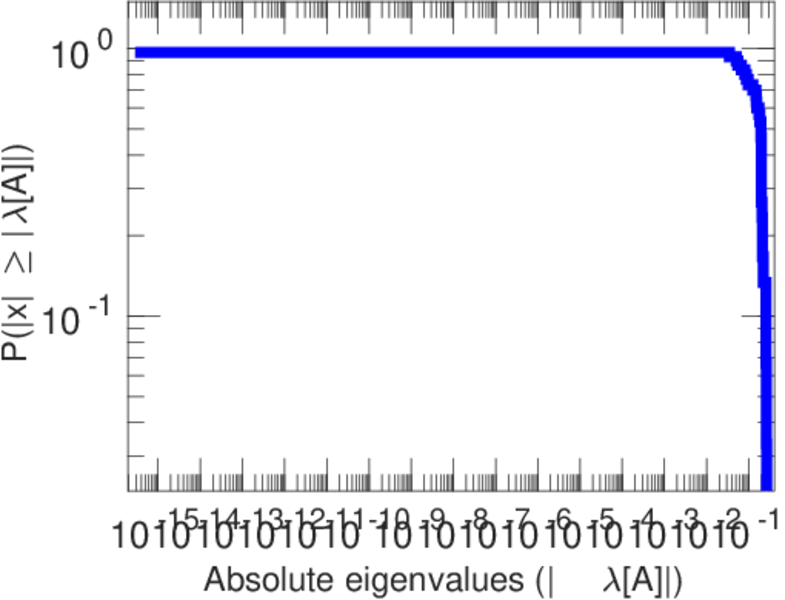
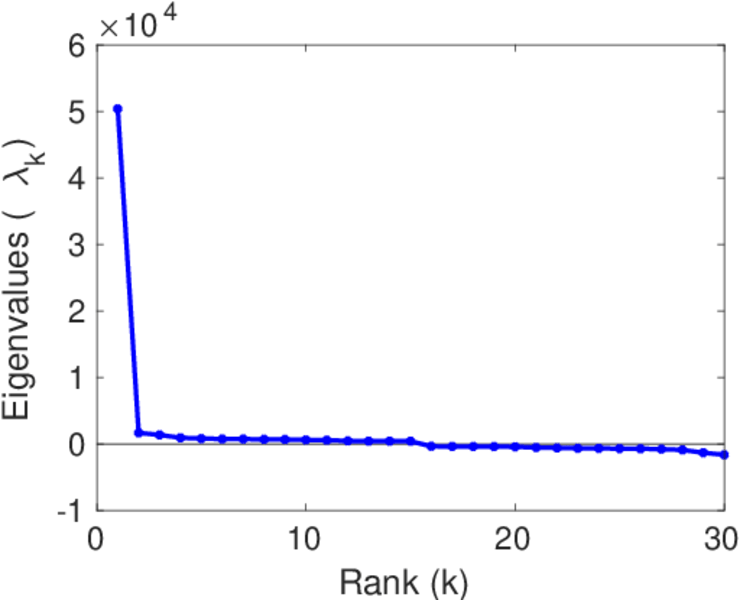
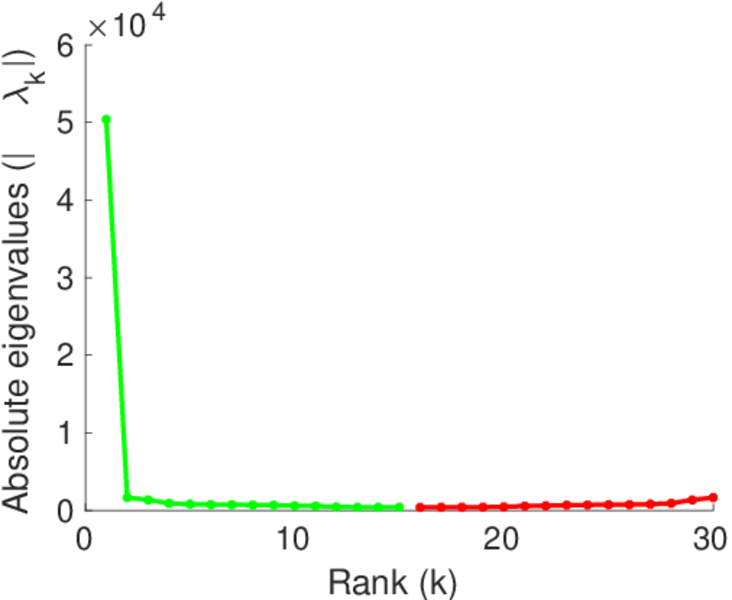
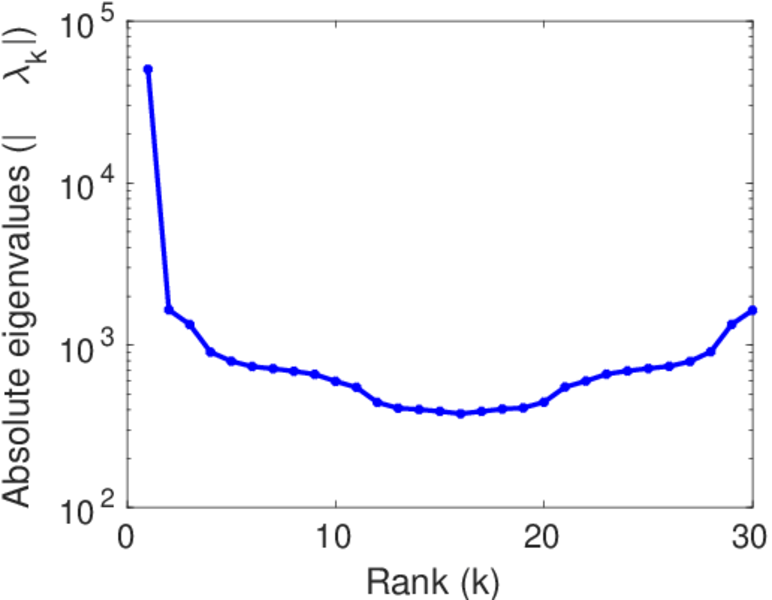
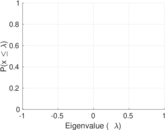
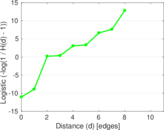
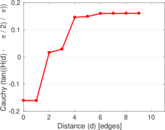
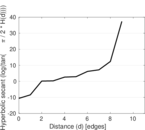
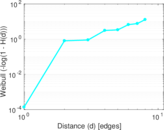
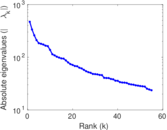
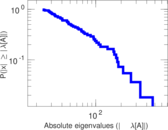
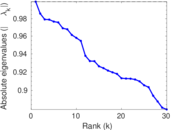
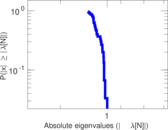
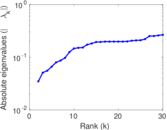
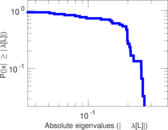
Plots


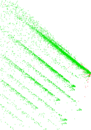

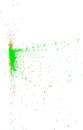


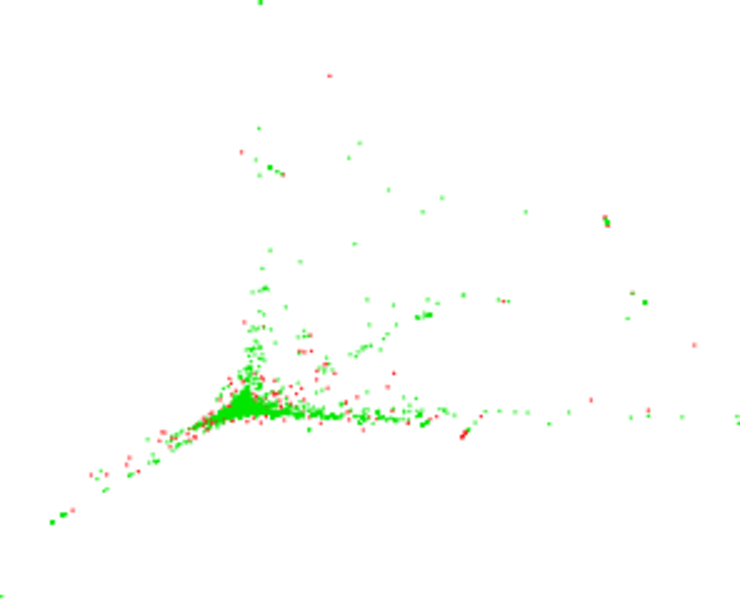
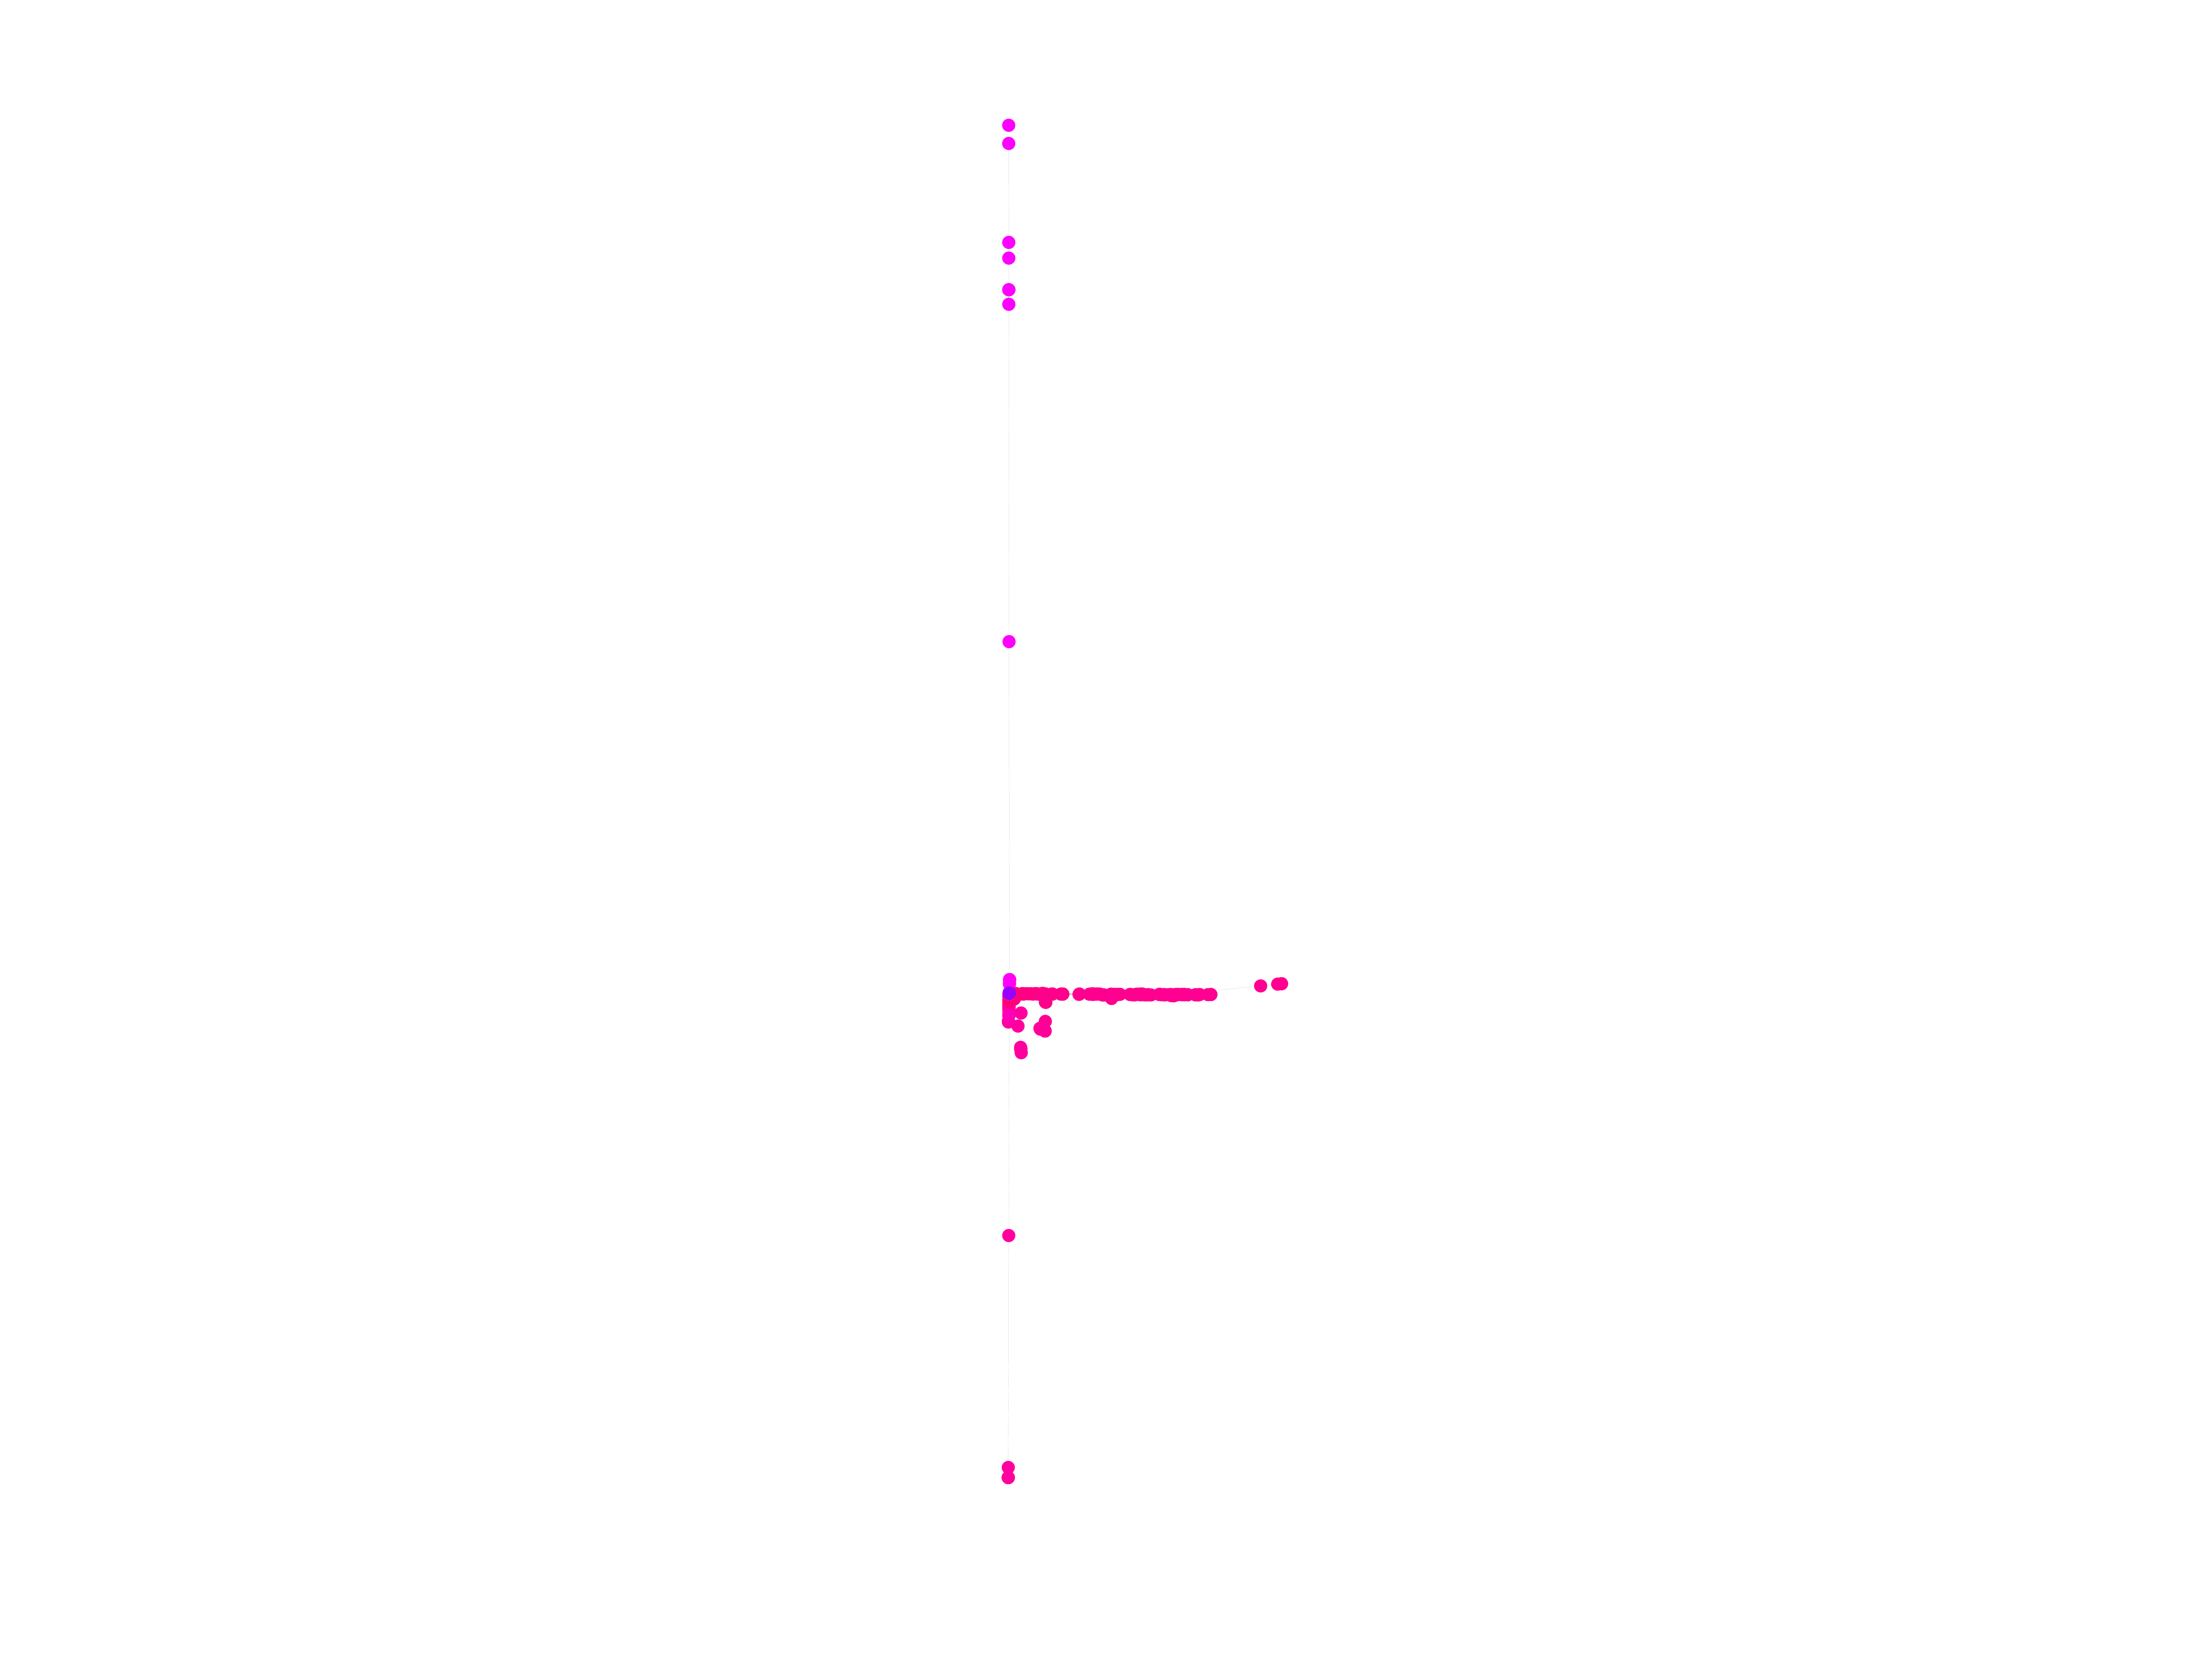
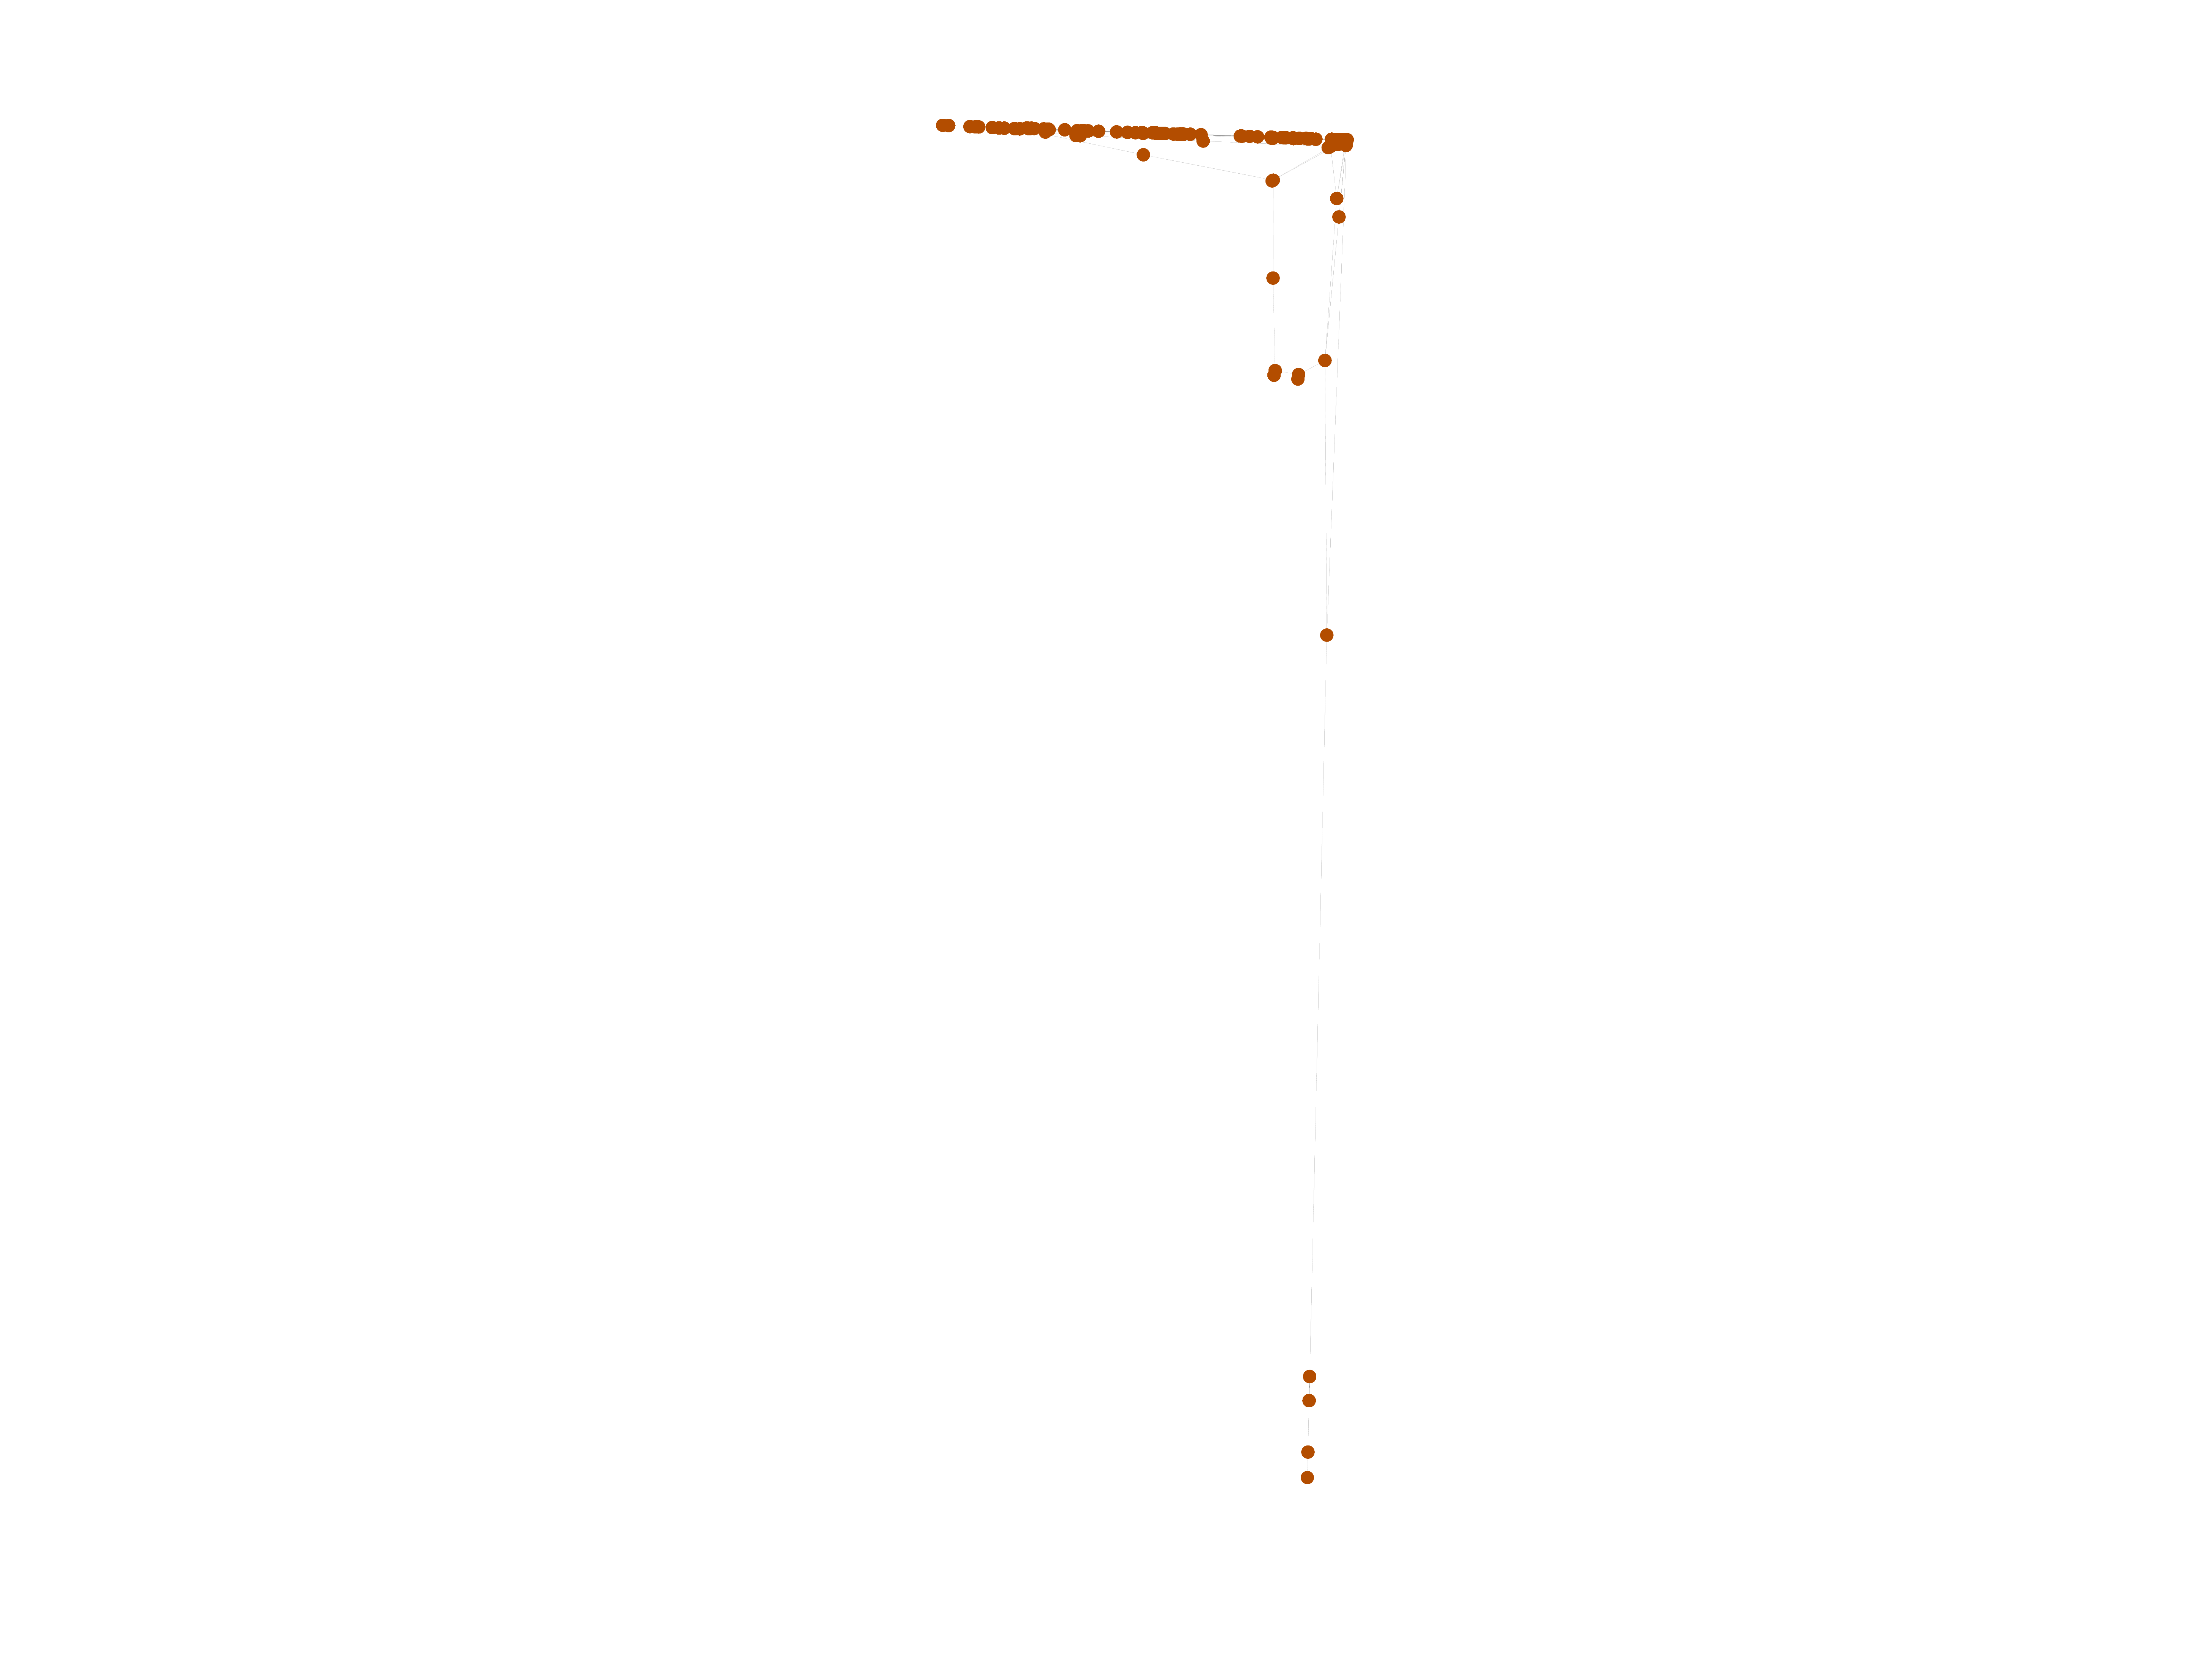
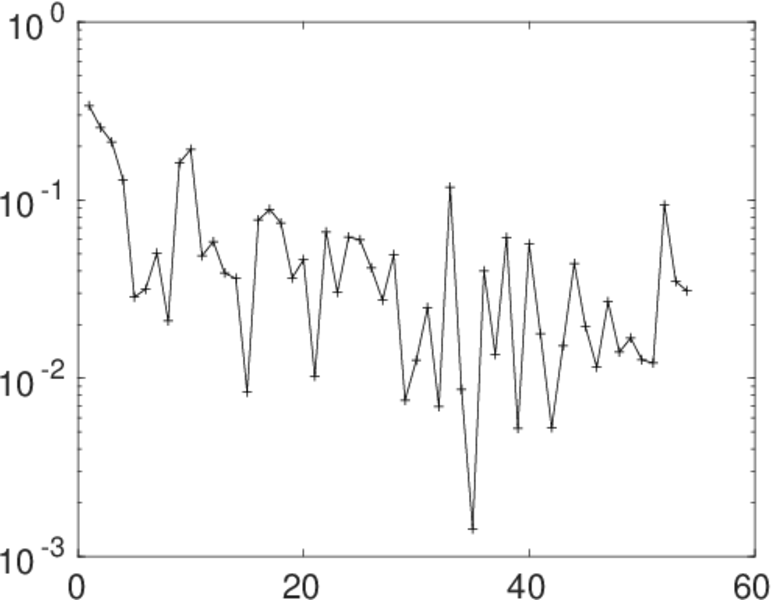
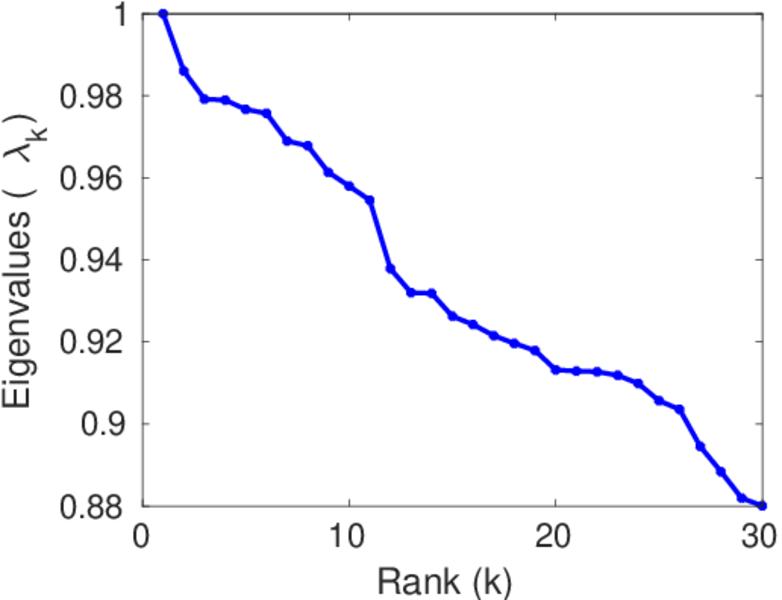
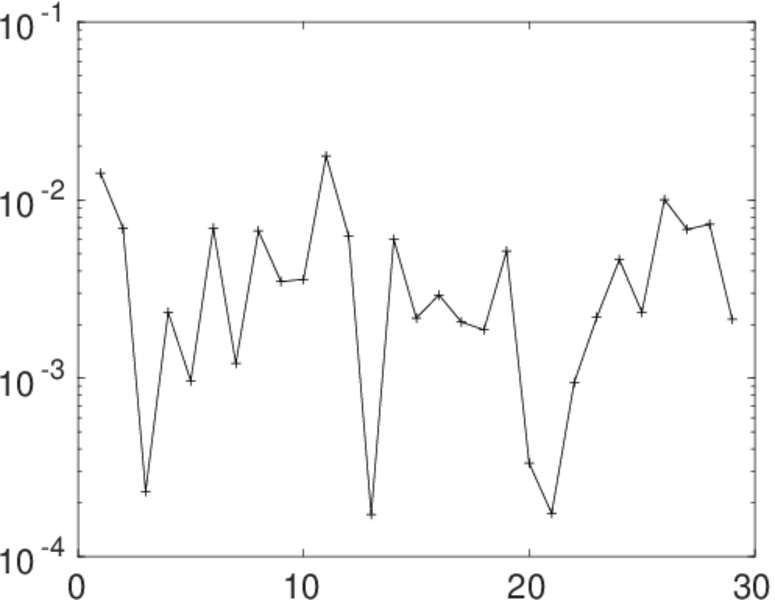
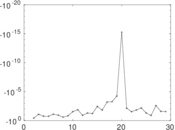
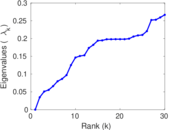
Matrix decompositions plots


Downloads
References
|
[1]
|
Jérôme Kunegis.
KONECT – The Koblenz Network Collection.
In Proc. Int. Conf. on World Wide Web Companion, pages
1343–1350, 2013.
[ http ]
|
|
[2]
|
Wikimedia Foundation.
Wikimedia downloads.
http://dumps.wikimedia.org/, January 2010.
|
 KONECT ‣ Networks ‣
Buy Me a Coffee
KONECT ‣ Networks ‣
Buy Me a Coffee