Wikinews edits (de)
This is the bipartite edit network of the German Wikinews. It contains users
and pages from the German Wikinews, connected by edit events. Each edge
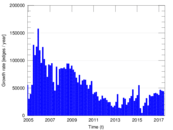
represents an edit. The dataset includes the timestamp of each edit.
Metadata
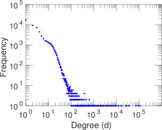
Statistics
| Size | n = | 61,822
|
| Left size | n1 = | 3,207
|
| Right size | n2 = | 58,615
|
| Volume | m = | 686,017
|
| Unique edge count | m̿ = | 180,886
|
| Wedge count | s = | 598,483,565
|
| Claw count | z = | 2,754,672,179,723
|
| Cross count | x = | 11,589,685,623,396,774
|
| Square count | q = | 217,564,517
|
| 4-Tour count | T4 = | 4,135,111,392
|
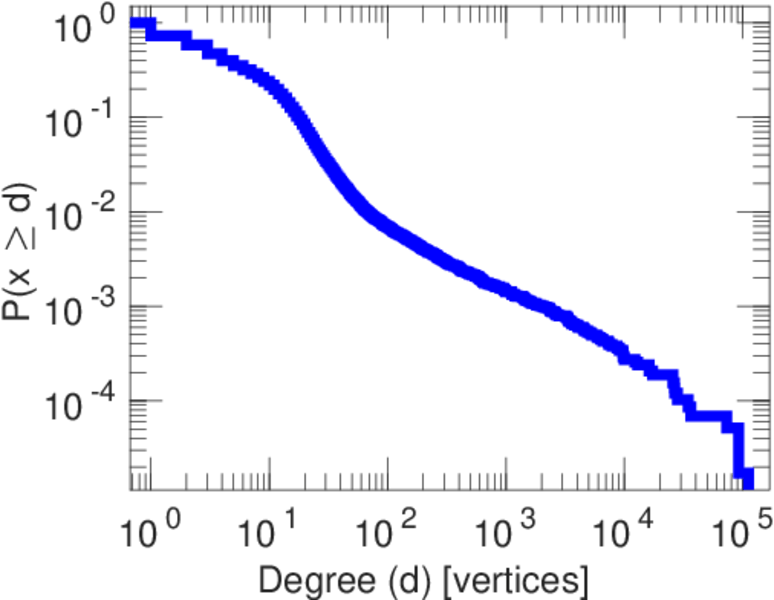
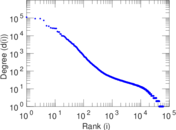
| Maximum degree | dmax = | 111,872
|
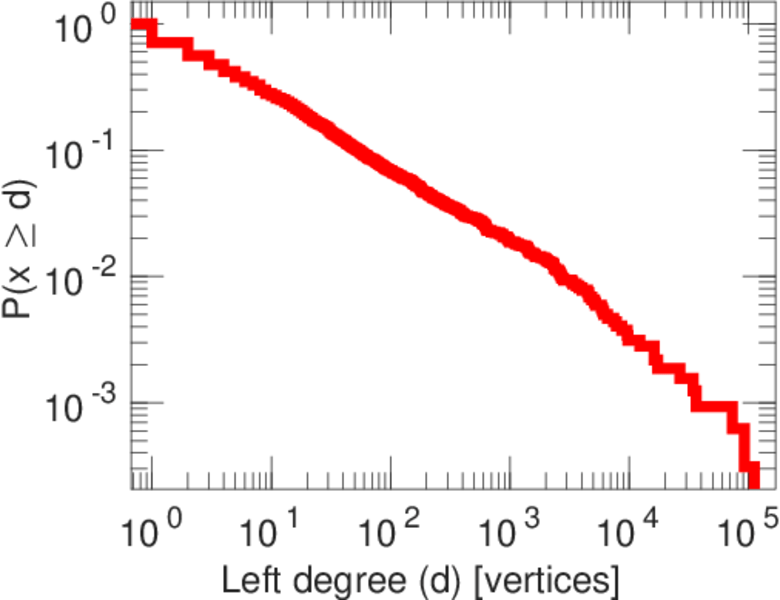
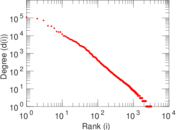
| Maximum left degree | d1max = | 111,872
|
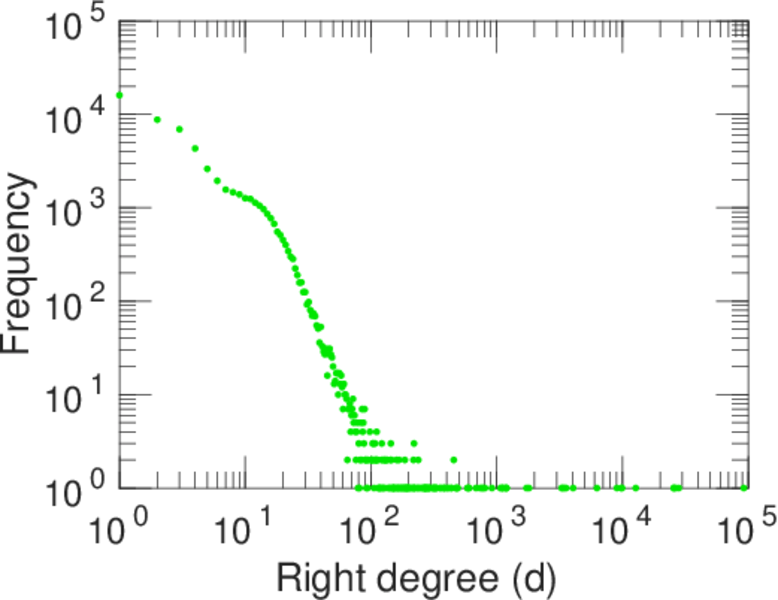
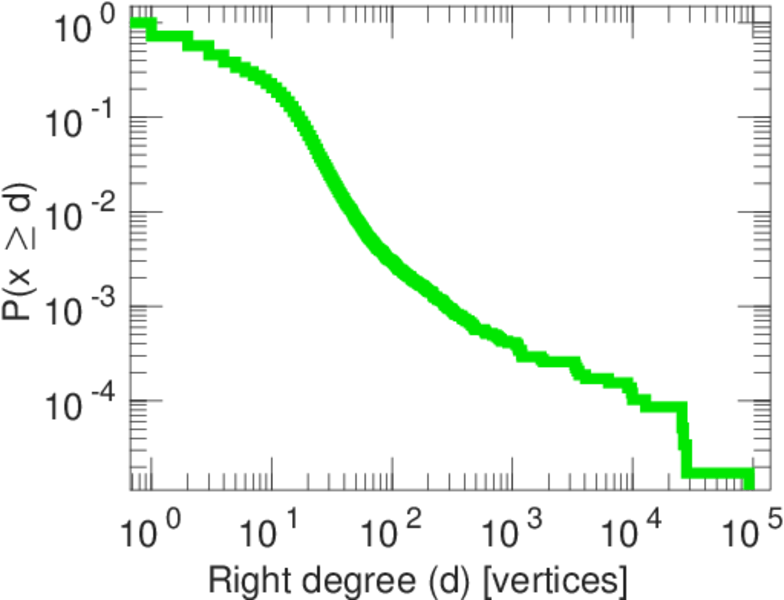
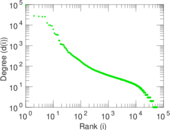
| Maximum right degree | d2max = | 92,470
|
| Average degree | d = | 22.193 3
|
| Average left degree | d1 = | 213.912
|
| Average right degree | d2 = | 11.703 8
|
| Fill | p = | 0.000 962 271
|
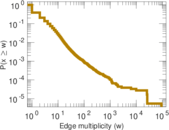
| Average edge multiplicity | m̃ = | 3.792 54
|
| Size of LCC | N = | 60,647
|
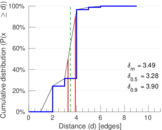
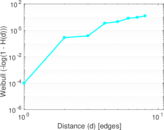
| Diameter | δ = | 11
|
| 50-Percentile effective diameter | δ0.5 = | 3.283 97
|
| 90-Percentile effective diameter | δ0.9 = | 3.898 47
|
| Median distance | δM = | 4
|
| Mean distance | δm = | 3.487 60
|
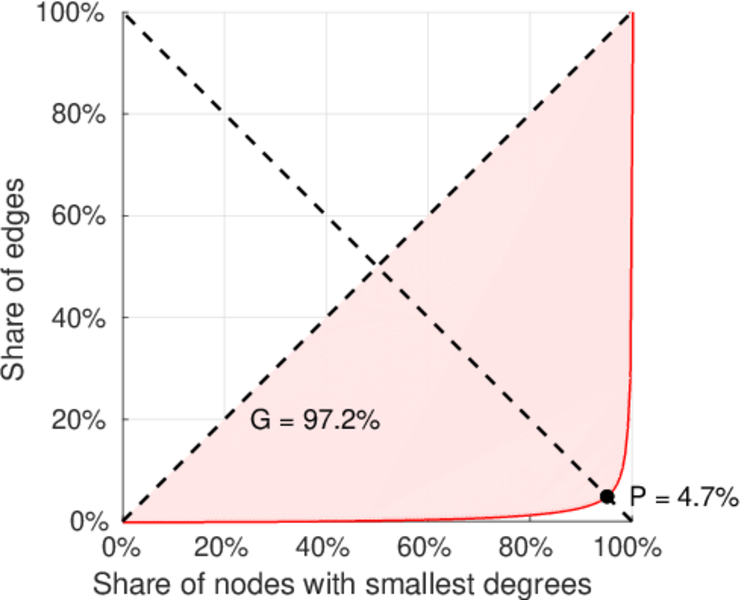
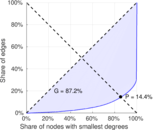
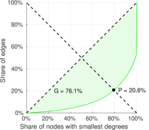
| Gini coefficient | G = | 0.874 336
|
| Balanced inequality ratio | P = | 0.142 609
|
| Left balanced inequality ratio | P1 = | 0.047 098 0
|
| Right balanced inequality ratio | P2 = | 0.205 969
|
| Relative edge distribution entropy | Her = | 0.744 889
|
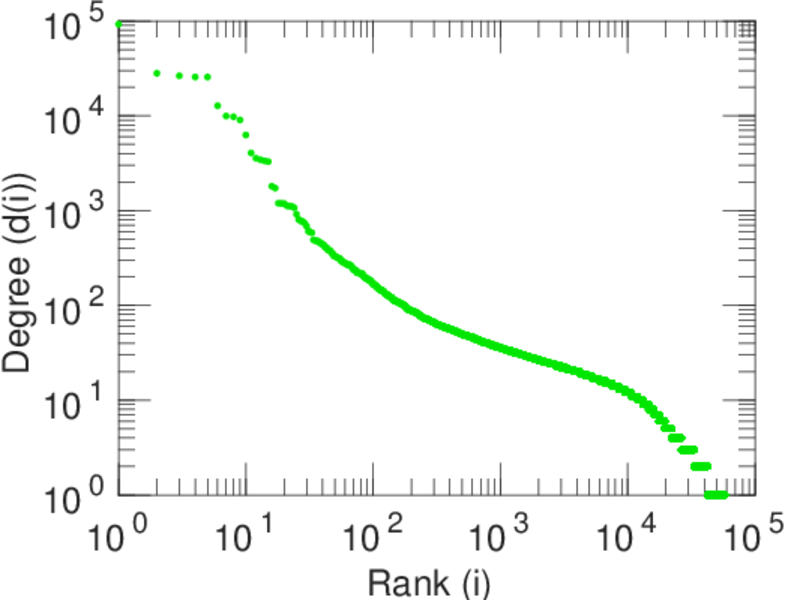
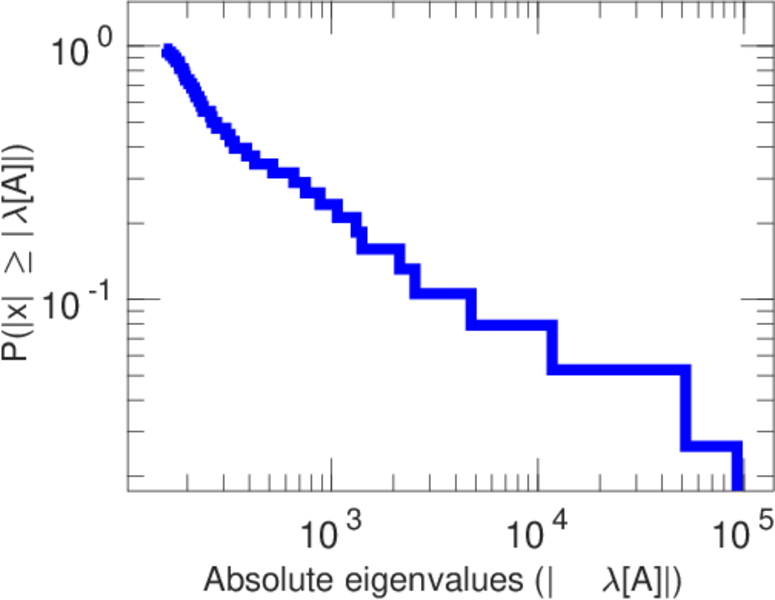
| Power law exponent | γ = | 2.213 47
|
| Tail power law exponent | γt = | 1.691 00
|
| Tail power law exponent with p | γ3 = | 1.691 00
|
| p-value | p = | 0.222 000
|
| Left tail power law exponent with p | γ3,1 = | 1.671 00
|
| Left p-value | p1 = | 0.963 000
|
| Right tail power law exponent with p | γ3,2 = | 4.651 00
|
| Right p-value | p2 = | 0.000 00
|
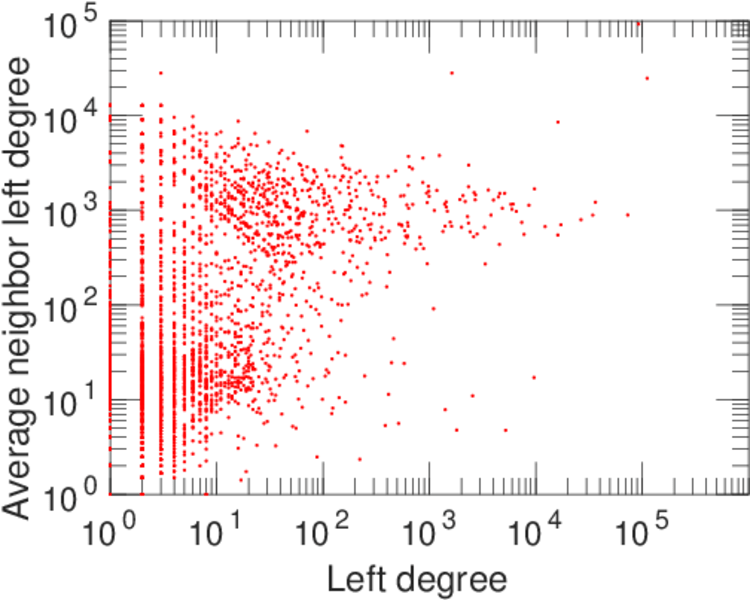
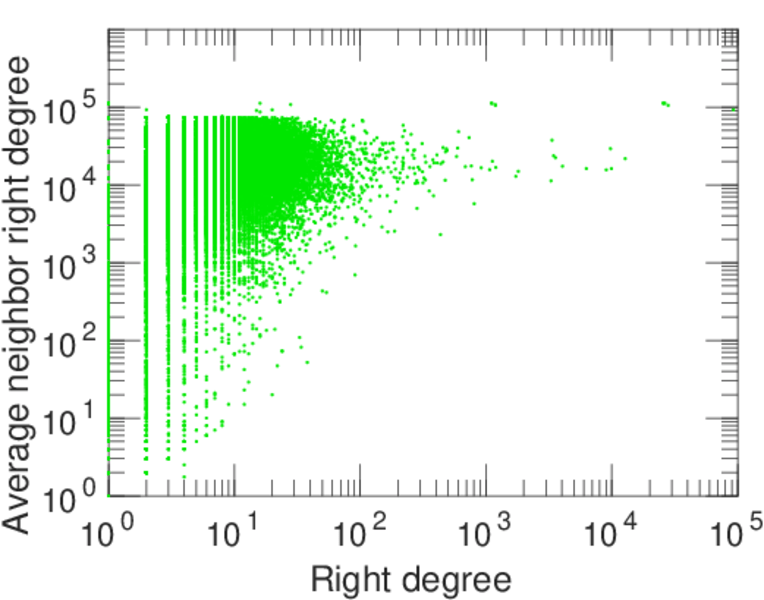
| Degree assortativity | ρ = | −0.110 599
|
| Degree assortativity p-value | pρ = | 0.000 00
|
| Spectral norm | α = | 92,455.0
|
| Algebraic connectivity | a = | 0.066 898 1
|
| Spectral separation | |λ1[A] / λ2[A]| = | 1.773 30
|
| Controllability | C = | 55,414
|
| Relative controllability | Cr = | 0.902 552
|
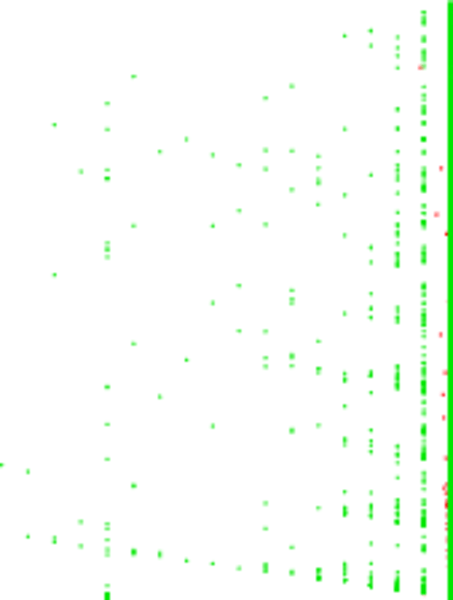
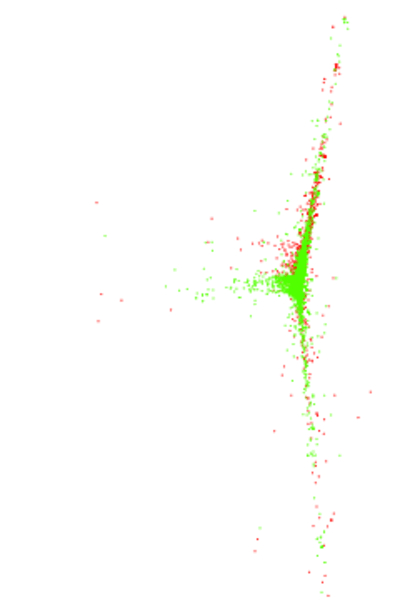
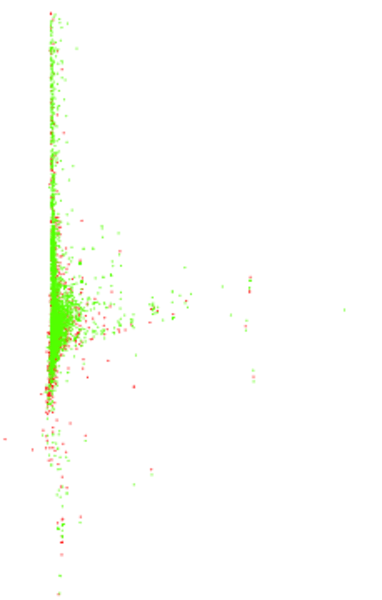
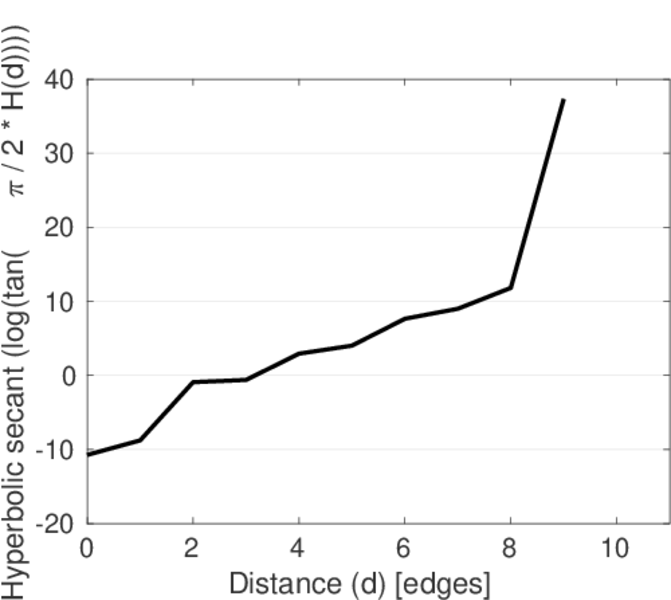
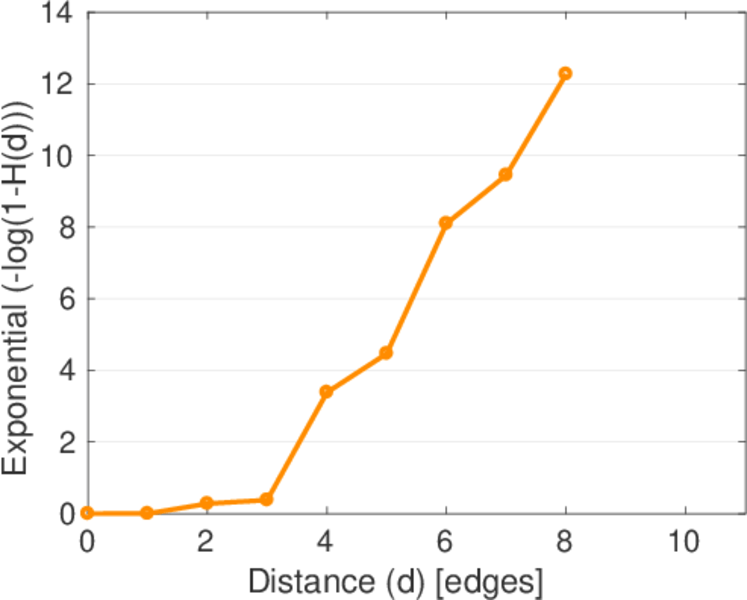
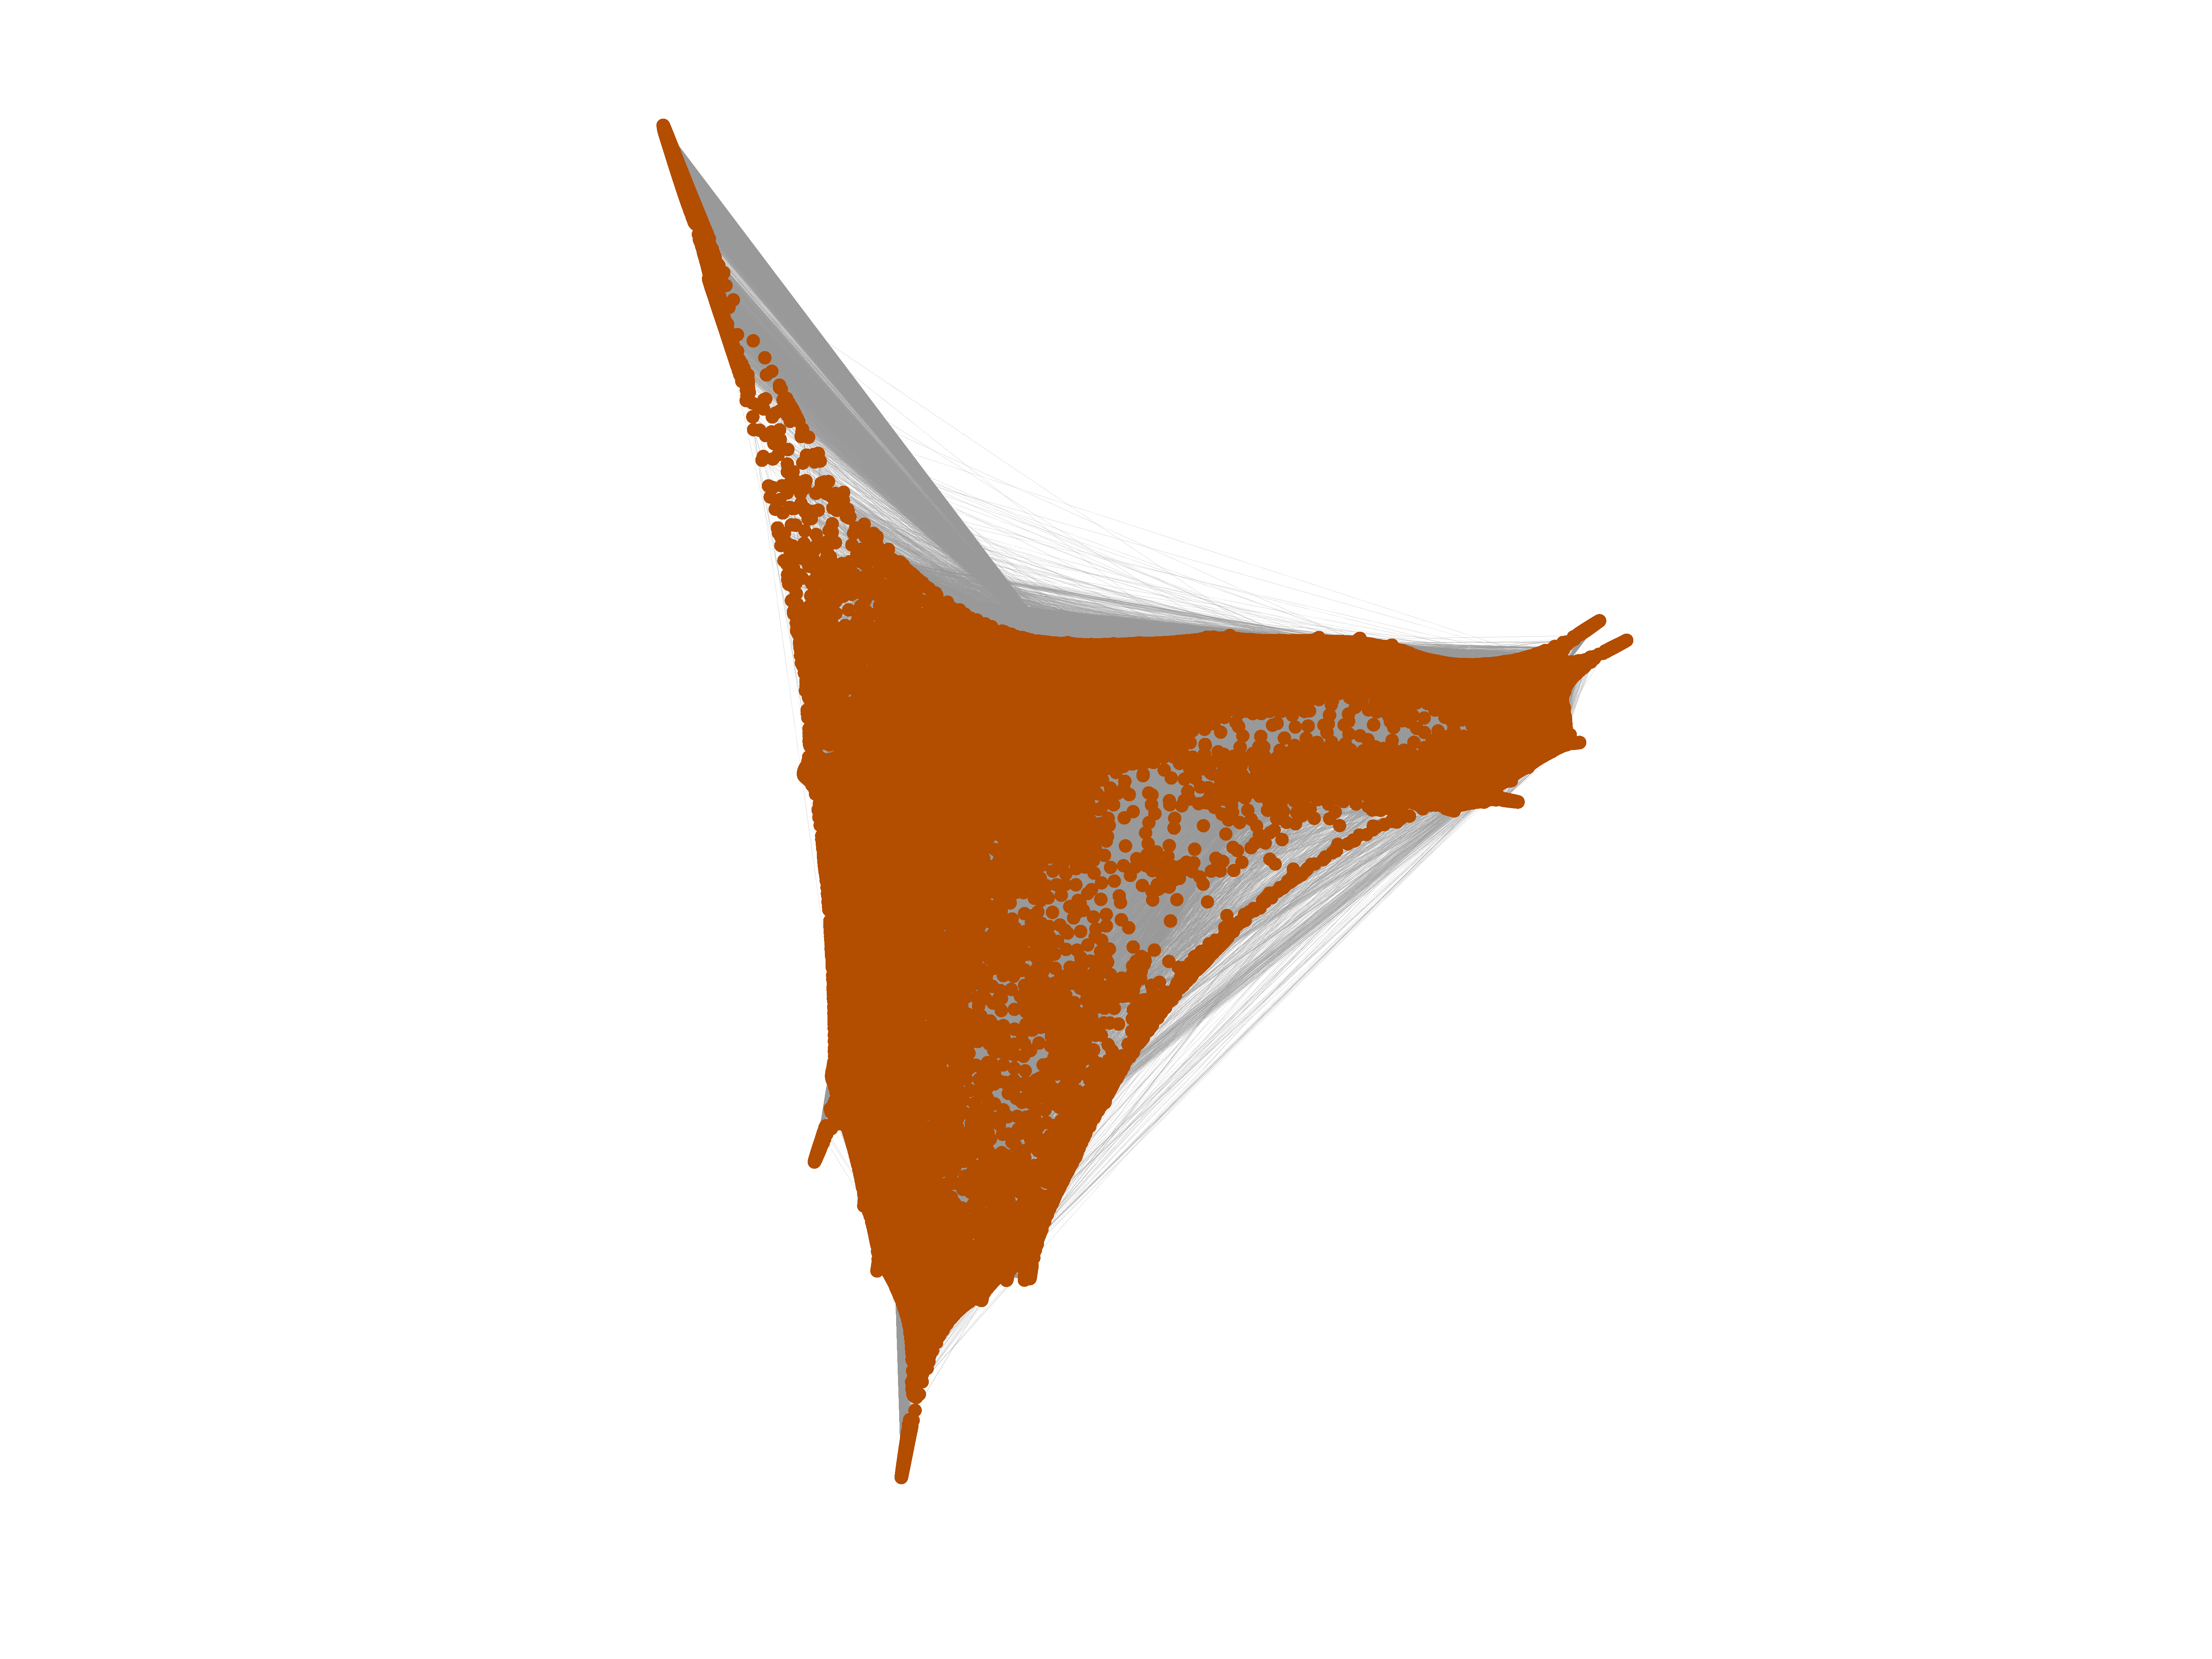
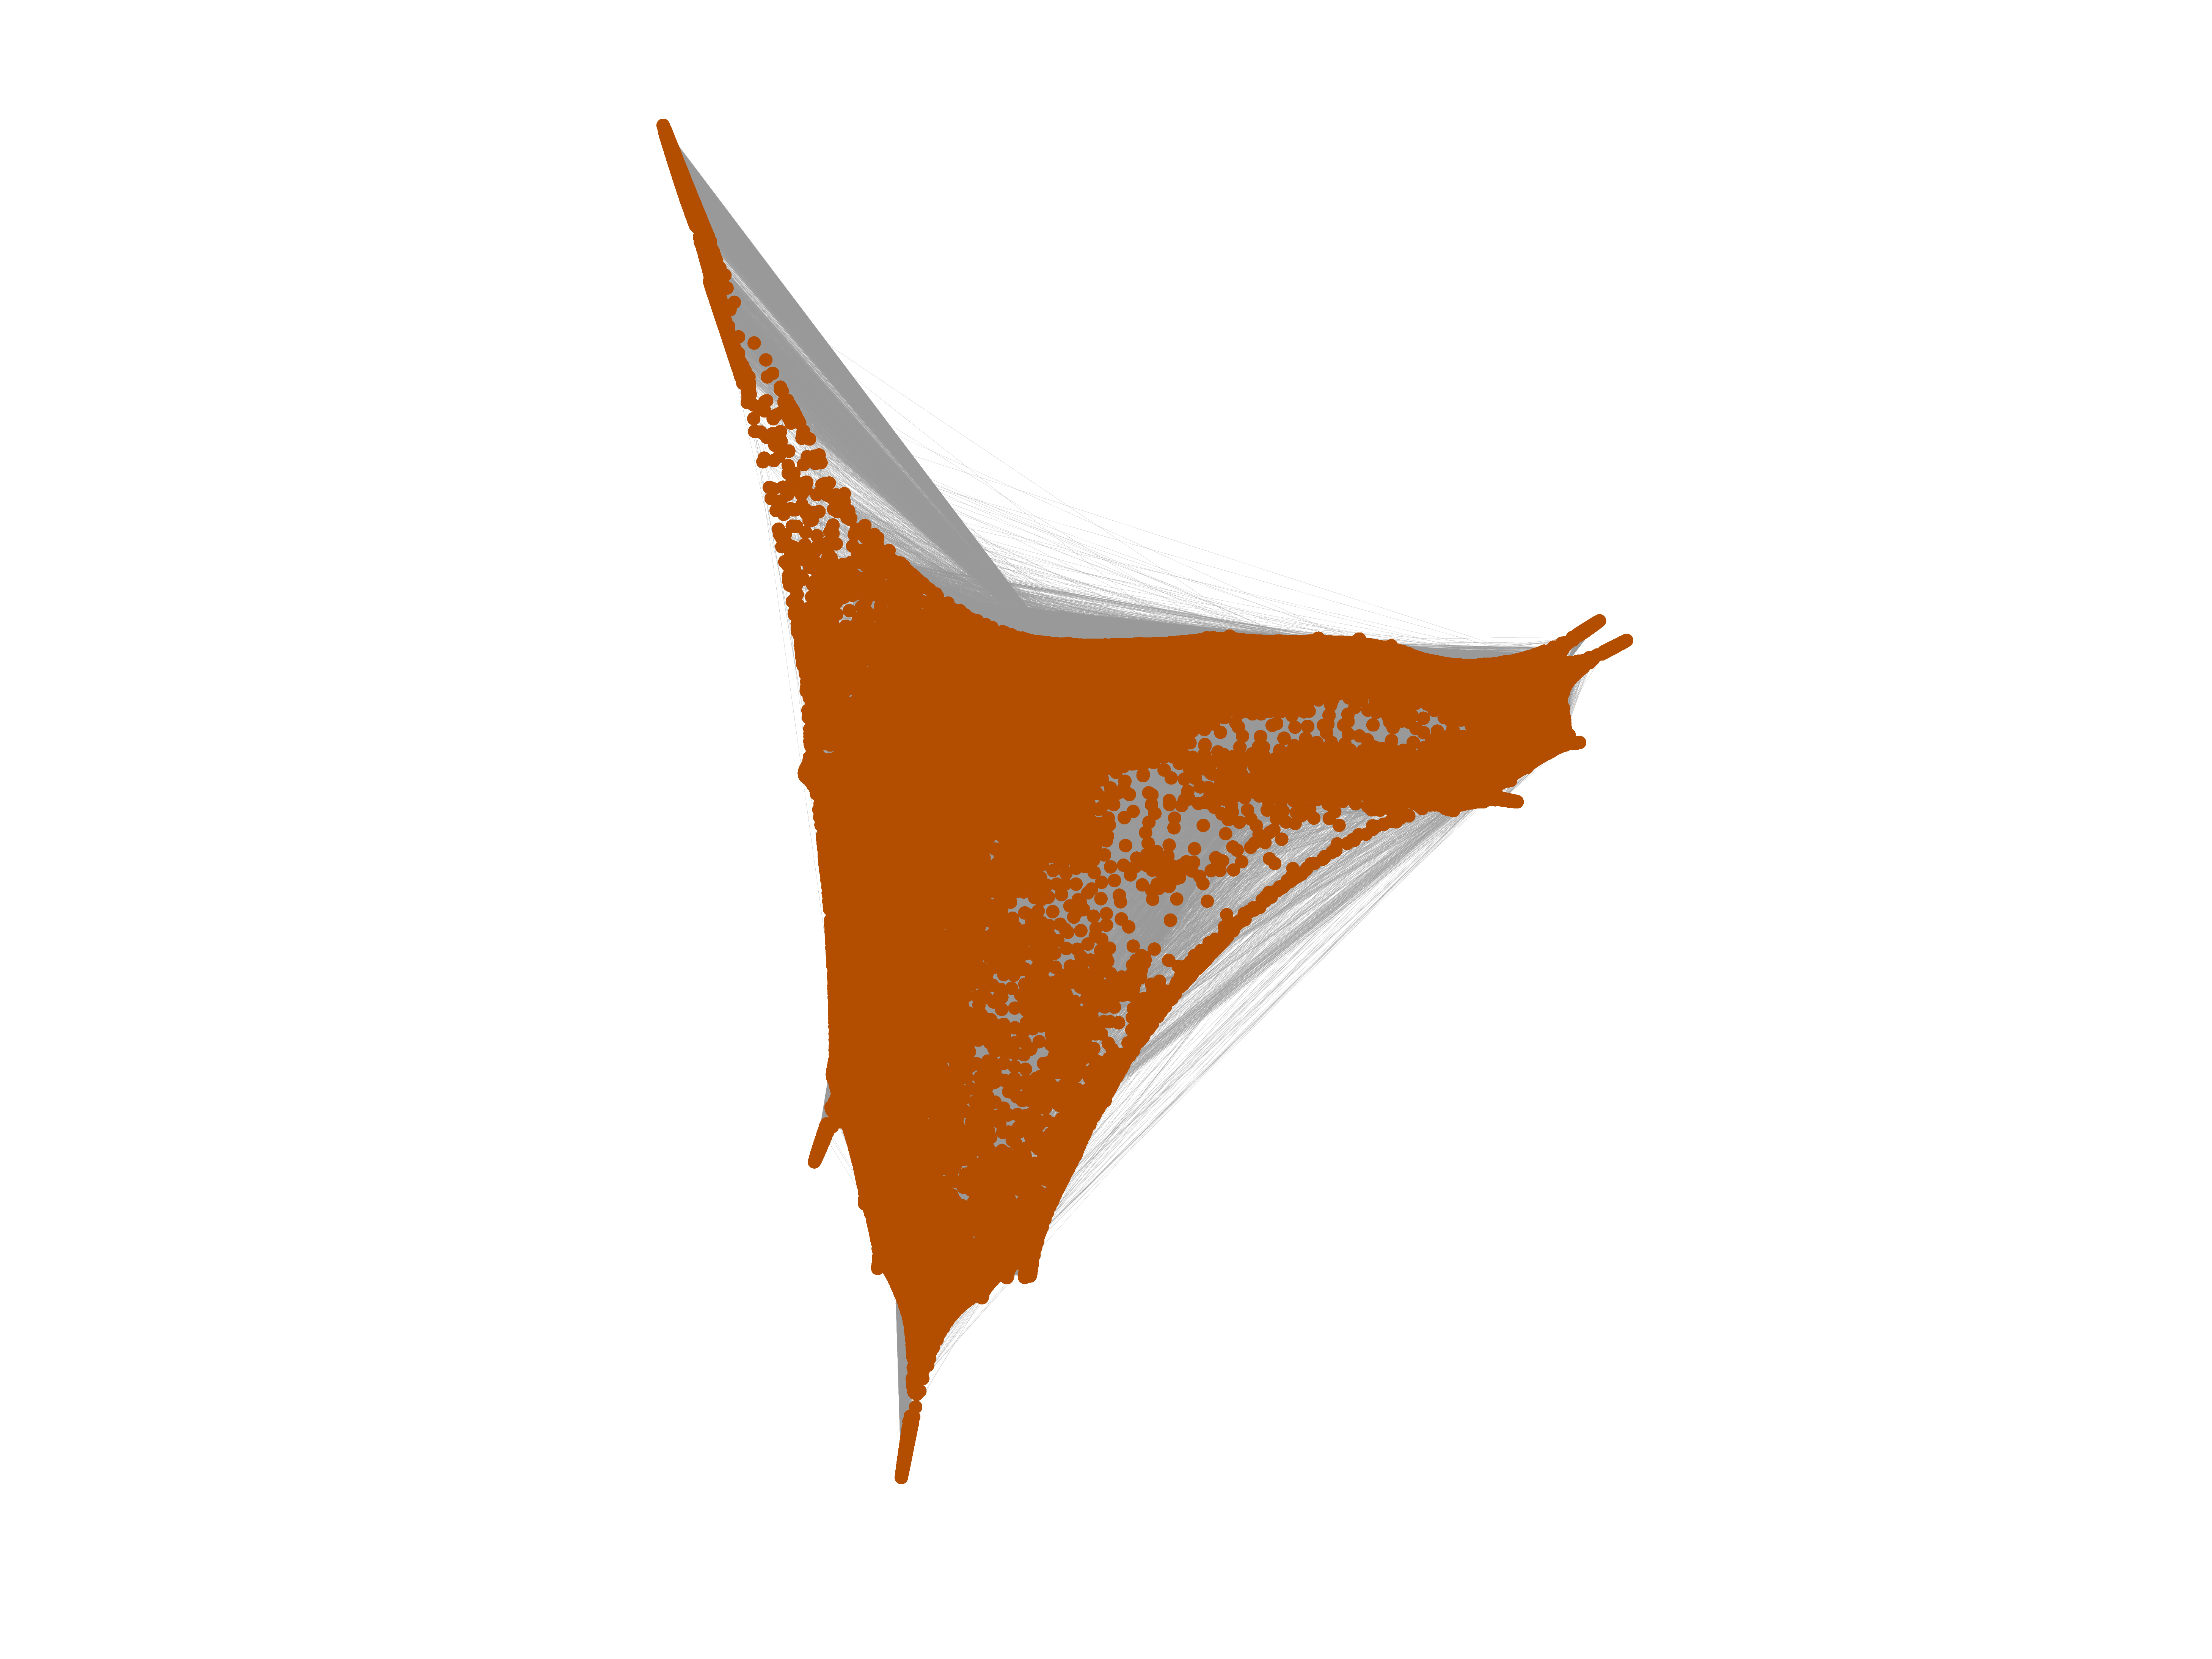
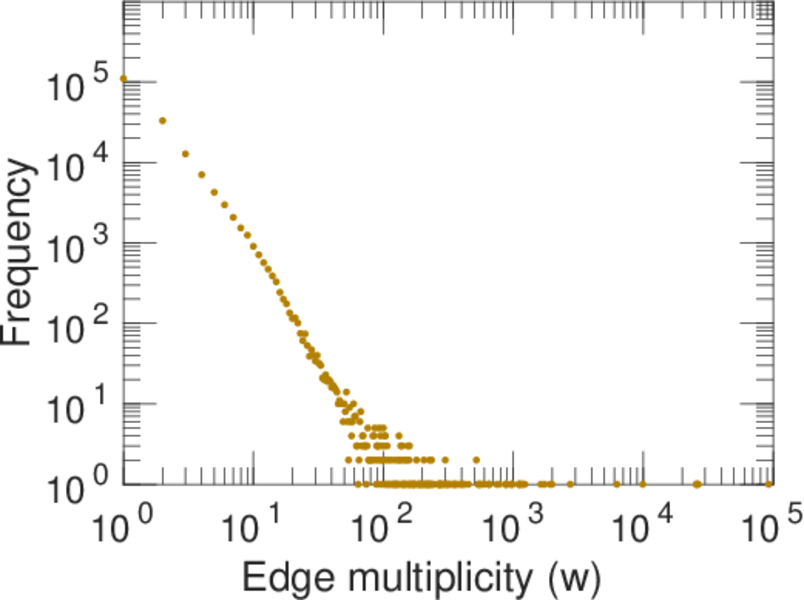
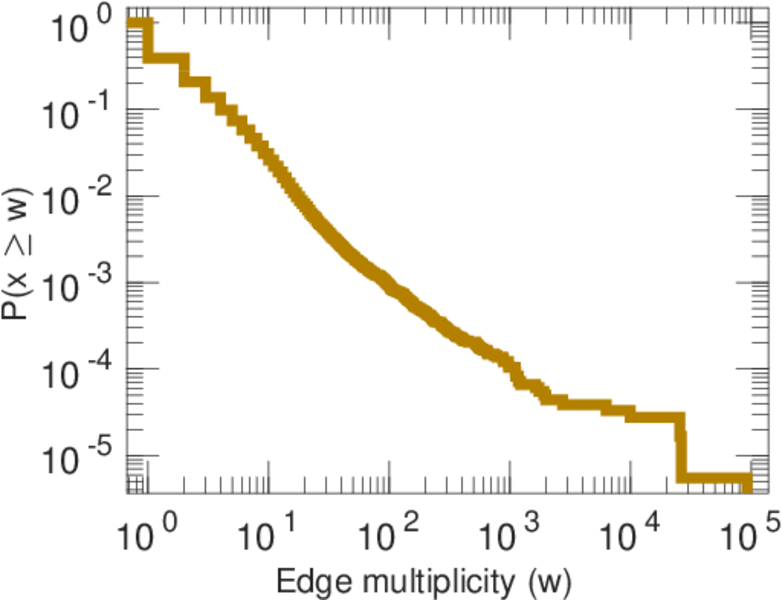
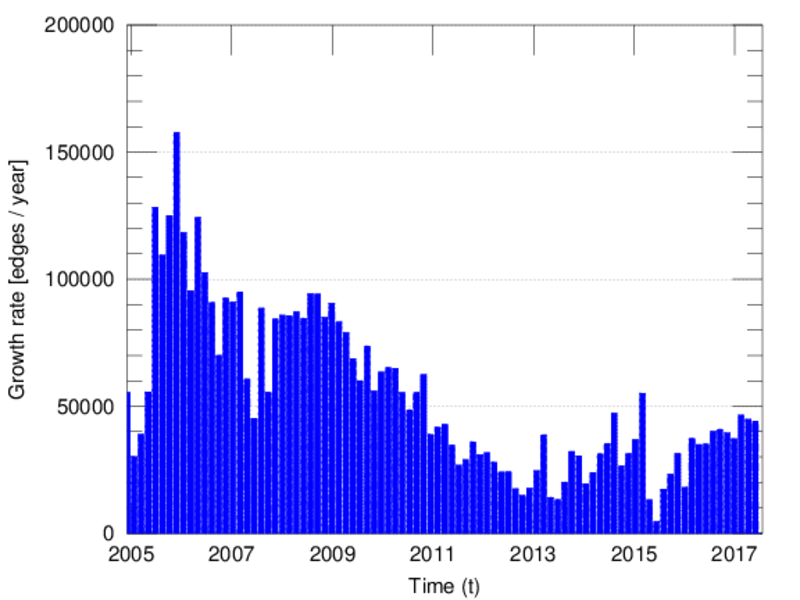
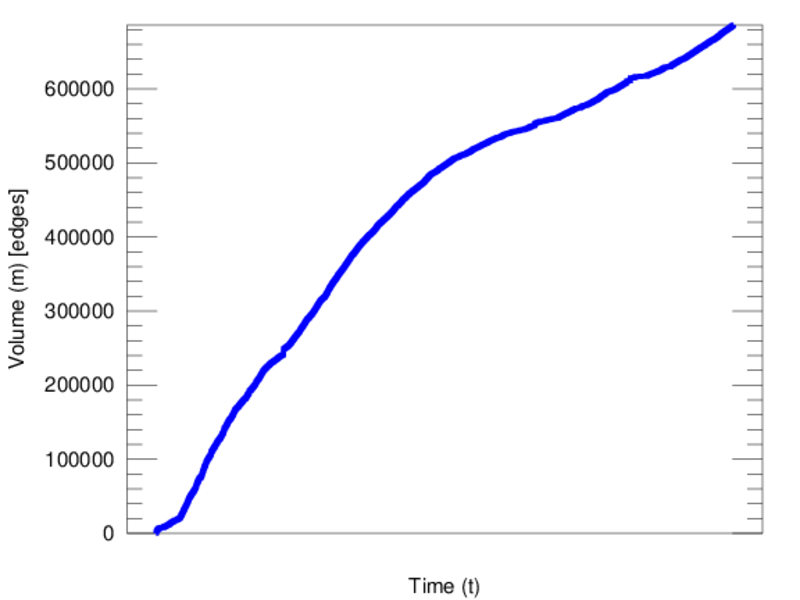
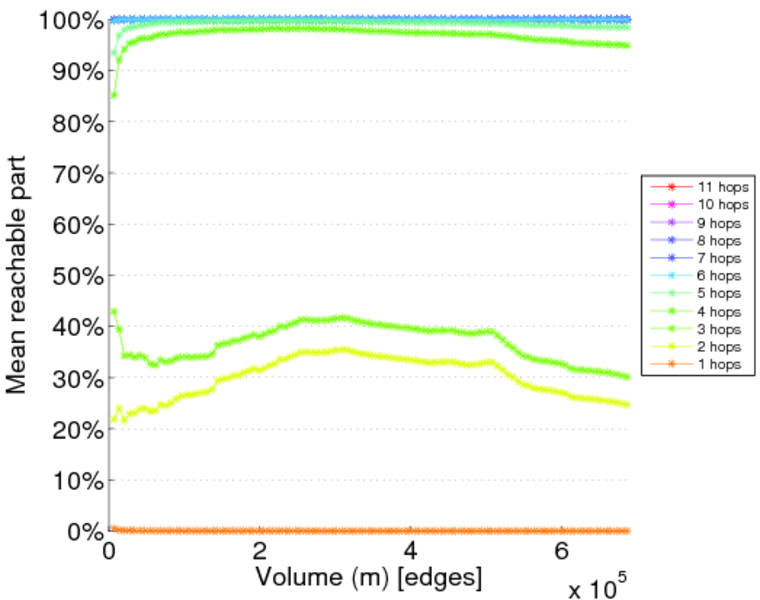
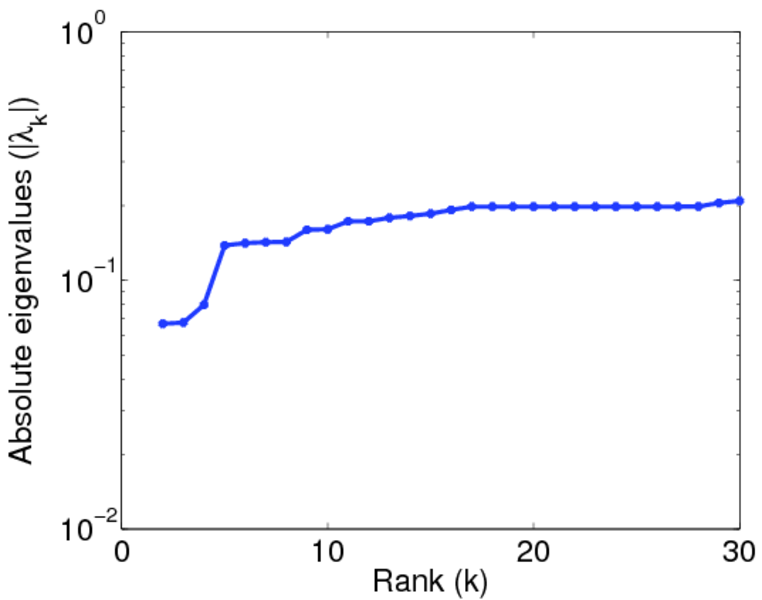
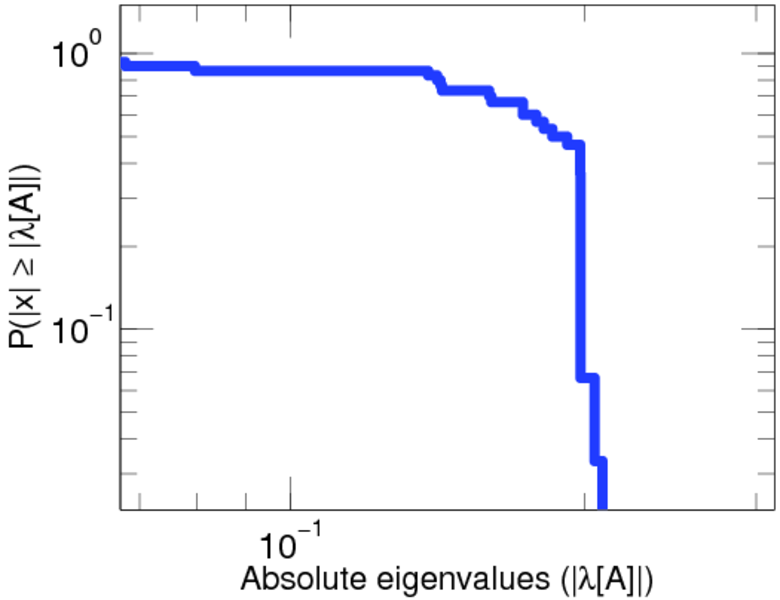
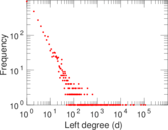
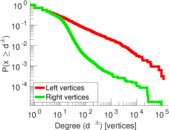
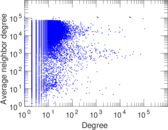
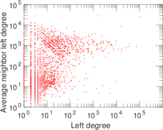
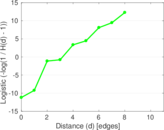
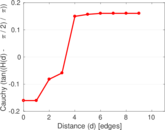
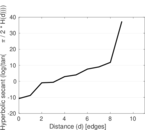
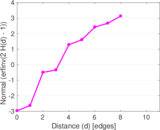
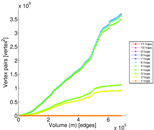
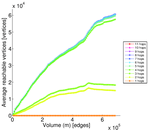
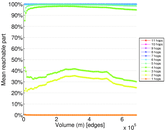
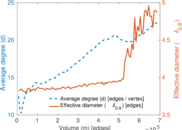
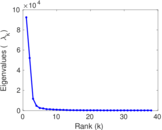
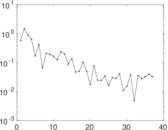
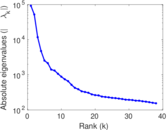
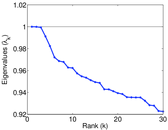
Plots


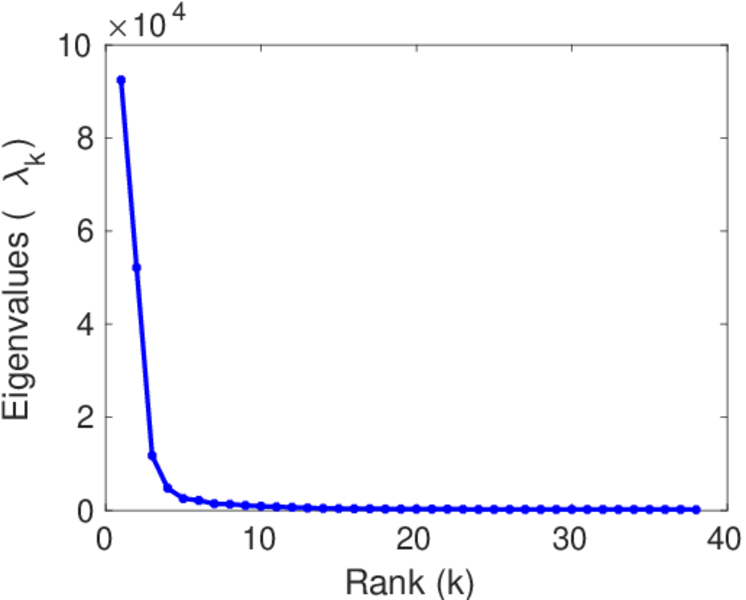
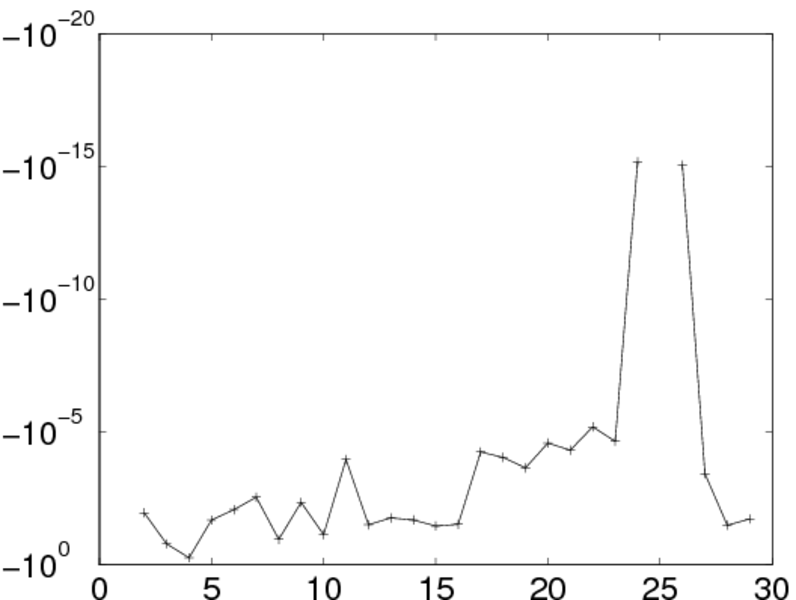
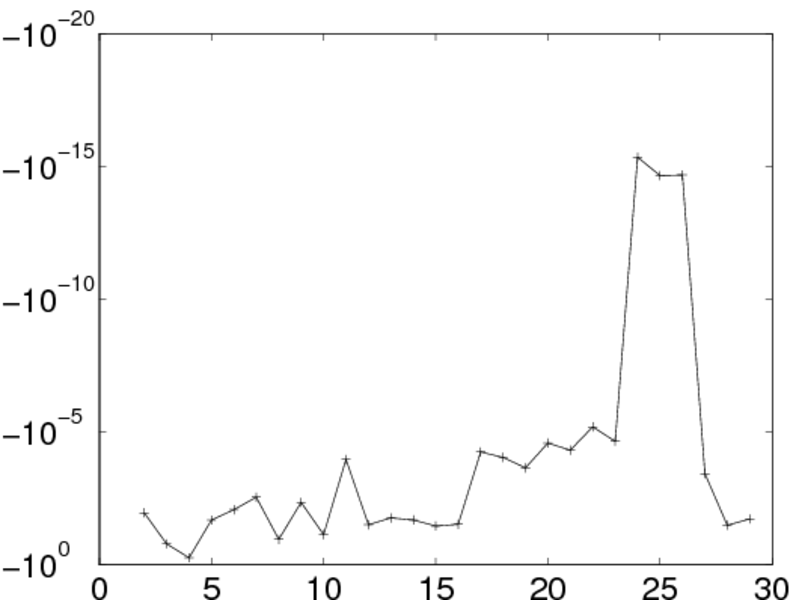
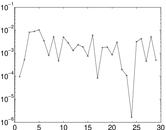
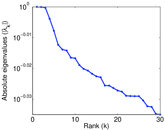
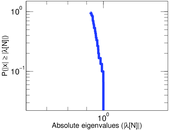
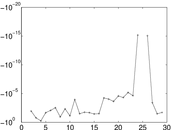
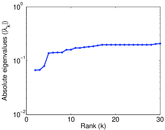
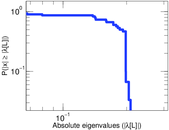
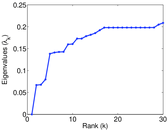
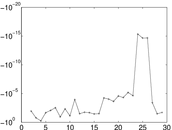
Matrix decompositions plots


Downloads
References
|
[1]
|
Jérôme Kunegis.
KONECT – The Koblenz Network Collection.
In Proc. Int. Conf. on World Wide Web Companion, pages
1343–1350, 2013.
[ http ]
|
|
[2]
|
Wikimedia Foundation.
Wikimedia downloads.
http://dumps.wikimedia.org/, January 2010.
|
 KONECT ‣ Networks ‣
Buy Me a Coffee
KONECT ‣ Networks ‣
Buy Me a Coffee