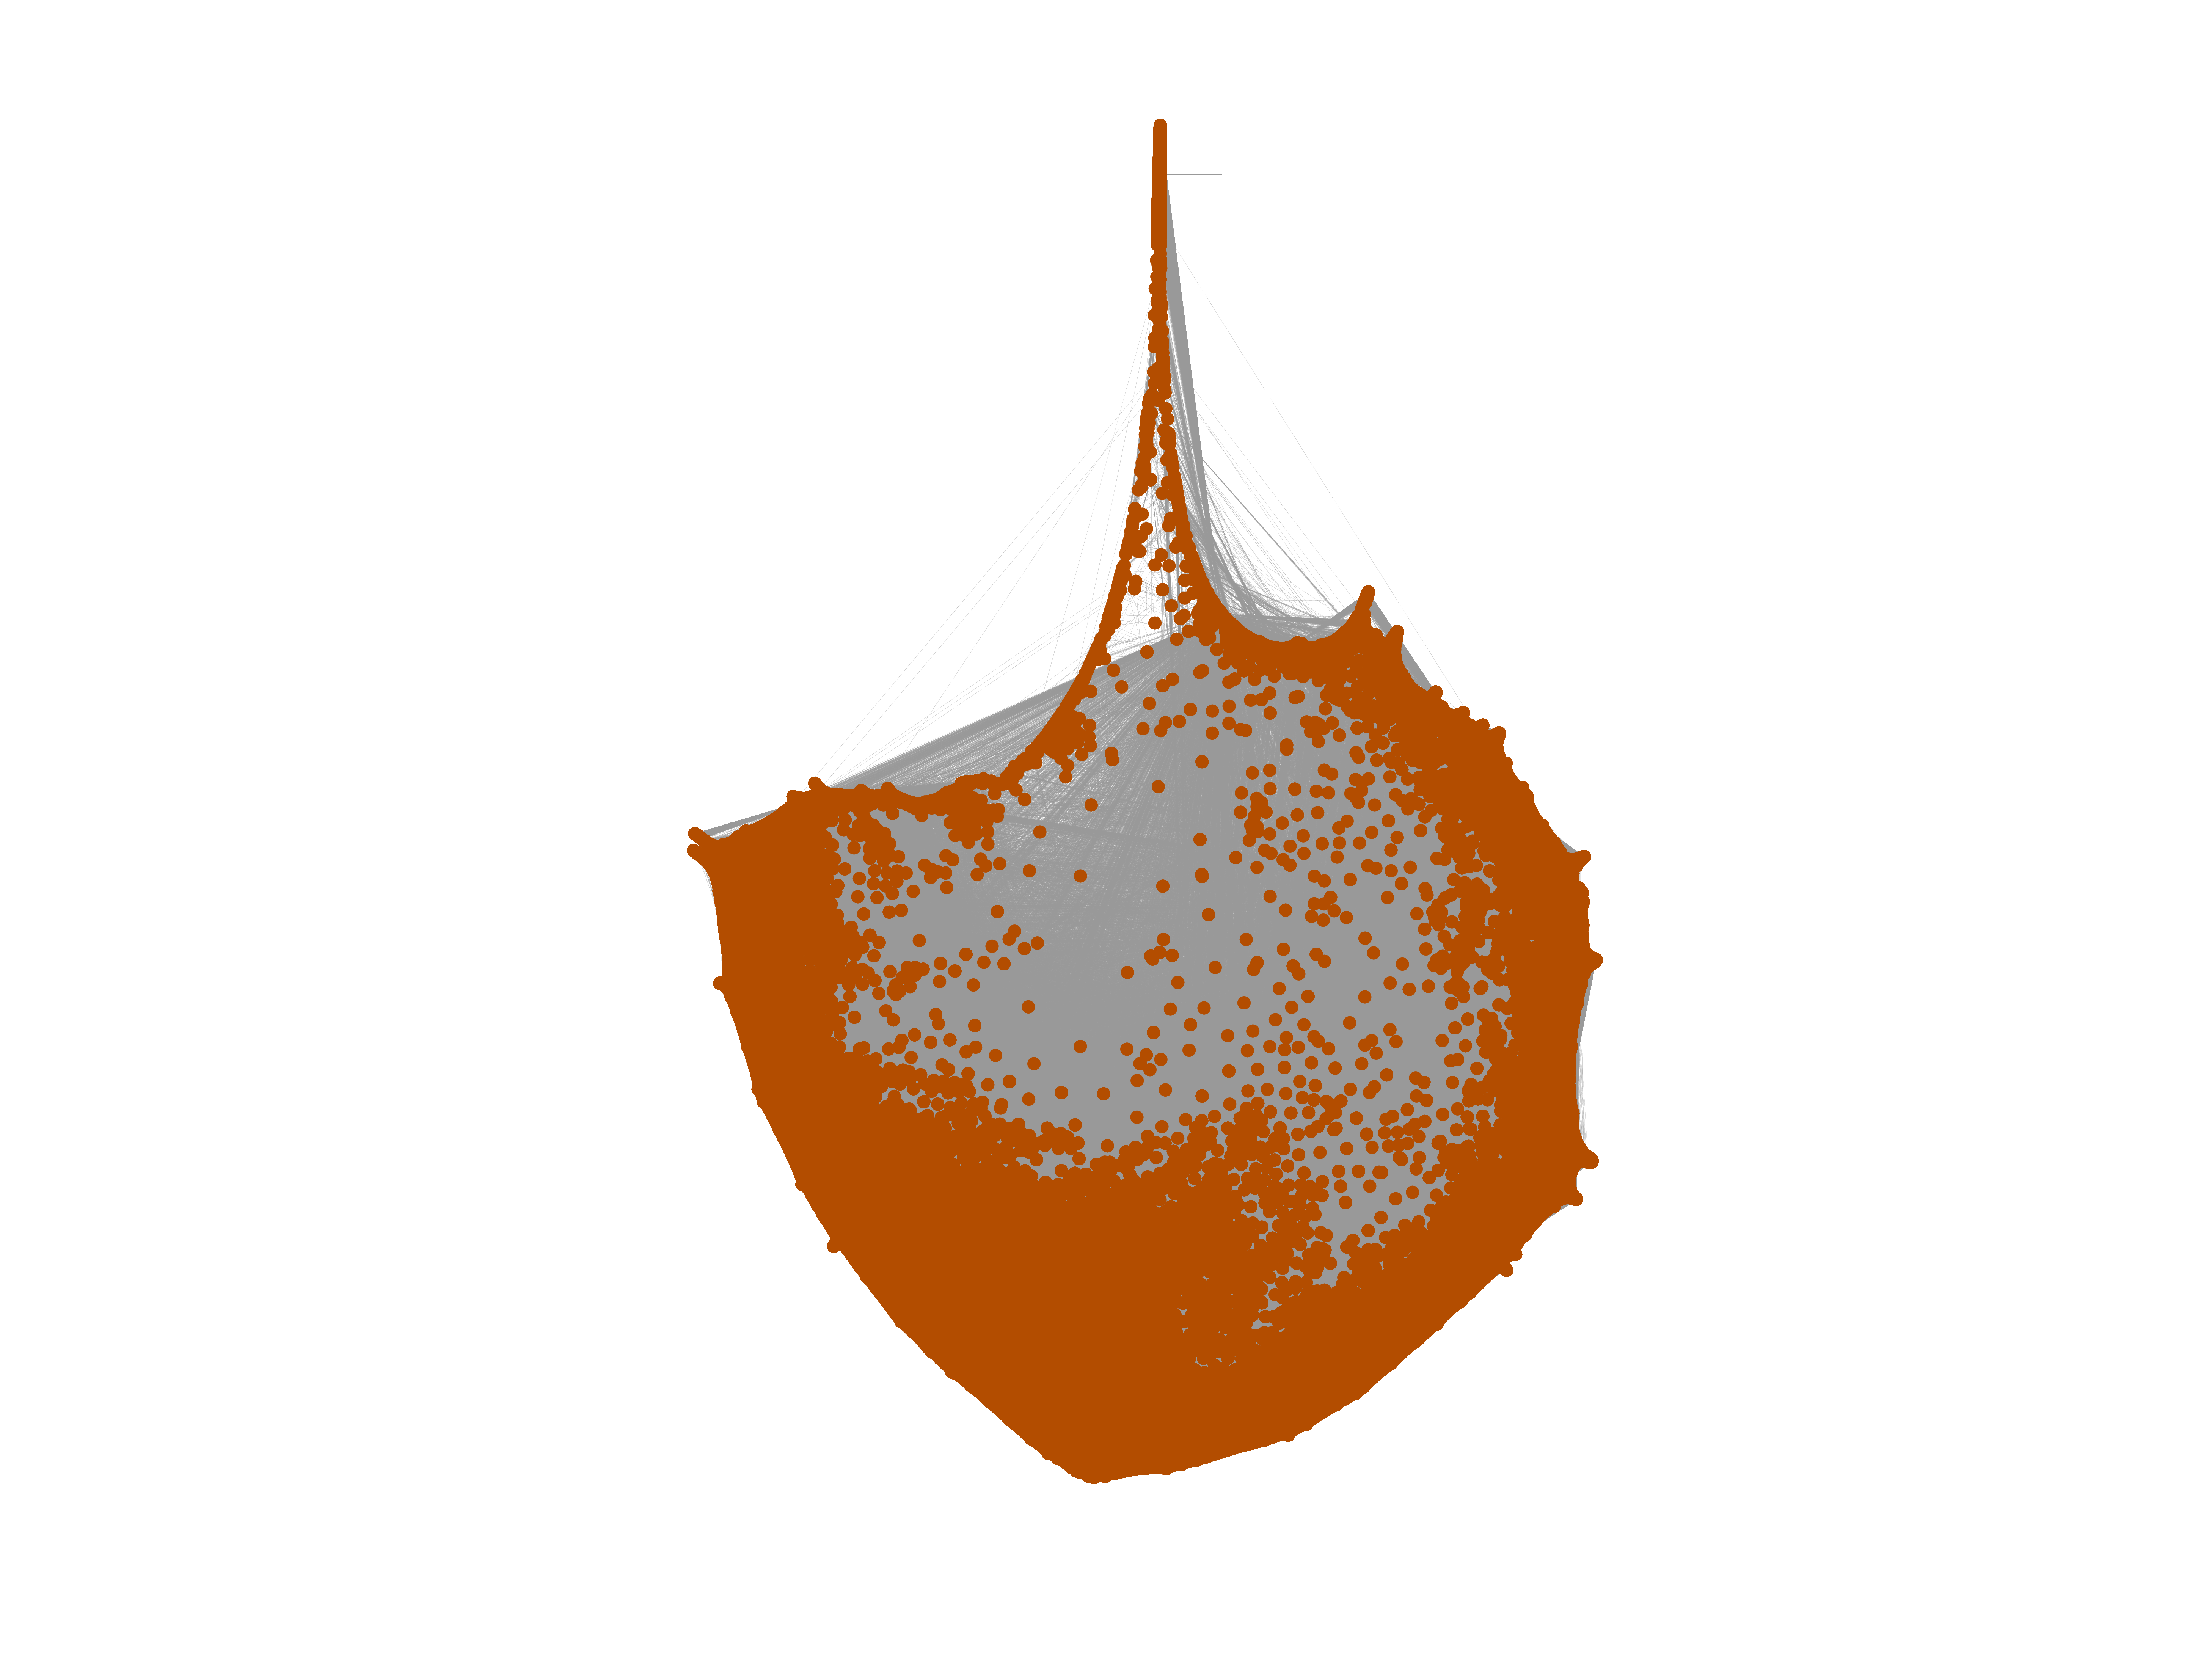
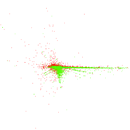
Wikiquote edits (de)
This is the bipartite edit network of the German Wikisource. It contains users
and pages from the German Wikisource, connected by edit events. Each edge
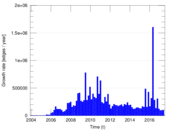
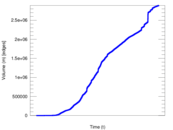
represents an edit. The dataset includes the timestamp of each edit.
Metadata
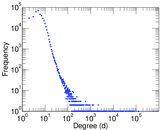
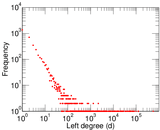
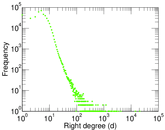
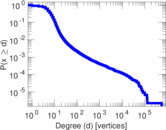
Statistics
| Size | n = | 447,892
|
| Left size | n1 = | 4,371
|
| Right size | n2 = | 443,521
|
| Volume | m = | 2,889,203
|
| Unique edge count | m̿ = | 1,772,388
|
| Wedge count | s = | 74,460,010,939
|
| Claw count | z = | 5,479,059,424,606,325
|
| Cross count | x = | 3.872 27 × 1020
|
| Square count | q = | 23,446,547,576
|
| 4-Tour count | T4 = | 485,416,160,492
|
| Maximum degree | dmax = | 561,627
|
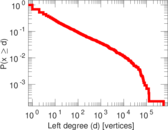
| Maximum left degree | d1max = | 561,627
|
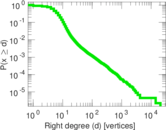
| Maximum right degree | d2max = | 20,767
|
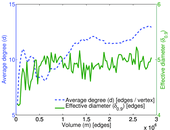
| Average degree | d = | 12.901 3
|
| Average left degree | d1 = | 660.994
|
| Average right degree | d2 = | 6.514 24
|
| Fill | p = | 0.000 914 248
|
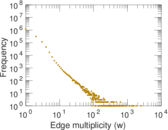
| Average edge multiplicity | m̃ = | 1.630 12
|
| Size of LCC | N = | 445,885
|
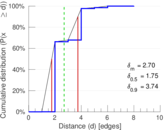
| Diameter | δ = | 11
|
| 50-Percentile effective diameter | δ0.5 = | 1.754 26
|
| 90-Percentile effective diameter | δ0.9 = | 3.741 20
|
| Median distance | δM = | 2
|
| Mean distance | δm = | 2.695 79
|
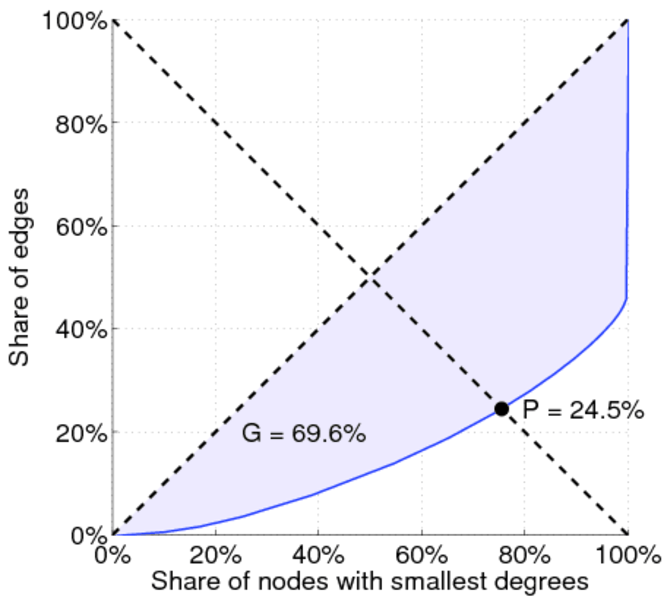
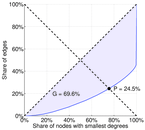
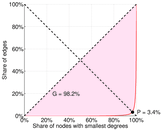
| Gini coefficient | G = | 0.696 865
|
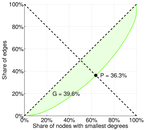
| Balanced inequality ratio | P = | 0.243 833
|
| Left balanced inequality ratio | P1 = | 0.033 622 1
|
| Right balanced inequality ratio | P2 = | 0.363 237
|
| Relative edge distribution entropy | Her = | 0.703 955
|
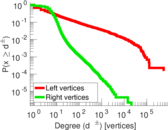
| Power law exponent | γ = | 1.826 66
|
| Degree assortativity | ρ = | −0.067 672 2
|
| Degree assortativity p-value | pρ = | 0.000 00
|
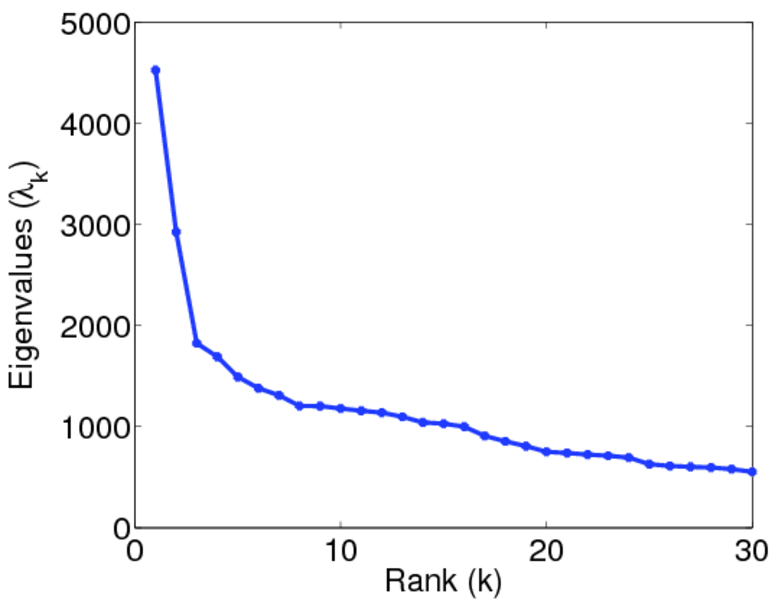
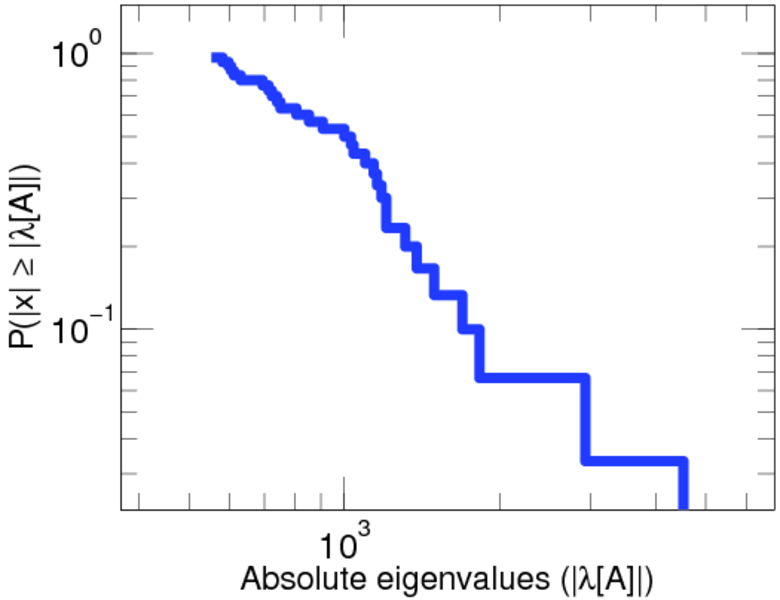
| Spectral norm | α = | 4,525.63
|
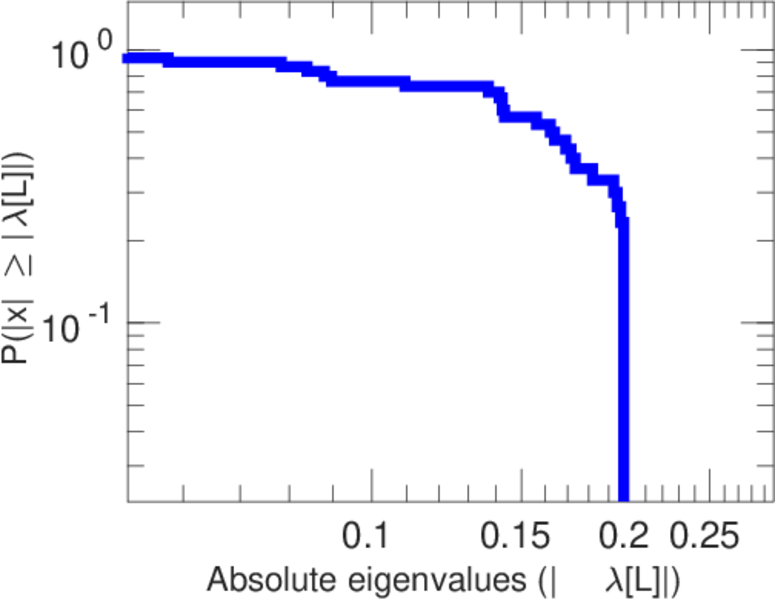
| Algebraic connectivity | a = | 0.051 590 9
|
| Spectral separation | |λ1[A] / λ2[A]| = | 1.547 10
|
| Controllability | C = | 438,882
|
| Relative controllability | Cr = | 0.982 004
|
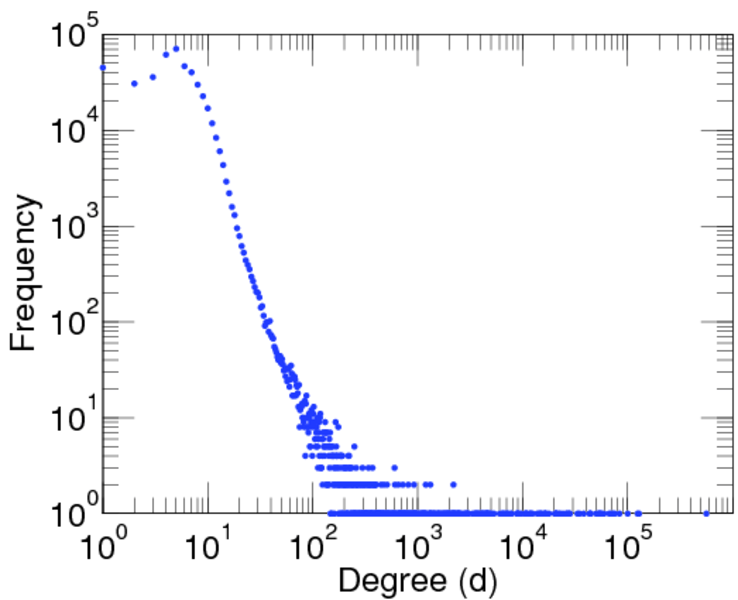
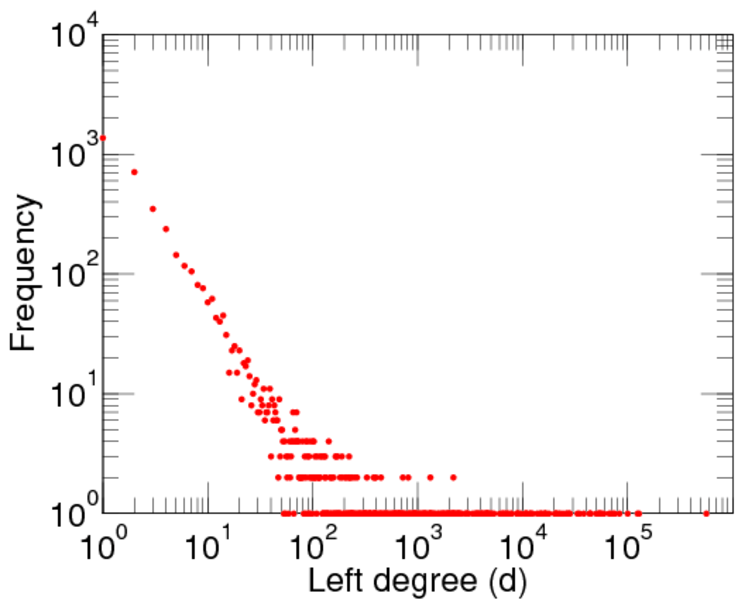
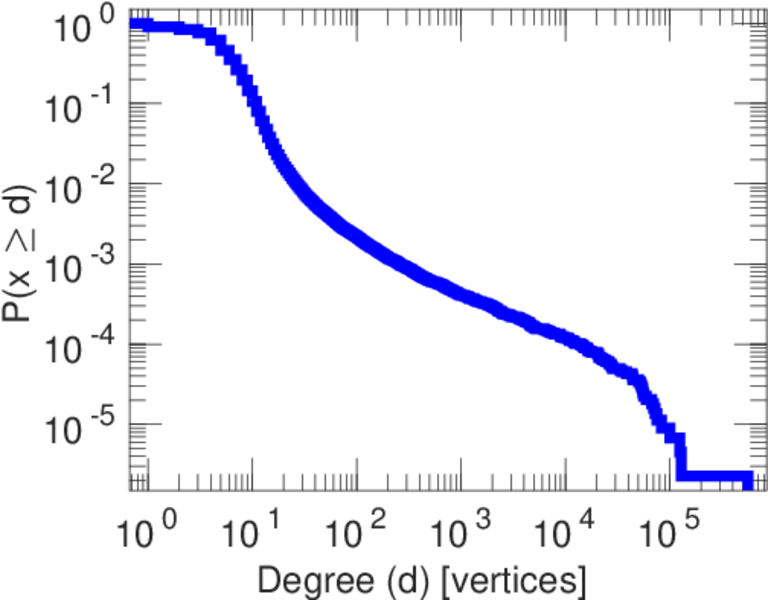
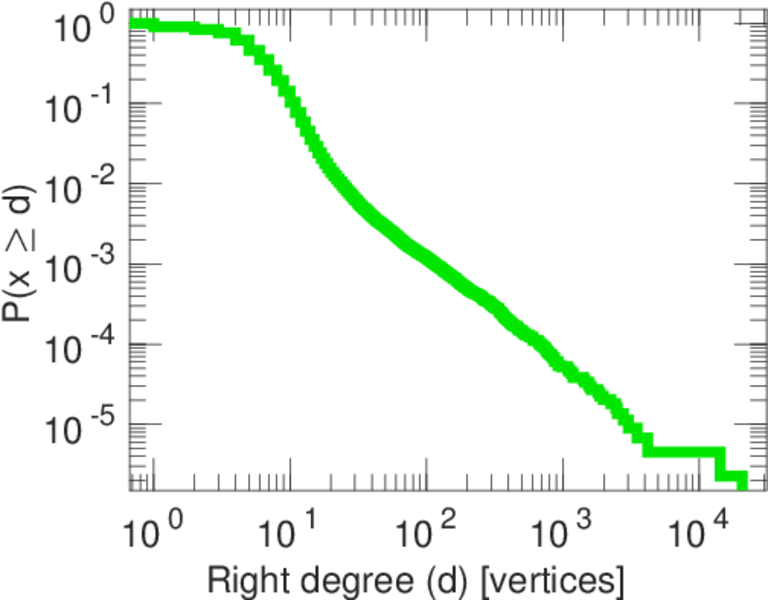
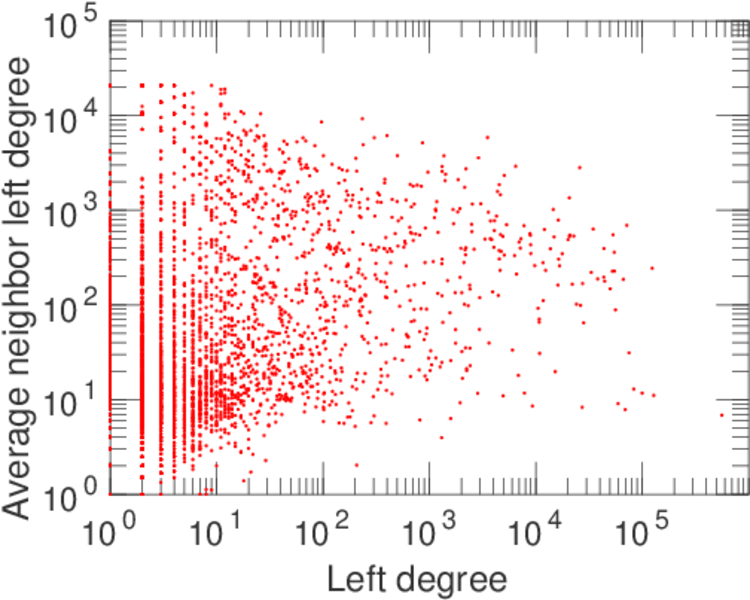
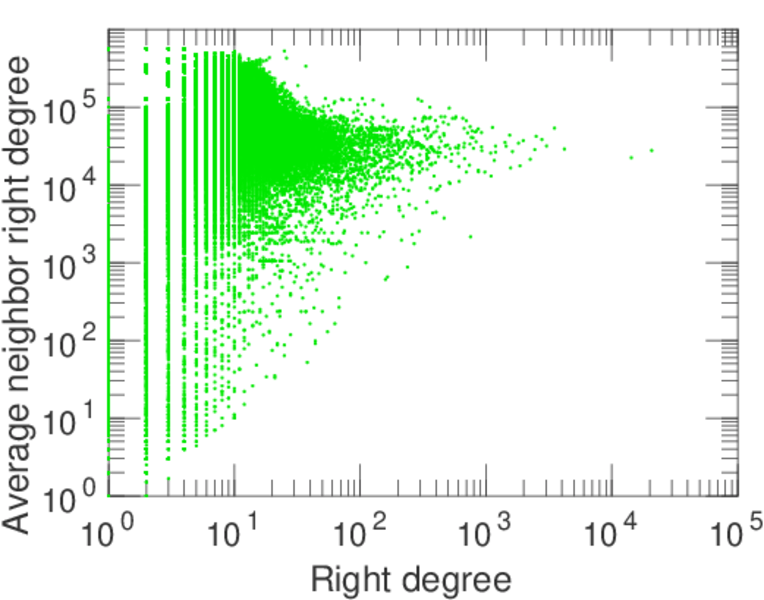
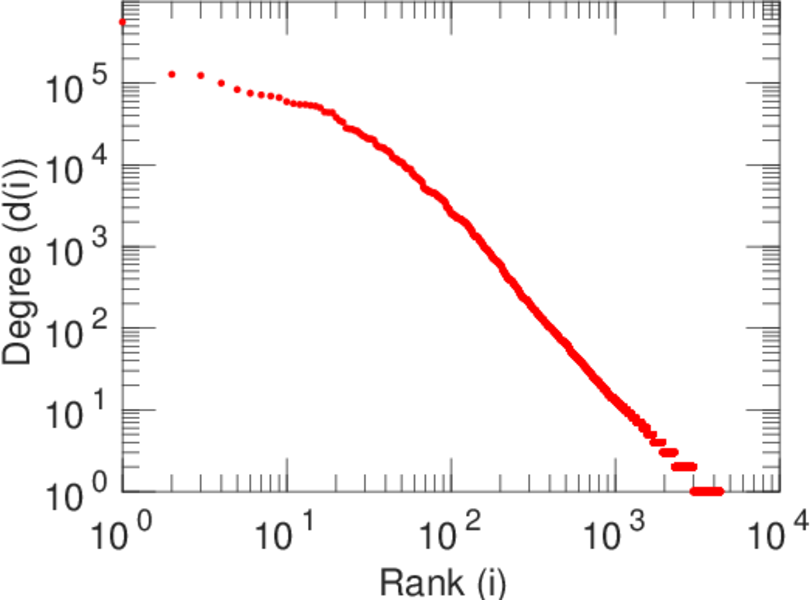
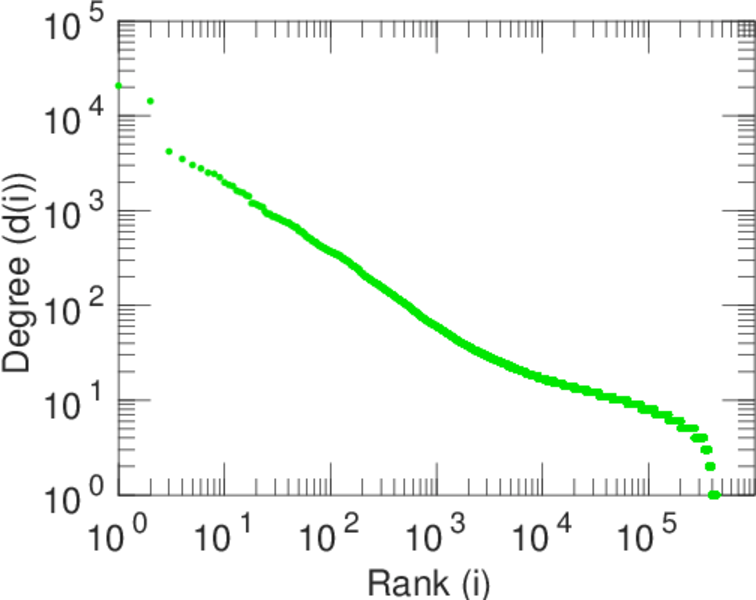
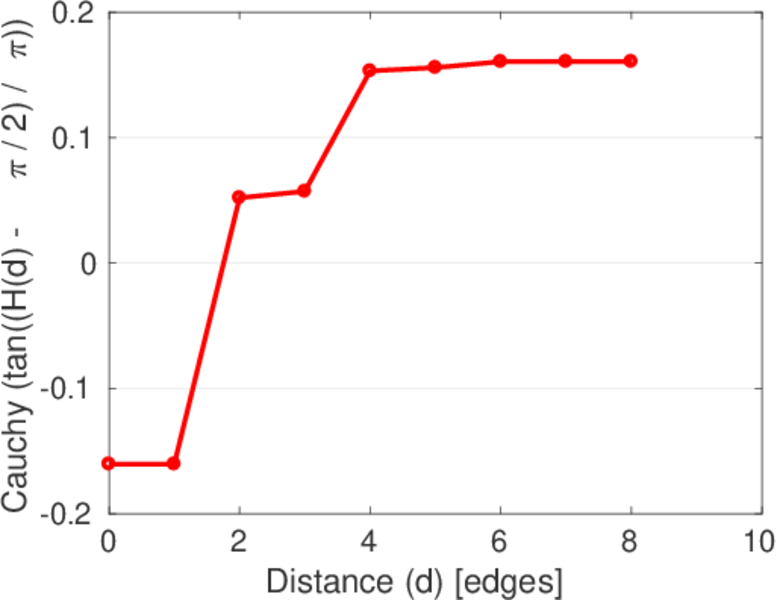
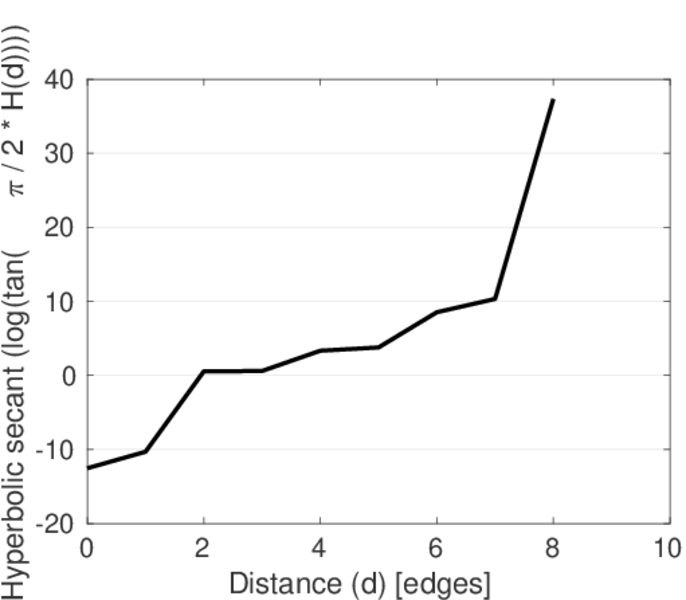
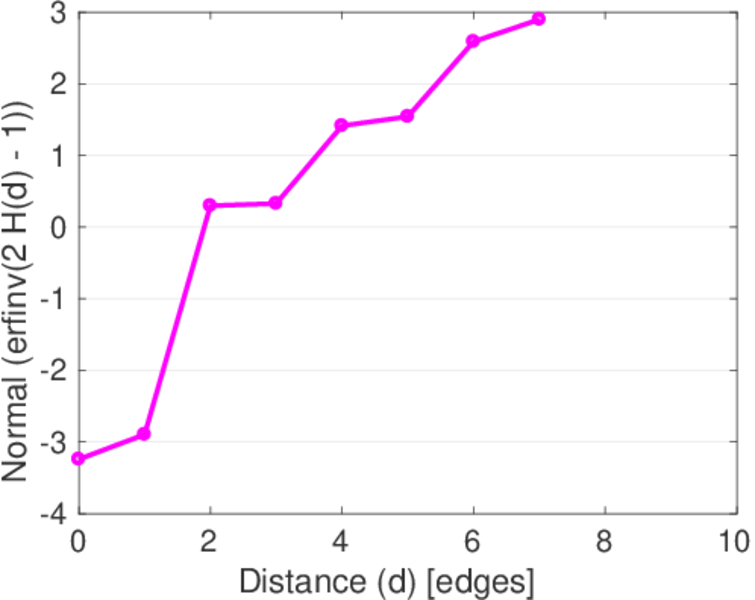
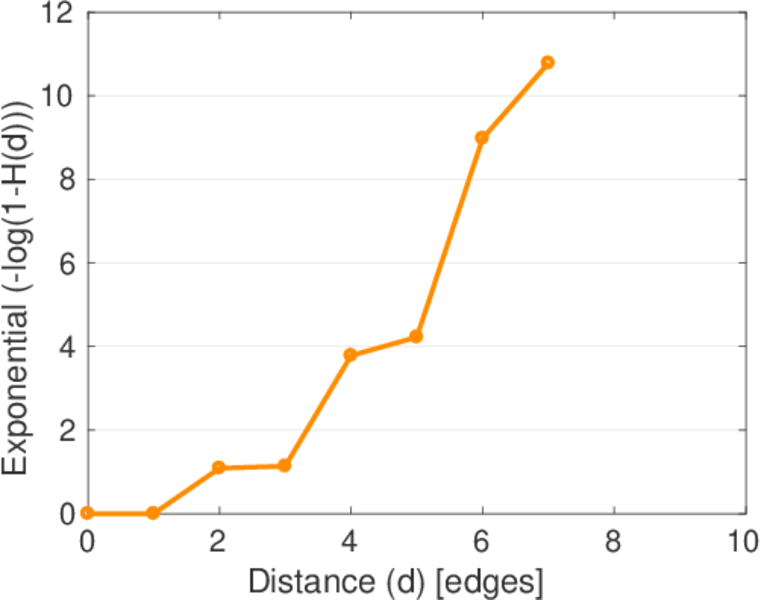
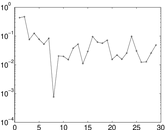
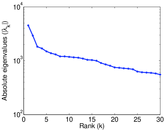
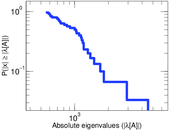
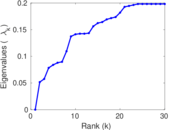
Plots


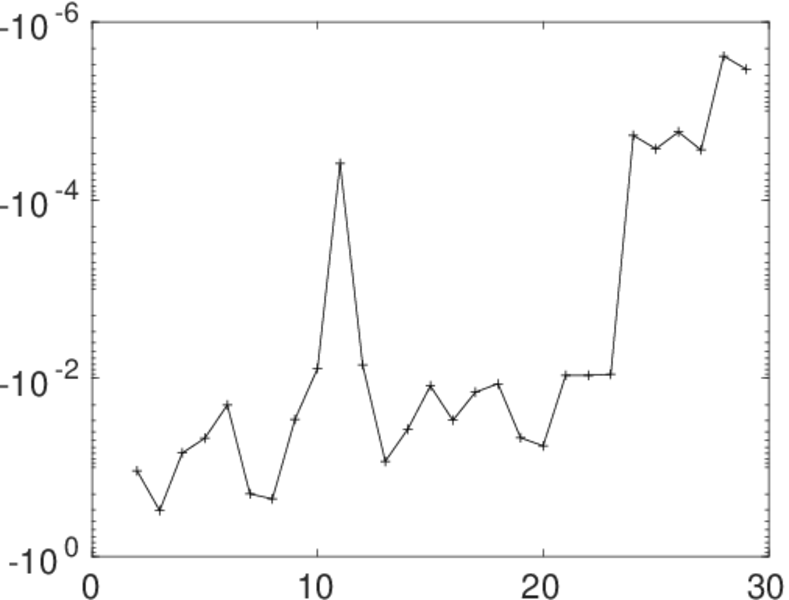
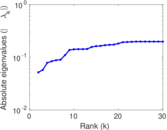
Matrix decompositions plots


Downloads
References
|
[1]
|
Jérôme Kunegis.
KONECT – The Koblenz Network Collection.
In Proc. Int. Conf. on World Wide Web Companion, pages
1343–1350, 2013.
[ http ]
|
|
[2]
|
Wikimedia Foundation.
Wikimedia downloads.
http://dumps.wikimedia.org/, January 2010.
|
 KONECT ‣ Networks ‣
Buy Me a Coffee
KONECT ‣ Networks ‣
Buy Me a Coffee