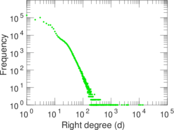
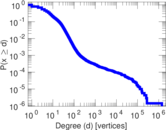
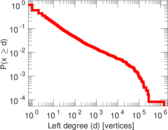
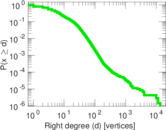
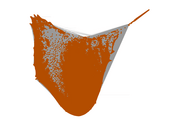
Wiktionary edits (de)
This is the bipartite edit network of the German Wiktionary. It contains users
and pages from the German Wiktionary, connected by edit events. Each edge
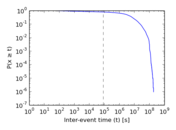
represents an edit. The dataset includes the timestamp of each edit.
Metadata
Statistics
| Size | n = | 725,085
|
| Left size | n1 = | 12,104
|
| Right size | n2 = | 712,981
|
| Volume | m = | 5,776,013
|
| Unique edge count | m̿ = | 3,451,327
|
| Wedge count | s = | 227,306,280,974
|
| Claw count | z = | 23,780,696,991,420,592
|
| Cross count | x = | 2.523 7 × 10²¹
|
| Square count | q = | 7,023,812,795
|
| 4-Tour count | T4 = | 89,606,310,540
|
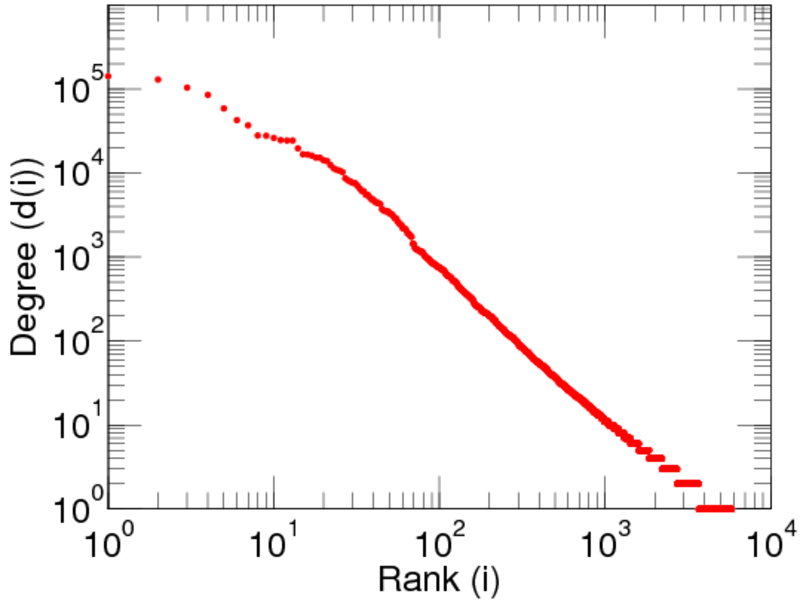
| Maximum degree | dmax = | 1,419,697
|
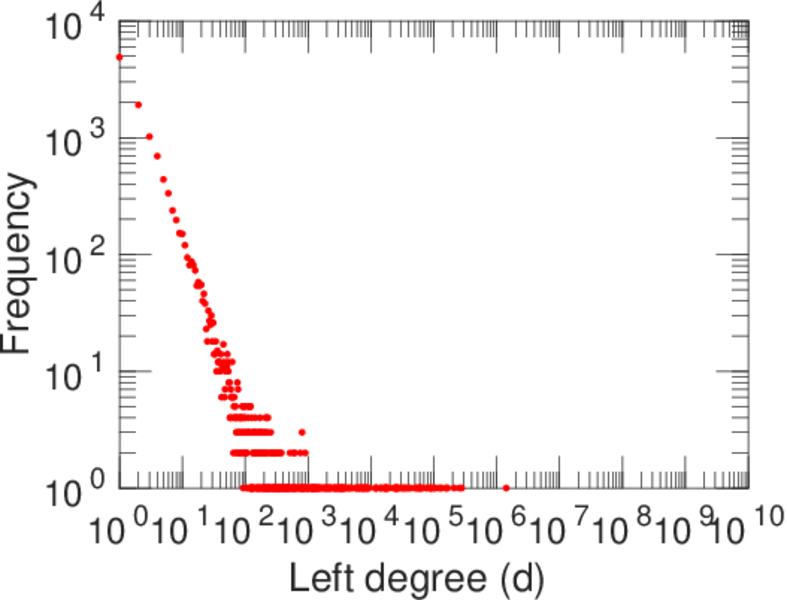
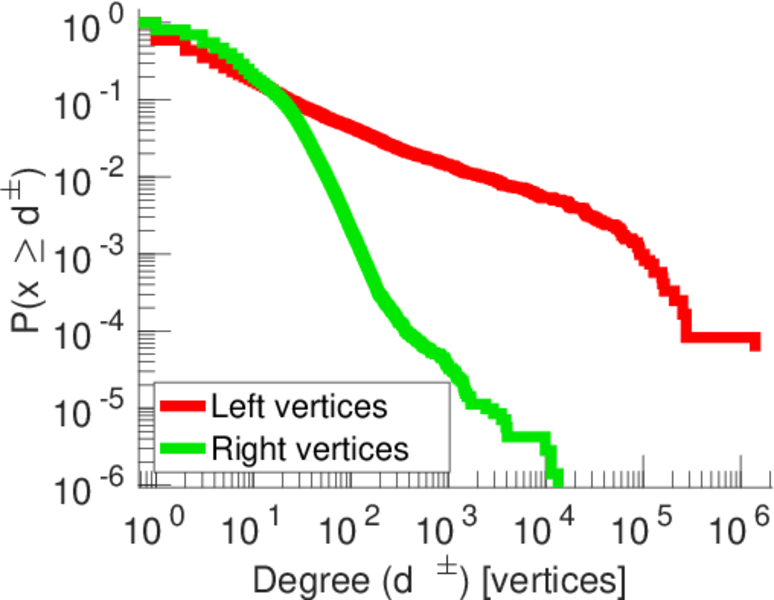
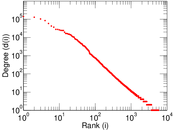
| Maximum left degree | d1max = | 1,419,697
|
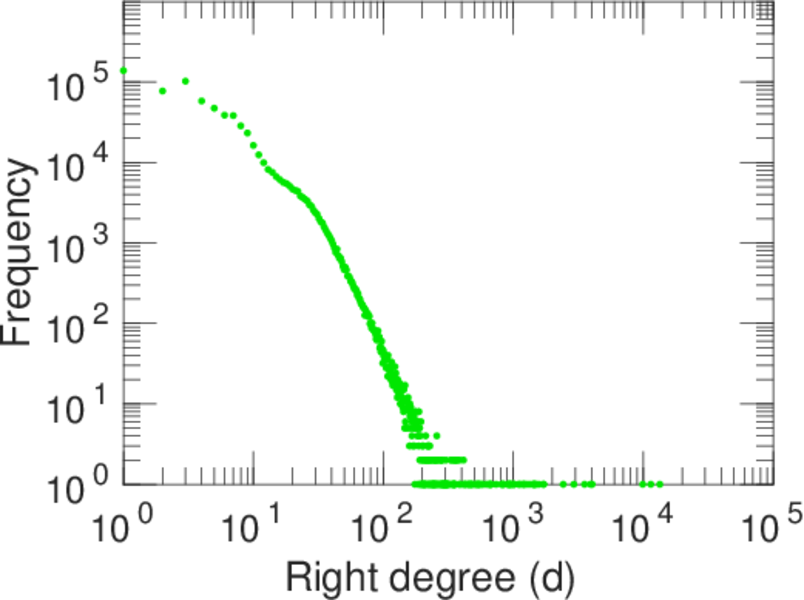
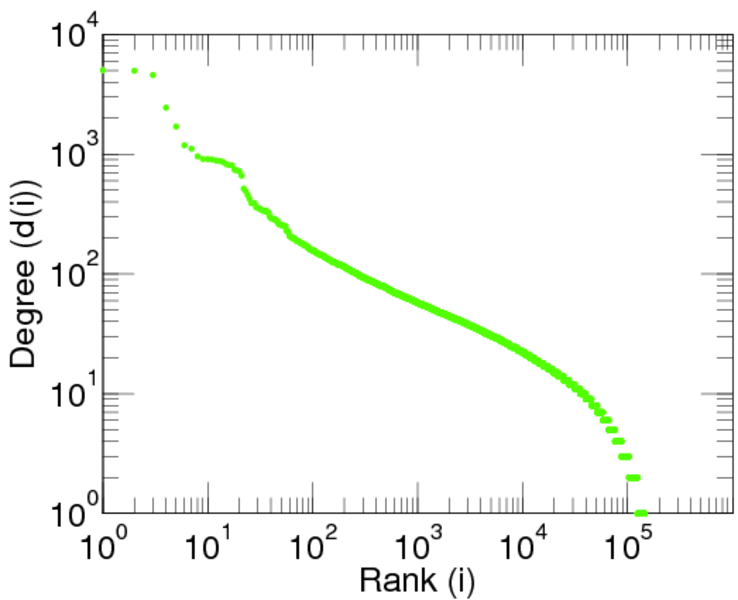
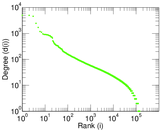
| Maximum right degree | d2max = | 13,425
|
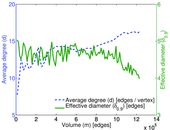
| Average degree | d = | 15.932 0
|
| Average left degree | d1 = | 477.199
|
| Average right degree | d2 = | 8.101 22
|
| Fill | p = | 0.000 399 926
|
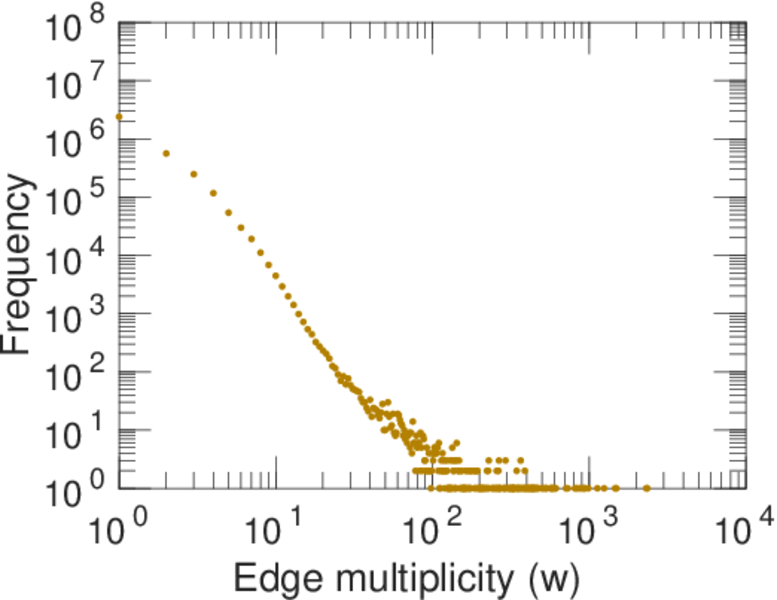
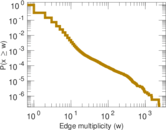
| Average edge multiplicity | m̃ = | 1.673 56
|
| Size of LCC | N = | 717,413
|
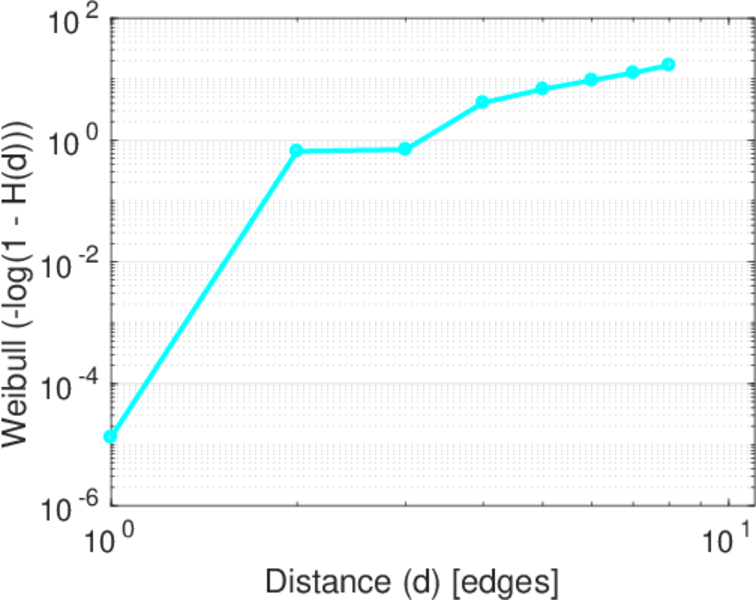
| Diameter | δ = | 11
|
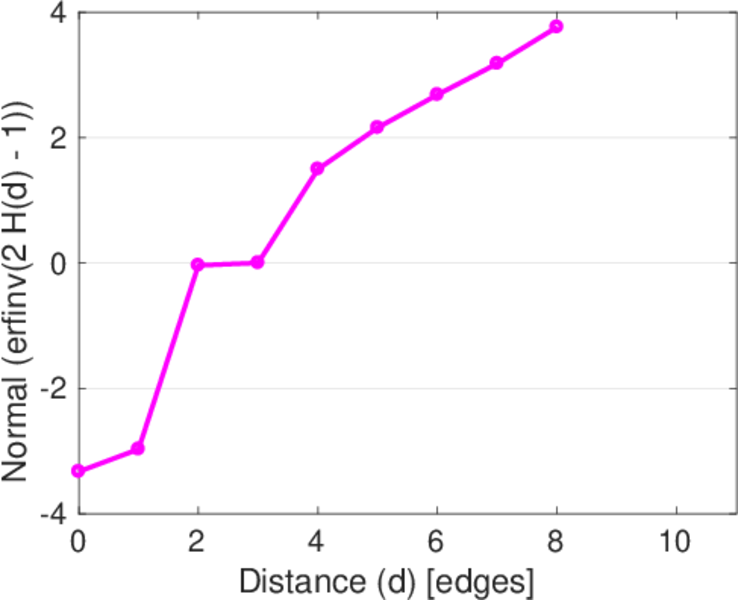
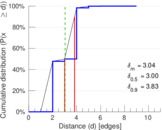
| 50-Percentile effective diameter | δ0.5 = | 3.000 19
|
| 90-Percentile effective diameter | δ0.9 = | 3.828 70
|
| Median distance | δM = | 4
|
| Mean distance | δm = | 3.041 21
|
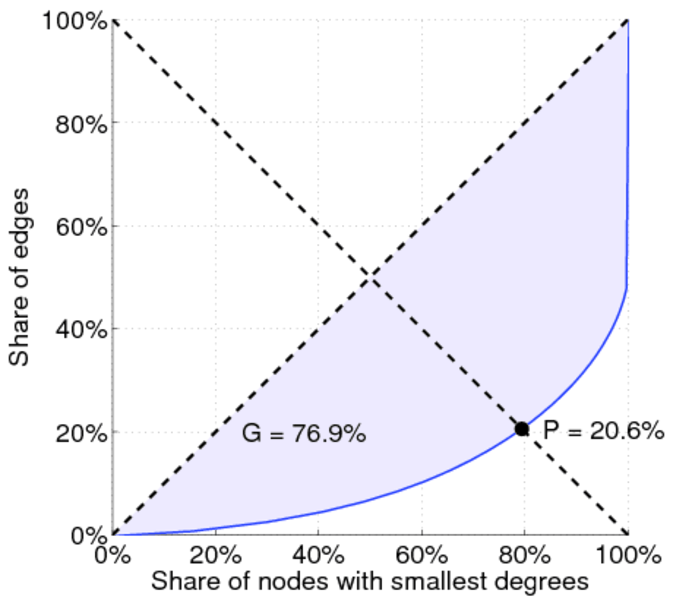
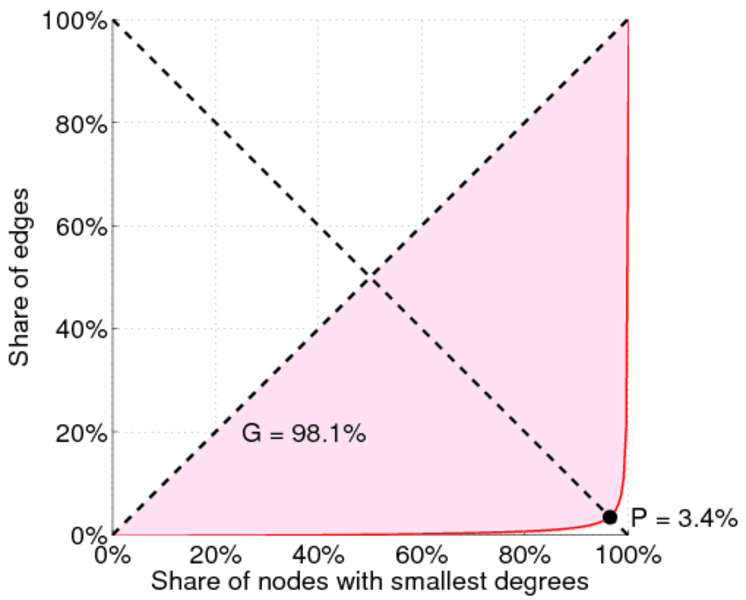
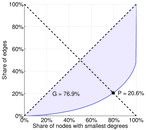
| Gini coefficient | G = | 0.790 939
|
| Balanced inequality ratio | P = | 0.188 683
|
| Left balanced inequality ratio | P1 = | 0.018 734 5
|
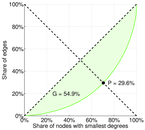
| Right balanced inequality ratio | P2 = | 0.278 198
|
| Relative edge distribution entropy | Her = | 0.689 234
|
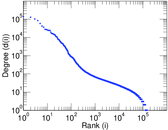
| Power law exponent | γ = | 1.858 20
|
| Tail power law exponent | γt = | 3.661 00
|
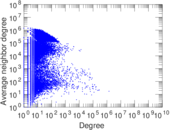
| Degree assortativity | ρ = | −0.202 046
|
| Degree assortativity p-value | pρ = | 0.000 00
|
| Spectral norm | α = | 3,993.84
|
| Algebraic connectivity | a = | 0.060 730 2
|
| Spectral separation | |λ1[A] / λ2[A]| = | 1.399 72
|
| Controllability | C = | 698,939
|
| Relative controllability | Cr = | 0.972 304
|
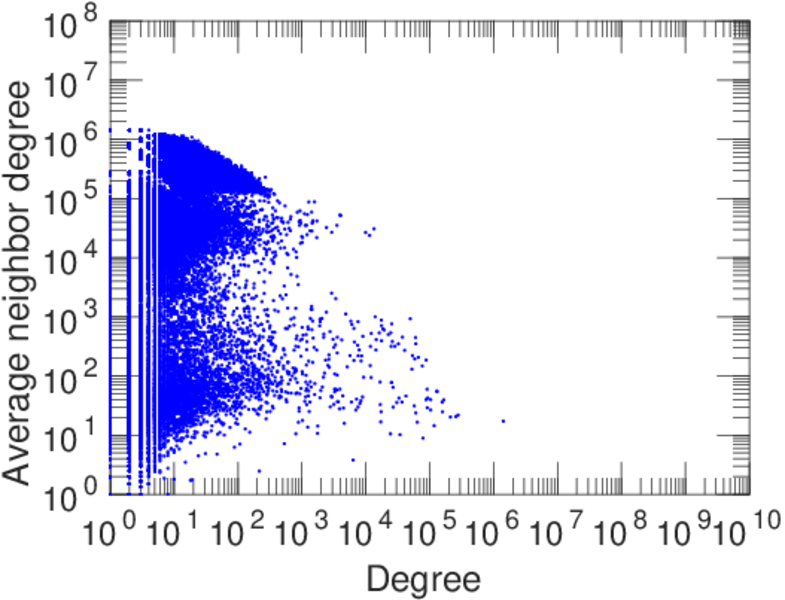
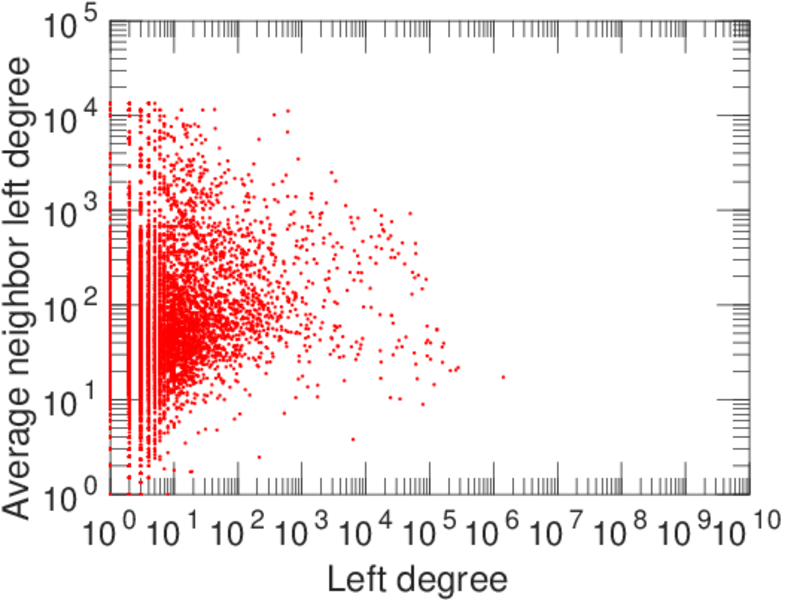
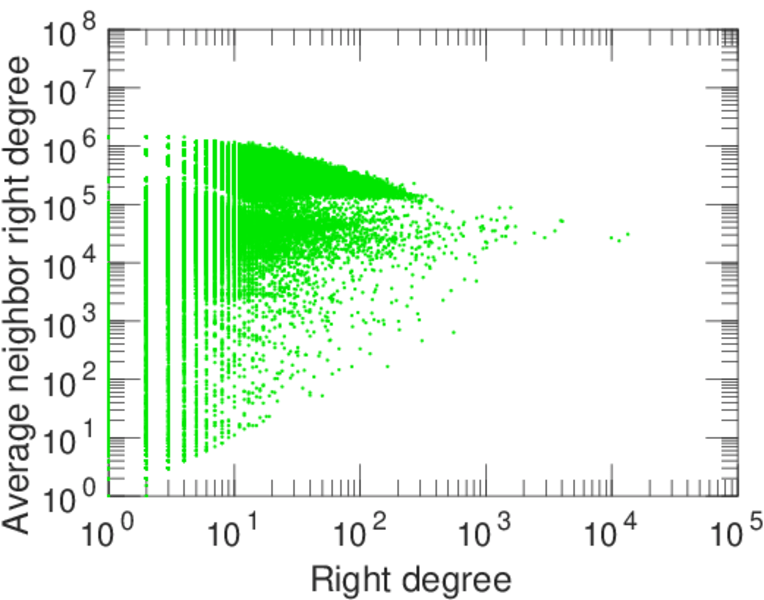
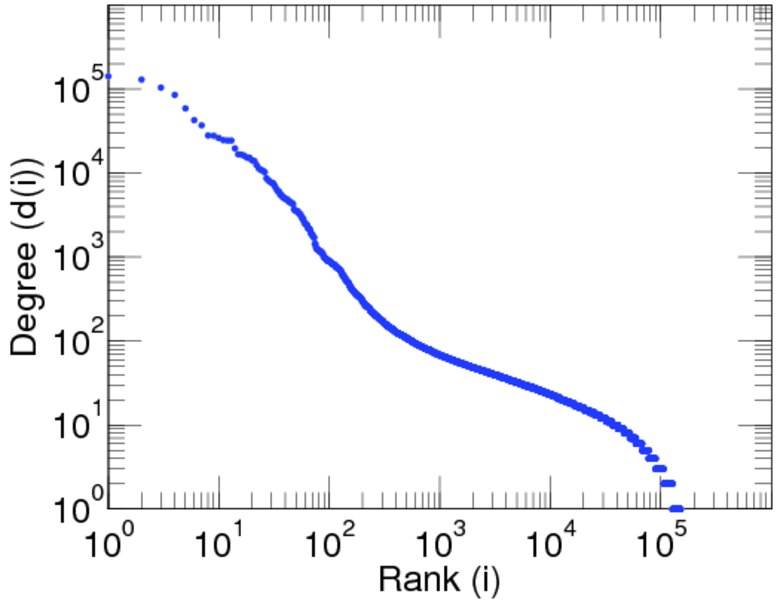
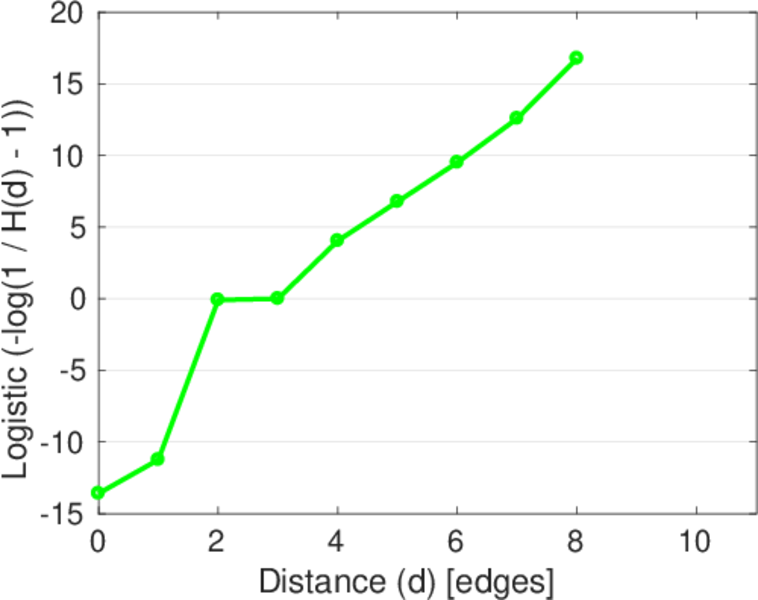
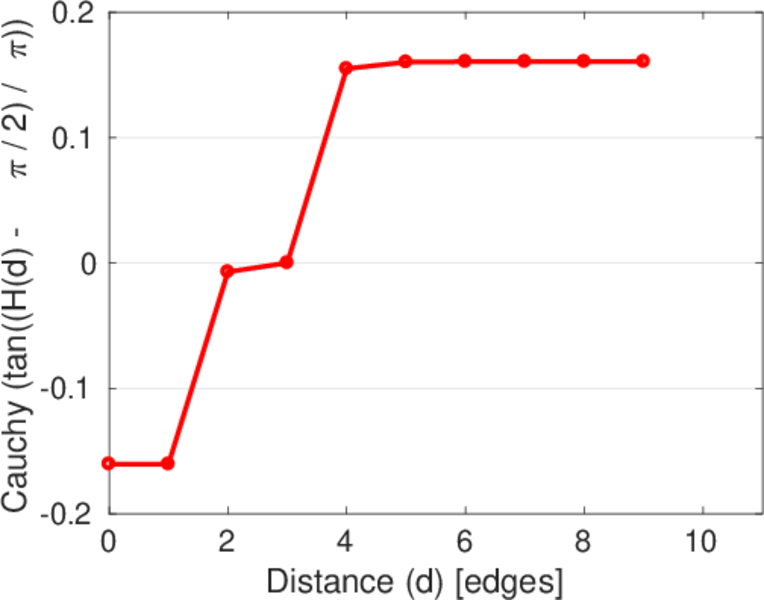
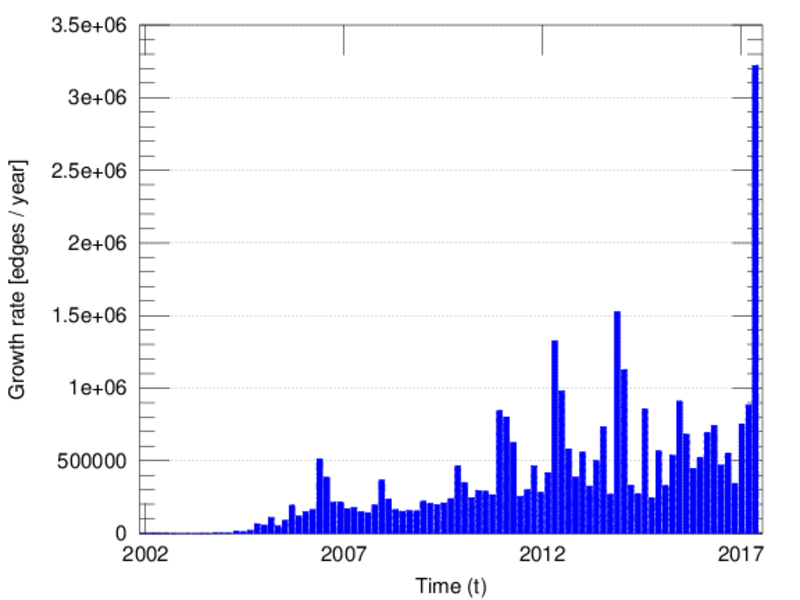
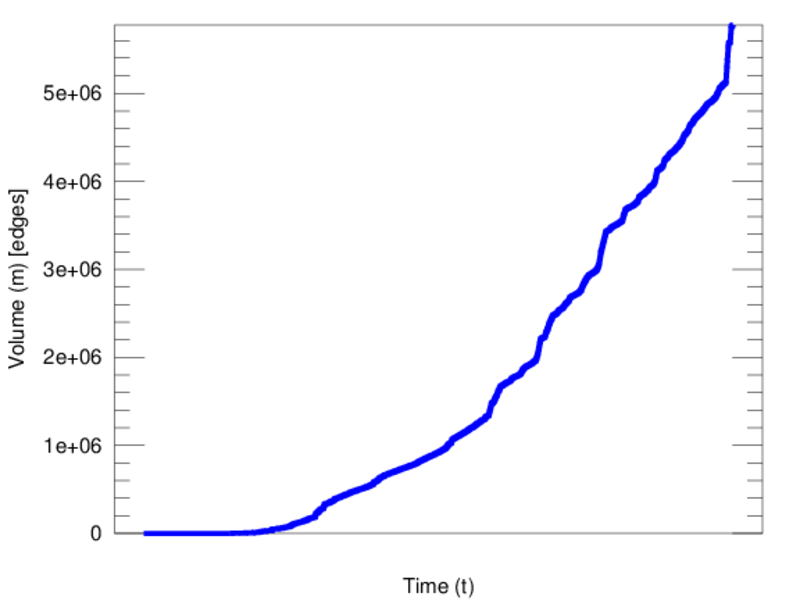
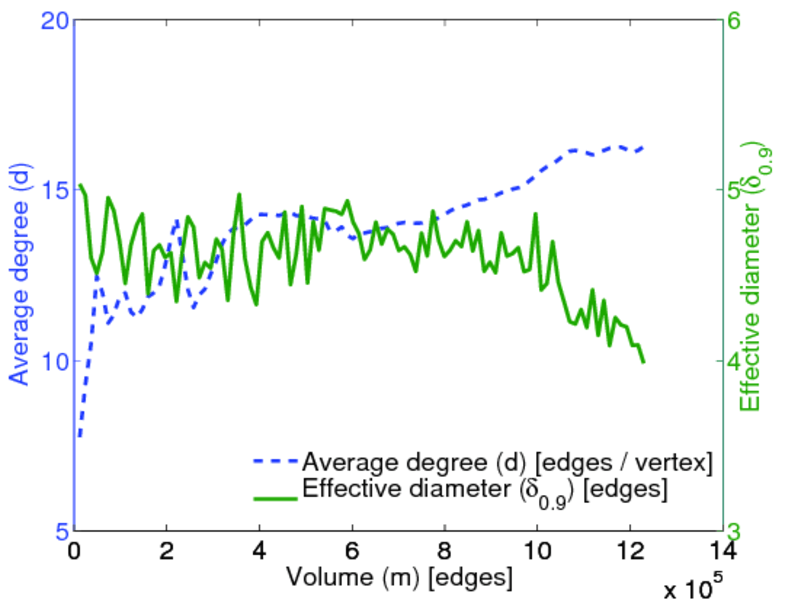
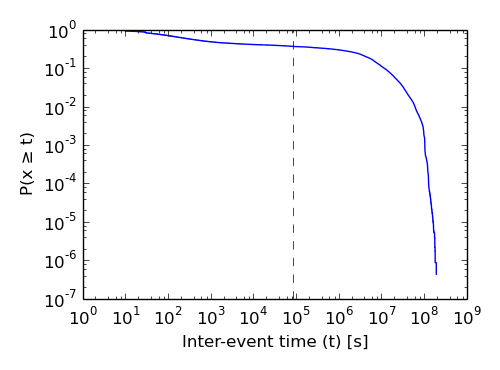
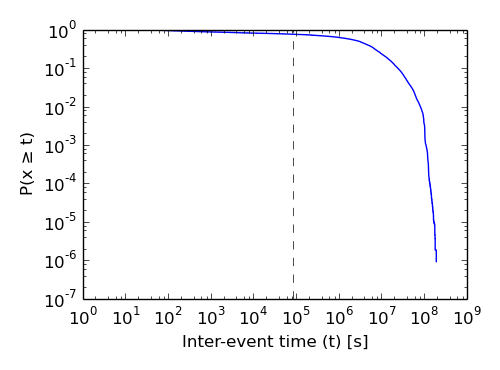
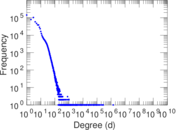
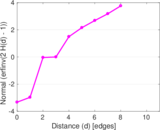
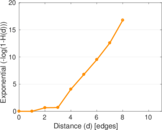
Plots


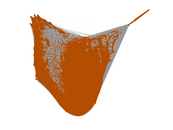

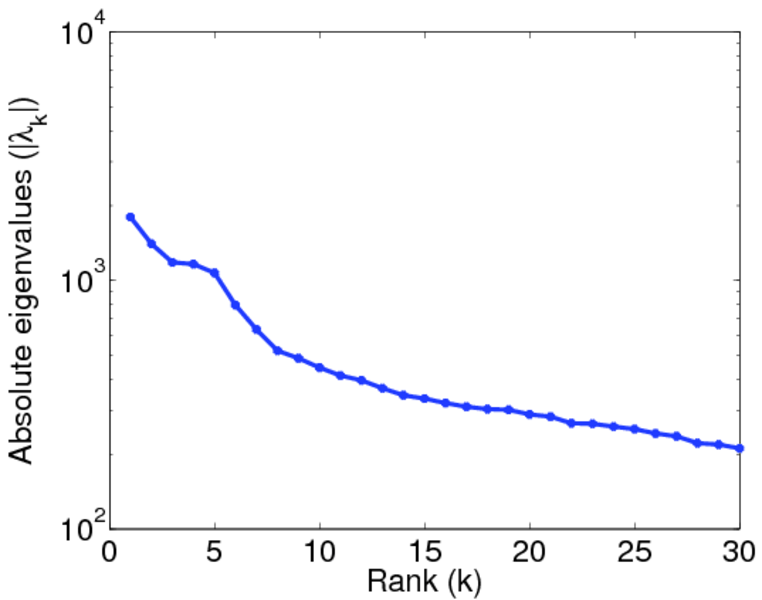
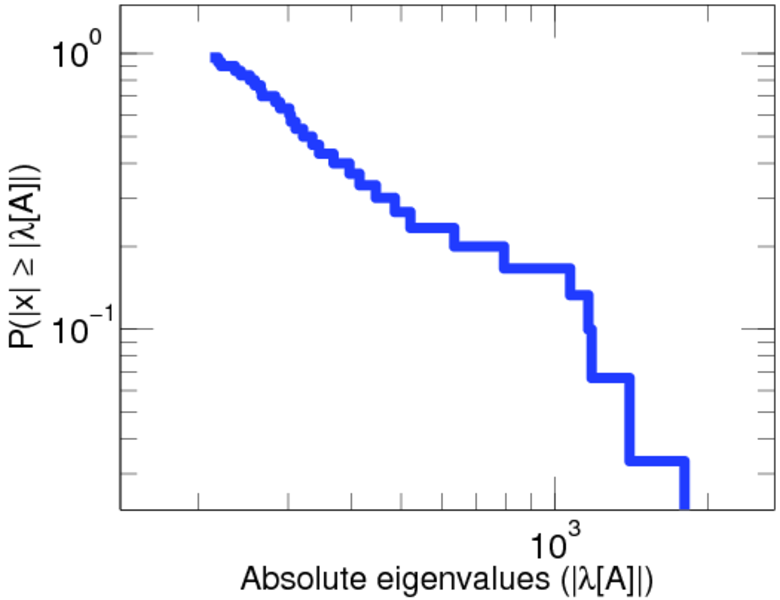
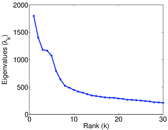
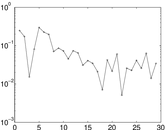
Matrix decompositions plots


Downloads
References
|
[1]
|
Jérôme Kunegis.
KONECT – The Koblenz Network Collection.
In Proc. Int. Conf. on World Wide Web Companion, pages
1343–1350, 2013.
[ http ]
|
|
[2]
|
Wikimedia Foundation.
Wikimedia downloads.
http://dumps.wikimedia.org/, January 2010.
|
 KONECT ‣ Networks ‣
Buy Me a Coffee
KONECT ‣ Networks ‣
Buy Me a Coffee