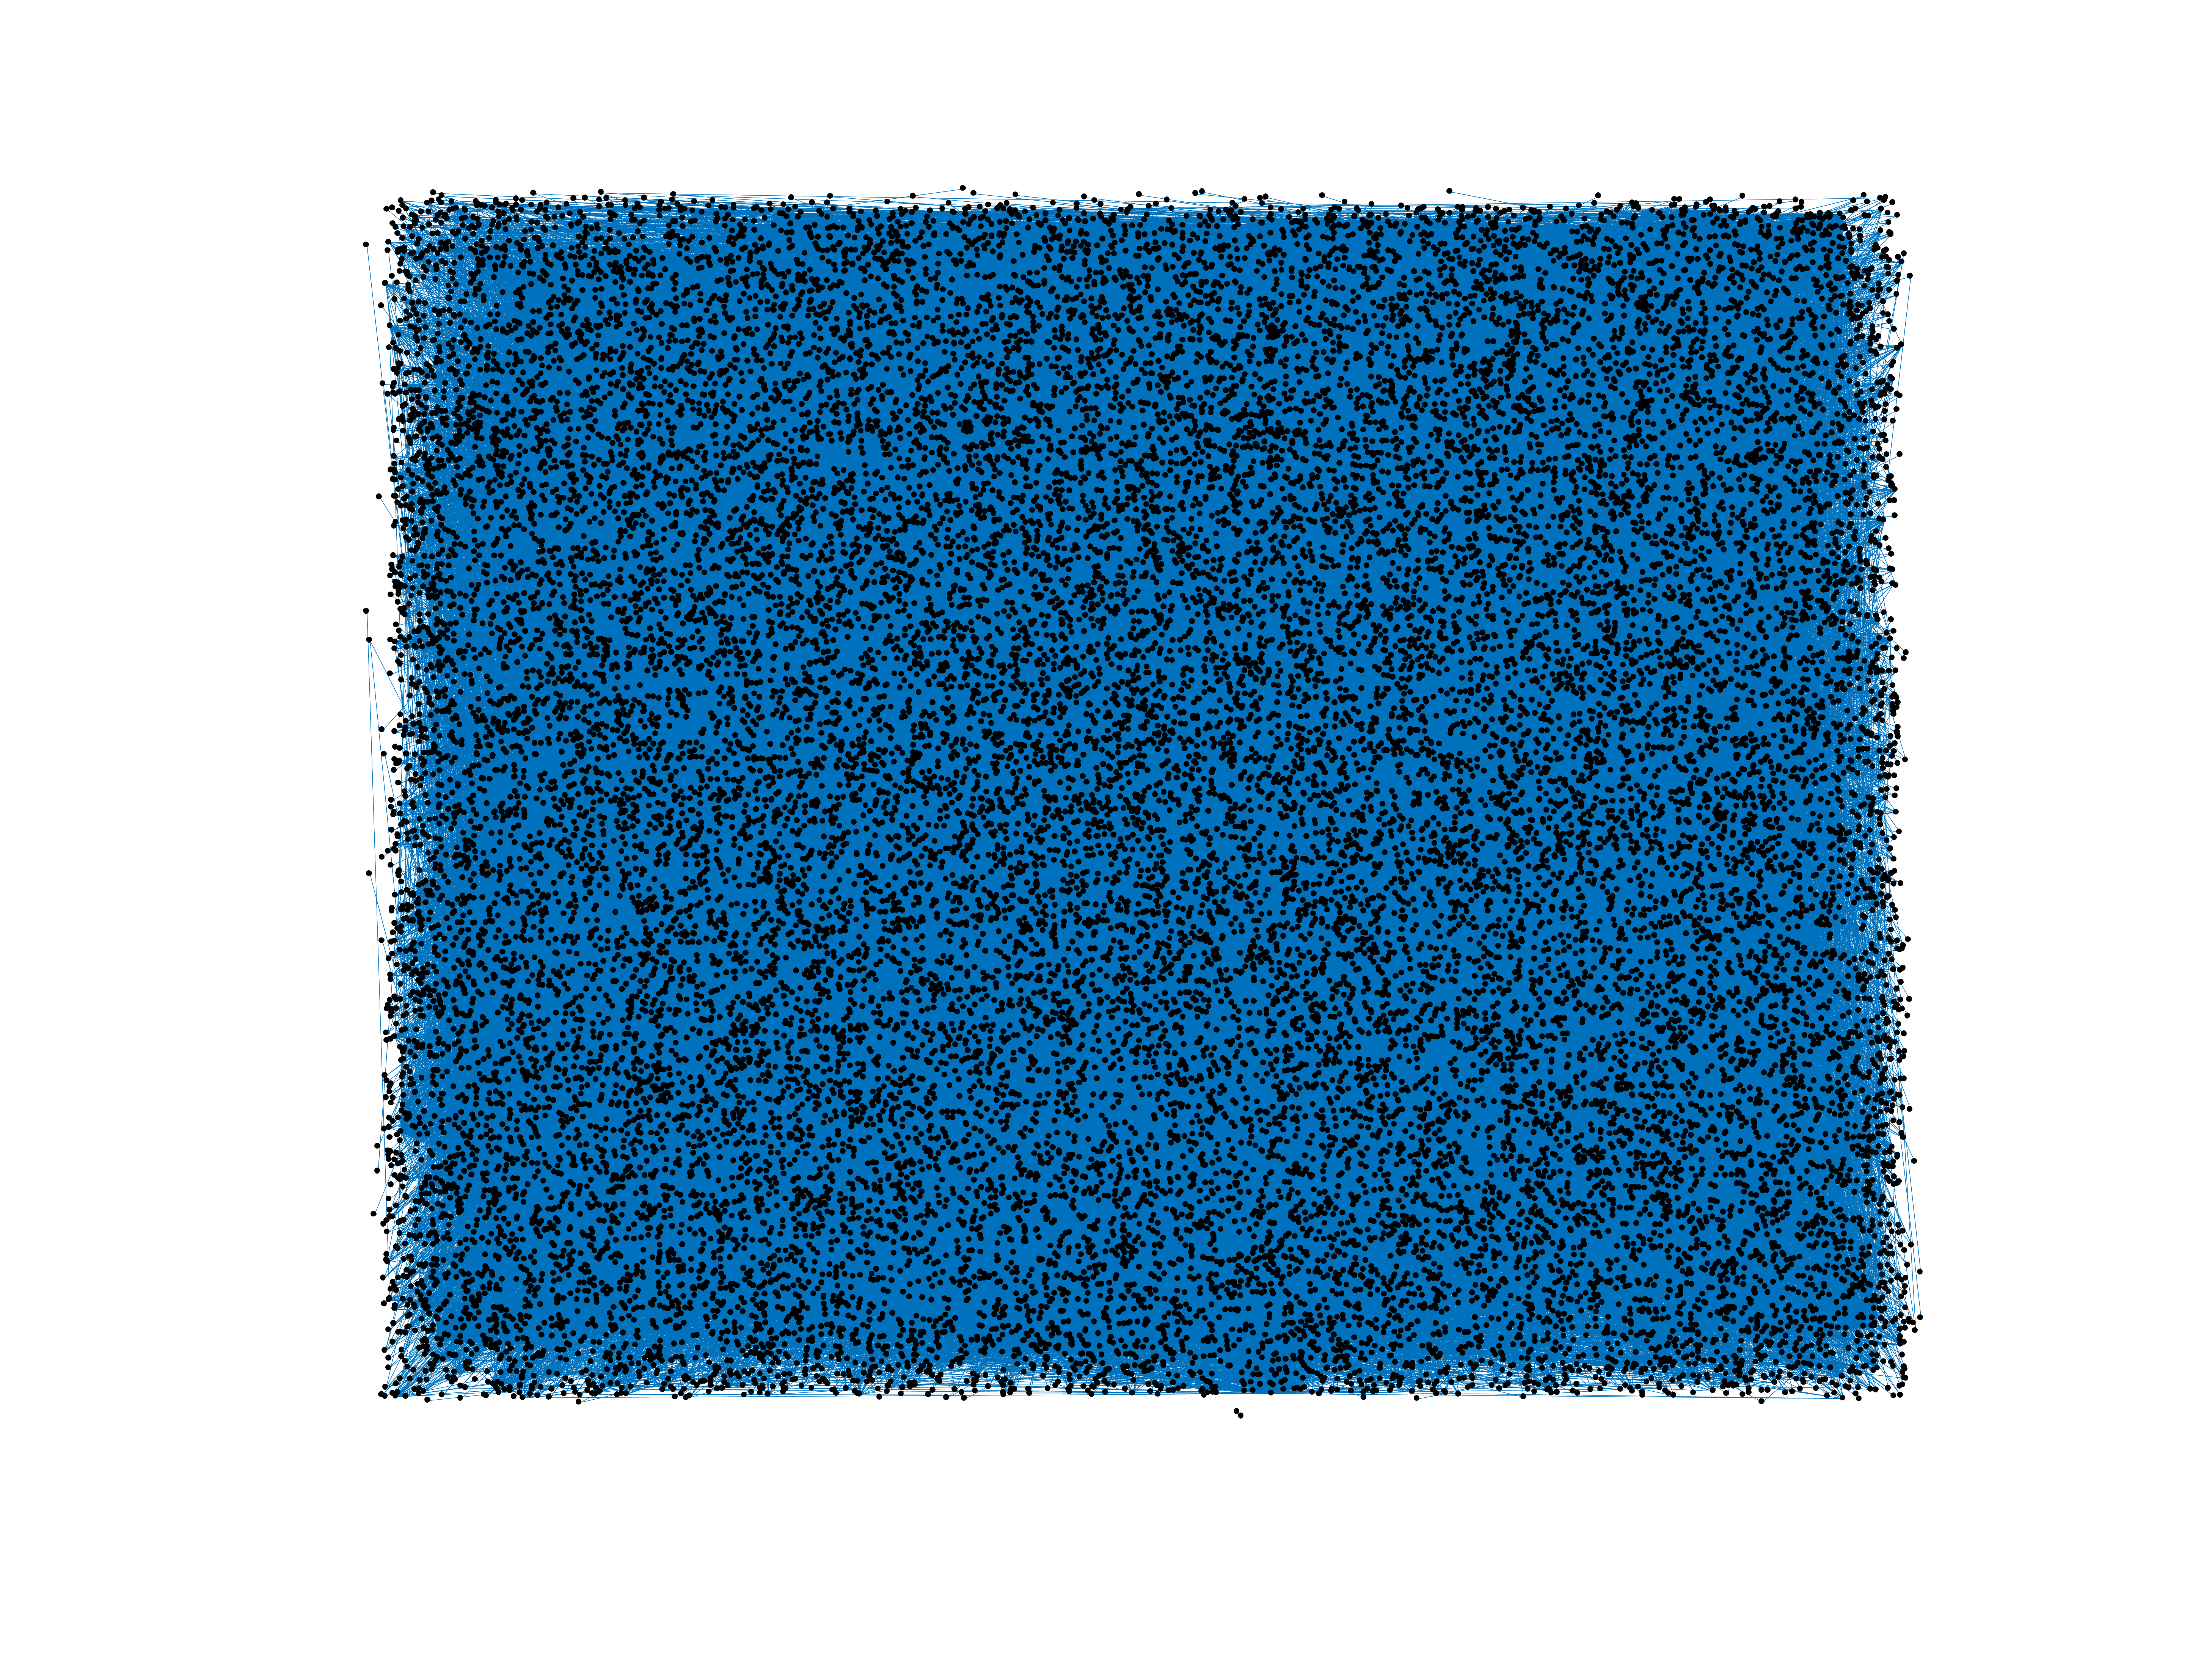
Wikipedia edits (diq)
This is the bipartite edit network of the Zazaki Wikipedia. It contains users
and pages from the Zazaki Wikipedia, connected by edit events. Each edge
represents an edit. The dataset includes the timestamp of each edit.
Metadata
Statistics
| Size | n = | 27,295
|
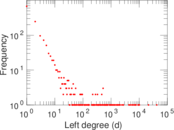
| Left size | n1 = | 1,525
|
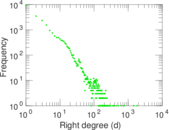
| Right size | n2 = | 25,770
|
| Volume | m = | 231,555
|
| Unique edge count | m̿ = | 105,197
|
| Wedge count | s = | 201,007,619
|
| Claw count | z = | 585,501,507,656
|
| Cross count | x = | 1,643,434,821,910,401
|
| Square count | q = | 176,961,139
|
| 4-Tour count | T4 = | 2,220,094,558
|
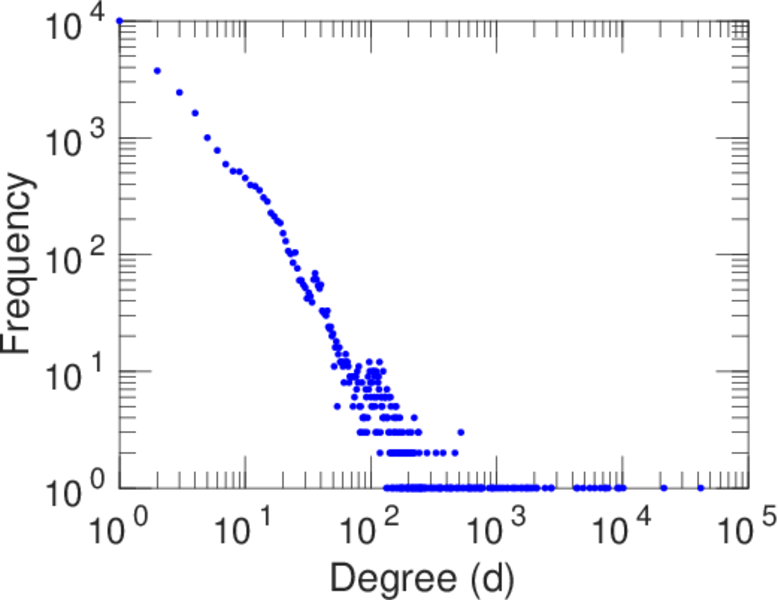
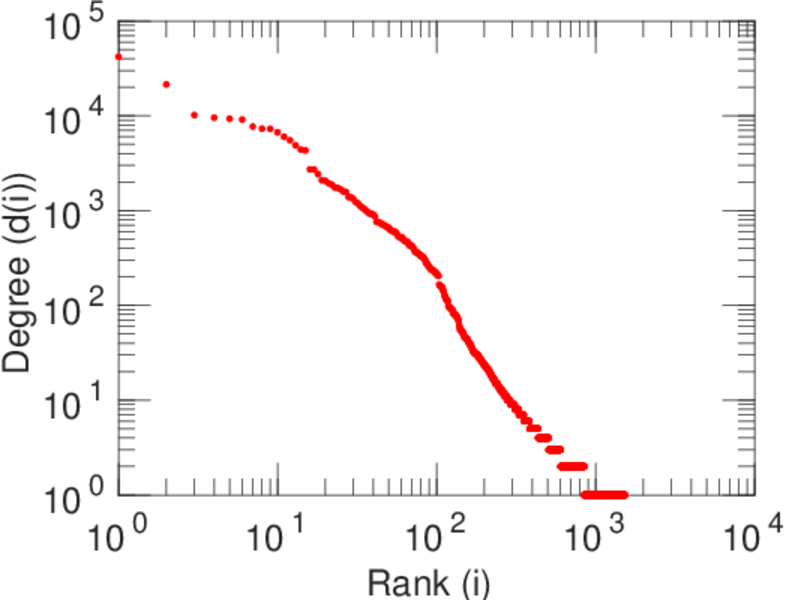
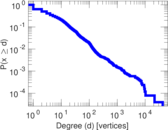
| Maximum degree | dmax = | 42,003
|
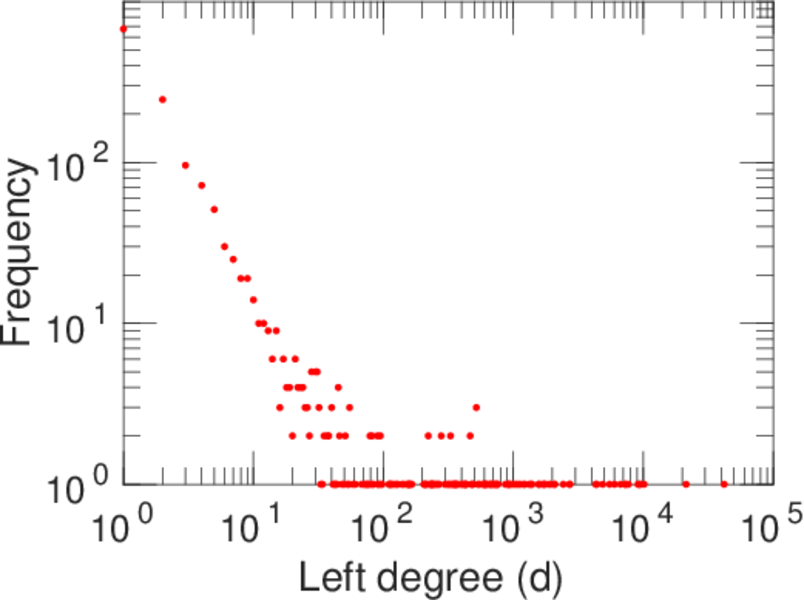
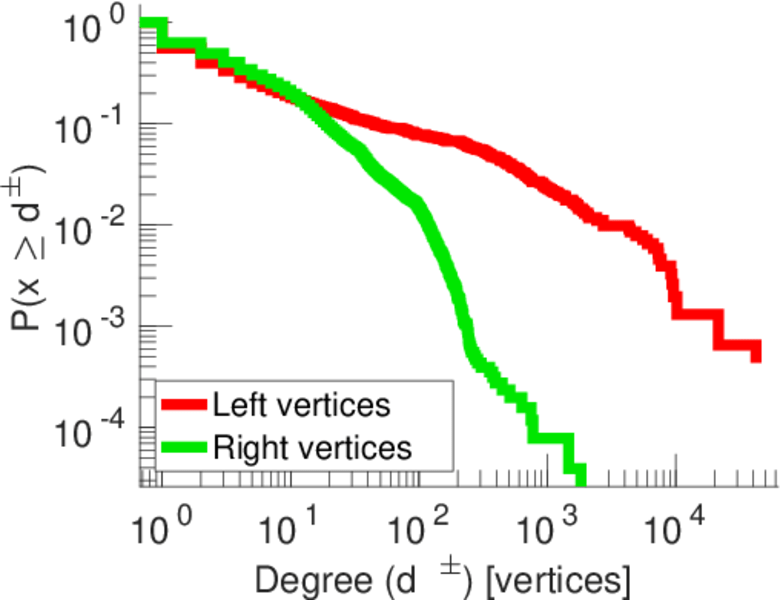
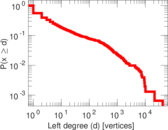
| Maximum left degree | d1max = | 42,003
|
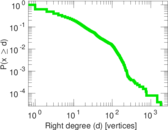
| Maximum right degree | d2max = | 1,824
|
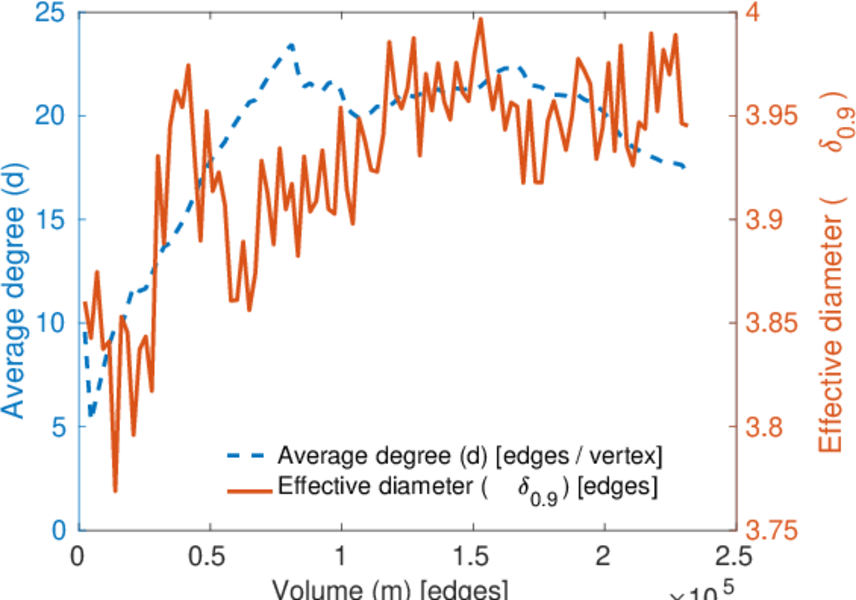
| Average degree | d = | 16.966 8
|
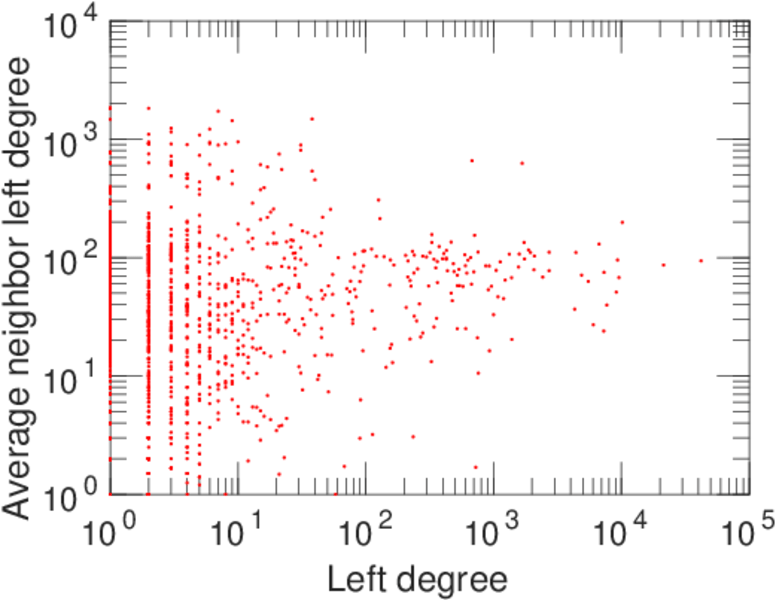
| Average left degree | d1 = | 151.839
|
| Average right degree | d2 = | 8.985 45
|
| Fill | p = | 0.002 676 82
|
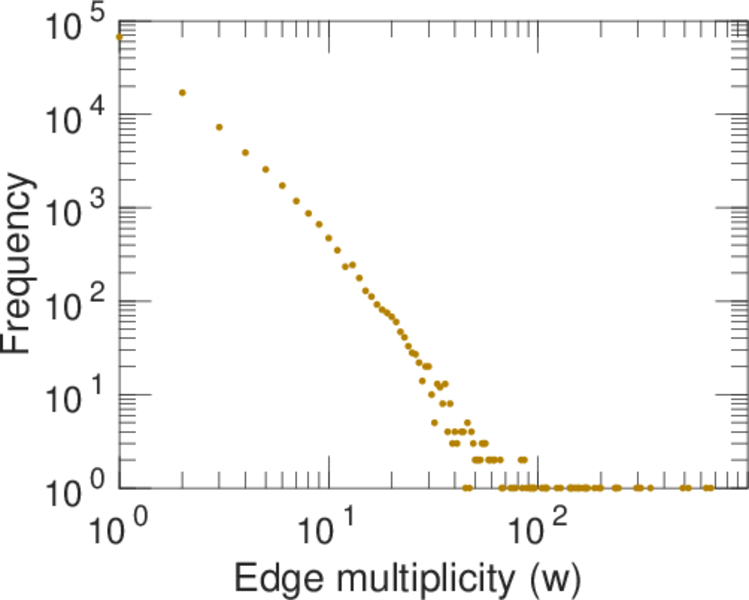
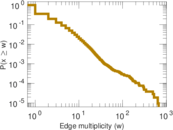
| Average edge multiplicity | m̃ = | 2.201 16
|
| Size of LCC | N = | 26,323
|
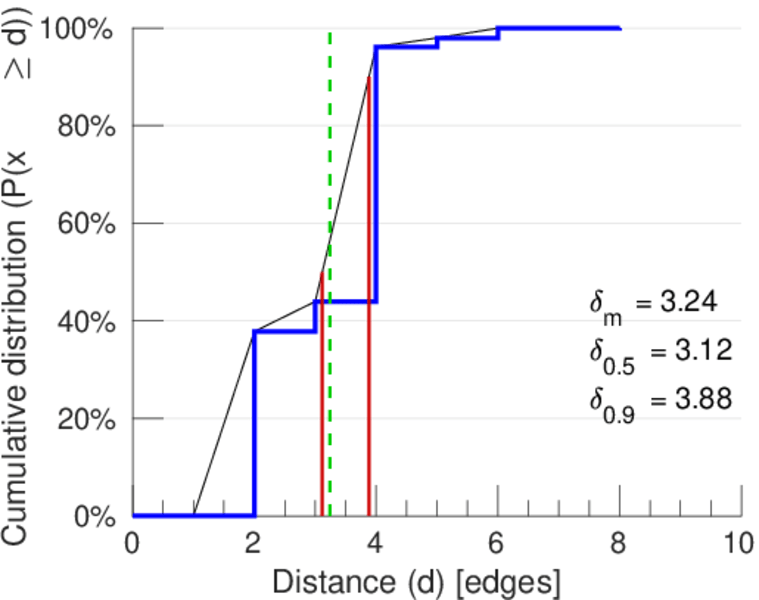
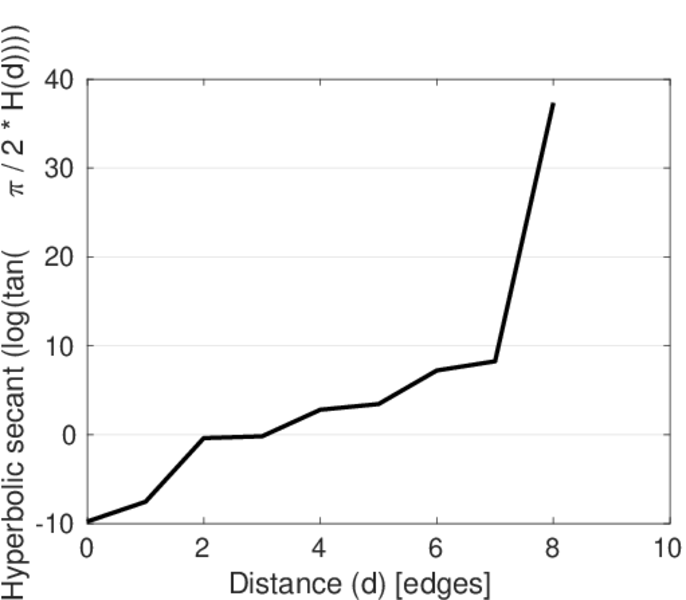
| Diameter | δ = | 10
|
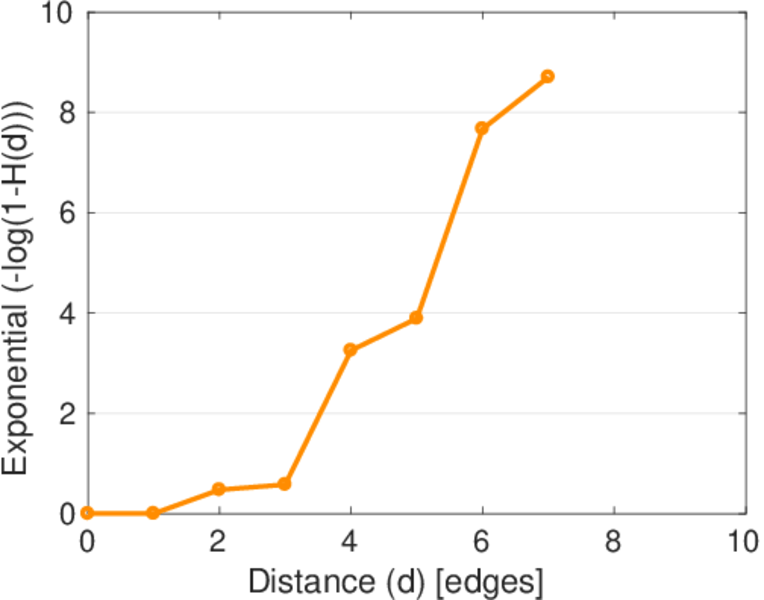
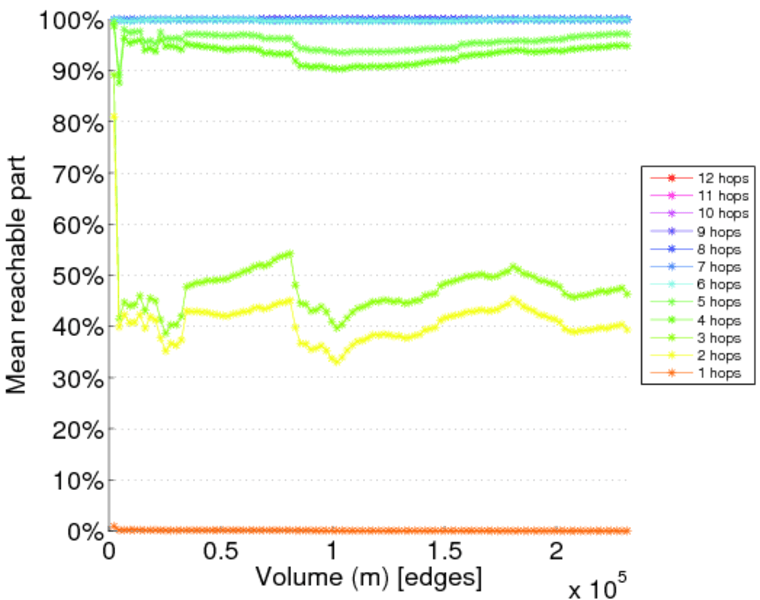
| 50-Percentile effective diameter | δ0.5 = | 3.116 02
|
| 90-Percentile effective diameter | δ0.9 = | 3.882 41
|
| Median distance | δM = | 4
|
| Mean distance | δm = | 3.241 90
|
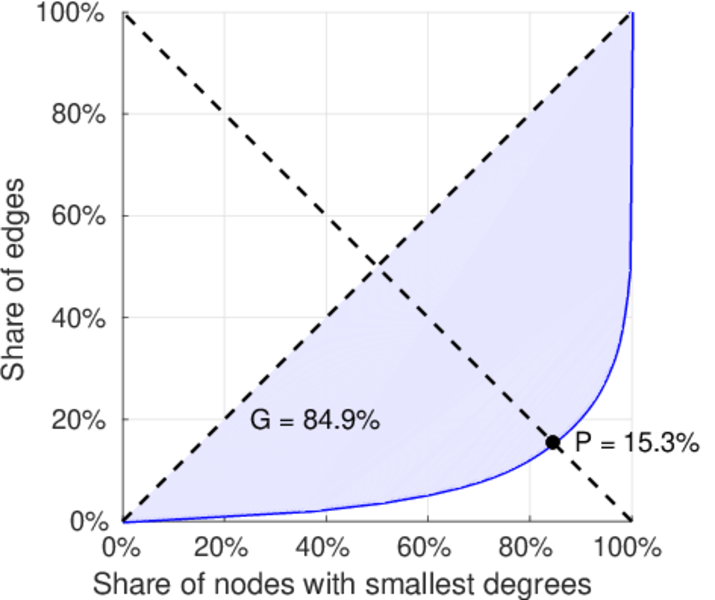
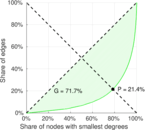
| Gini coefficient | G = | 0.852 284
|
| Balanced inequality ratio | P = | 0.151 379
|
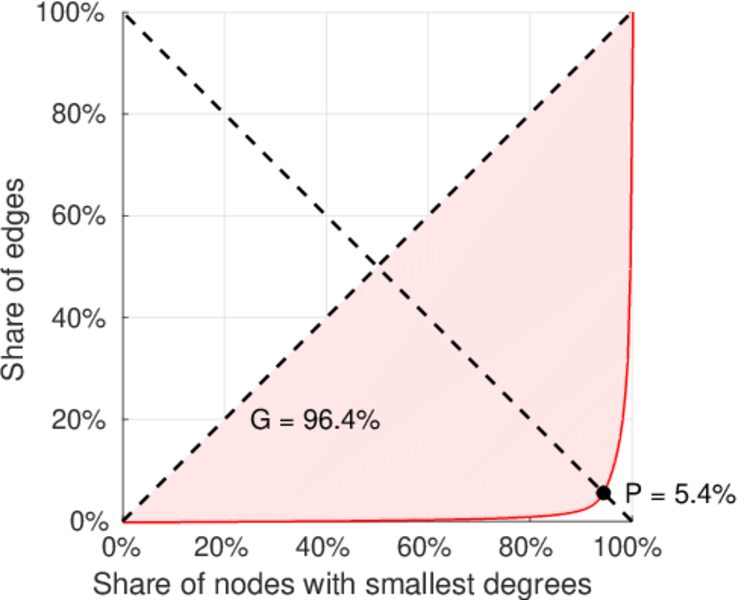
| Left balanced inequality ratio | P1 = | 0.053 995 8
|
| Right balanced inequality ratio | P2 = | 0.213 893
|
| Relative edge distribution entropy | Her = | 0.740 439
|
| Power law exponent | γ = | 2.186 87
|
| Tail power law exponent | γt = | 2.281 00
|
| Tail power law exponent with p | γ3 = | 2.281 00
|
| p-value | p = | 0.000 00
|
| Left tail power law exponent with p | γ3,1 = | 1.651 00
|
| Left p-value | p1 = | 0.000 00
|
| Right tail power law exponent with p | γ3,2 = | 2.001 00
|
| Right p-value | p2 = | 0.000 00
|
| Degree assortativity | ρ = | −0.360 426
|
| Degree assortativity p-value | pρ = | 0.000 00
|
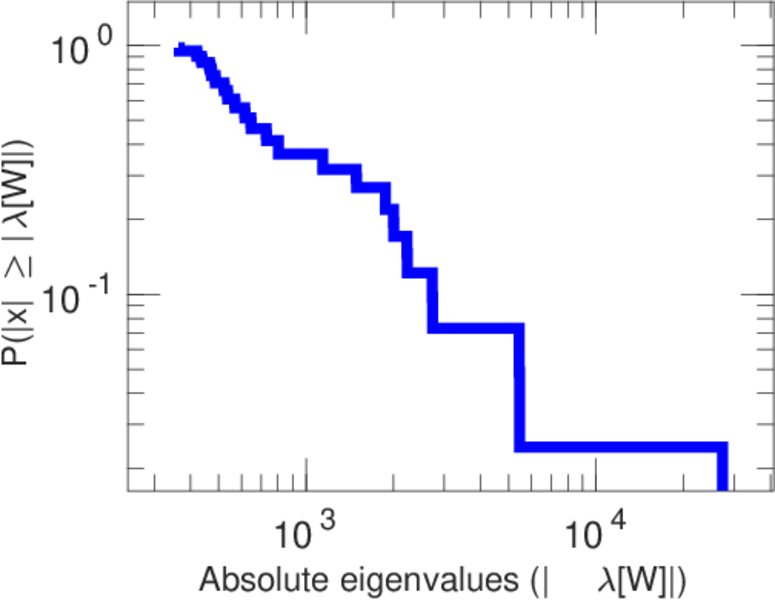
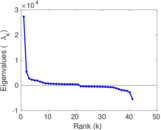
| Spectral norm | α = | 1,393.37
|
| Algebraic connectivity | a = | 0.069 033 0
|
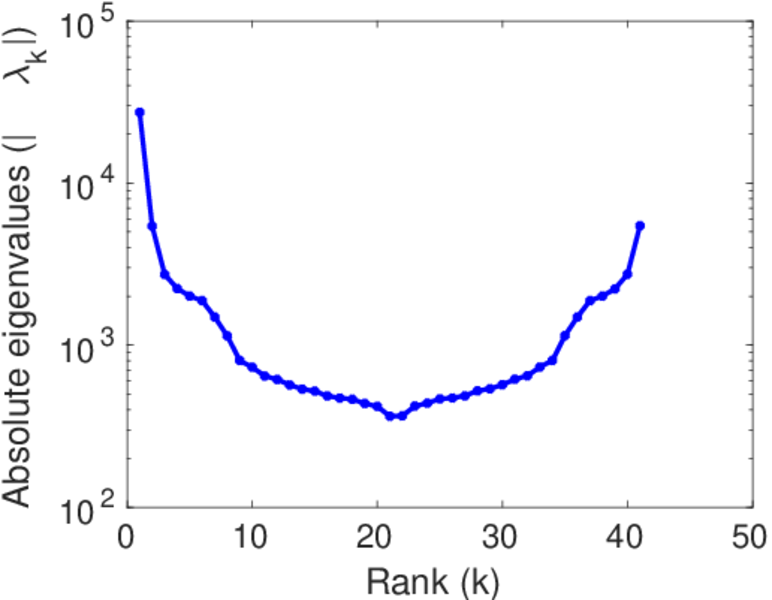
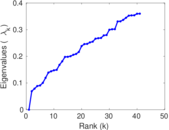
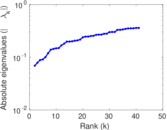
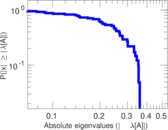
| Spectral separation | |λ1[A] / λ2[A]| = | 2.030 70
|
| Controllability | C = | 24,152
|
| Relative controllability | Cr = | 0.898 111
|
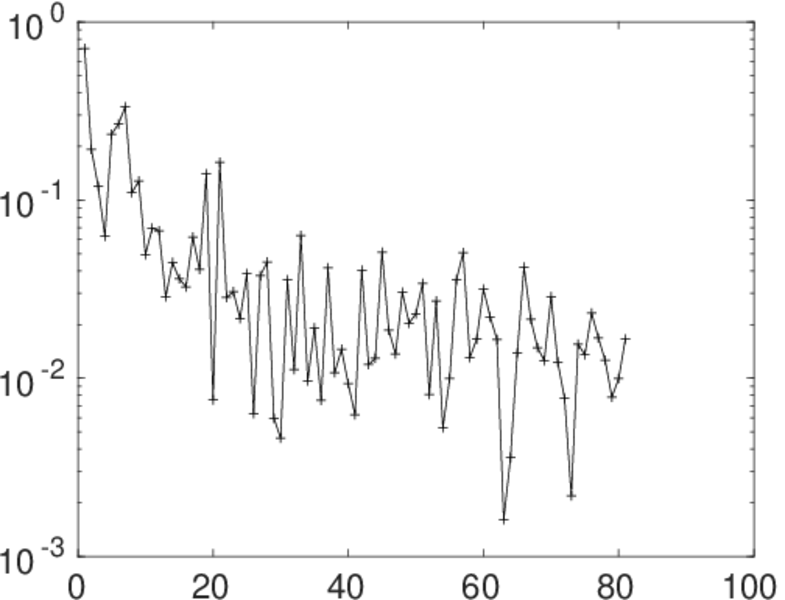
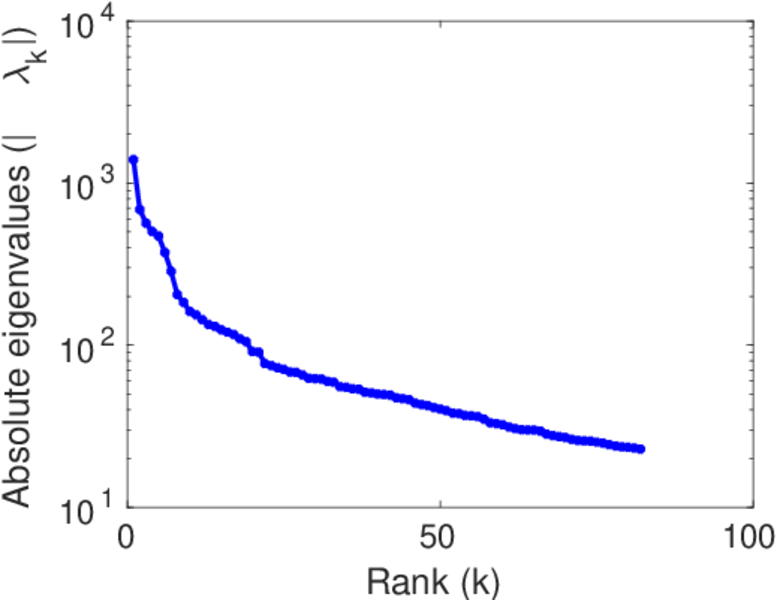
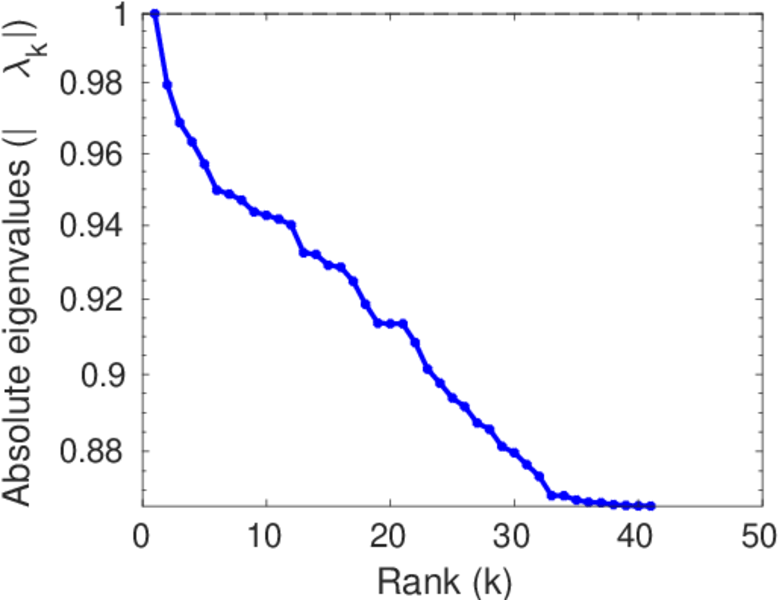
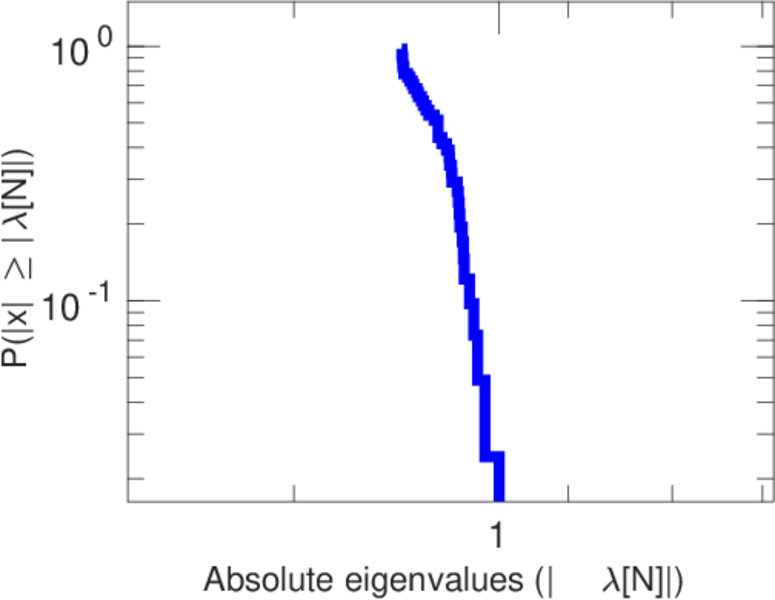
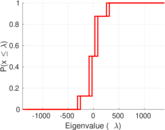
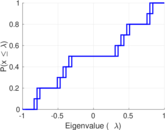
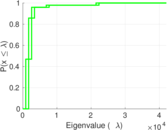
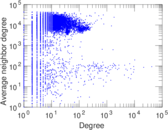
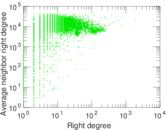
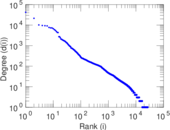
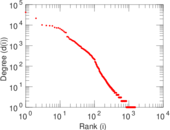
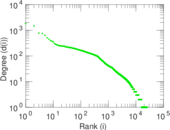
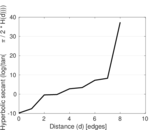
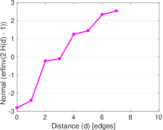
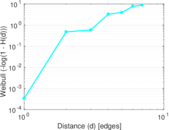
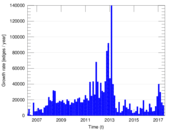
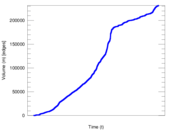
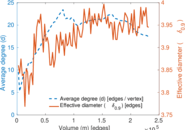
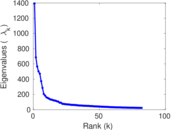
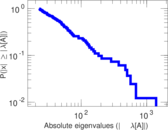
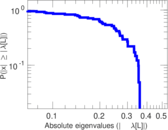
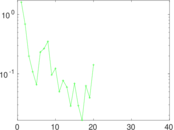
Plots


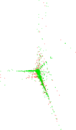


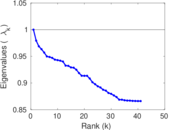
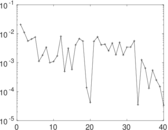
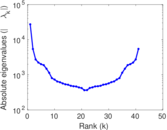
Matrix decompositions plots


Downloads
References
|
[1]
|
Jérôme Kunegis.
KONECT – The Koblenz Network Collection.
In Proc. Int. Conf. on World Wide Web Companion, pages
1343–1350, 2013.
[ http ]
|
|
[2]
|
Wikimedia Foundation.
Wikimedia downloads.
http://dumps.wikimedia.org/, January 2010.
|
 KONECT ‣ Networks ‣
Buy Me a Coffee
KONECT ‣ Networks ‣
Buy Me a Coffee