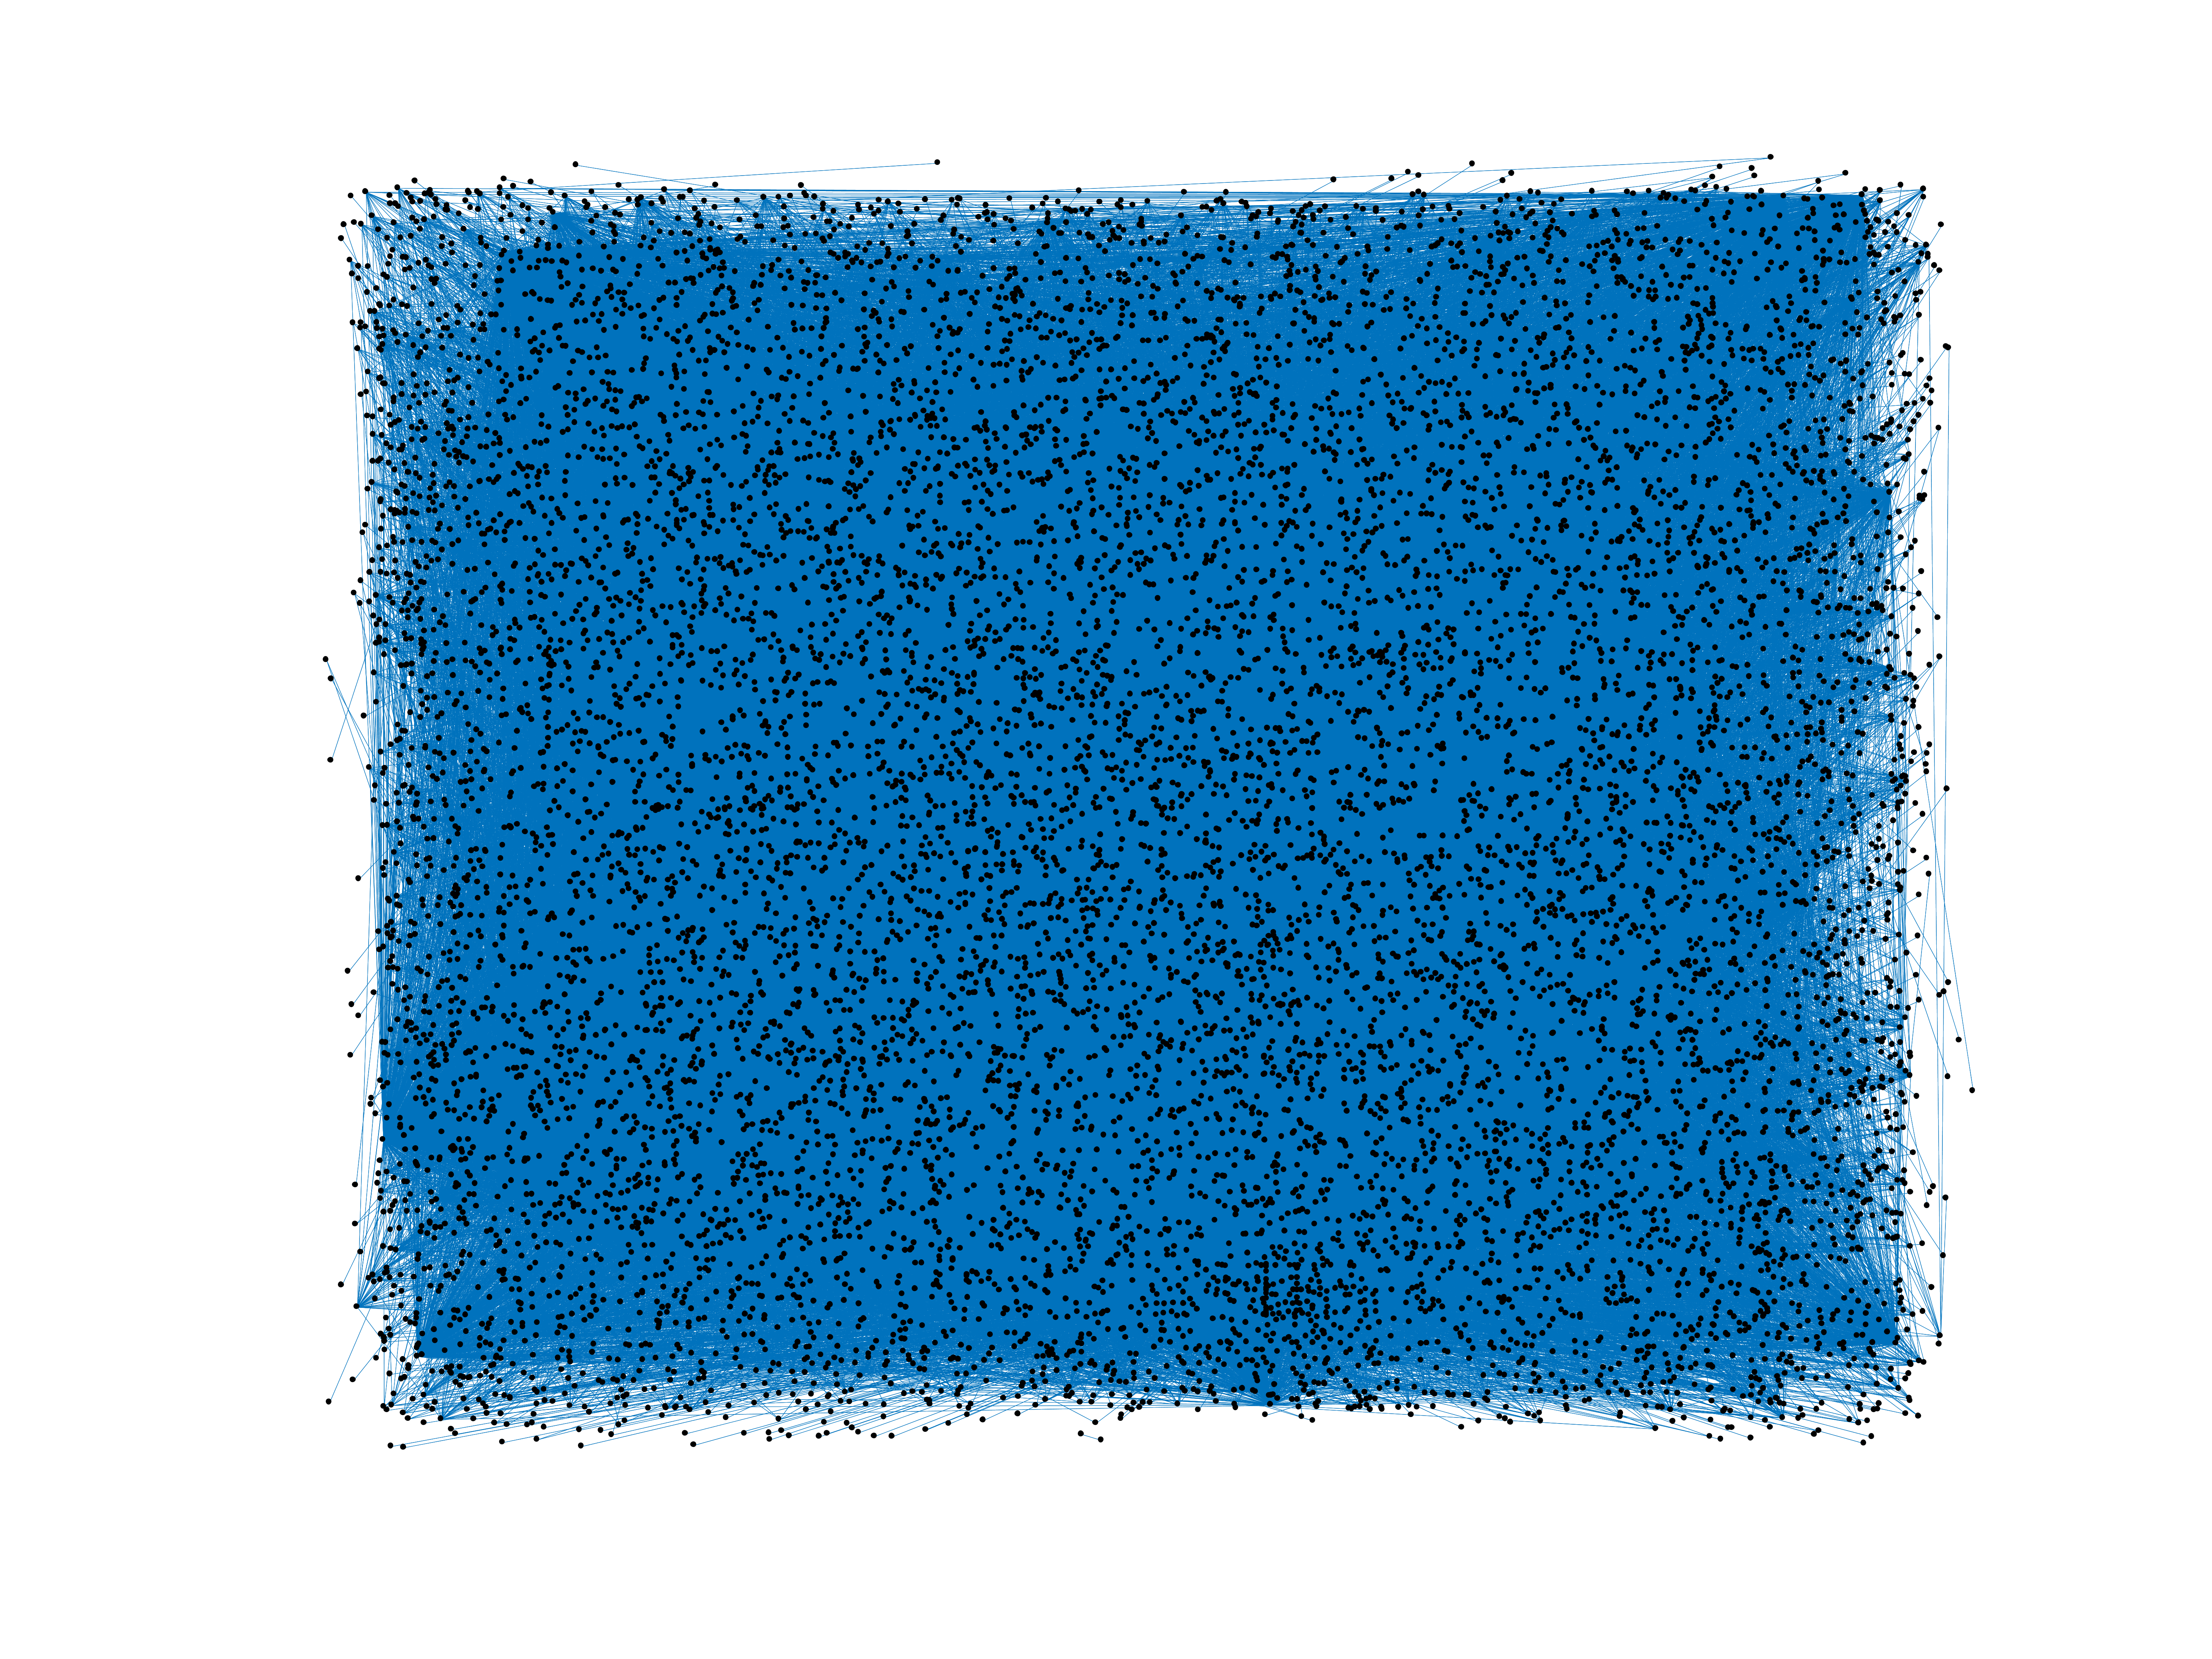
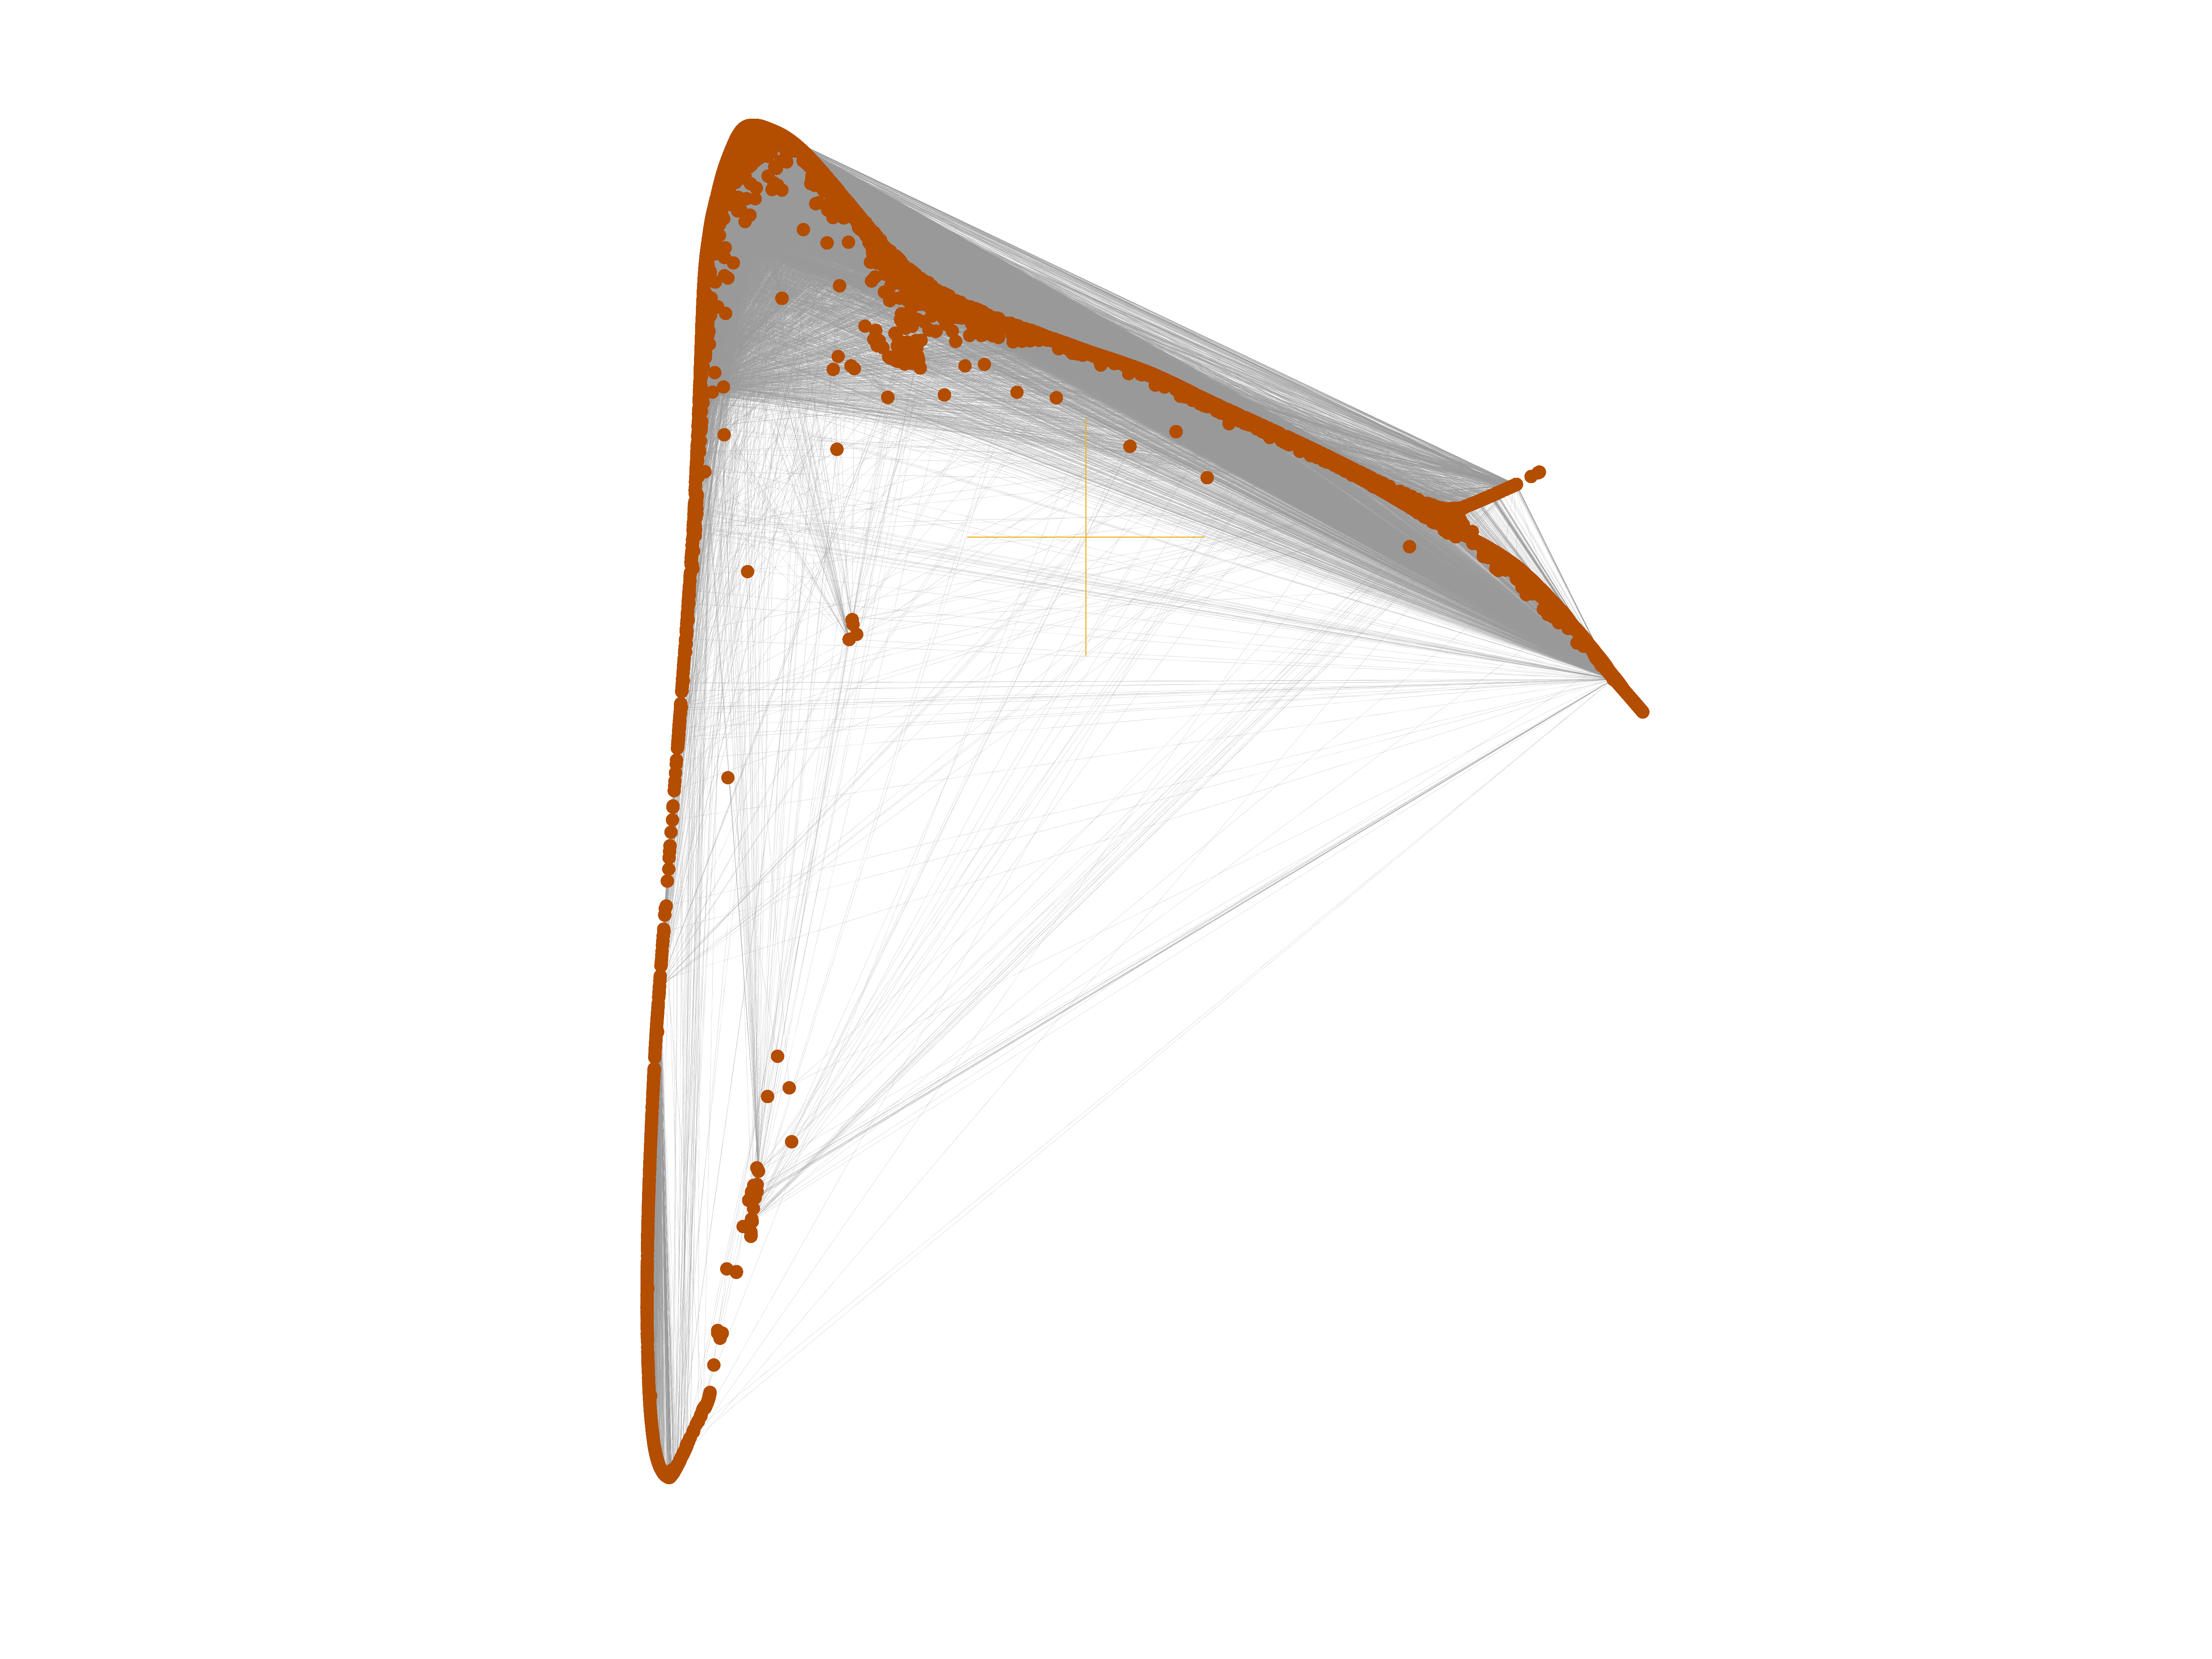
Wikipedia edits (dsb)
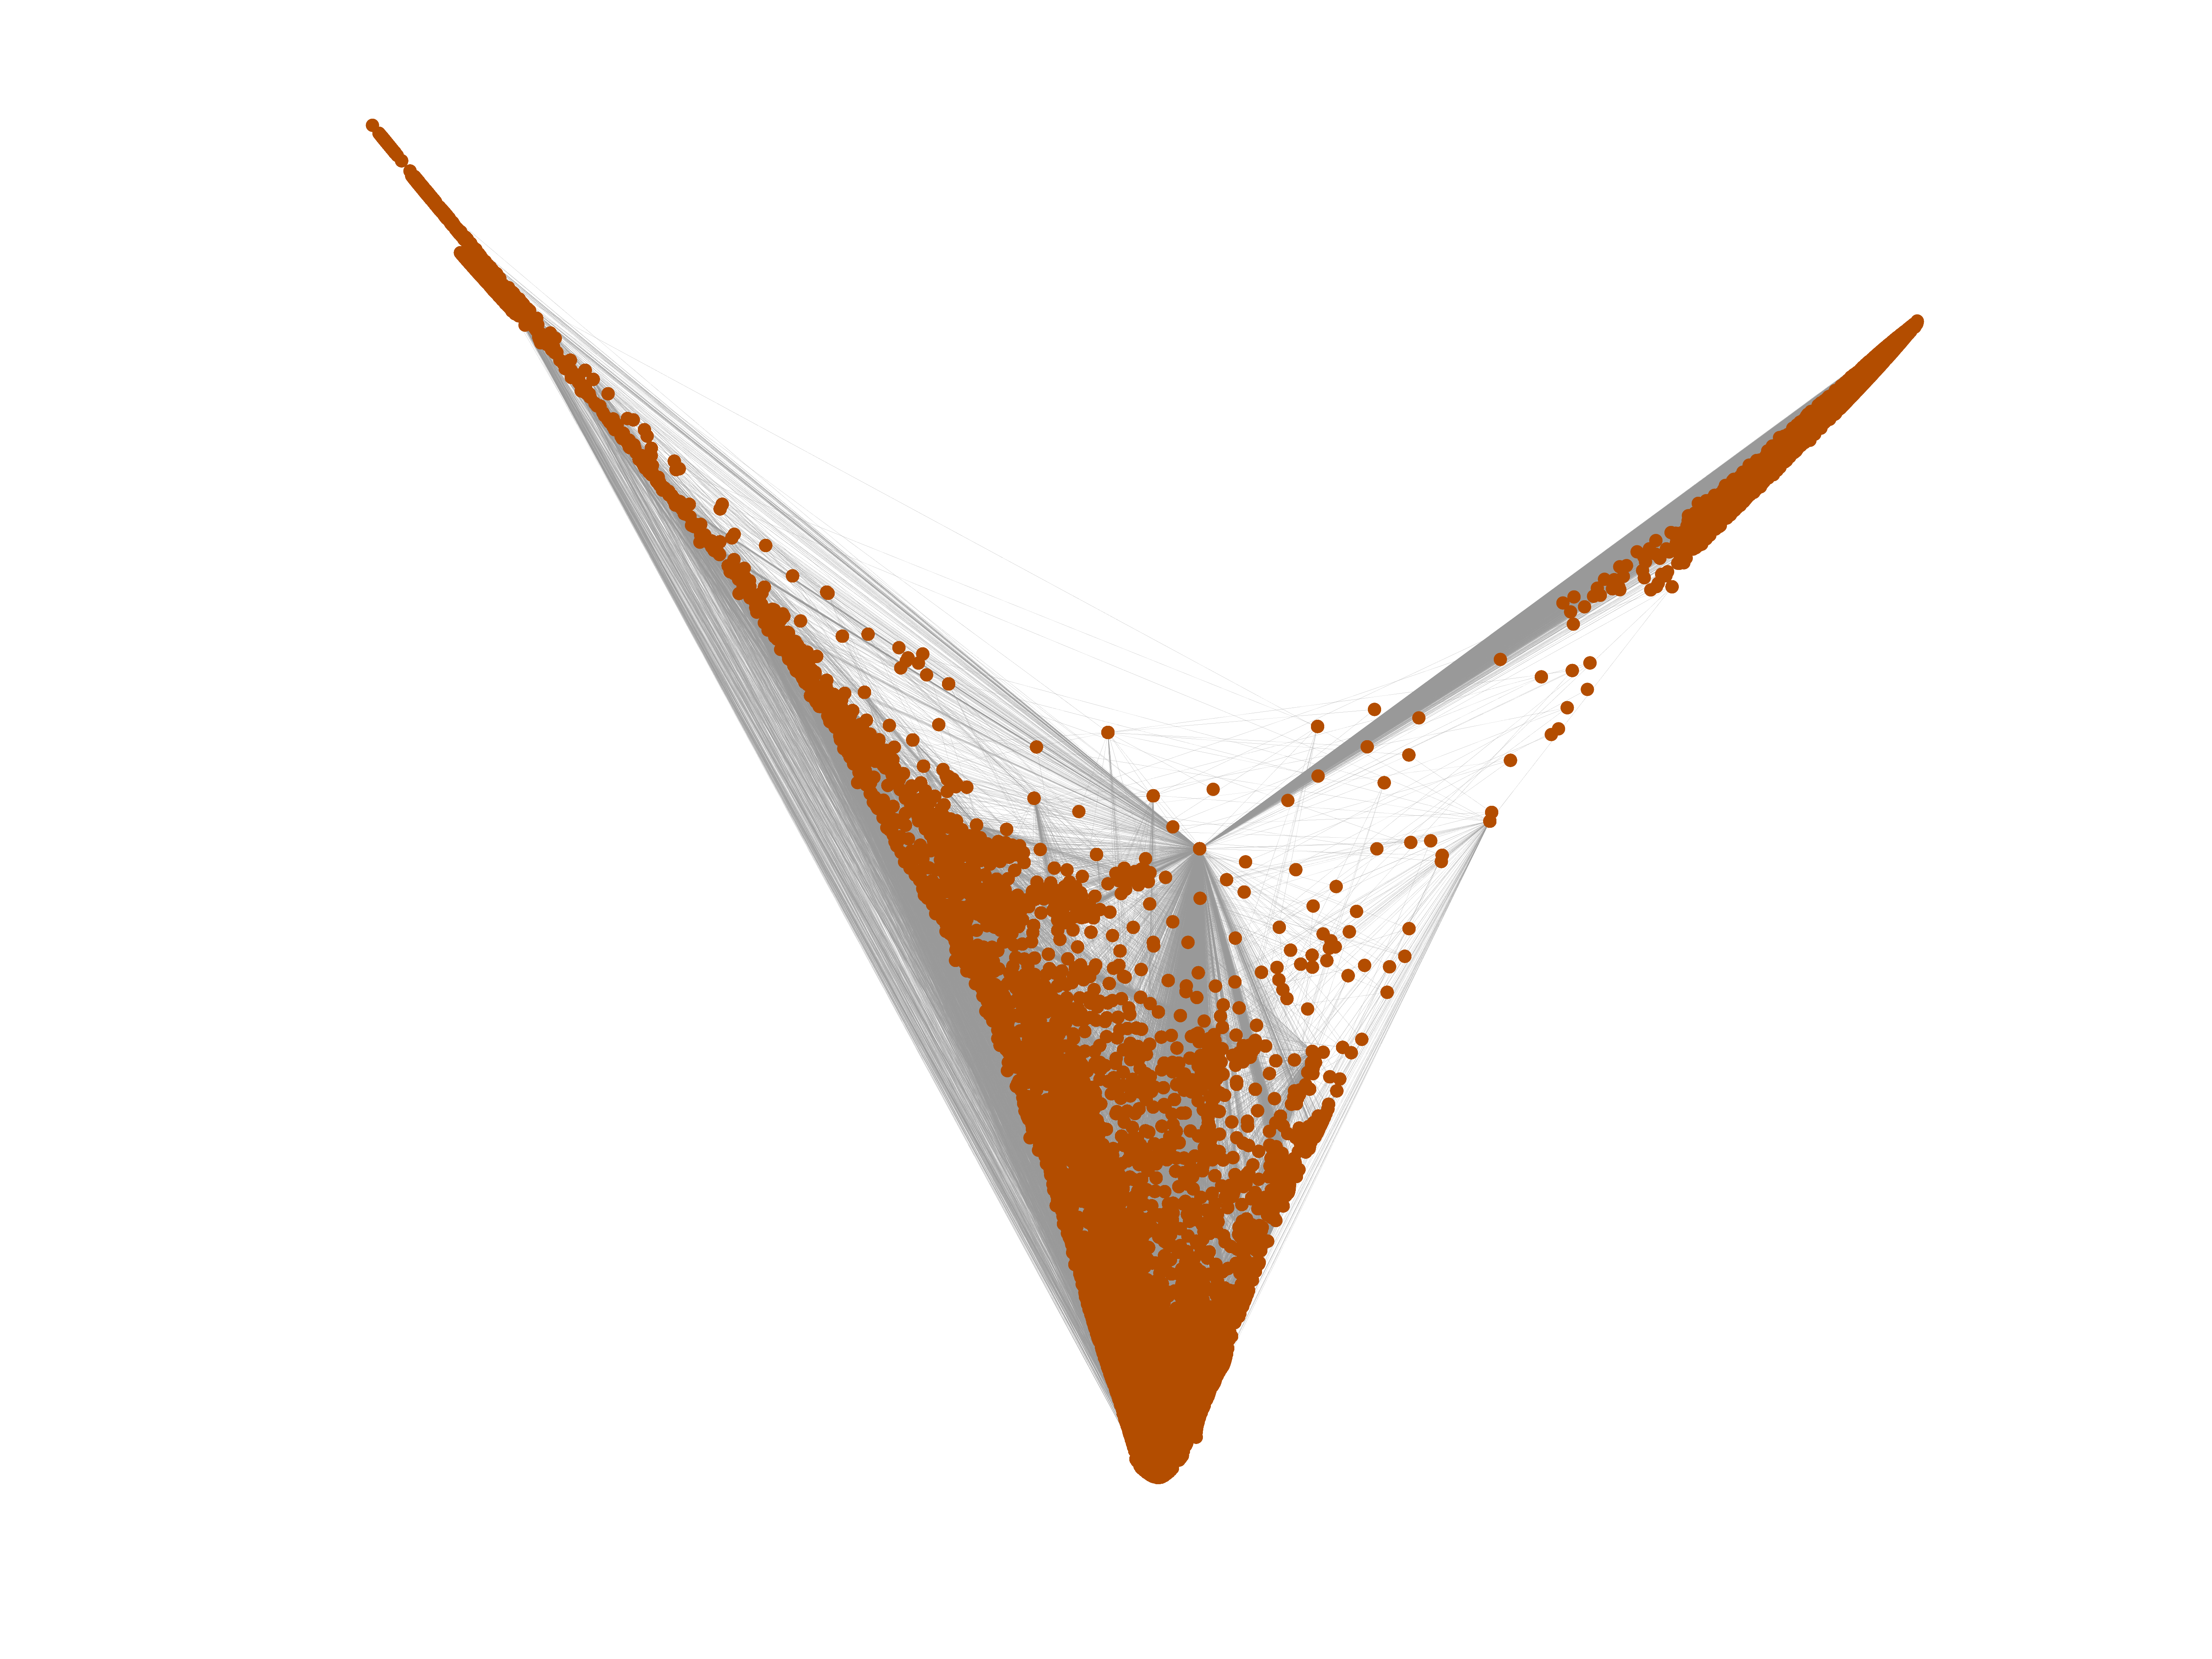
This is the bipartite edit network of the Lower Sorbian Wikipedia. It contains
users and pages from the Lower Sorbian Wikipedia, connected by edit events.
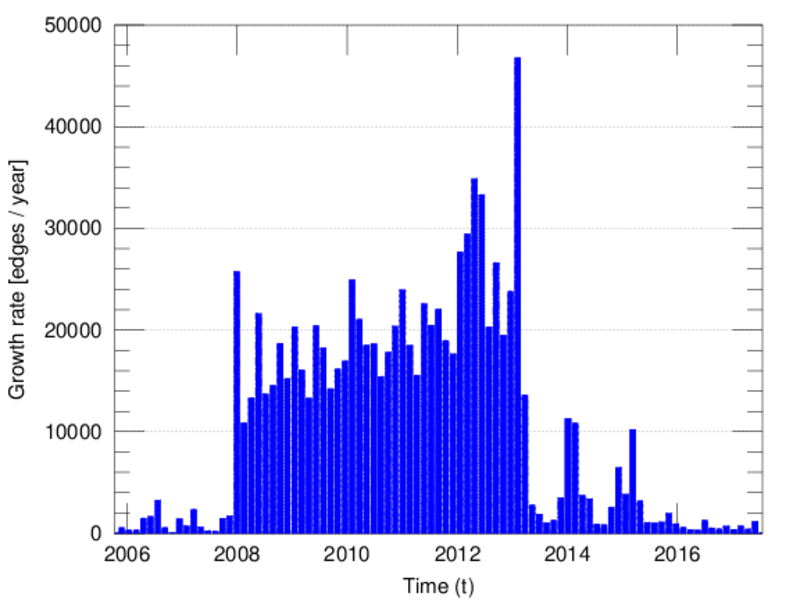
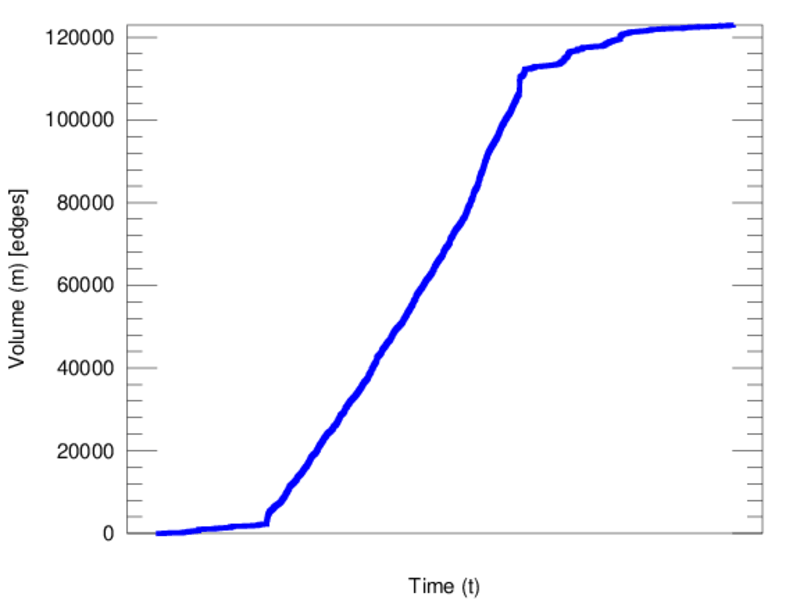
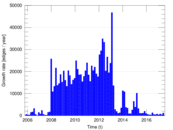
Each edge represents an edit. The dataset includes the timestamp of each edit.
Metadata
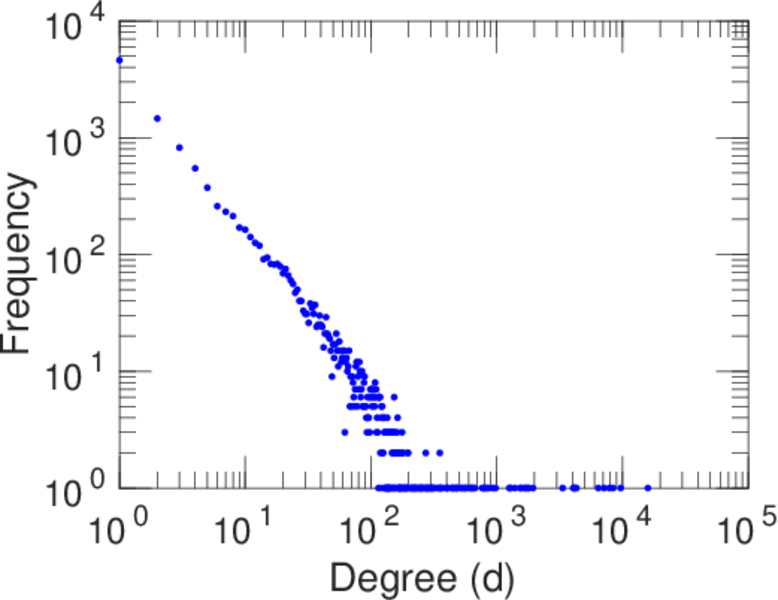
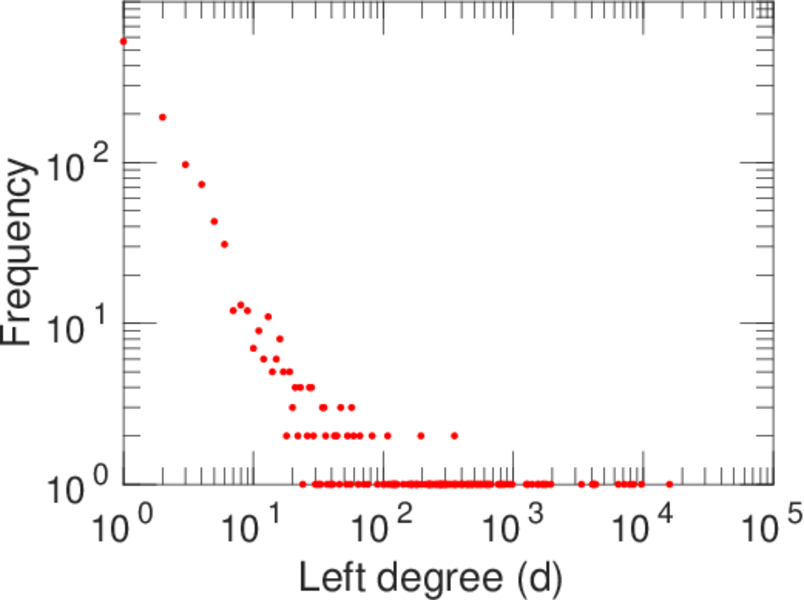
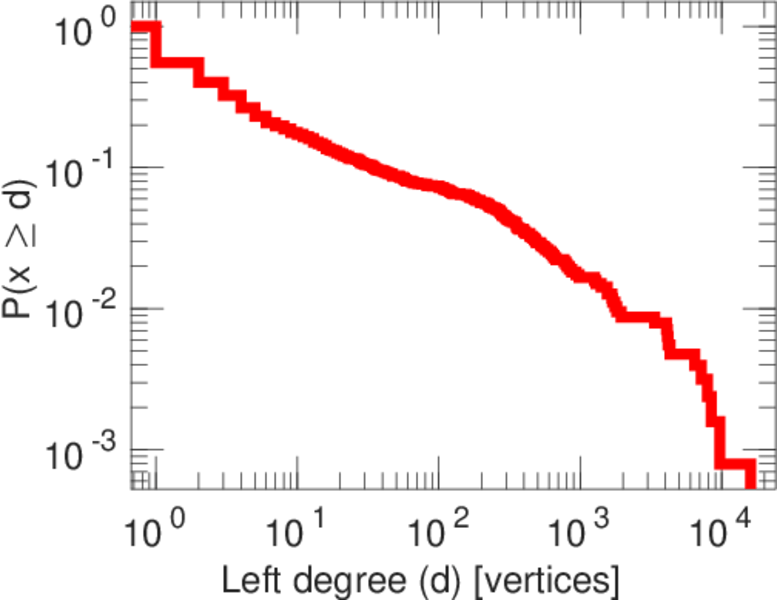
Statistics
| Size | n = | 11,708
|
| Left size | n1 = | 1,261
|
| Right size | n2 = | 10,447
|
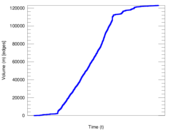
| Volume | m = | 122,987
|
| Unique edge count | m̿ = | 53,392
|
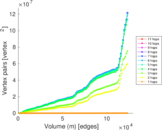
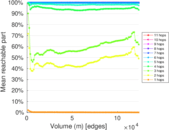
| Wedge count | s = | 52,121,715
|
| Claw count | z = | 84,237,872,789
|
| Cross count | x = | 135,320,554,973,247
|
| Square count | q = | 78,449,755
|
| 4-Tour count | T4 = | 836,286,512
|
| Maximum degree | dmax = | 15,965
|
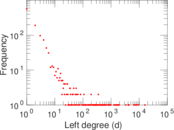
| Maximum left degree | d1max = | 15,965
|
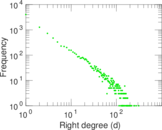
| Maximum right degree | d2max = | 311
|
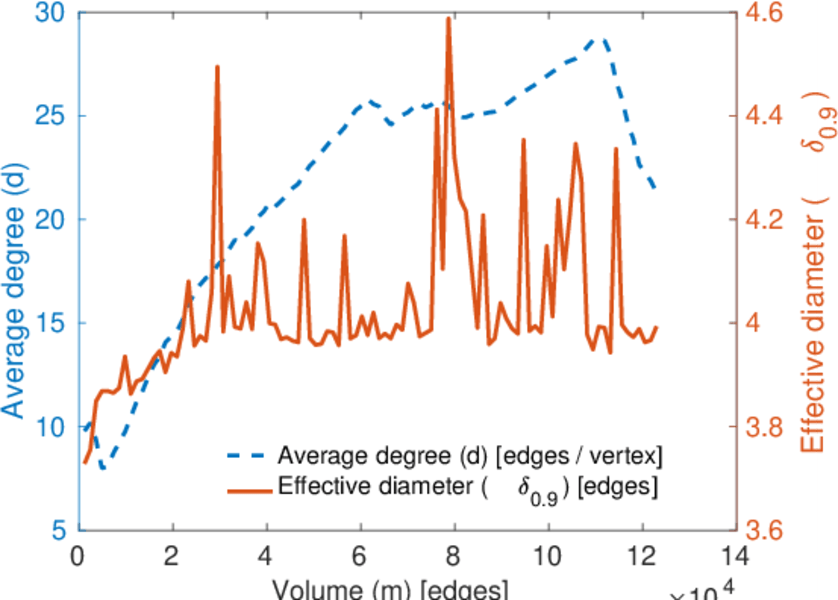
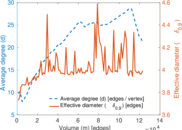
| Average degree | d = | 21.009 1
|
| Average left degree | d1 = | 97.531 3
|
| Average right degree | d2 = | 11.772 5
|
| Fill | p = | 0.004 052 93
|
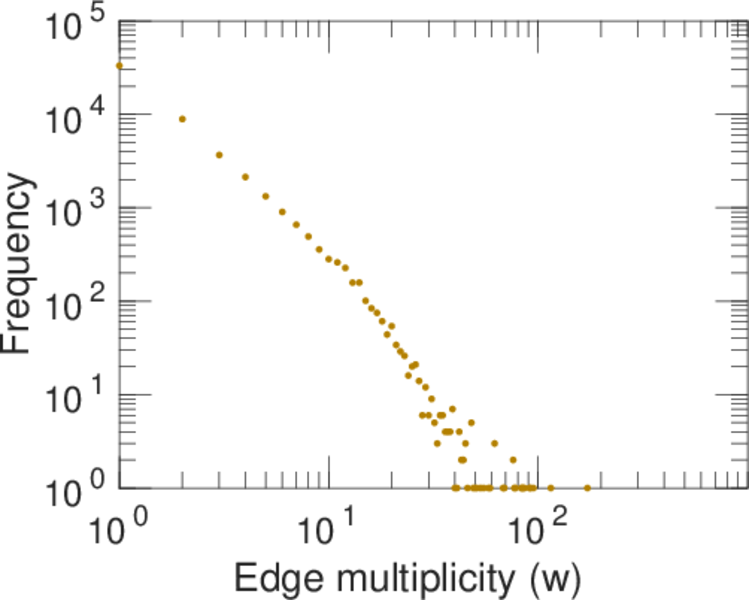
| Average edge multiplicity | m̃ = | 2.303 47
|
| Size of LCC | N = | 11,025
|
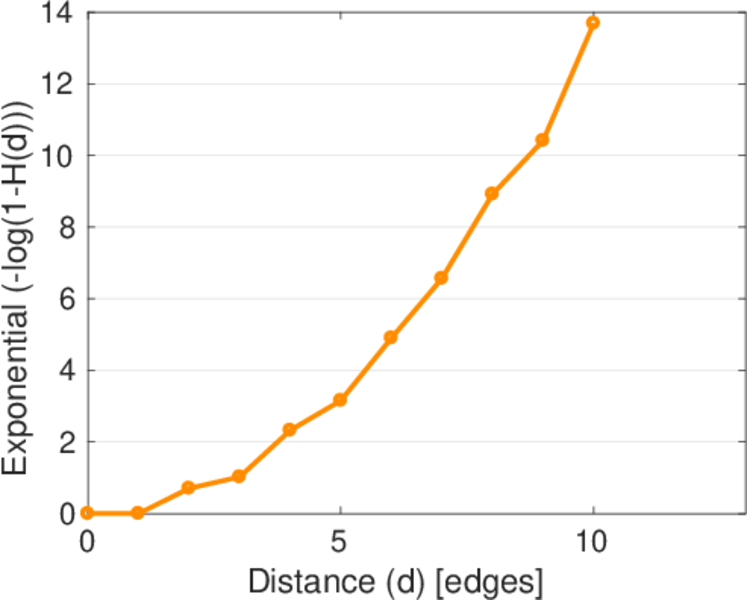
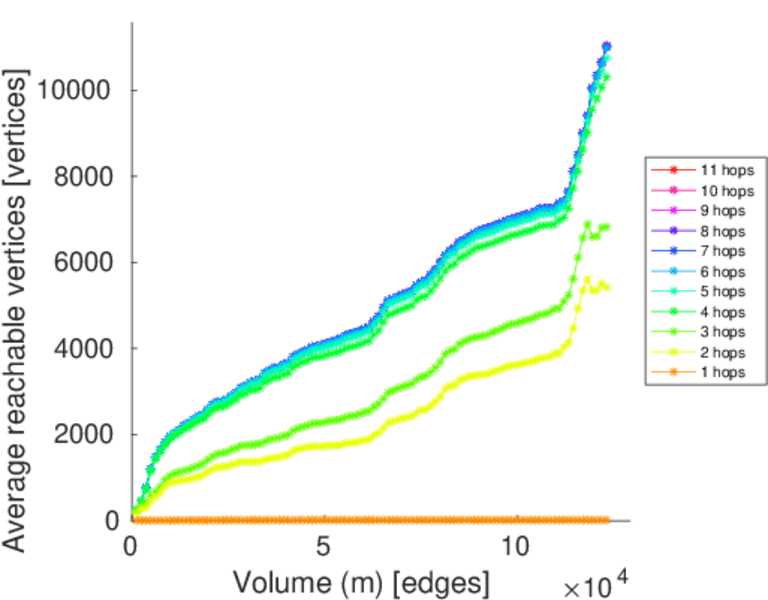
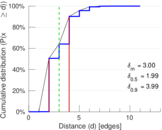
| Diameter | δ = | 11
|
| 50-Percentile effective diameter | δ0.5 = | 1.988 68
|
| 90-Percentile effective diameter | δ0.9 = | 3.991 66
|
| Median distance | δM = | 2
|
| Mean distance | δm = | 3.002 01
|
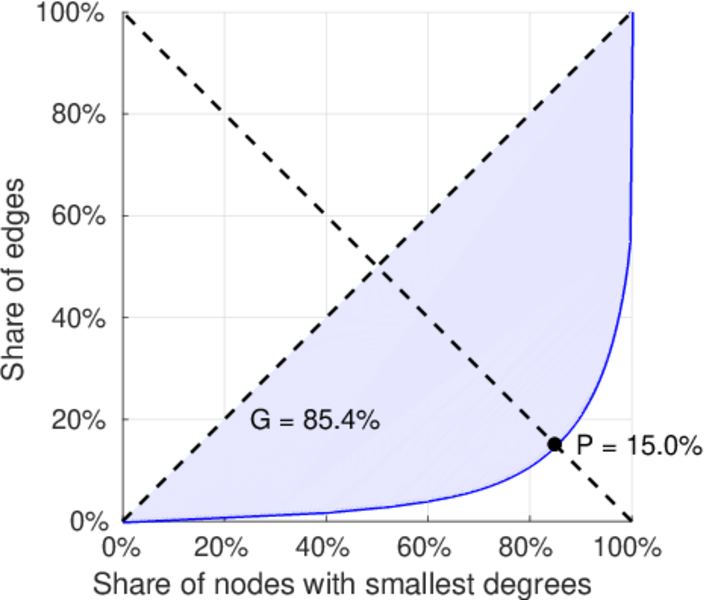
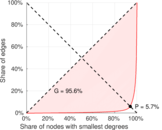
| Gini coefficient | G = | 0.857 564
|
| Balanced inequality ratio | P = | 0.148 857
|
| Left balanced inequality ratio | P1 = | 0.057 095 5
|
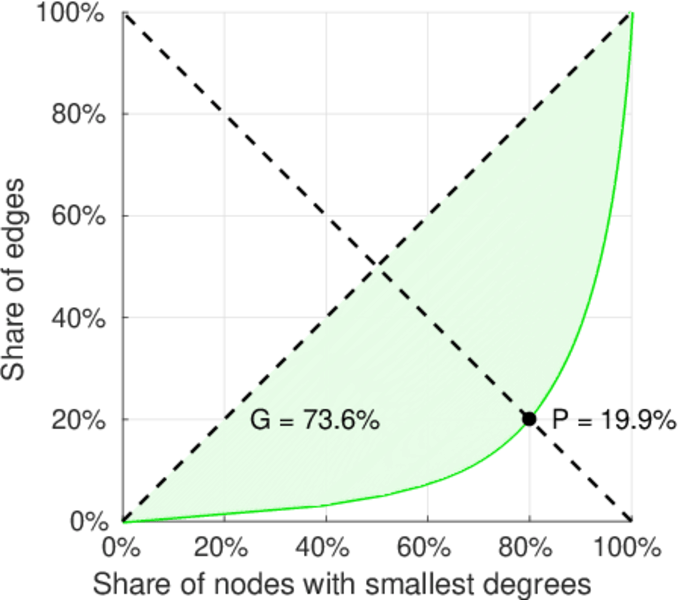
| Right balanced inequality ratio | P2 = | 0.199 208
|
| Relative edge distribution entropy | Her = | 0.757 135
|
| Power law exponent | γ = | 2.096 83
|
| Tail power law exponent | γt = | 1.731 00
|
| Tail power law exponent with p | γ3 = | 1.731 00
|
| p-value | p = | 0.000 00
|
| Left tail power law exponent with p | γ3,1 = | 1.681 00
|
| Left p-value | p1 = | 0.000 00
|
| Right tail power law exponent with p | γ3,2 = | 1.731 00
|
| Right p-value | p2 = | 0.000 00
|
| Degree assortativity | ρ = | −0.387 714
|
| Degree assortativity p-value | pρ = | 0.000 00
|
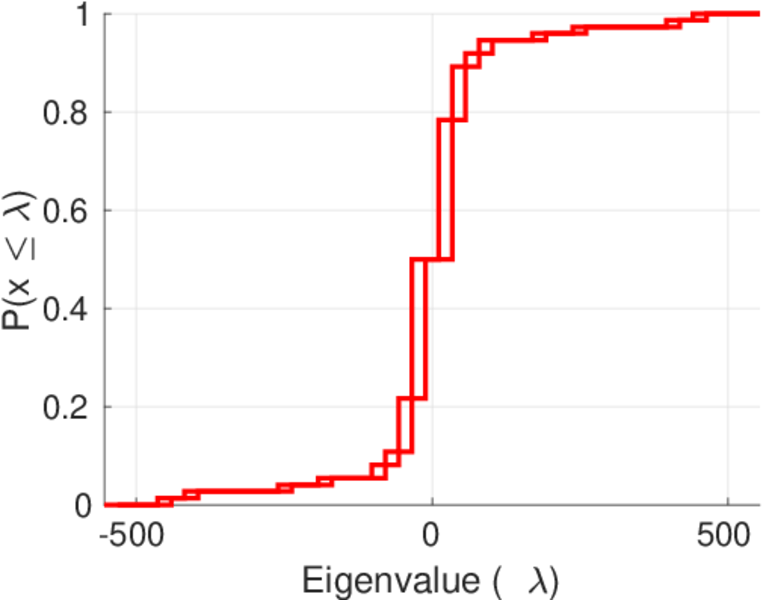
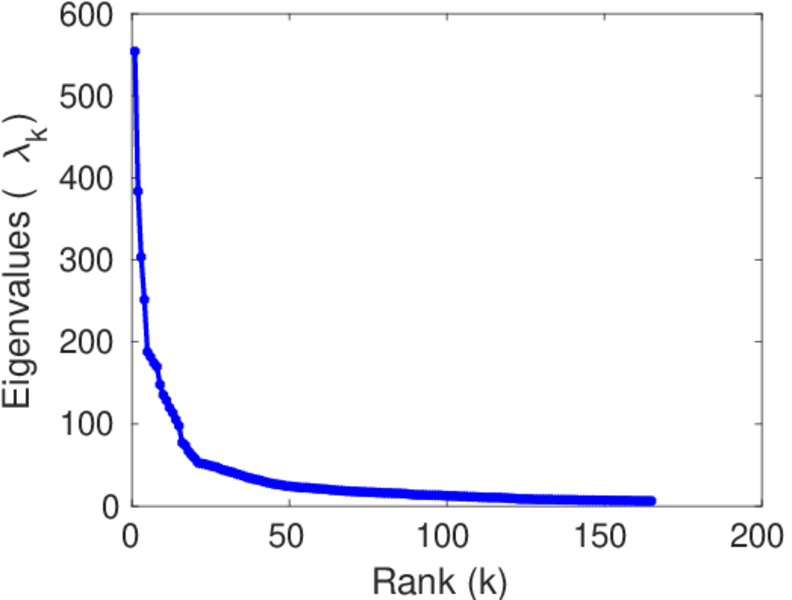
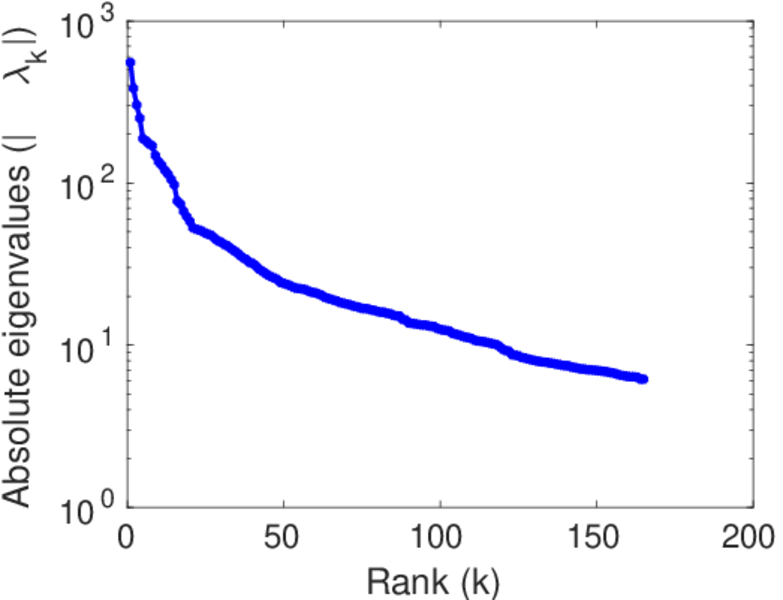
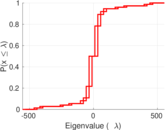
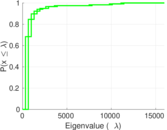
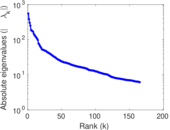
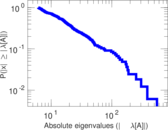
| Spectral norm | α = | 554.035
|
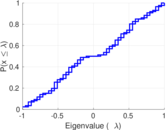
| Algebraic connectivity | a = | 0.027 321 3
|
| Spectral separation | |λ1[A] / λ2[A]| = | 1.444 02
|
| Controllability | C = | 9,258
|
| Relative controllability | Cr = | 0.800 727
|
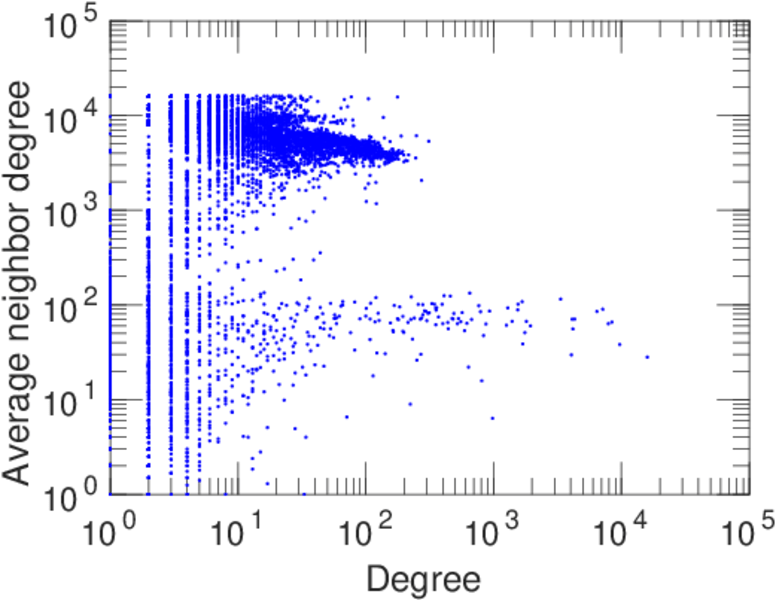
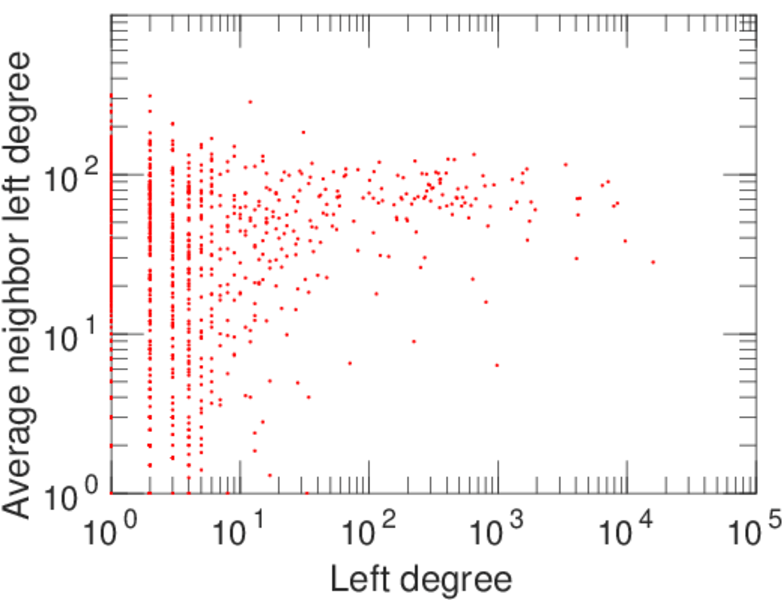
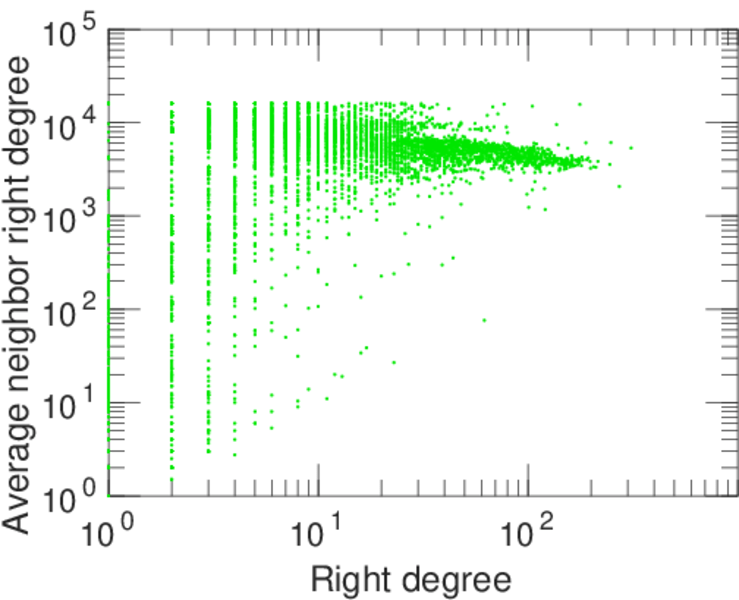
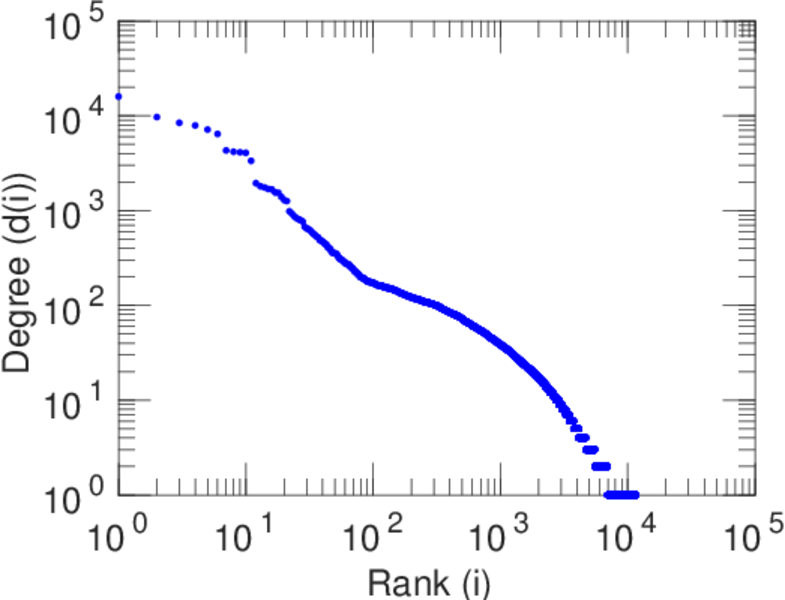
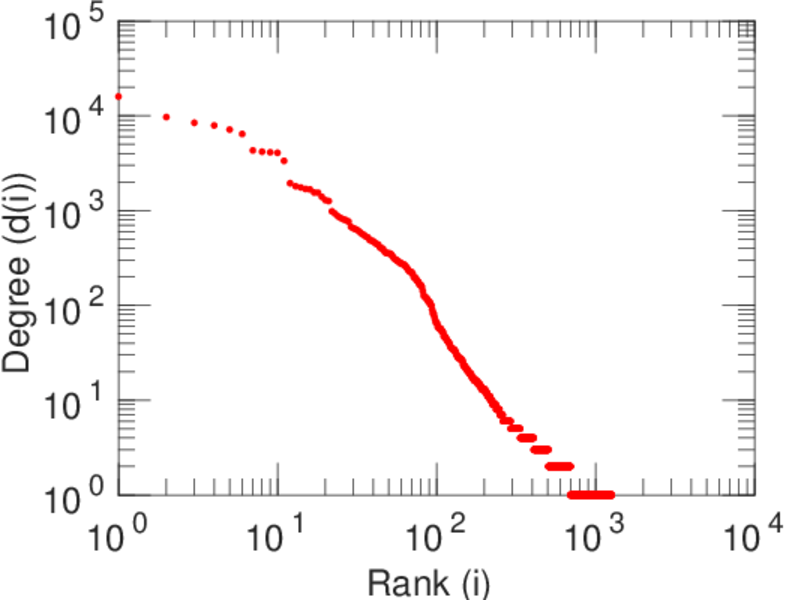
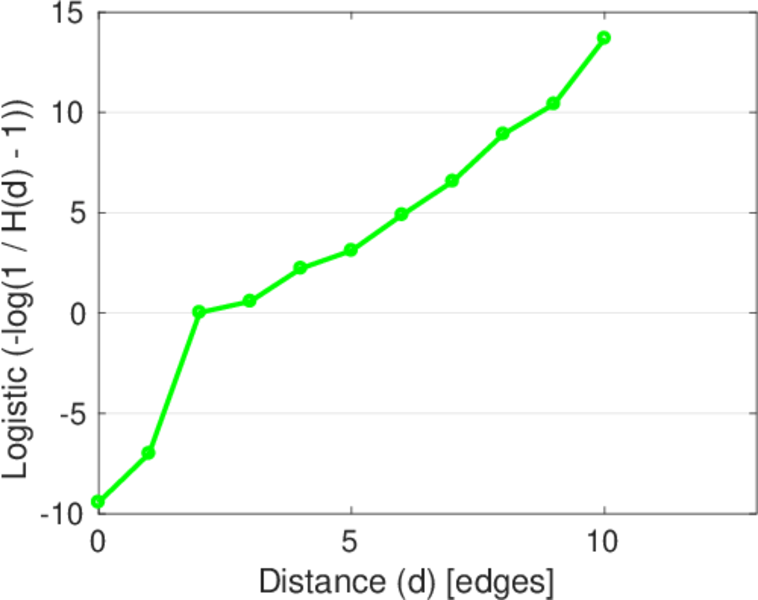
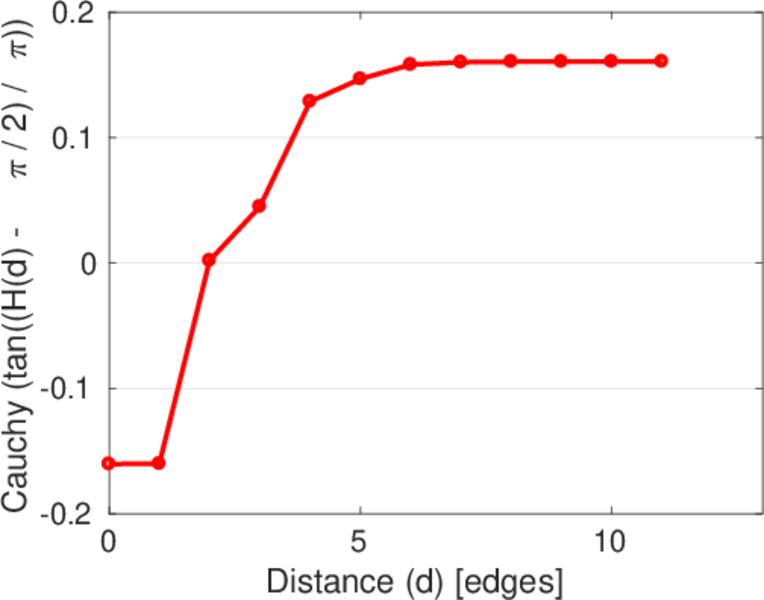
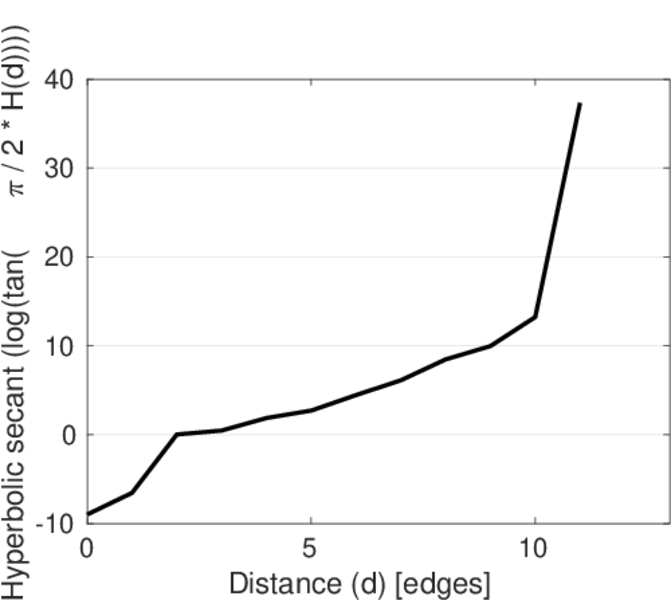
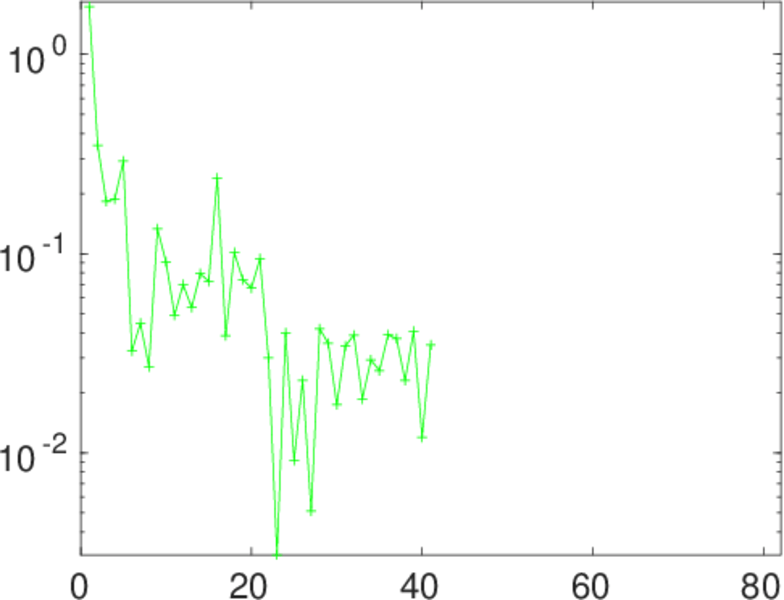
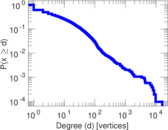
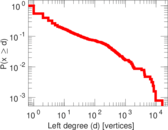
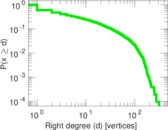
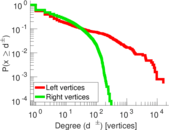
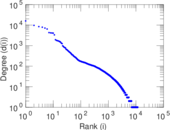
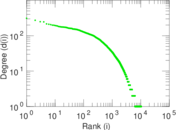
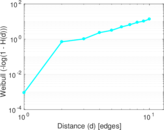
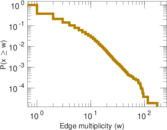
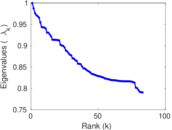
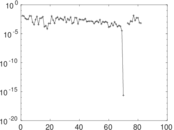
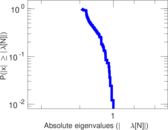
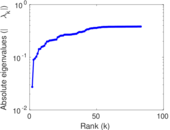
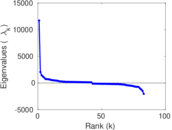
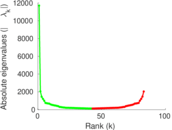
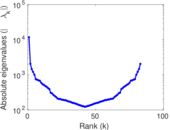
Plots


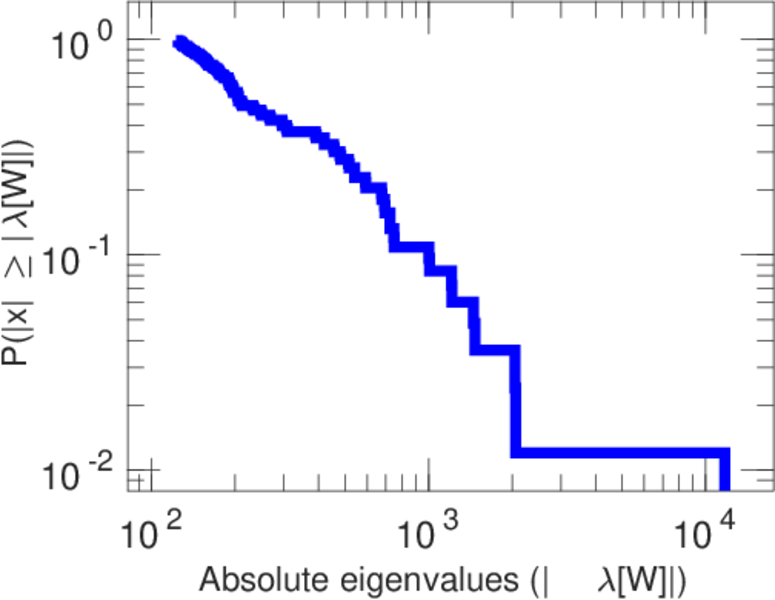
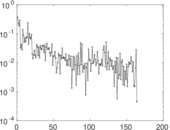
Matrix decompositions plots


Downloads
References
|
[1]
|
Jérôme Kunegis.
KONECT – The Koblenz Network Collection.
In Proc. Int. Conf. on World Wide Web Companion, pages
1343–1350, 2013.
[ http ]
|
|
[2]
|
Wikimedia Foundation.
Wikimedia downloads.
http://dumps.wikimedia.org/, January 2010.
|
 KONECT ‣ Networks ‣
Buy Me a Coffee
KONECT ‣ Networks ‣
Buy Me a Coffee