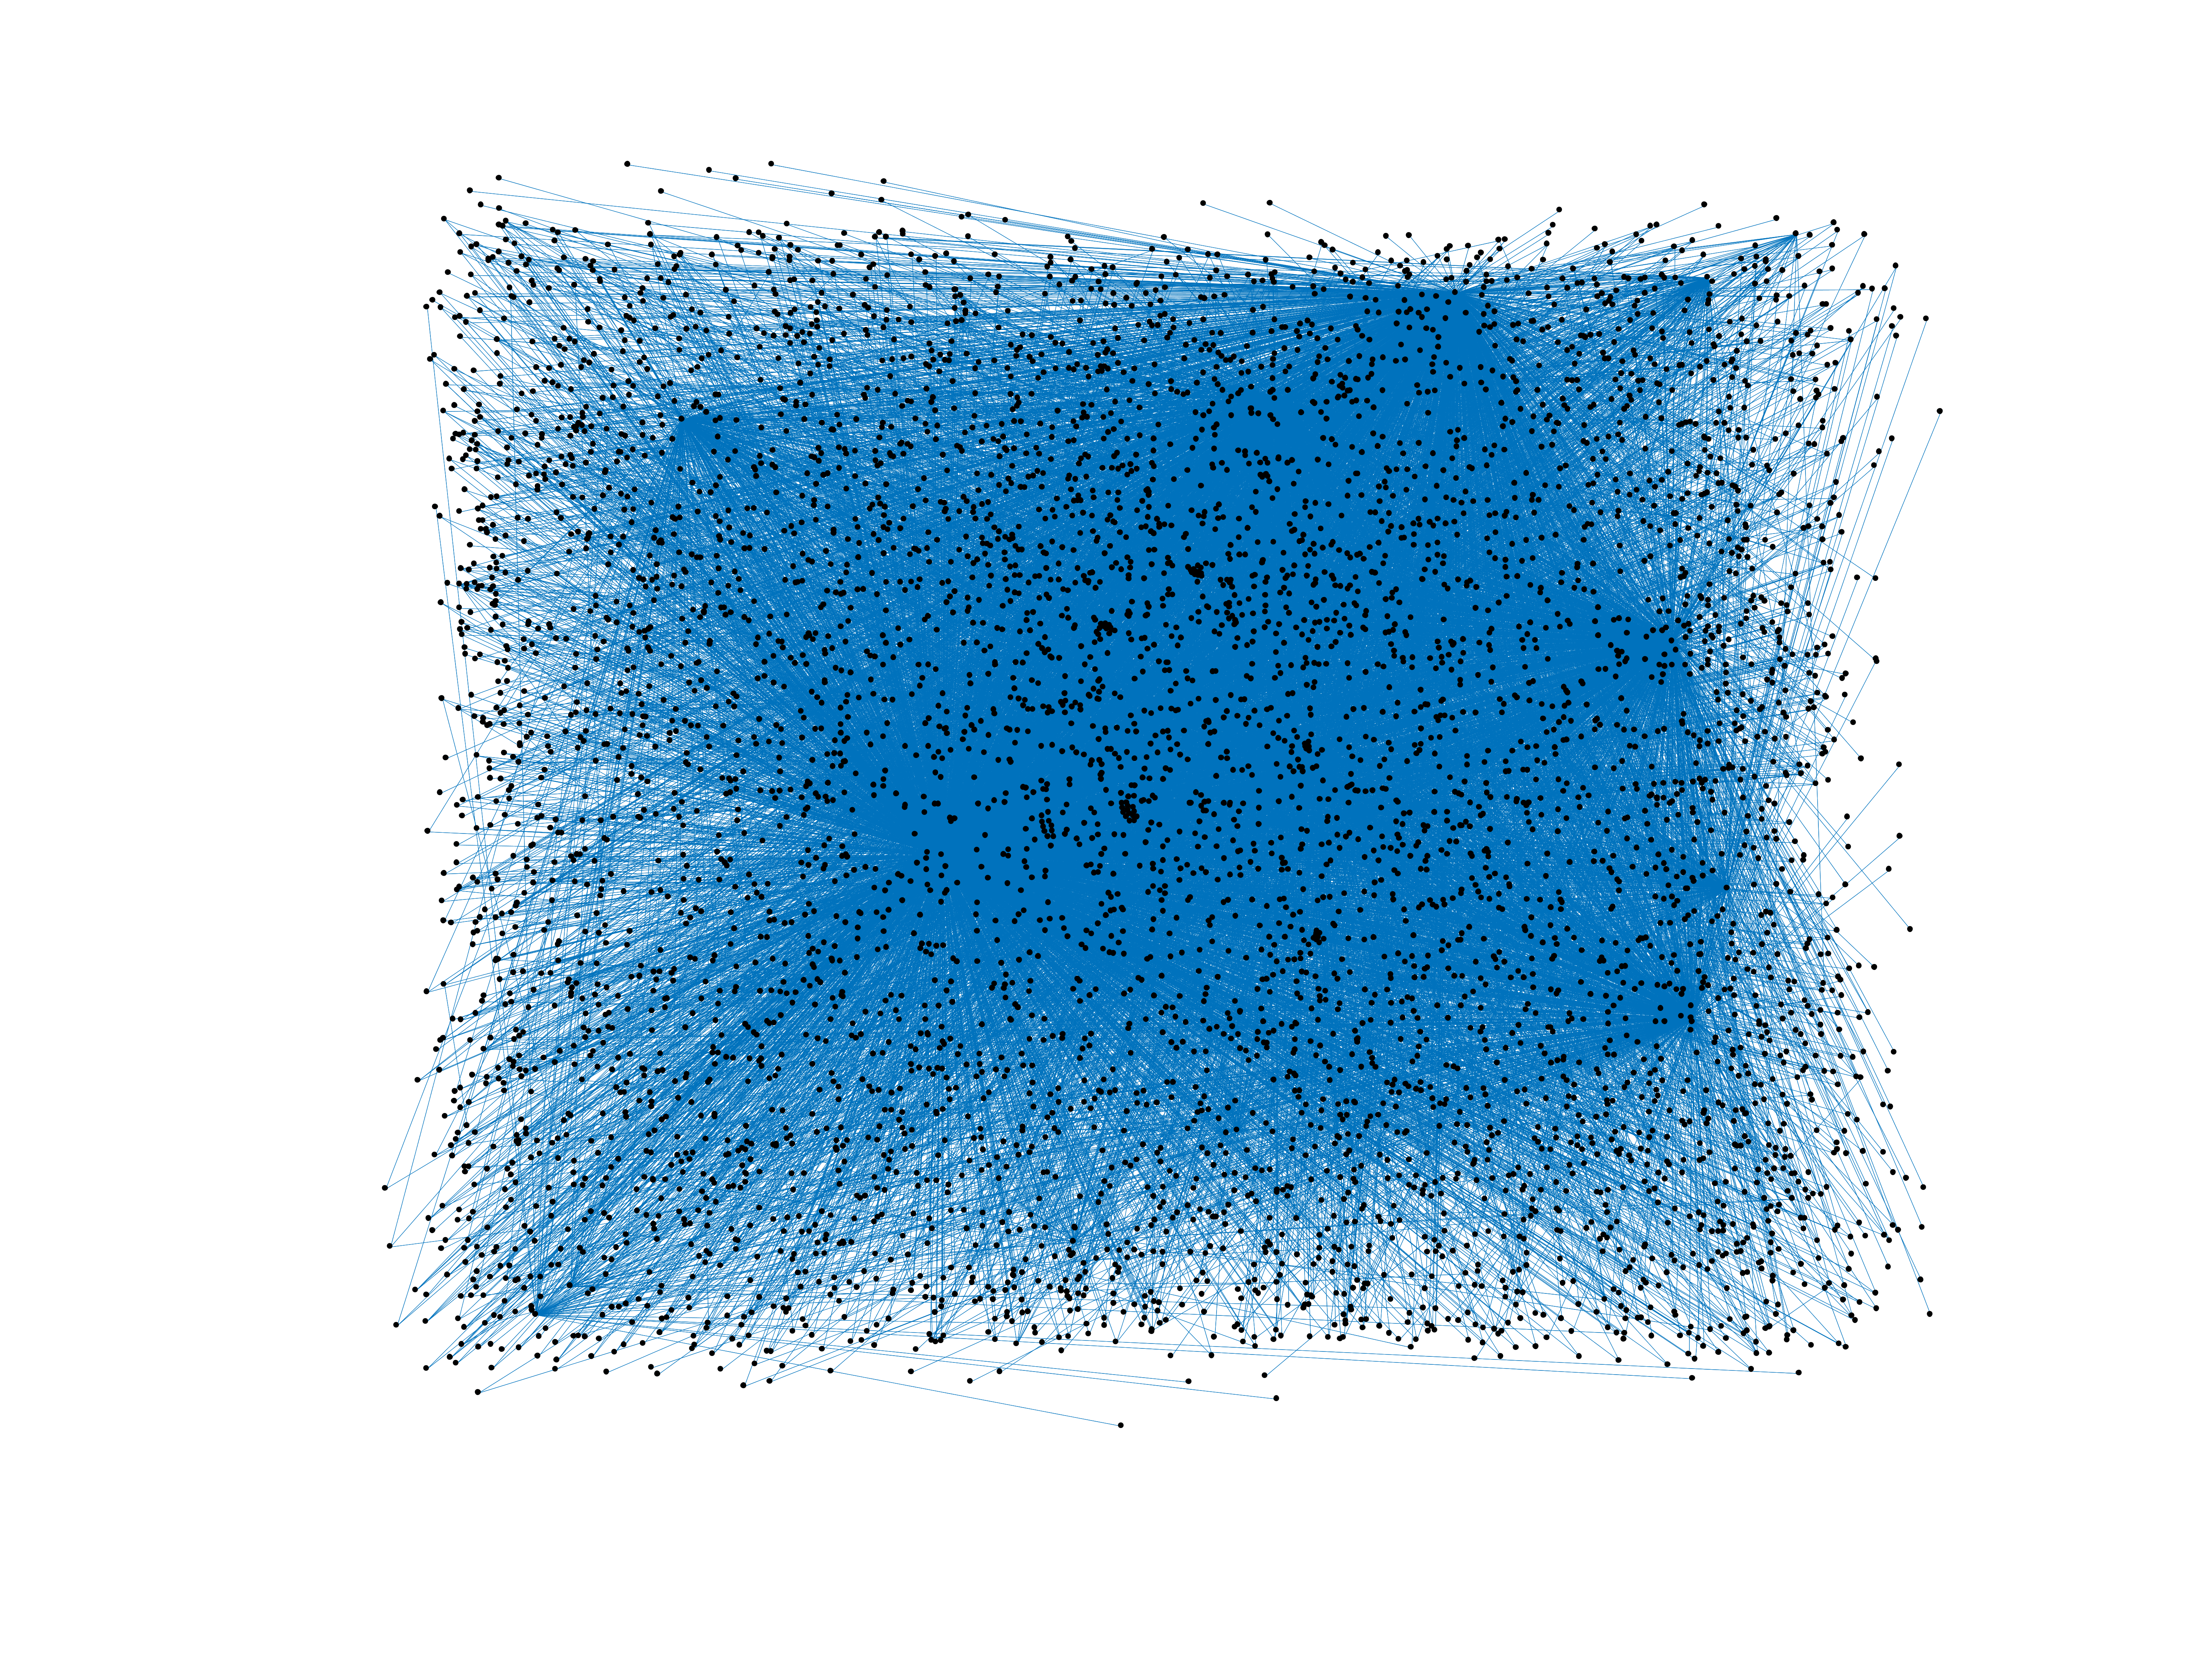
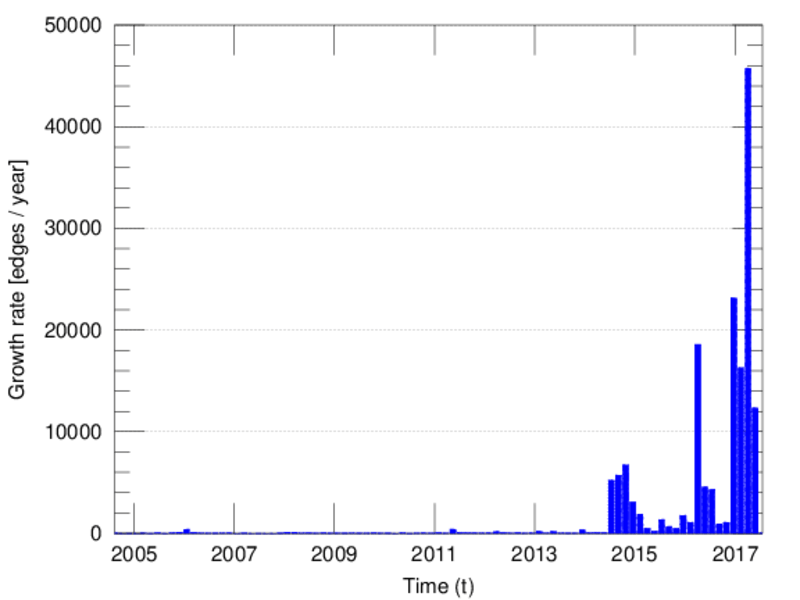
Wikipedia edits (dty)
This is the bipartite edit network of the डोटेली Wikipedia. It
contains users and pages from the डोटेली Wikipedia, connected by
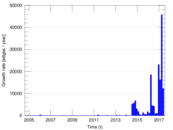
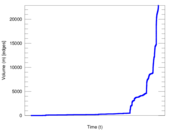
edit events. Each edge represents an edit. The dataset includes the timestamp
of each edit.
Metadata
Statistics
| Size | n = | 5,803
|
| Left size | n1 = | 171
|
| Right size | n2 = | 5,632
|
| Volume | m = | 22,875
|
| Unique edge count | m̿ = | 12,126
|
| Wedge count | s = | 11,611,331
|
| Claw count | z = | 11,089,452,028
|
| Cross count | x = | 9,350,274,736,102
|
| Square count | q = | 2,769,298
|
| 4-Tour count | T4 = | 68,623,960
|
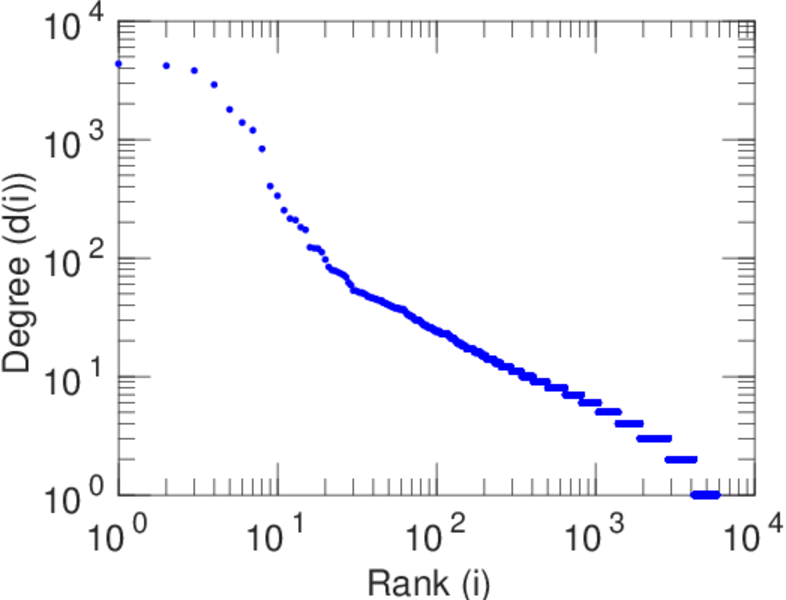
| Maximum degree | dmax = | 4,353
|
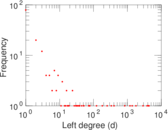
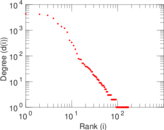
| Maximum left degree | d1max = | 4,353
|
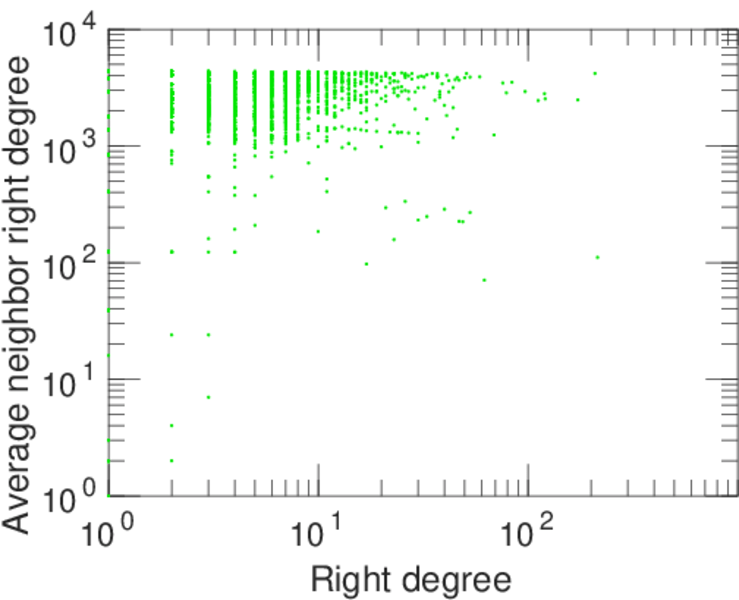
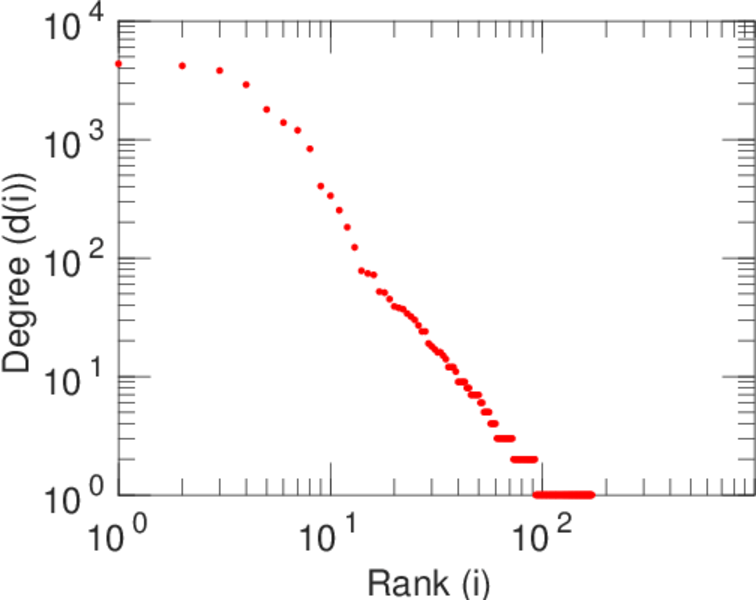
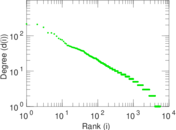
| Maximum right degree | d2max = | 215
|
| Average degree | d = | 7.883 85
|
| Average left degree | d1 = | 133.772
|
| Average right degree | d2 = | 4.061 61
|
| Fill | p = | 0.012 591 0
|
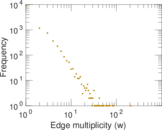
| Average edge multiplicity | m̃ = | 1.886 44
|
| Size of LCC | N = | 5,772
|
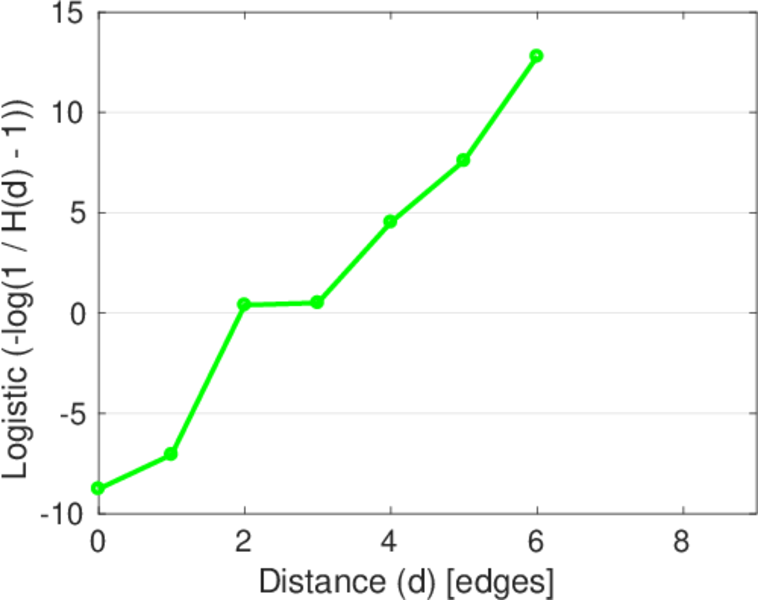
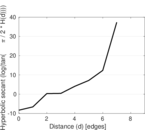
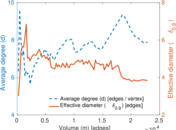
| Diameter | δ = | 8
|
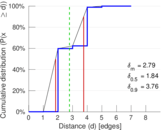
| 50-Percentile effective diameter | δ0.5 = | 1.836 34
|
| 90-Percentile effective diameter | δ0.9 = | 3.756 02
|
| Median distance | δM = | 2
|
| Mean distance | δm = | 2.789 19
|
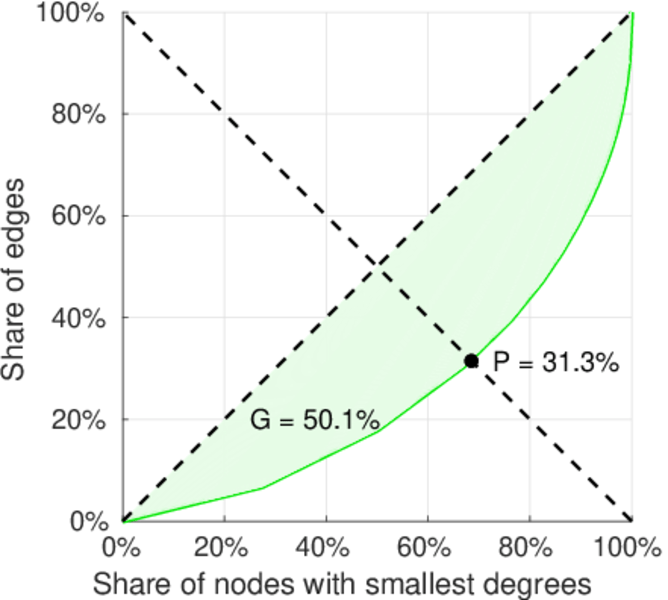
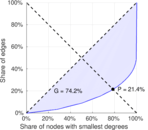
| Gini coefficient | G = | 0.745 546
|
| Balanced inequality ratio | P = | 0.214 273
|
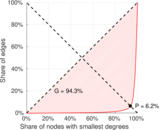
| Left balanced inequality ratio | P1 = | 0.061 814 2
|
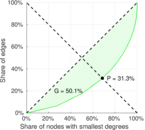
| Right balanced inequality ratio | P2 = | 0.313 399
|
| Relative edge distribution entropy | Her = | 0.704 489
|
| Power law exponent | γ = | 2.539 31
|
| Tail power law exponent | γt = | 4.141 00
|
| Tail power law exponent with p | γ3 = | 4.141 00
|
| p-value | p = | 0.000 00
|
| Left tail power law exponent with p | γ3,1 = | 1.461 00
|
| Left p-value | p1 = | 0.558 000
|
| Right tail power law exponent with p | γ3,2 = | 5.681 00
|
| Right p-value | p2 = | 0.104 000
|
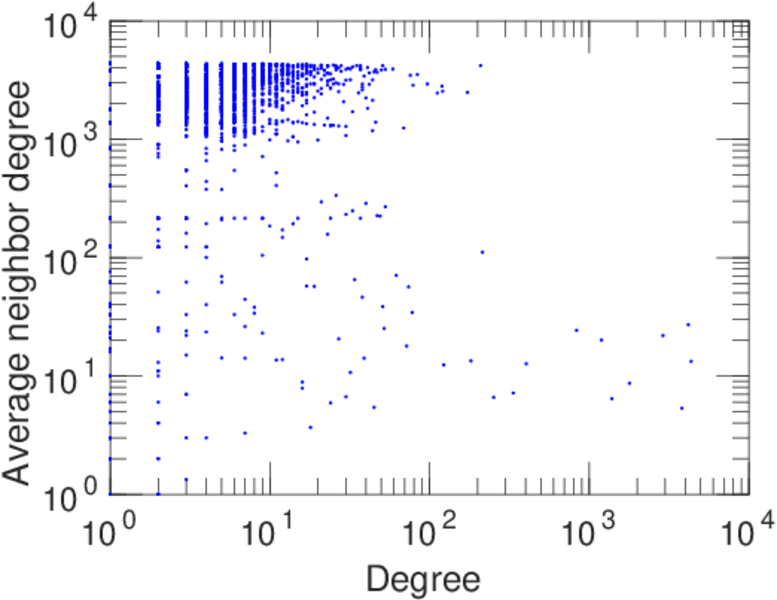
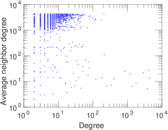
| Degree assortativity | ρ = | −0.128 152
|
| Degree assortativity p-value | pρ = | 1.429 04 × 10−45
|
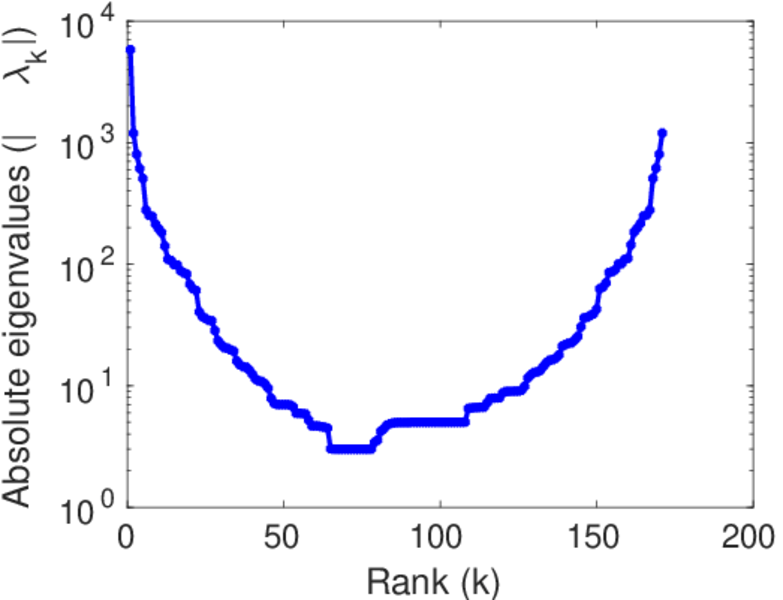
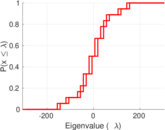
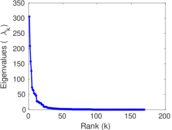
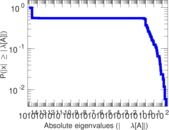
| Spectral norm | α = | 305.407
|
| Algebraic connectivity | a = | 0.139 217
|
| Spectral separation | |λ1[A] / λ2[A]| = | 1.463 20
|
| Controllability | C = | 5,615
|
| Relative controllability | Cr = | 0.967 937
|
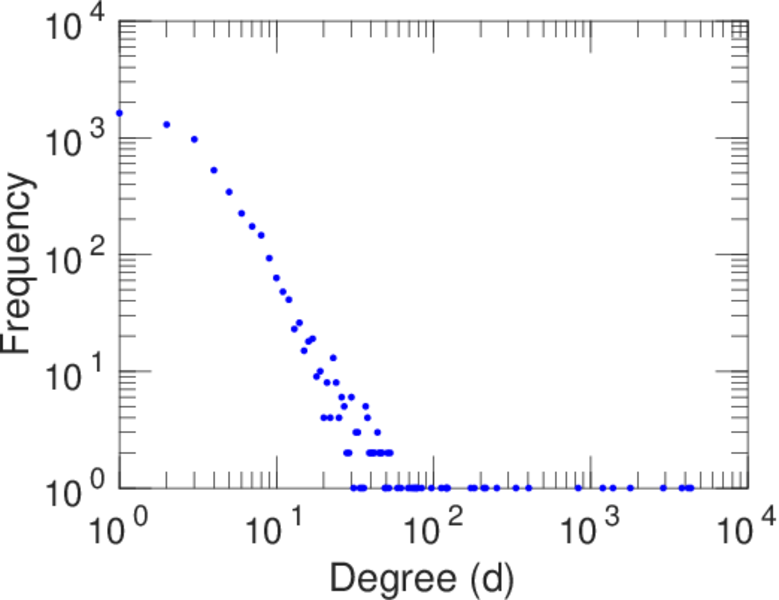
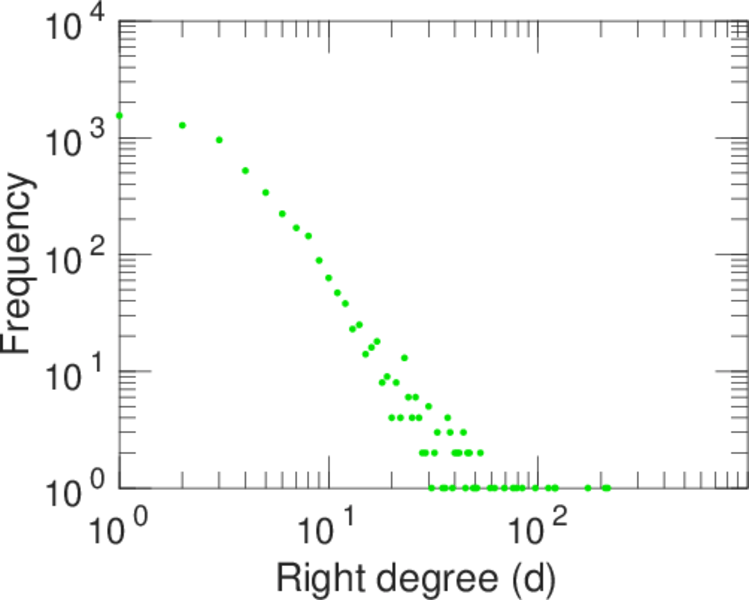
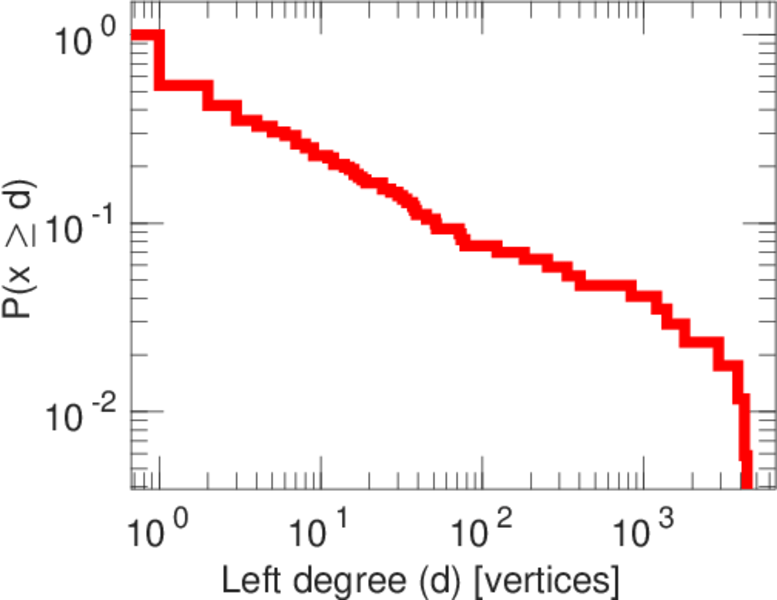
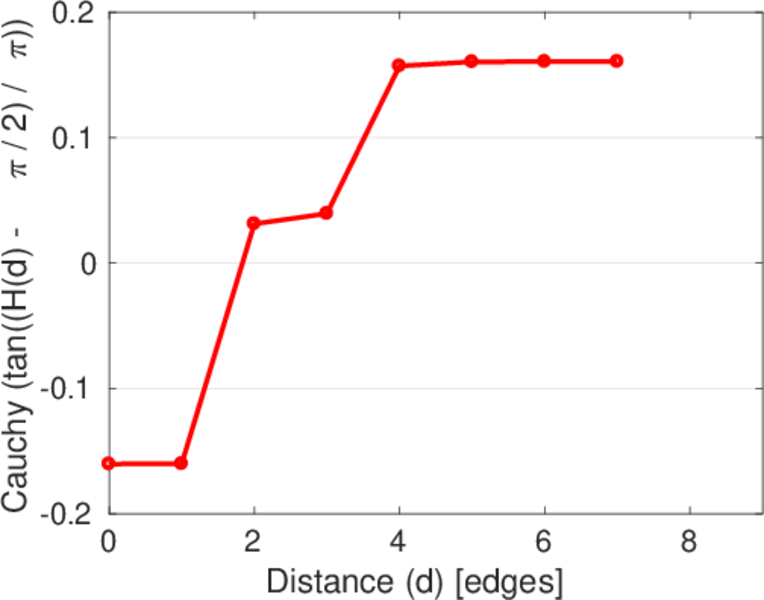
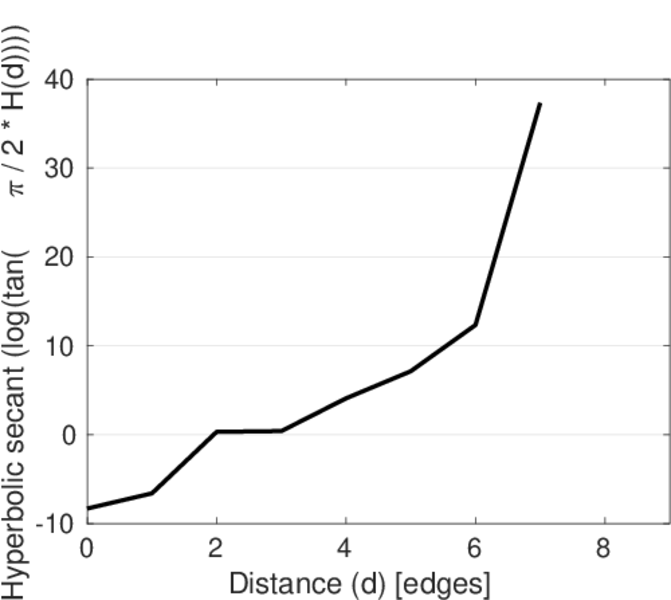
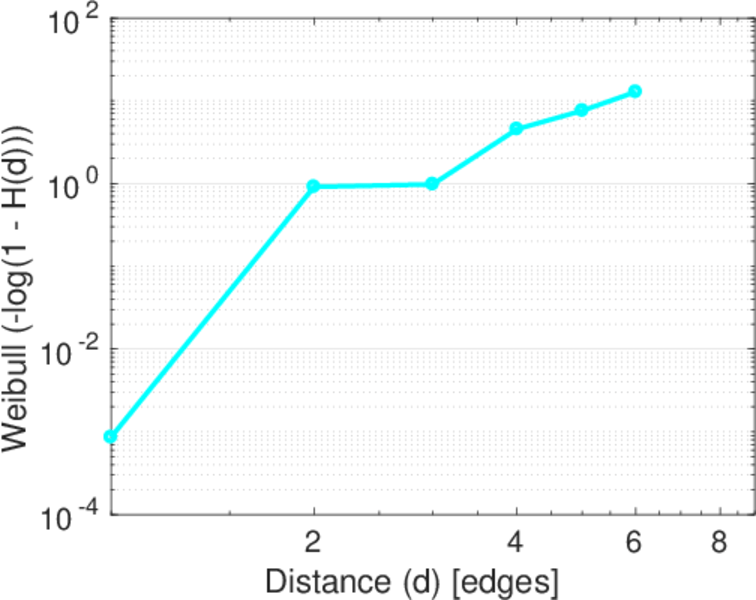
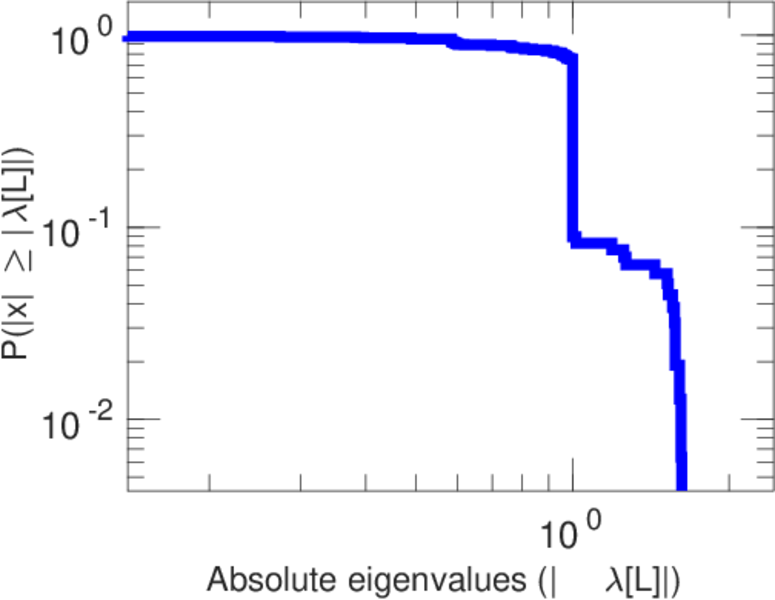
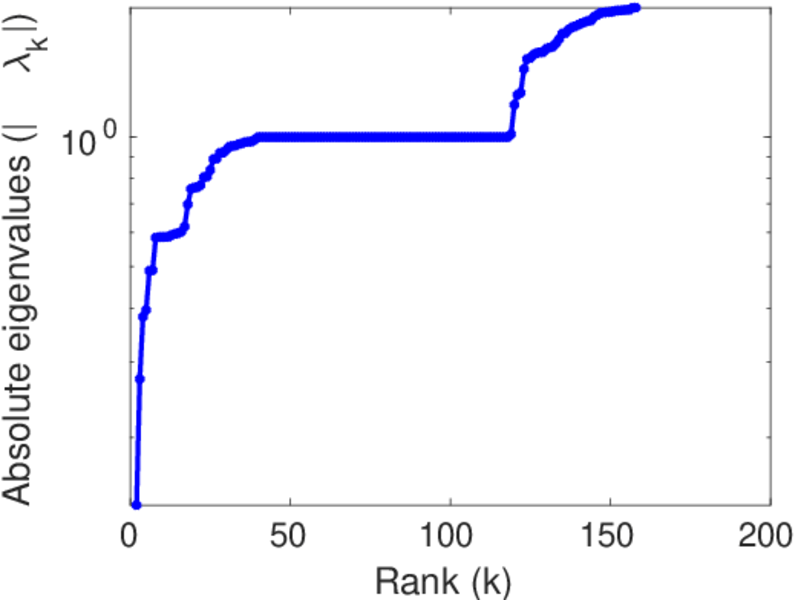
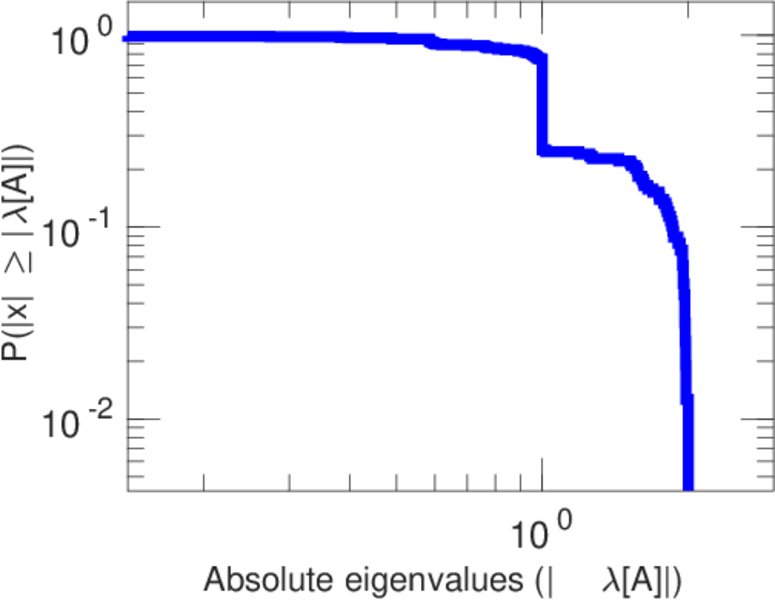
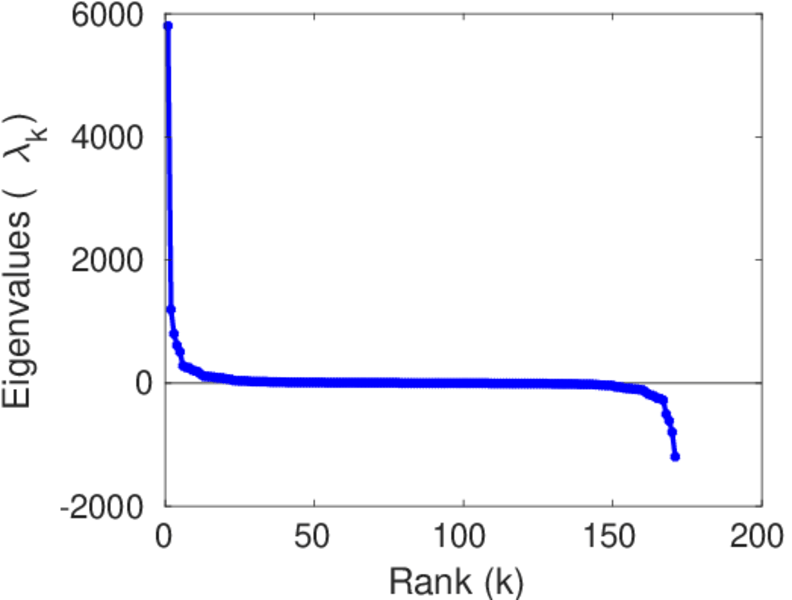
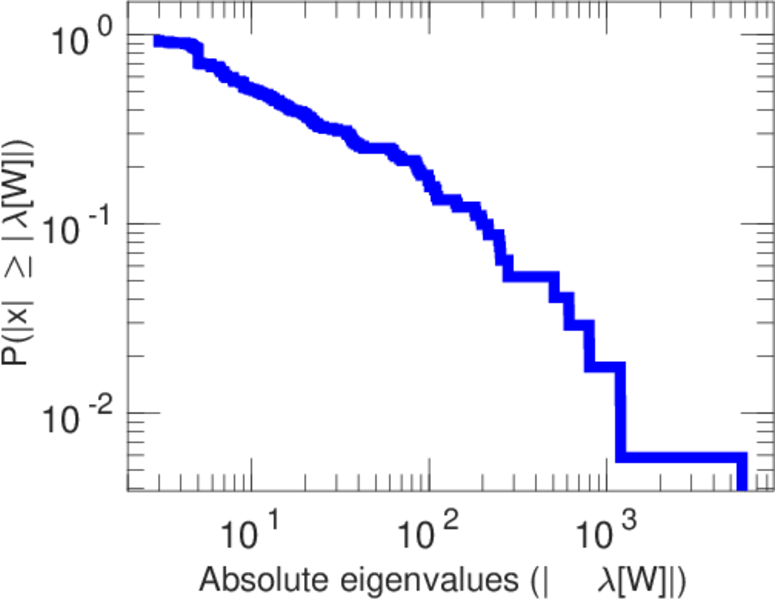
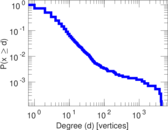
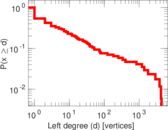
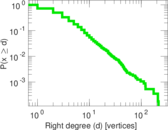
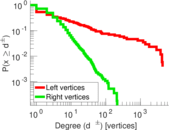
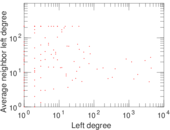
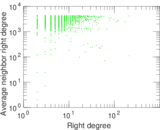
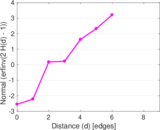
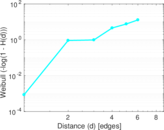
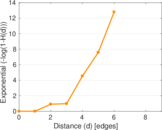
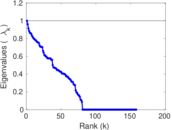
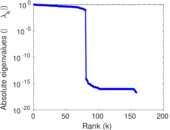
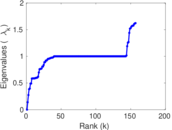
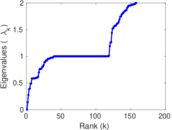
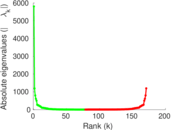
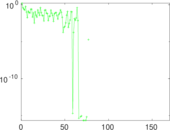
Plots
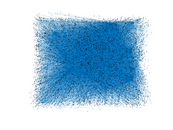


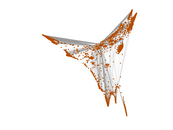
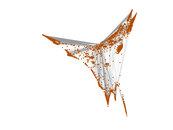


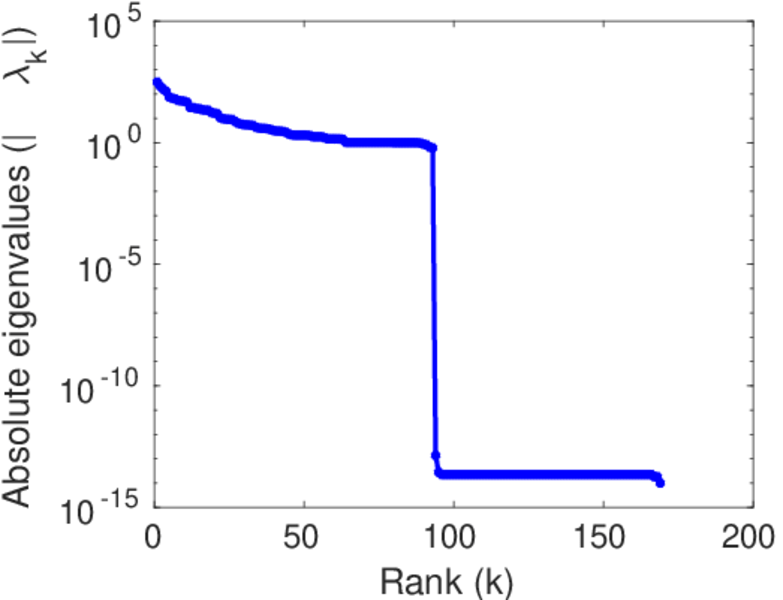
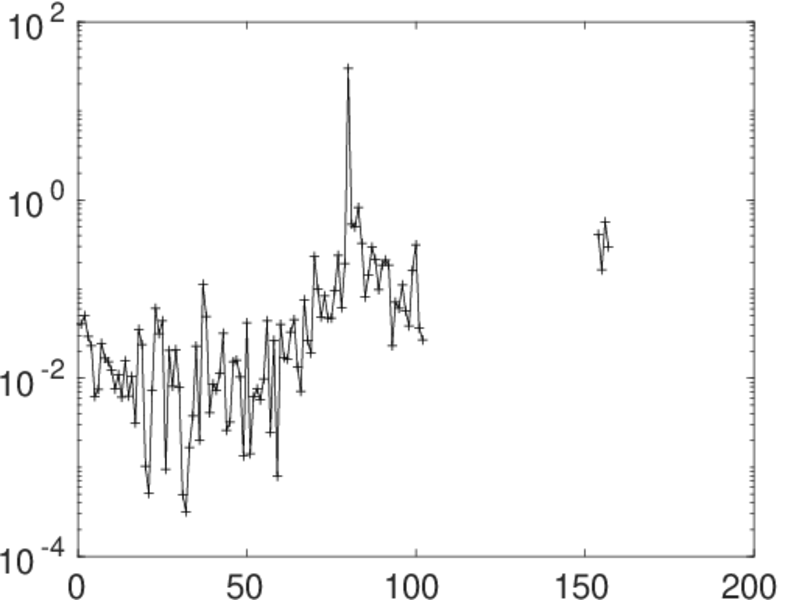
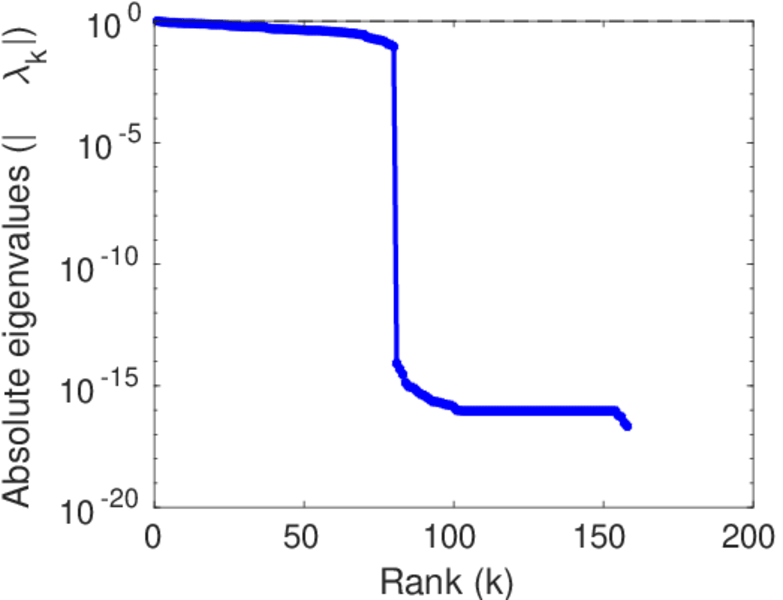
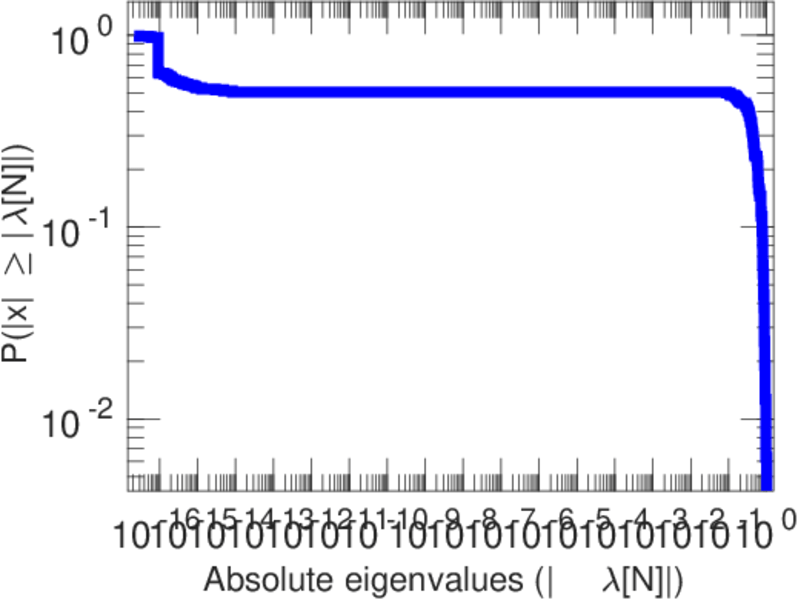
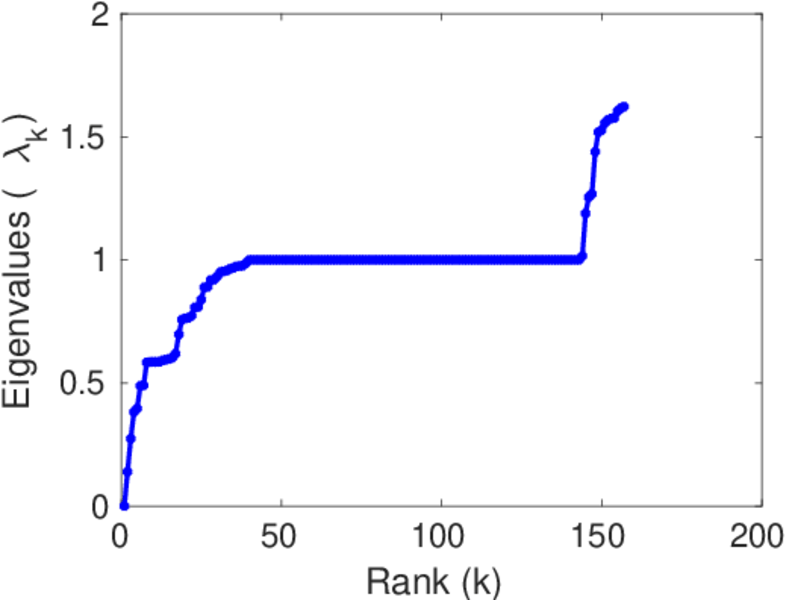
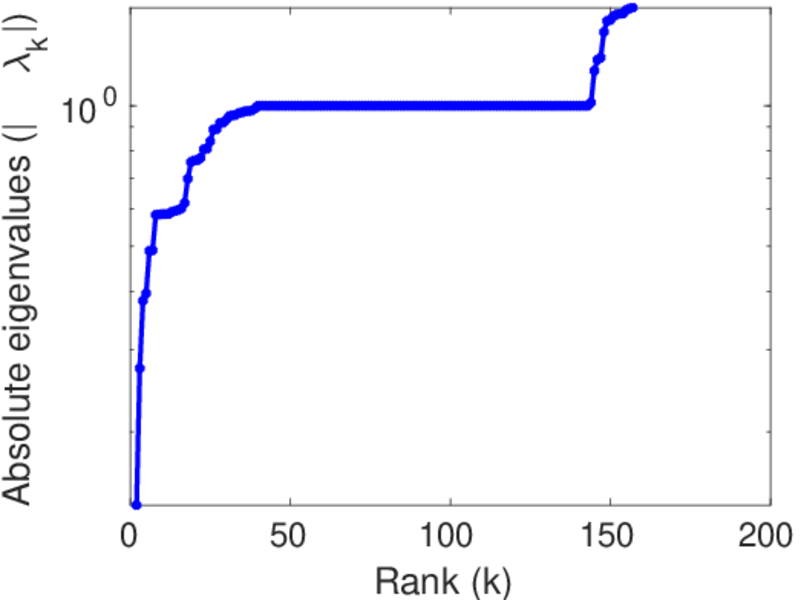
Matrix decompositions plots


Downloads
References
|
[1]
|
Jérôme Kunegis.
KONECT – The Koblenz Network Collection.
In Proc. Int. Conf. on World Wide Web Companion, pages
1343–1350, 2013.
[ http ]
|
|
[2]
|
Wikimedia Foundation.
Wikimedia downloads.
http://dumps.wikimedia.org/, January 2010.
|
 KONECT ‣ Networks ‣
Buy Me a Coffee
KONECT ‣ Networks ‣
Buy Me a Coffee