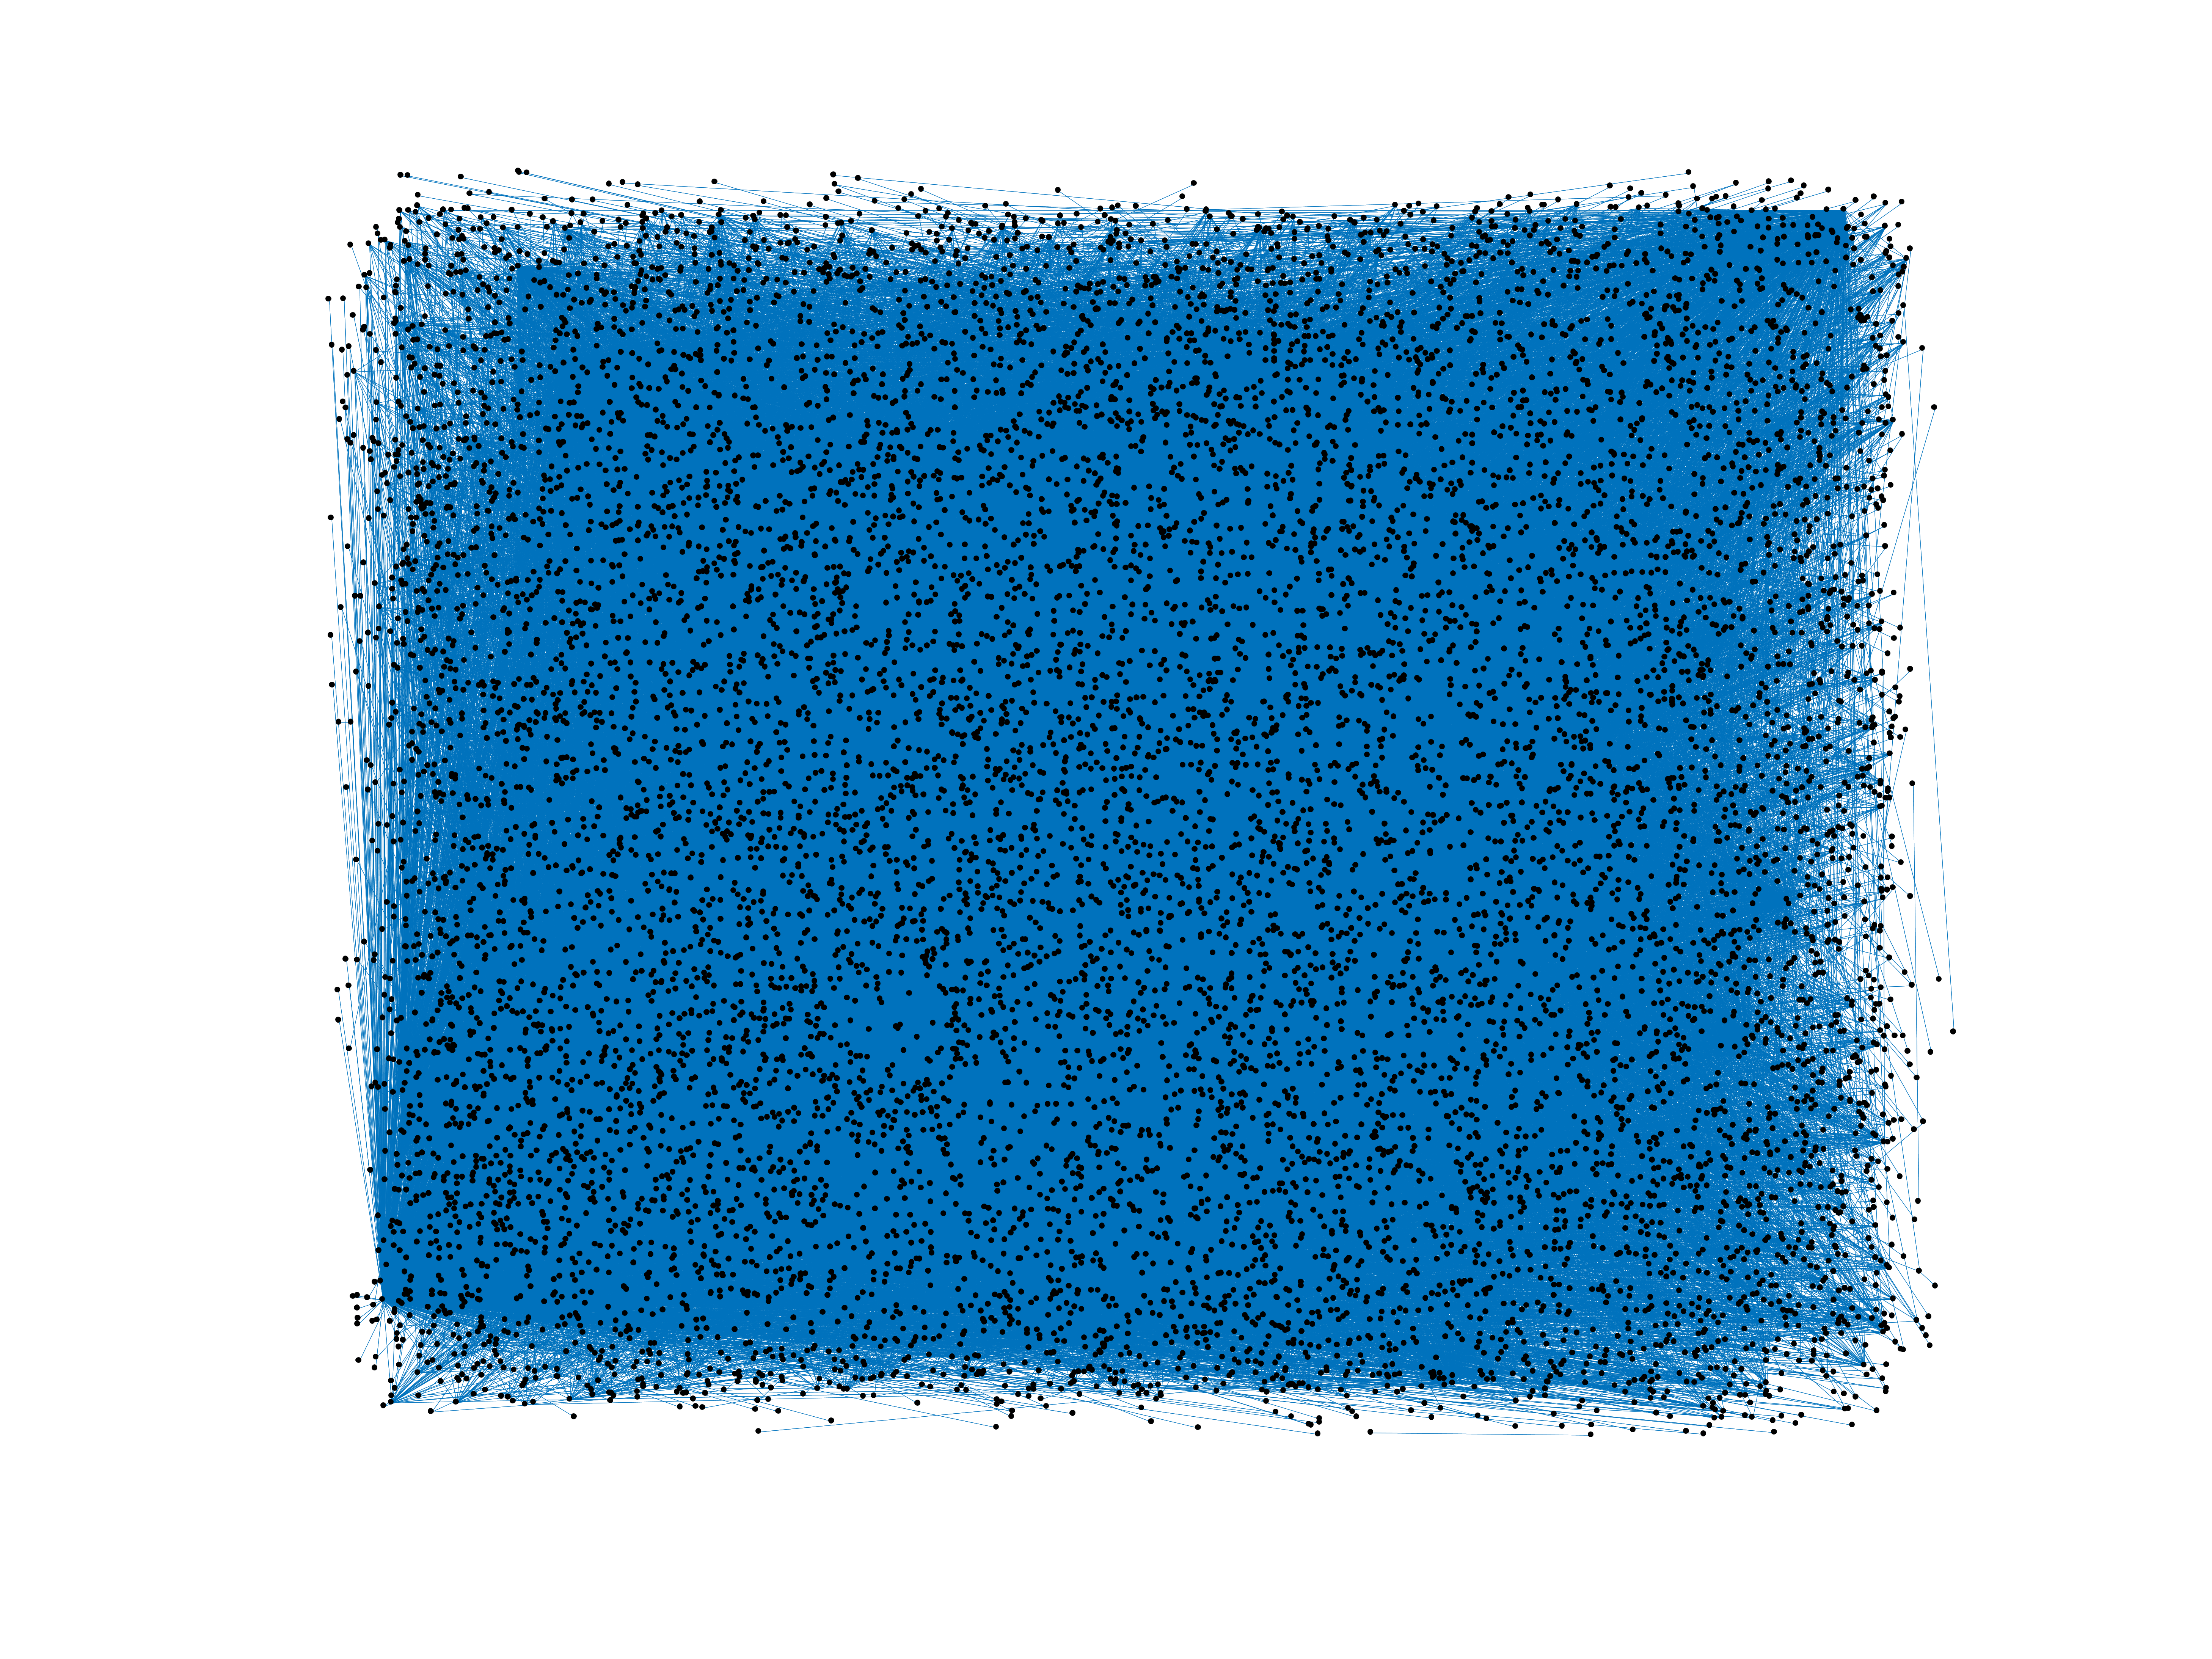
Wikipedia edits (dv)
This is the bipartite edit network of the Divehi Wikipedia. It contains users
and pages from the Divehi Wikipedia, connected by edit events. Each edge
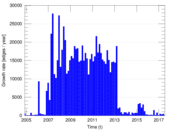
represents an edit. The dataset includes the timestamp of each edit.
Metadata
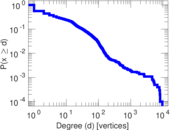
Statistics
| Size | n = | 11,438
|
| Left size | n1 = | 1,080
|
| Right size | n2 = | 10,358
|
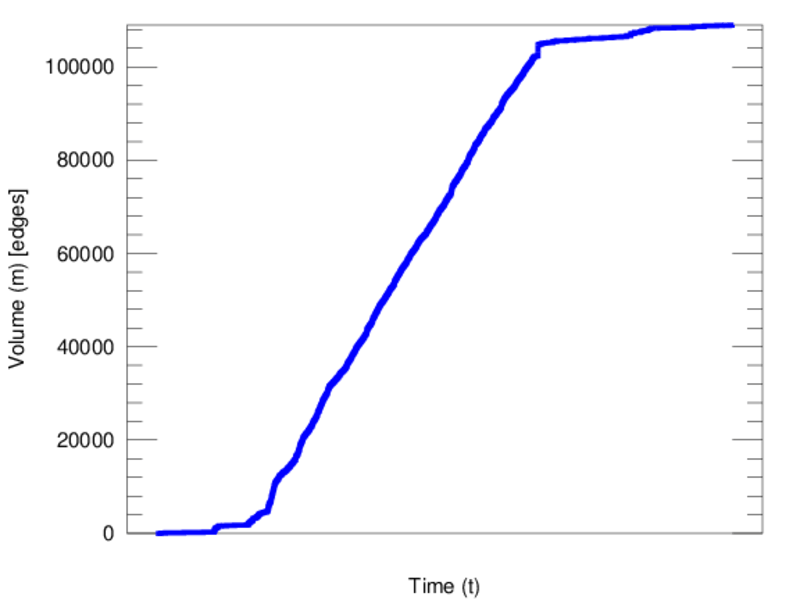
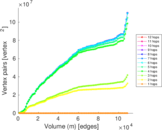
| Volume | m = | 108,959
|
| Unique edge count | m̿ = | 44,997
|
| Wedge count | s = | 32,102,242
|
| Claw count | z = | 24,035,245,831
|
| Cross count | x = | 16,208,444,991,434
|
| Square count | q = | 72,761,639
|
| 4-Tour count | T4 = | 710,603,170
|
| Maximum degree | dmax = | 9,608
|
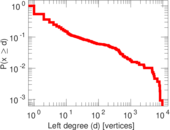
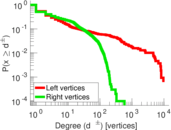
| Maximum left degree | d1max = | 9,608
|
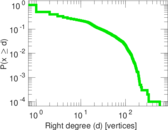
| Maximum right degree | d2max = | 583
|
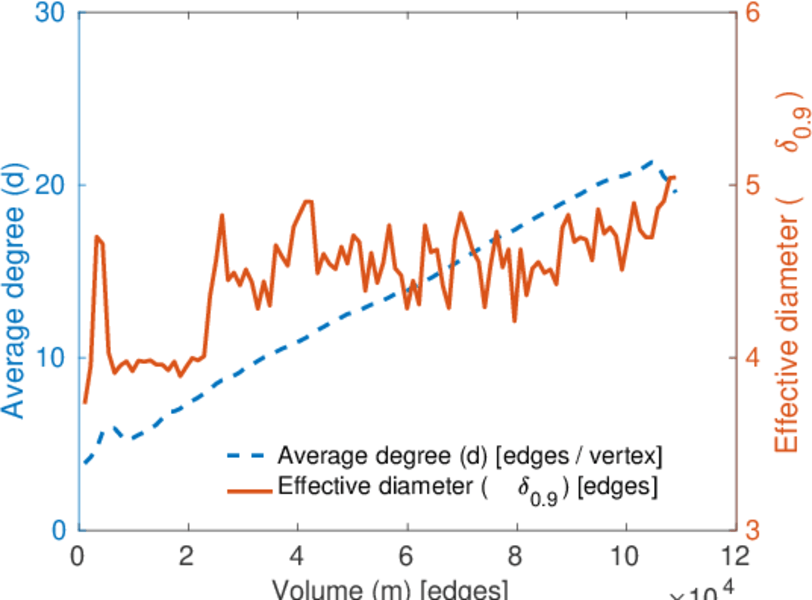
| Average degree | d = | 19.052 1
|
| Average left degree | d1 = | 100.888
|
| Average right degree | d2 = | 10.519 3
|
| Fill | p = | 0.004 022 39
|
| Average edge multiplicity | m̃ = | 2.421 47
|
| Size of LCC | N = | 10,496
|
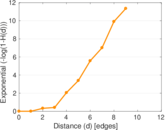
| Diameter | δ = | 12
|
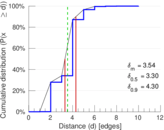
| 50-Percentile effective diameter | δ0.5 = | 3.299 01
|
| 90-Percentile effective diameter | δ0.9 = | 4.296 86
|
| Median distance | δM = | 4
|
| Mean distance | δm = | 3.544 62
|
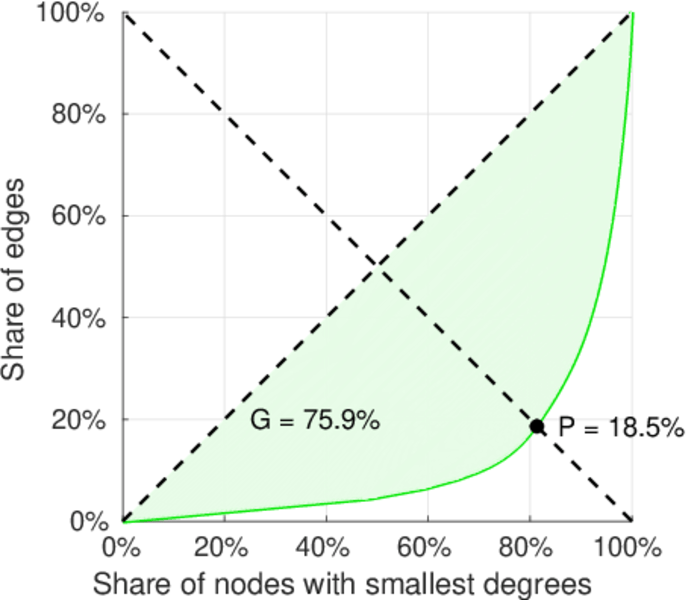
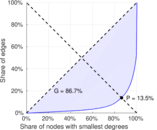
| Gini coefficient | G = | 0.863 400
|
| Balanced inequality ratio | P = | 0.144 463
|
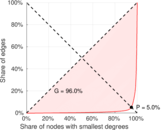
| Left balanced inequality ratio | P1 = | 0.049 835 3
|
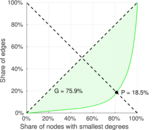
| Right balanced inequality ratio | P2 = | 0.184 868
|
| Relative edge distribution entropy | Her = | 0.744 552
|
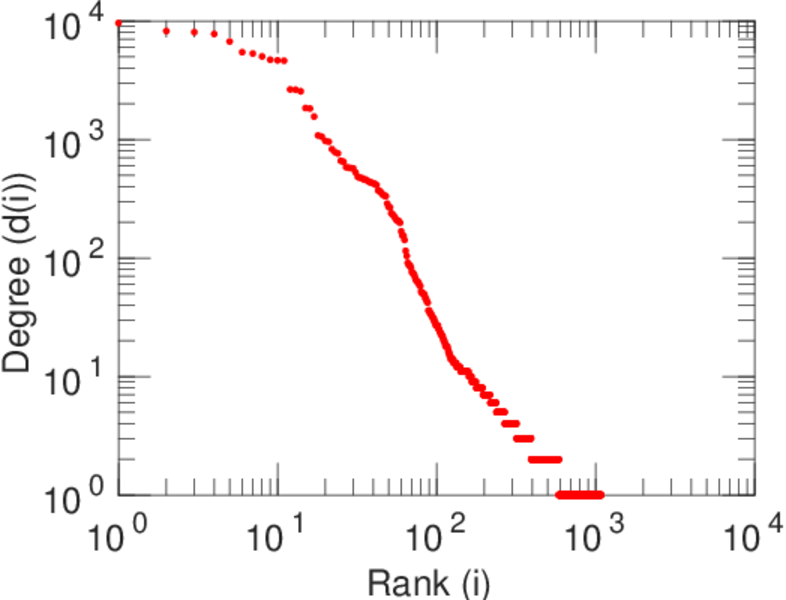
| Power law exponent | γ = | 2.356 69
|
| Tail power law exponent | γt = | 1.841 00
|
| Tail power law exponent with p | γ3 = | 1.841 00
|
| p-value | p = | 0.000 00
|
| Left tail power law exponent with p | γ3,1 = | 1.761 00
|
| Left p-value | p1 = | 0.000 00
|
| Right tail power law exponent with p | γ3,2 = | 3.141 00
|
| Right p-value | p2 = | 0.000 00
|
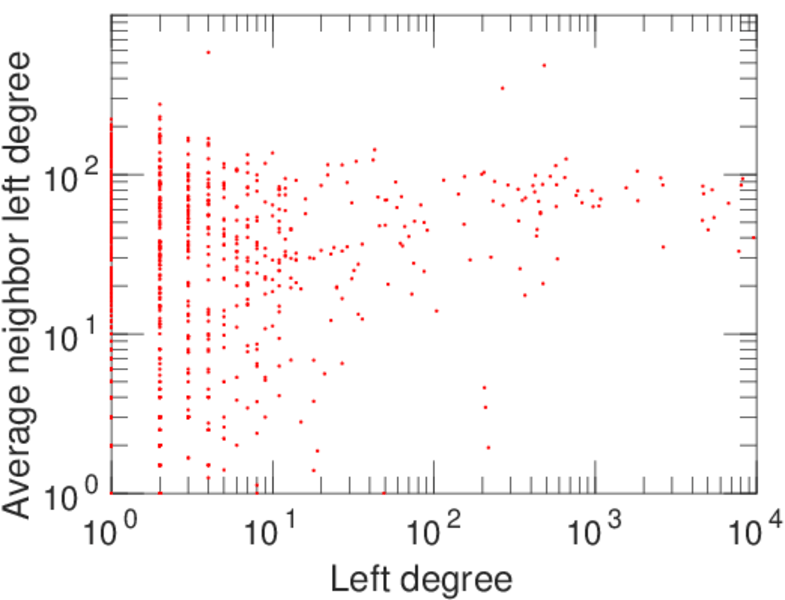
| Degree assortativity | ρ = | −0.397 974
|
| Degree assortativity p-value | pρ = | 0.000 00
|
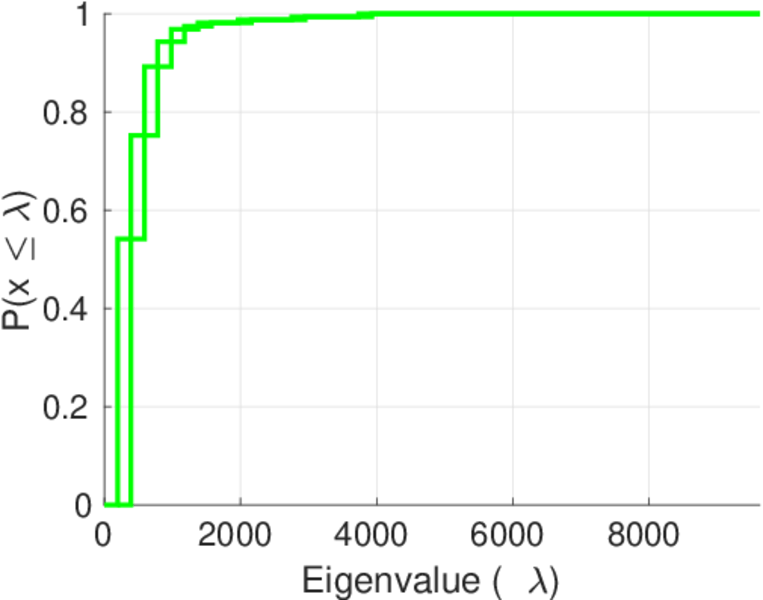
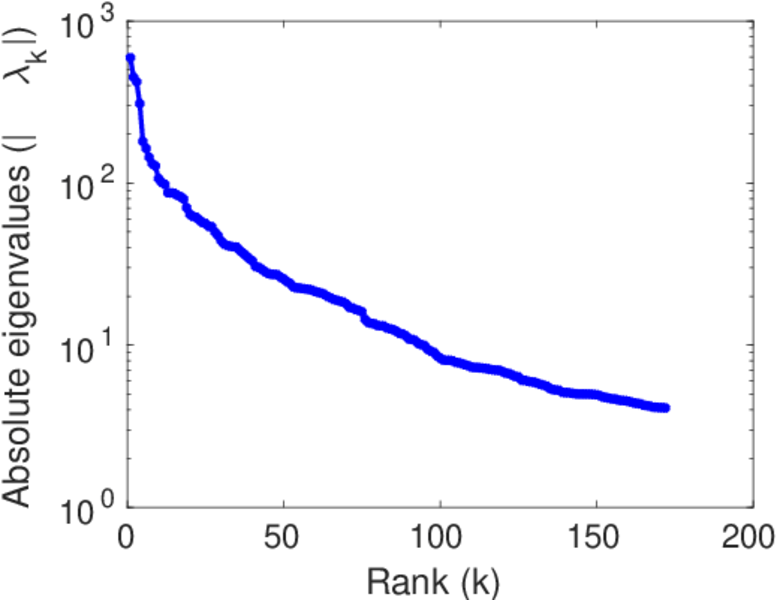
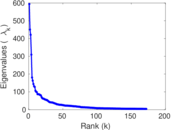
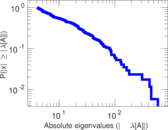
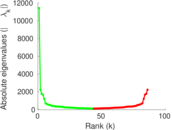
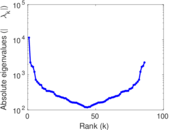
| Spectral norm | α = | 593.650
|
| Algebraic connectivity | a = | 0.057 241 9
|
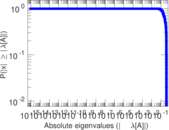
| Spectral separation | |λ1[A] / λ2[A]| = | 1.318 14
|
| Controllability | C = | 9,115
|
| Relative controllability | Cr = | 0.817 856
|
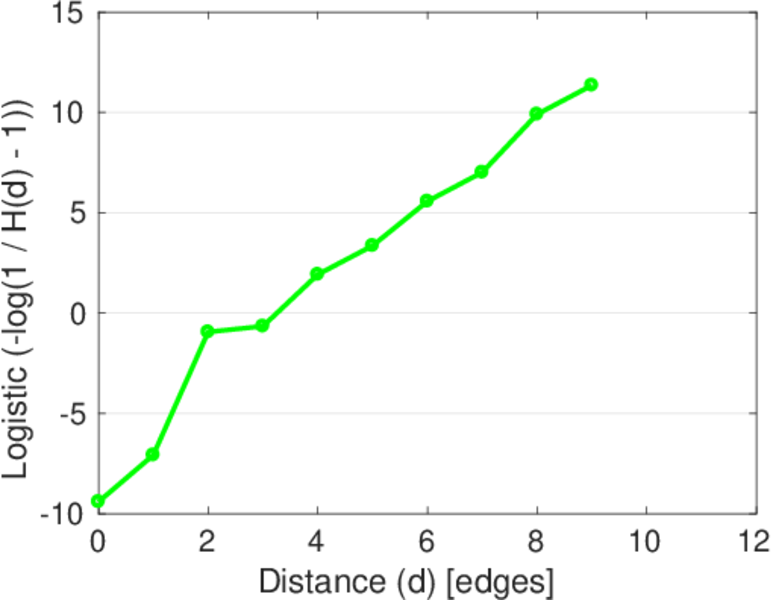
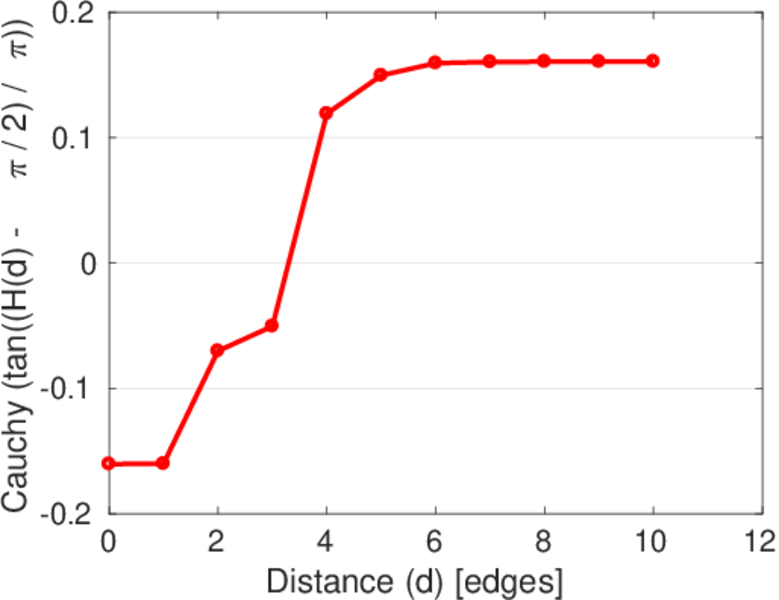
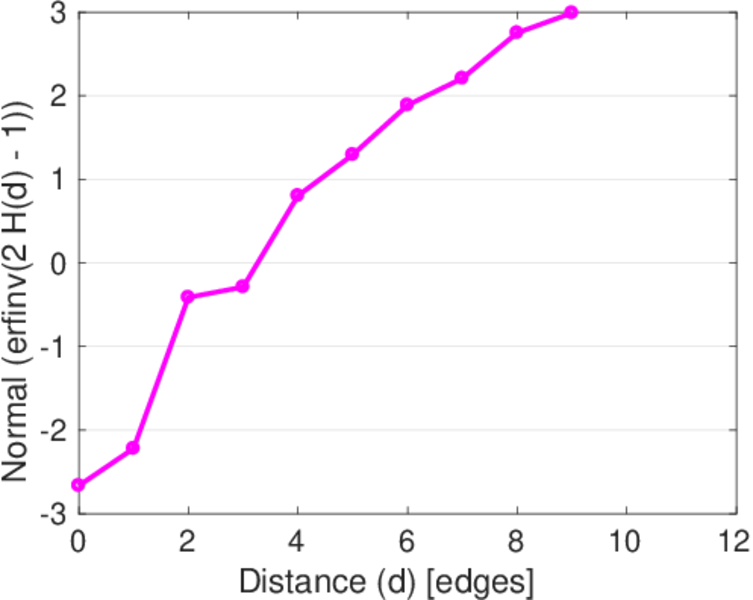
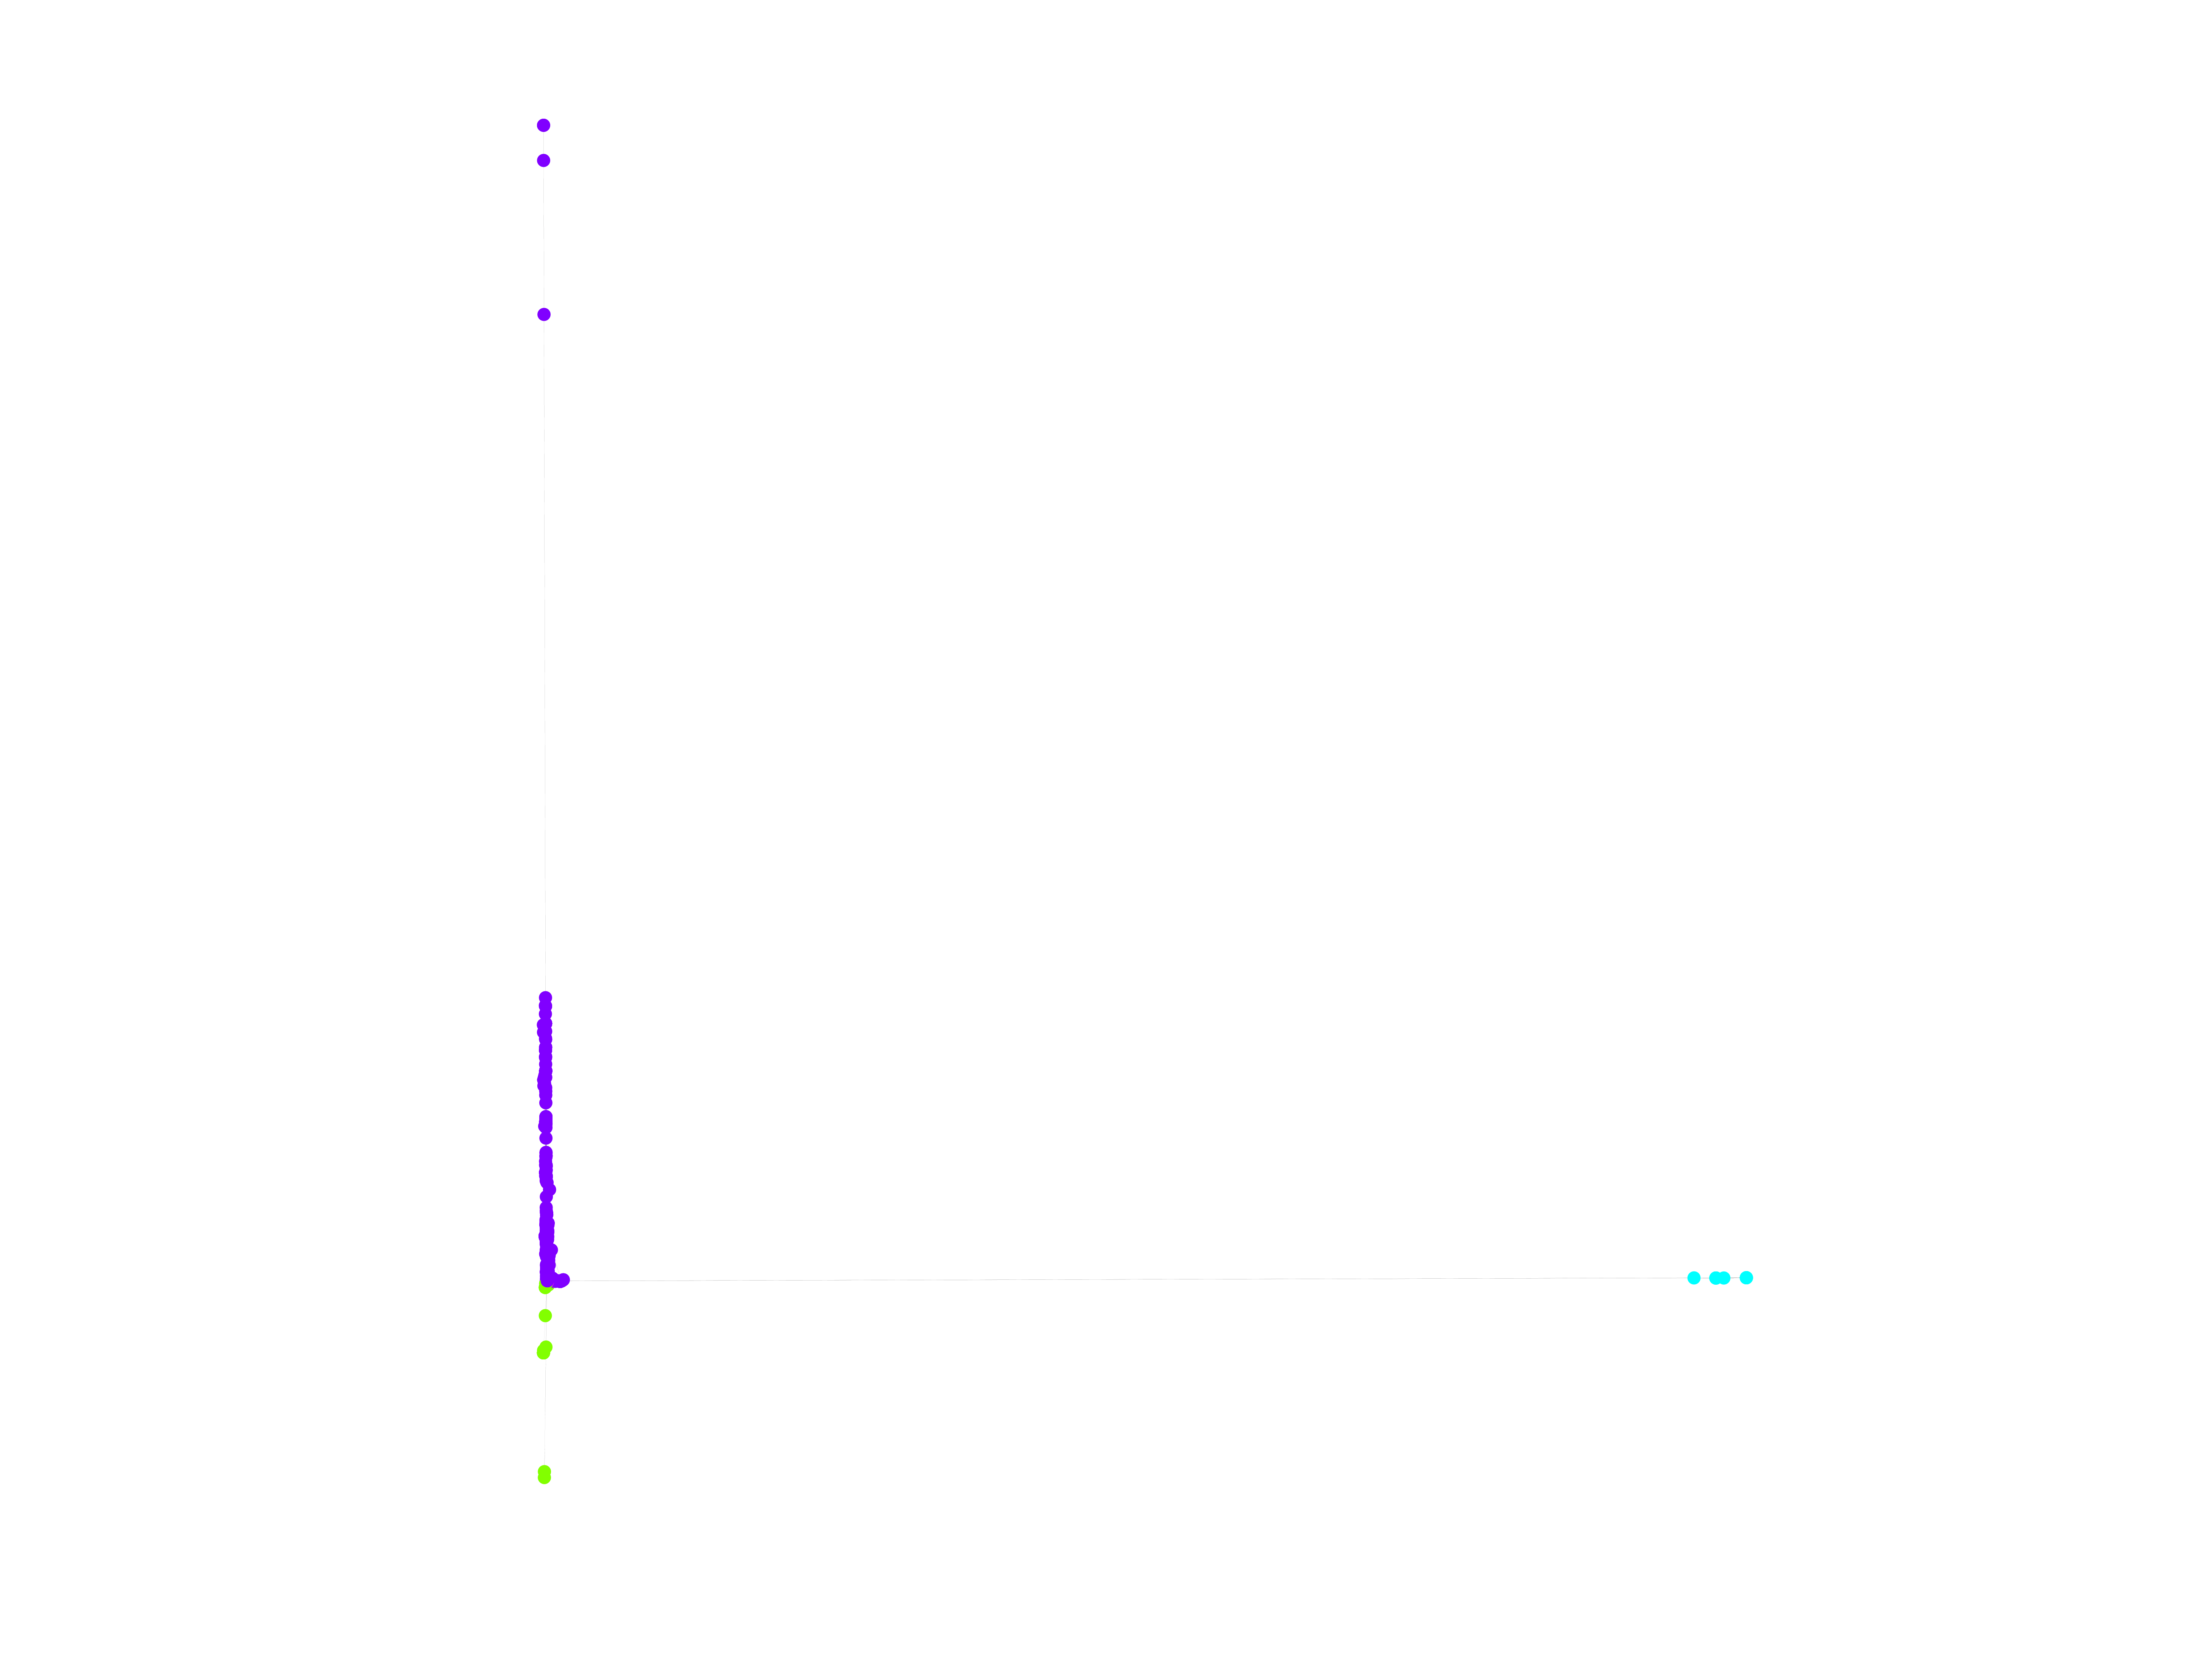
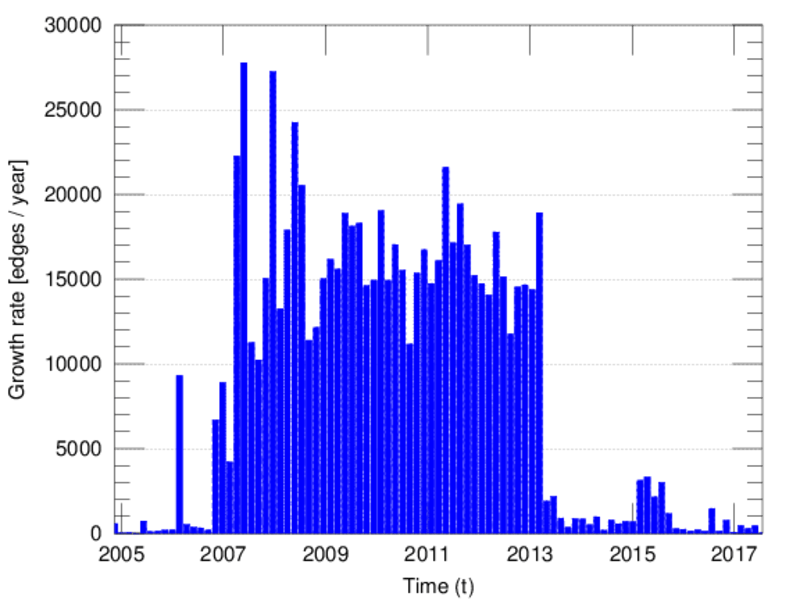
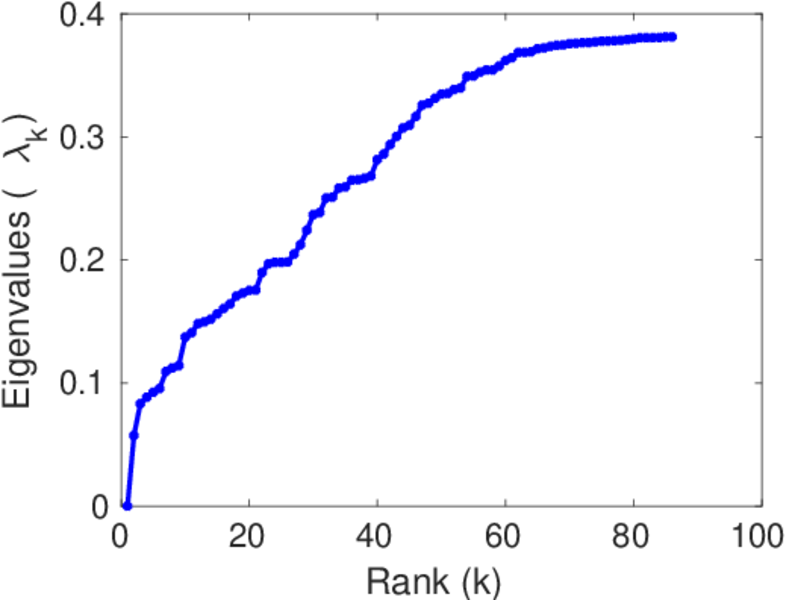
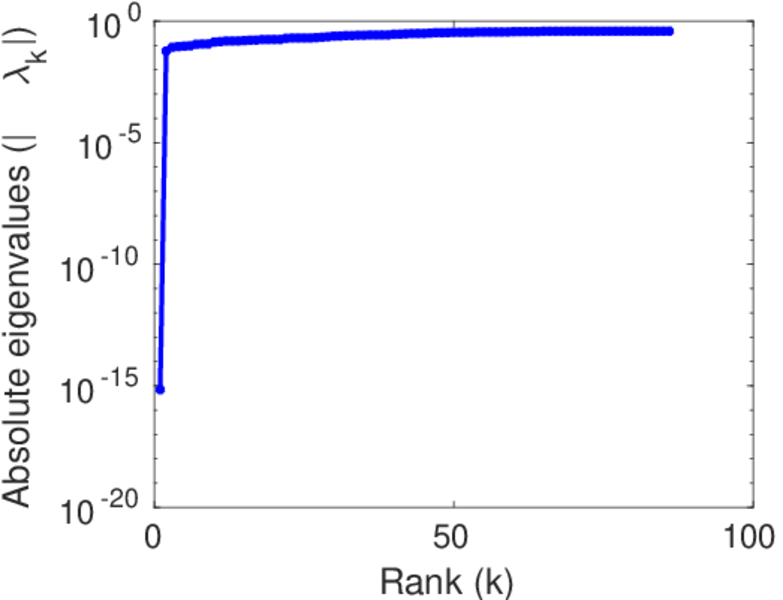
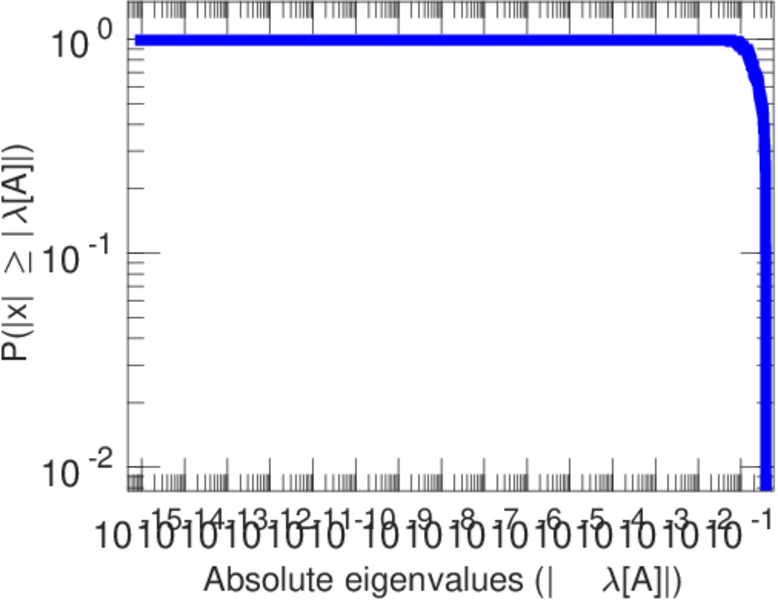
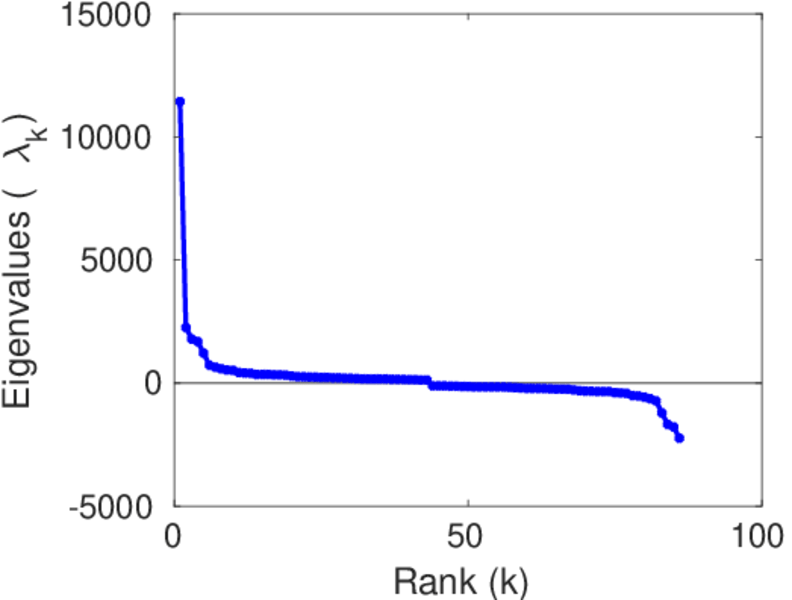
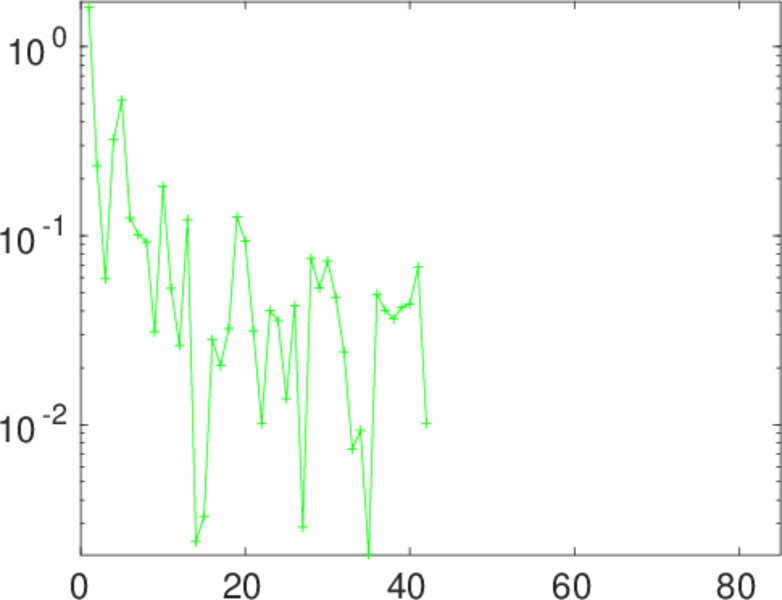
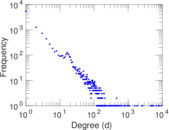
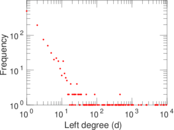
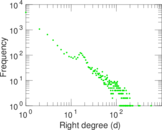
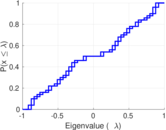
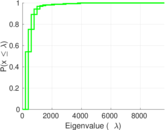
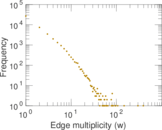
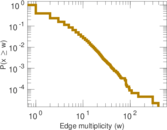
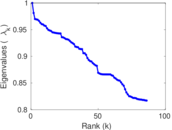
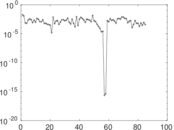
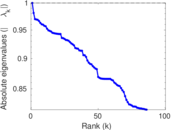
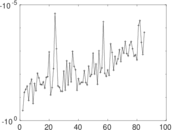
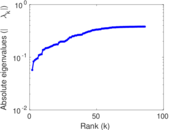
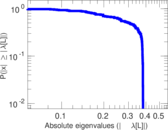
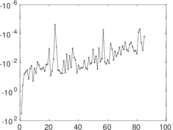
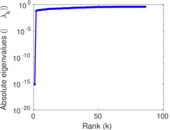
Plots

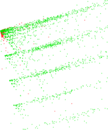
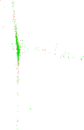


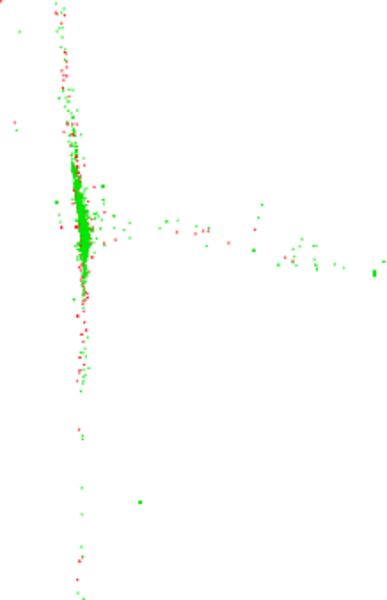
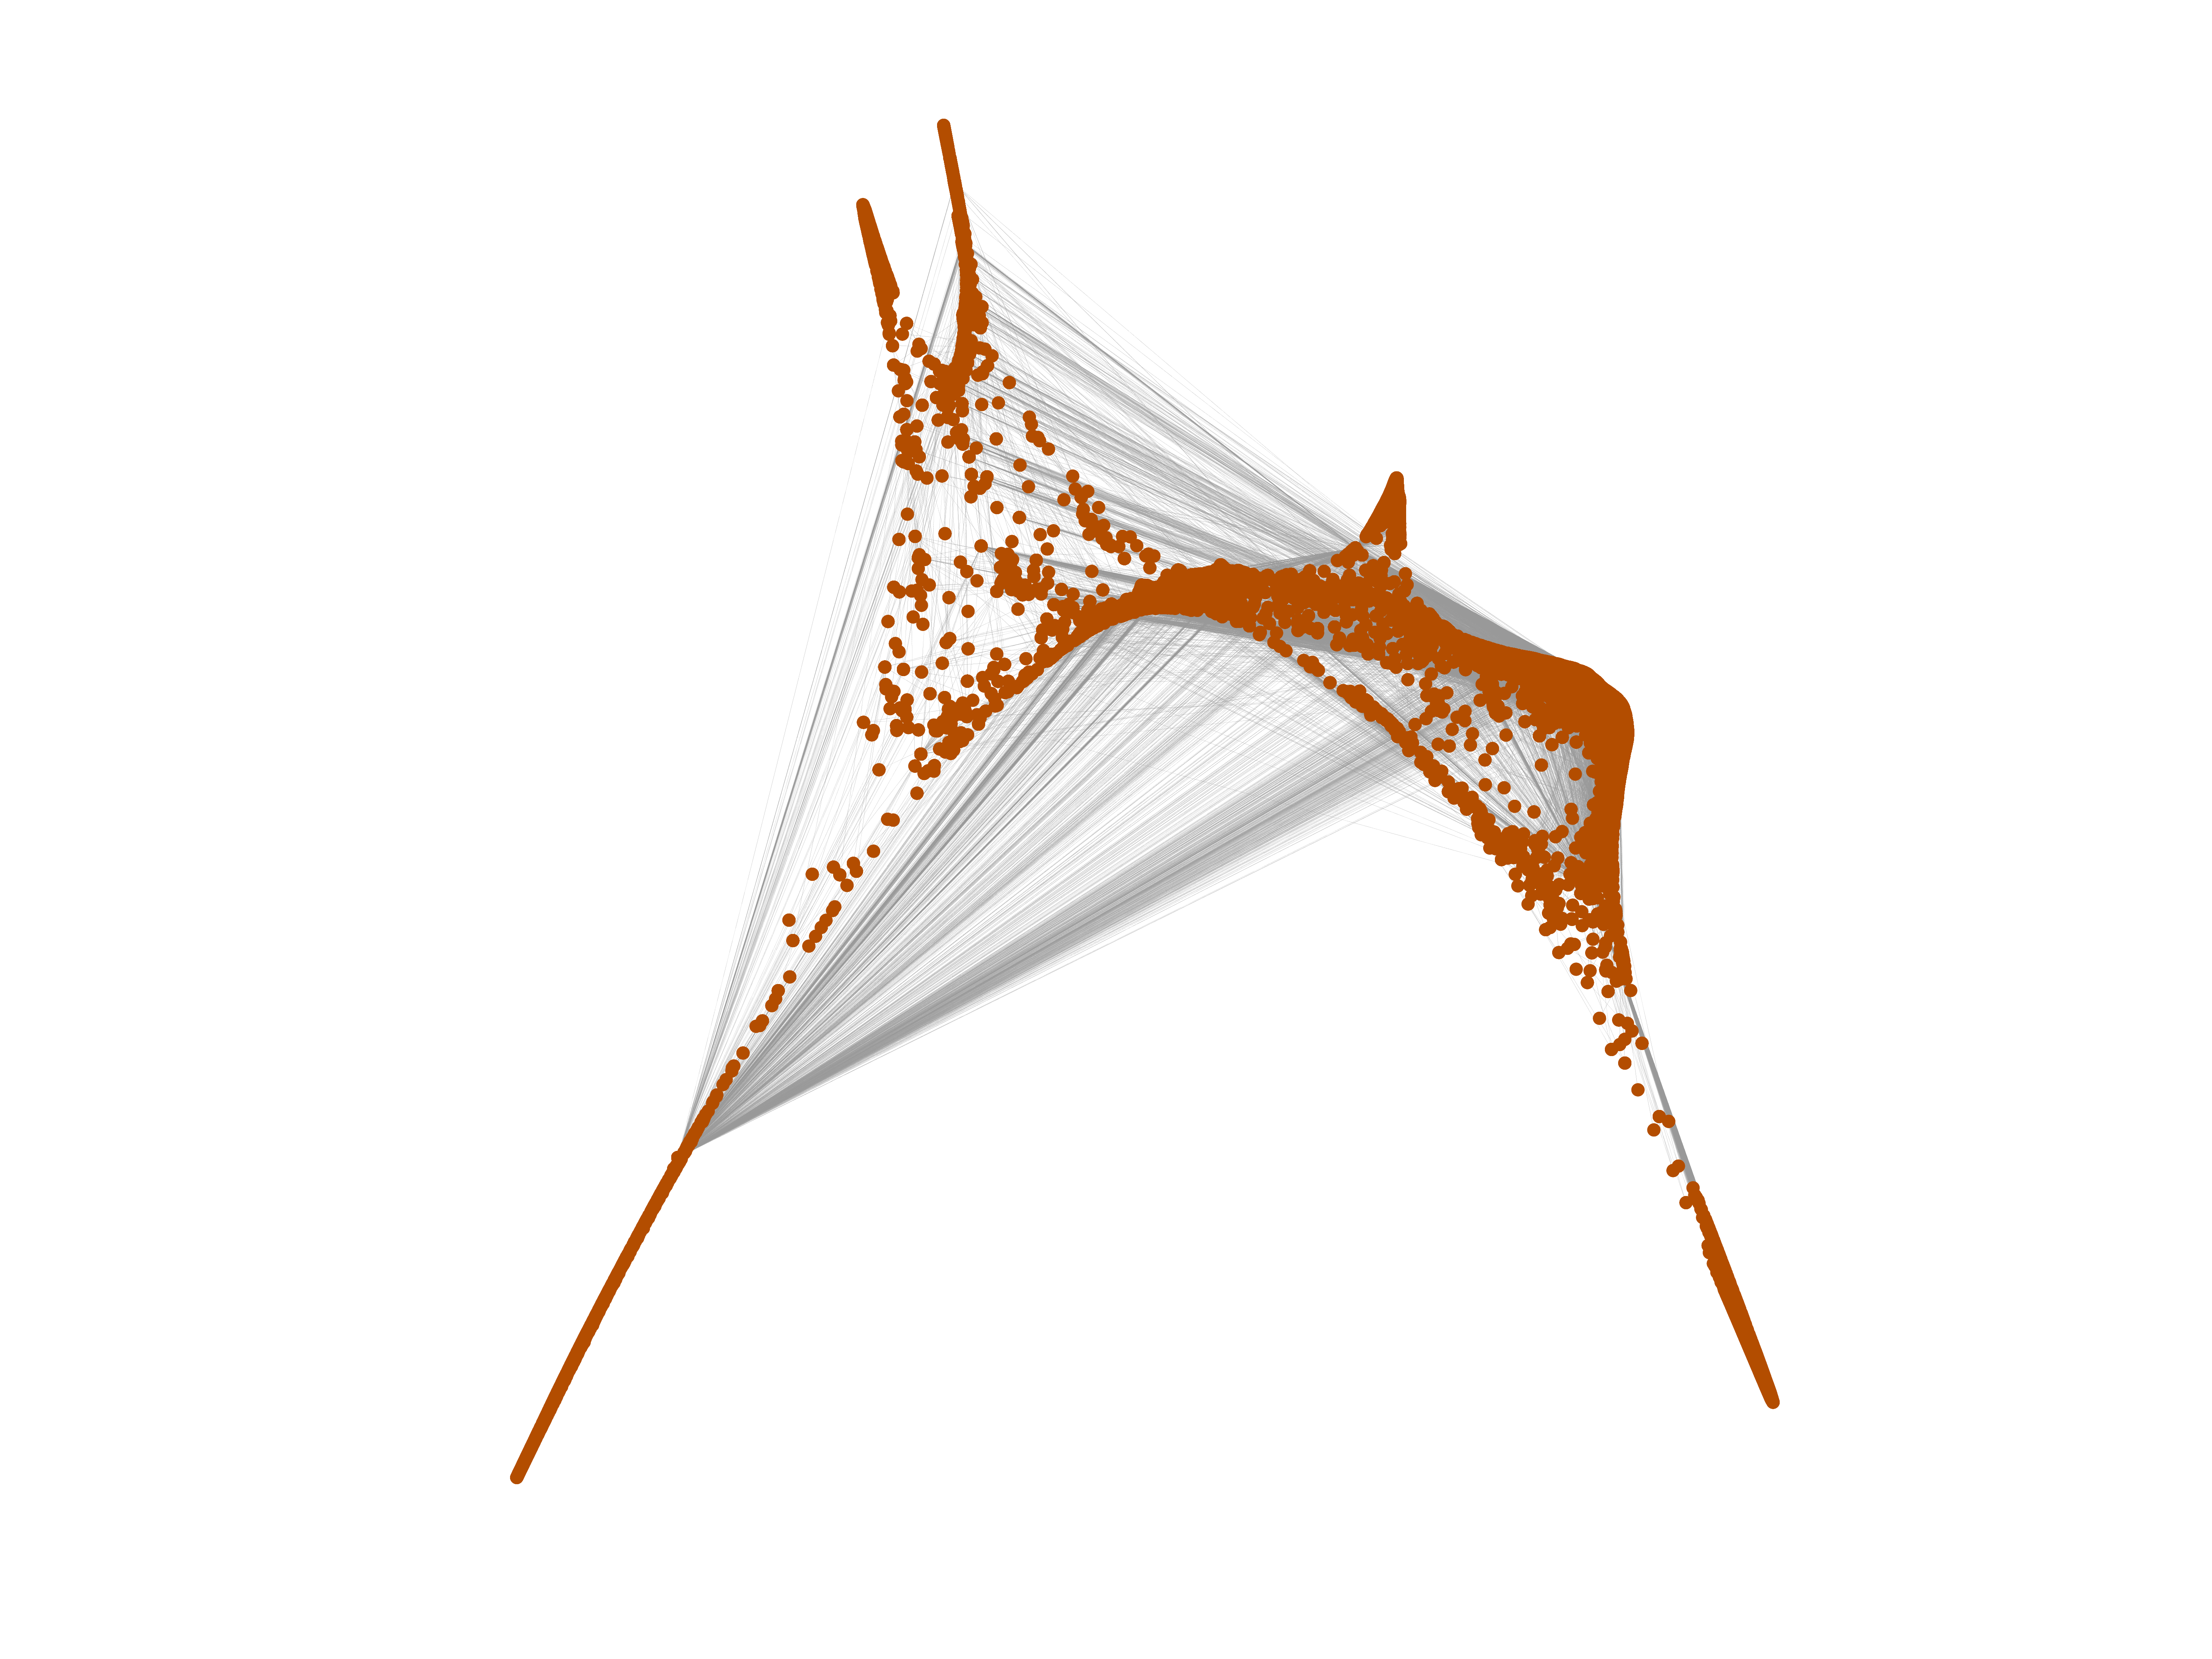
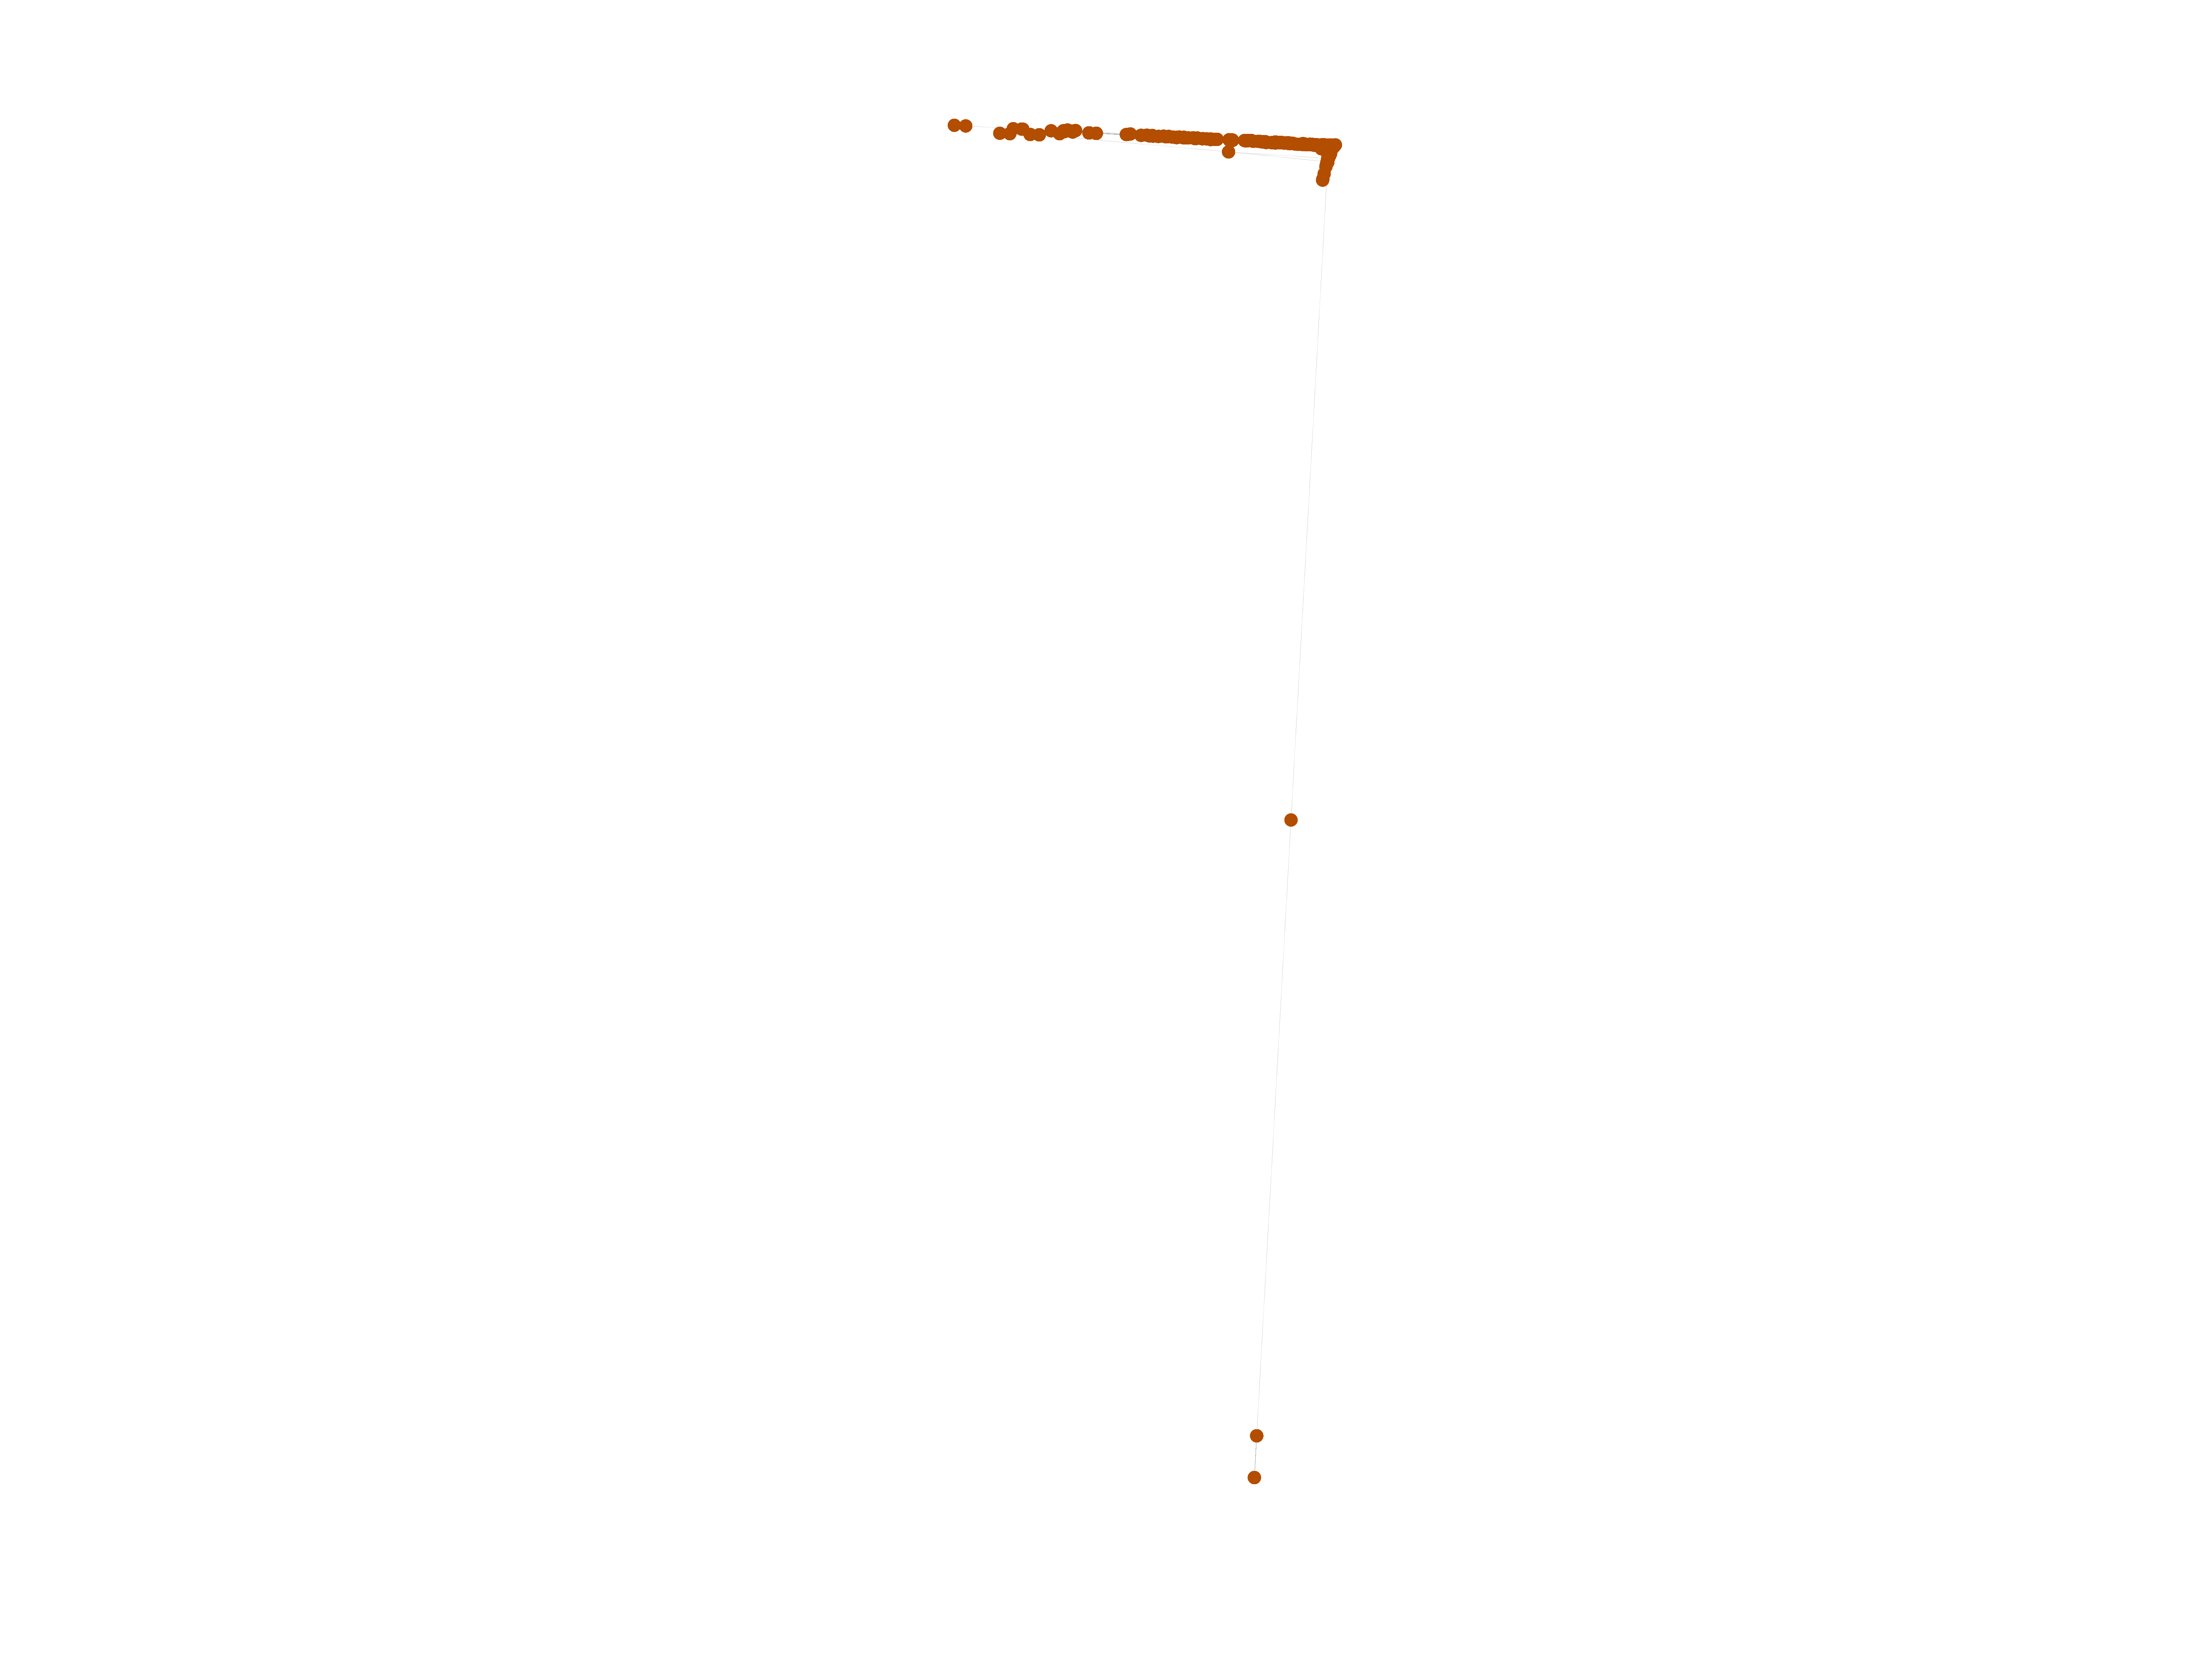
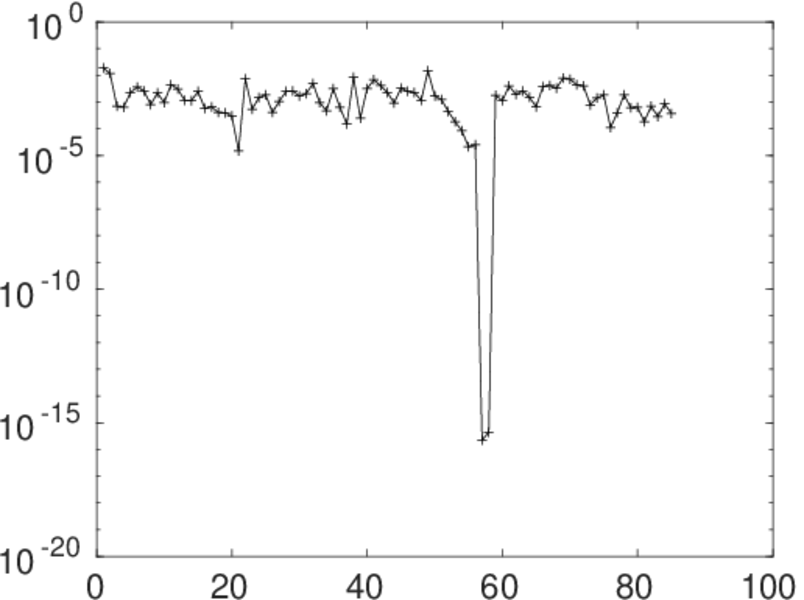
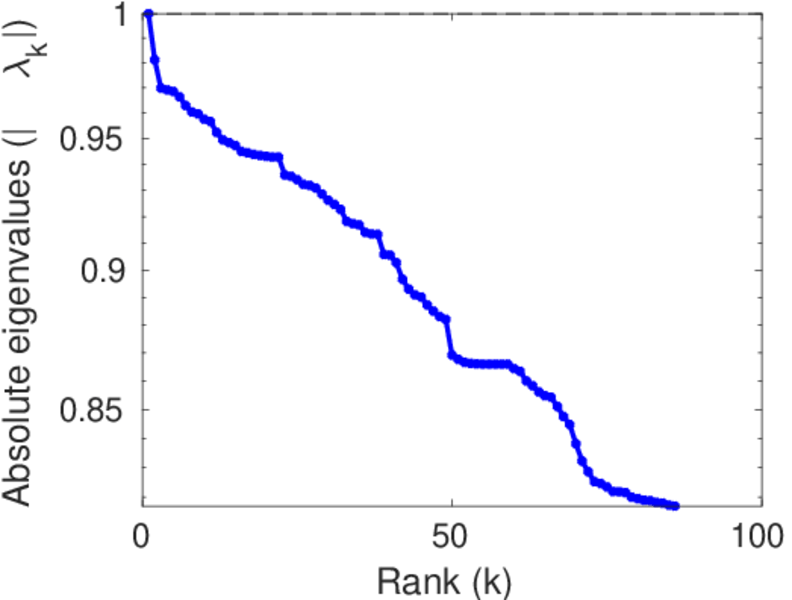
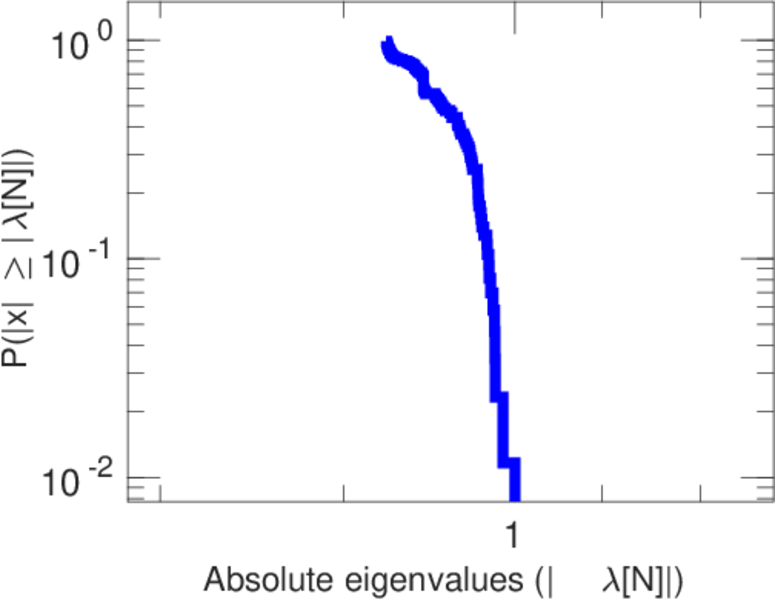
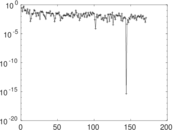
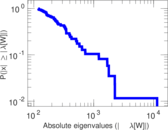
Matrix decompositions plots


Downloads
References
|
[1]
|
Jérôme Kunegis.
KONECT – The Koblenz Network Collection.
In Proc. Int. Conf. on World Wide Web Companion, pages
1343–1350, 2013.
[ http ]
|
|
[2]
|
Wikimedia Foundation.
Wikimedia downloads.
http://dumps.wikimedia.org/, January 2010.
|
 KONECT ‣ Networks ‣
Buy Me a Coffee
KONECT ‣ Networks ‣
Buy Me a Coffee