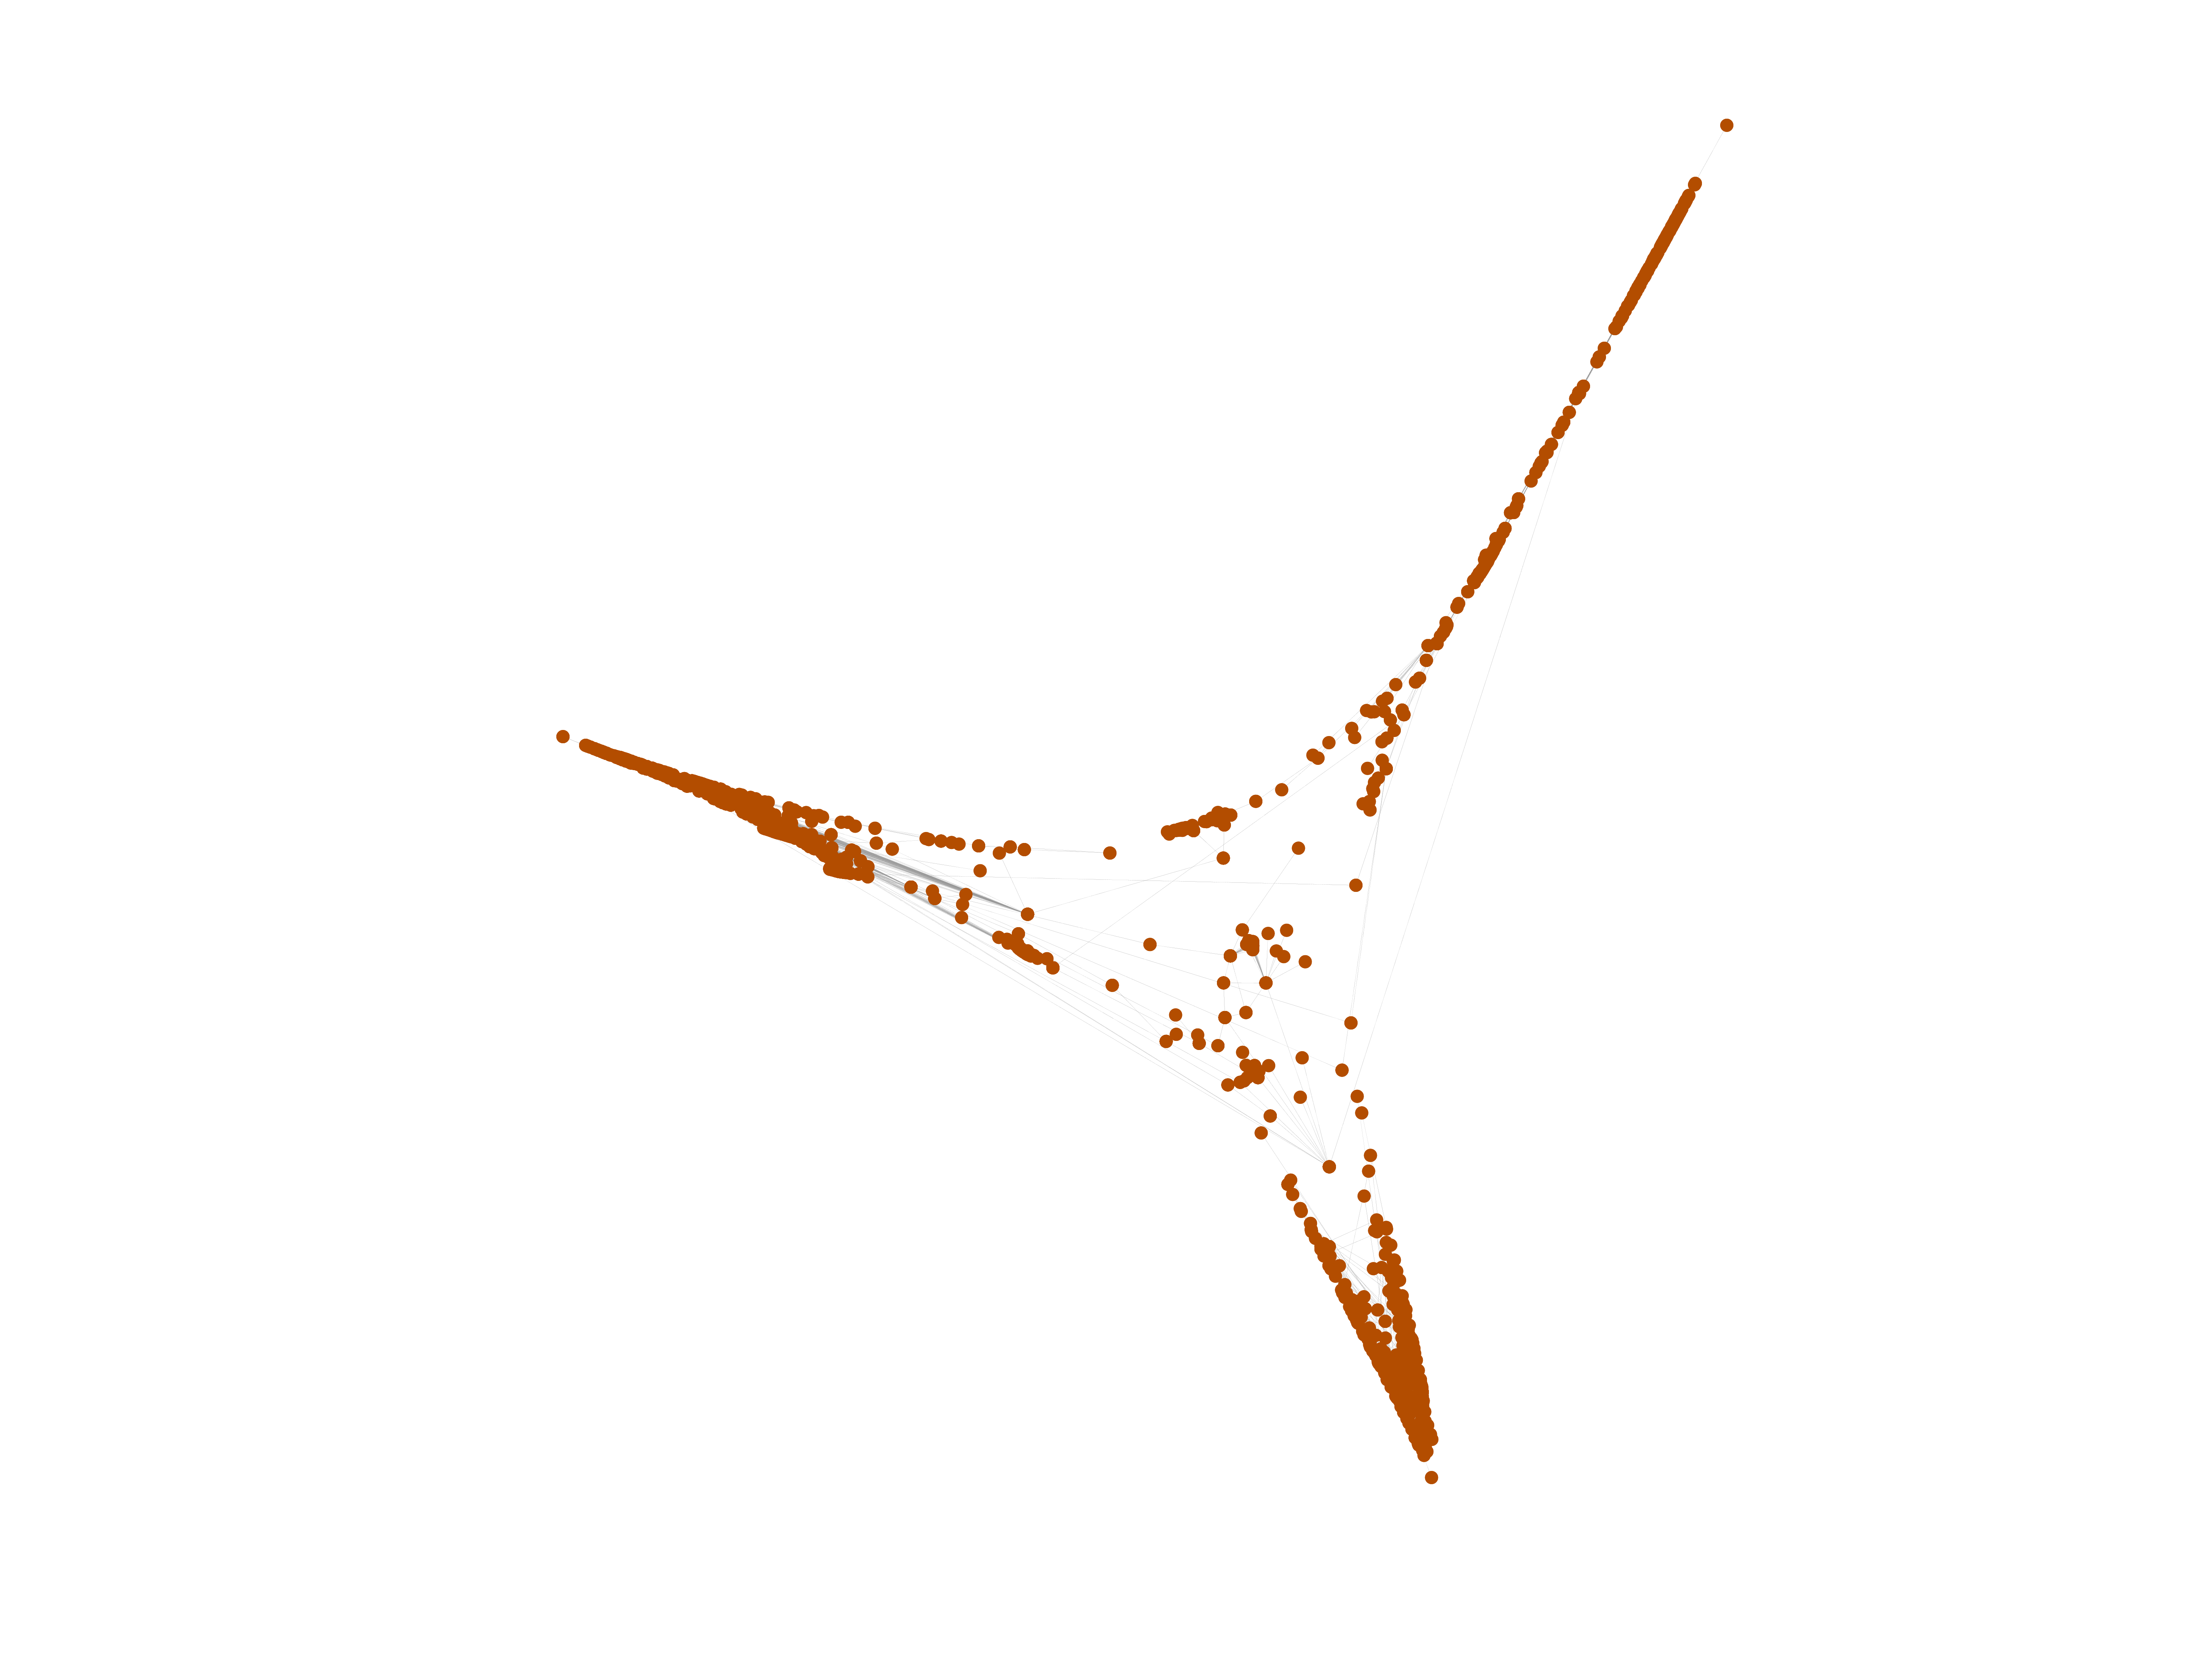
Wiktionary edits (dv)
This is the bipartite edit network of the Divehi Wiktionary. It contains users
and pages from the Divehi Wiktionary, connected by edit events. Each edge
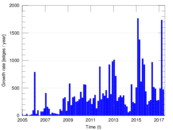
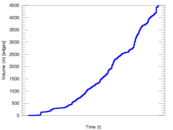
represents an edit. The dataset includes the timestamp of each edit.
Metadata
Statistics
| Size | n = | 1,361
|
| Left size | n1 = | 197
|
| Right size | n2 = | 1,164
|
| Volume | m = | 4,497
|
| Unique edge count | m̿ = | 2,131
|
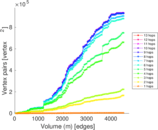
| Wedge count | s = | 121,051
|
| Claw count | z = | 7,451,735
|
| Cross count | x = | 423,415,319
|
| Square count | q = | 66,886
|
| 4-Tour count | T4 = | 1,024,014
|
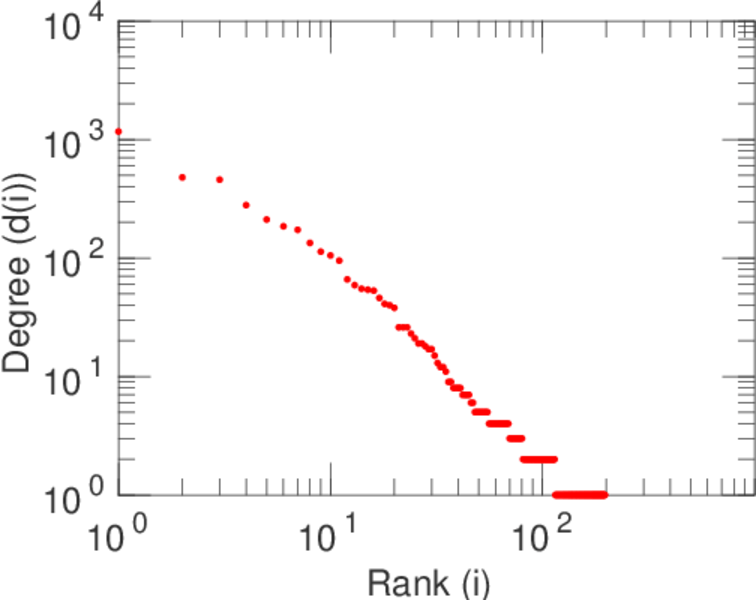
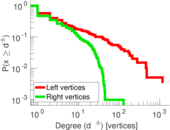
| Maximum degree | dmax = | 1,168
|
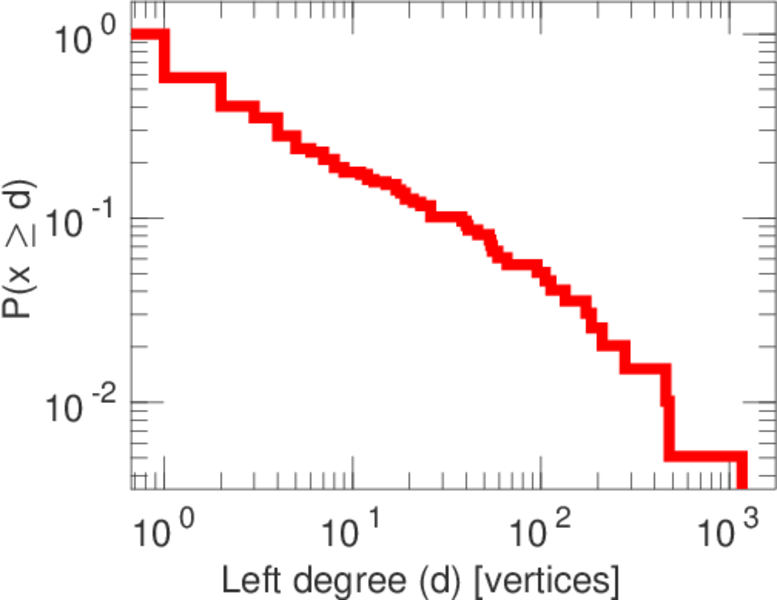
| Maximum left degree | d1max = | 1,168
|
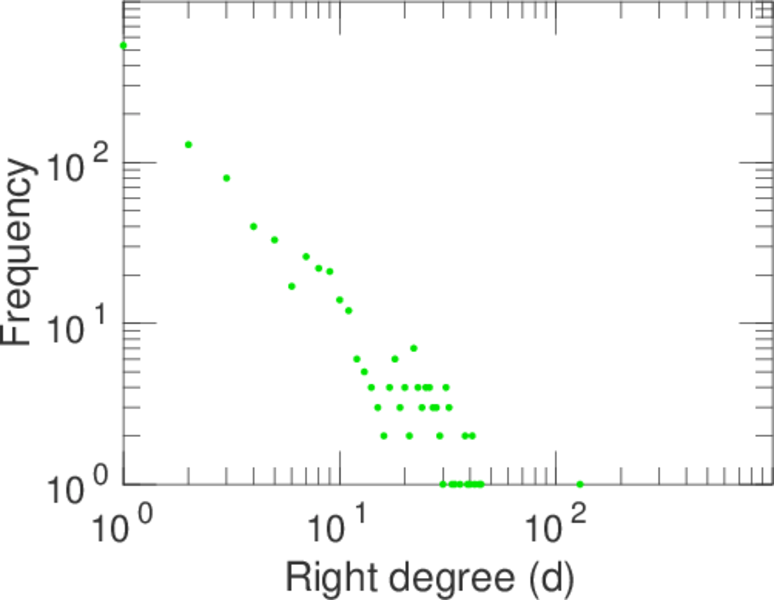
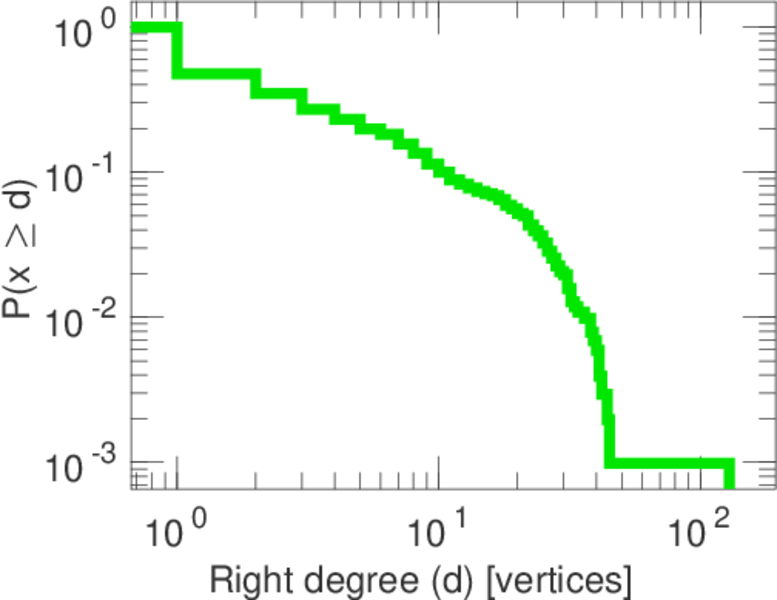
| Maximum right degree | d2max = | 129
|
| Average degree | d = | 6.608 38
|
| Average left degree | d1 = | 22.827 4
|
| Average right degree | d2 = | 3.863 40
|
| Fill | p = | 0.009 293 18
|
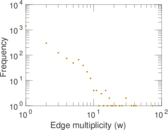
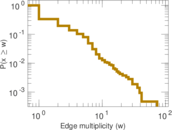
| Average edge multiplicity | m̃ = | 2.110 28
|
| Size of LCC | N = | 967
|
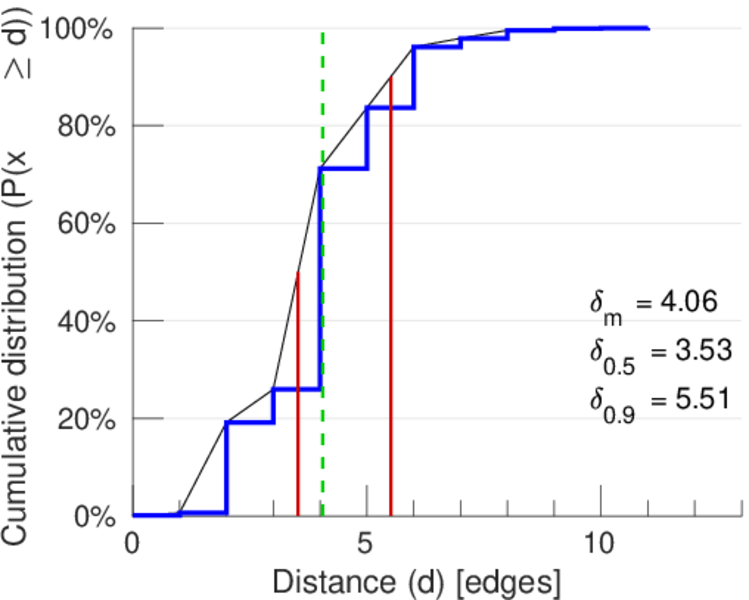
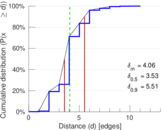
| Diameter | δ = | 12
|
| 50-Percentile effective diameter | δ0.5 = | 3.531 95
|
| 90-Percentile effective diameter | δ0.9 = | 5.509 69
|
| Median distance | δM = | 4
|
| Mean distance | δm = | 4.059 81
|
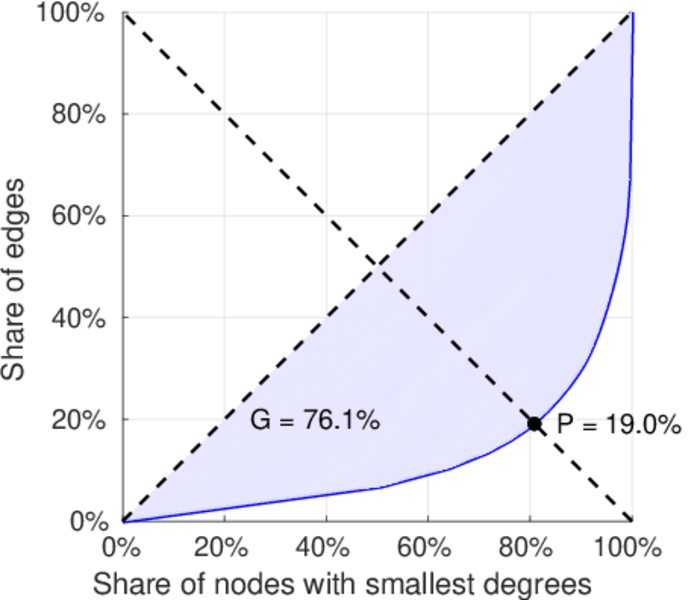
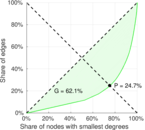
| Gini coefficient | G = | 0.763 130
|
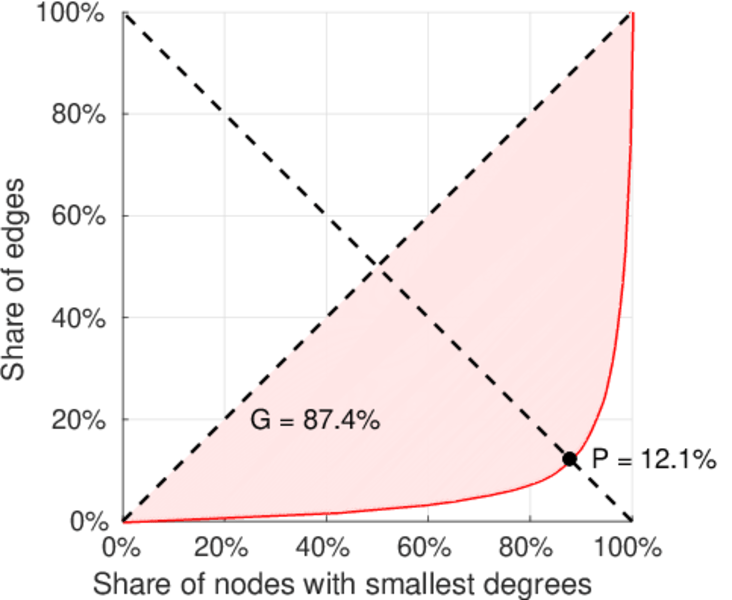
| Balanced inequality ratio | P = | 0.190 794
|
| Left balanced inequality ratio | P1 = | 0.120 970
|
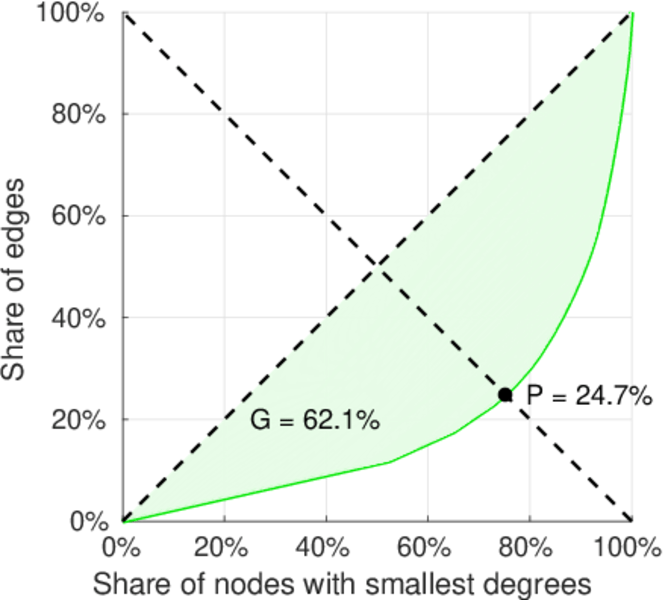
| Right balanced inequality ratio | P2 = | 0.247 054
|
| Relative edge distribution entropy | Her = | 0.819 505
|
| Power law exponent | γ = | 2.871 93
|
| Tail power law exponent | γt = | 2.041 00
|
| Tail power law exponent with p | γ3 = | 2.041 00
|
| p-value | p = | 0.000 00
|
| Left tail power law exponent with p | γ3,1 = | 1.711 00
|
| Left p-value | p1 = | 0.149 000
|
| Right tail power law exponent with p | γ3,2 = | 2.151 00
|
| Right p-value | p2 = | 0.000 00
|
| Degree assortativity | ρ = | −0.044 171 5
|
| Degree assortativity p-value | pρ = | 0.041 462 5
|
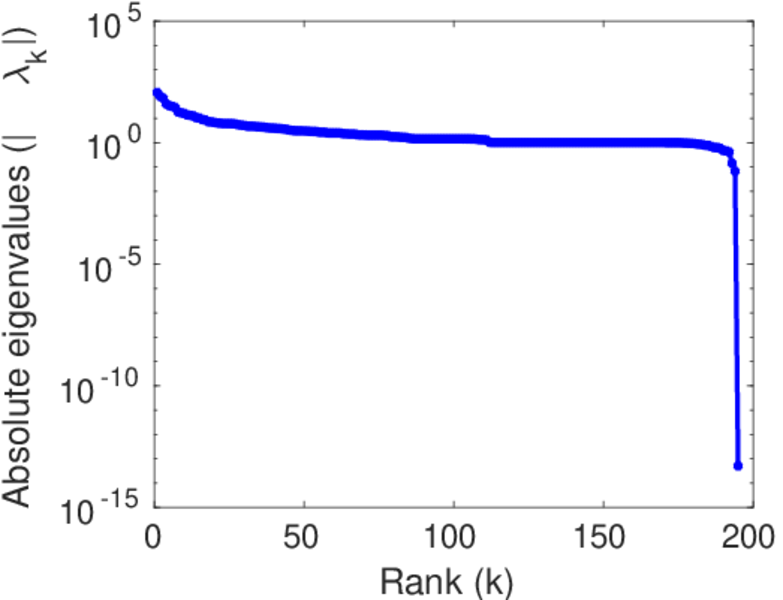
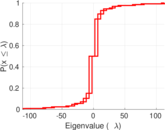
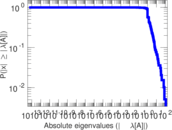
| Spectral norm | α = | 112.778
|
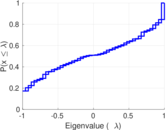
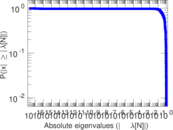
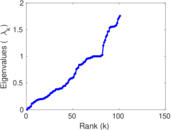
| Algebraic connectivity | a = | 0.031 638 1
|
| Spectral separation | |λ1[A] / λ2[A]| = | 1.416 47
|
| Controllability | C = | 826
|
| Relative controllability | Cr = | 0.680 395
|
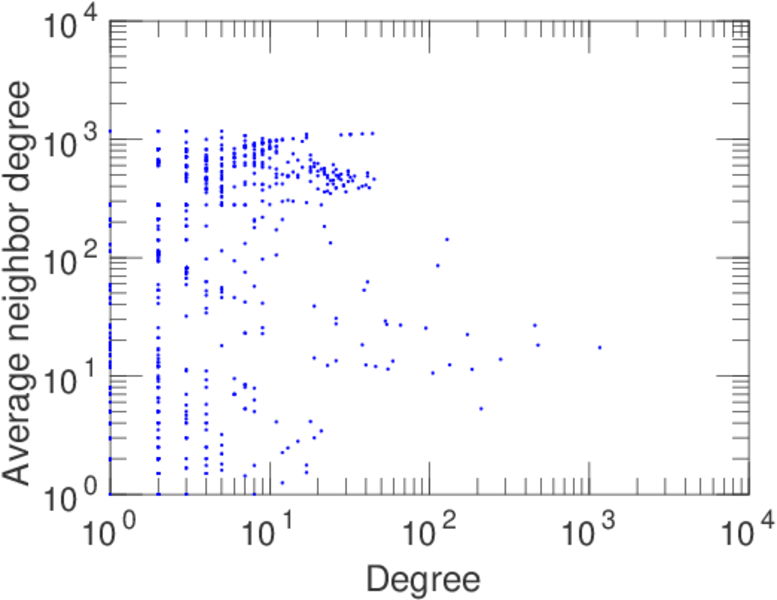
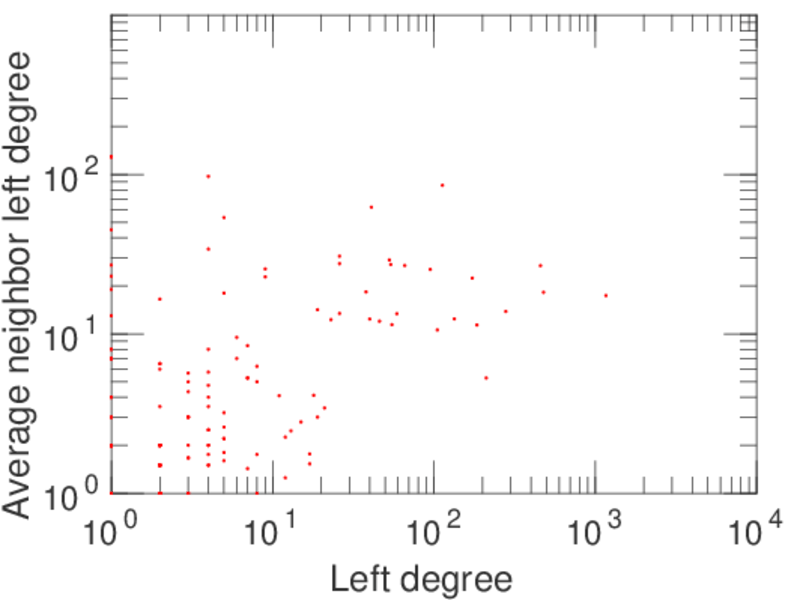
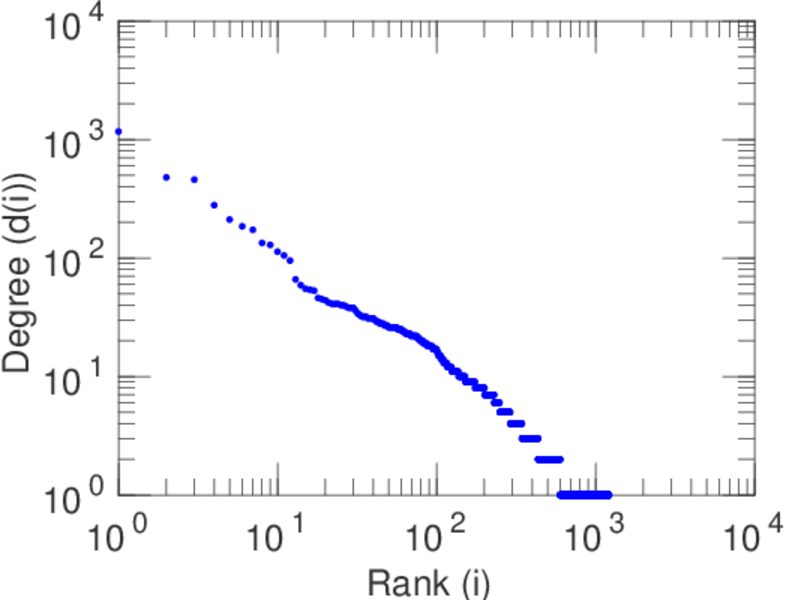
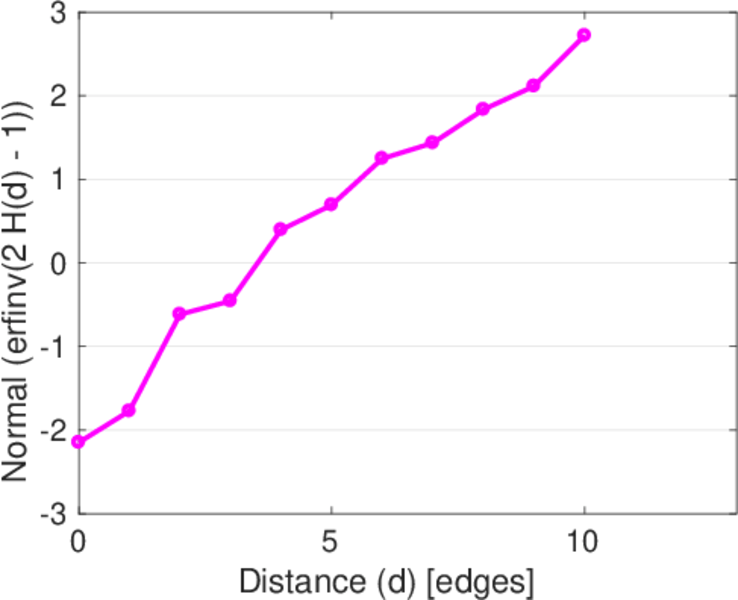
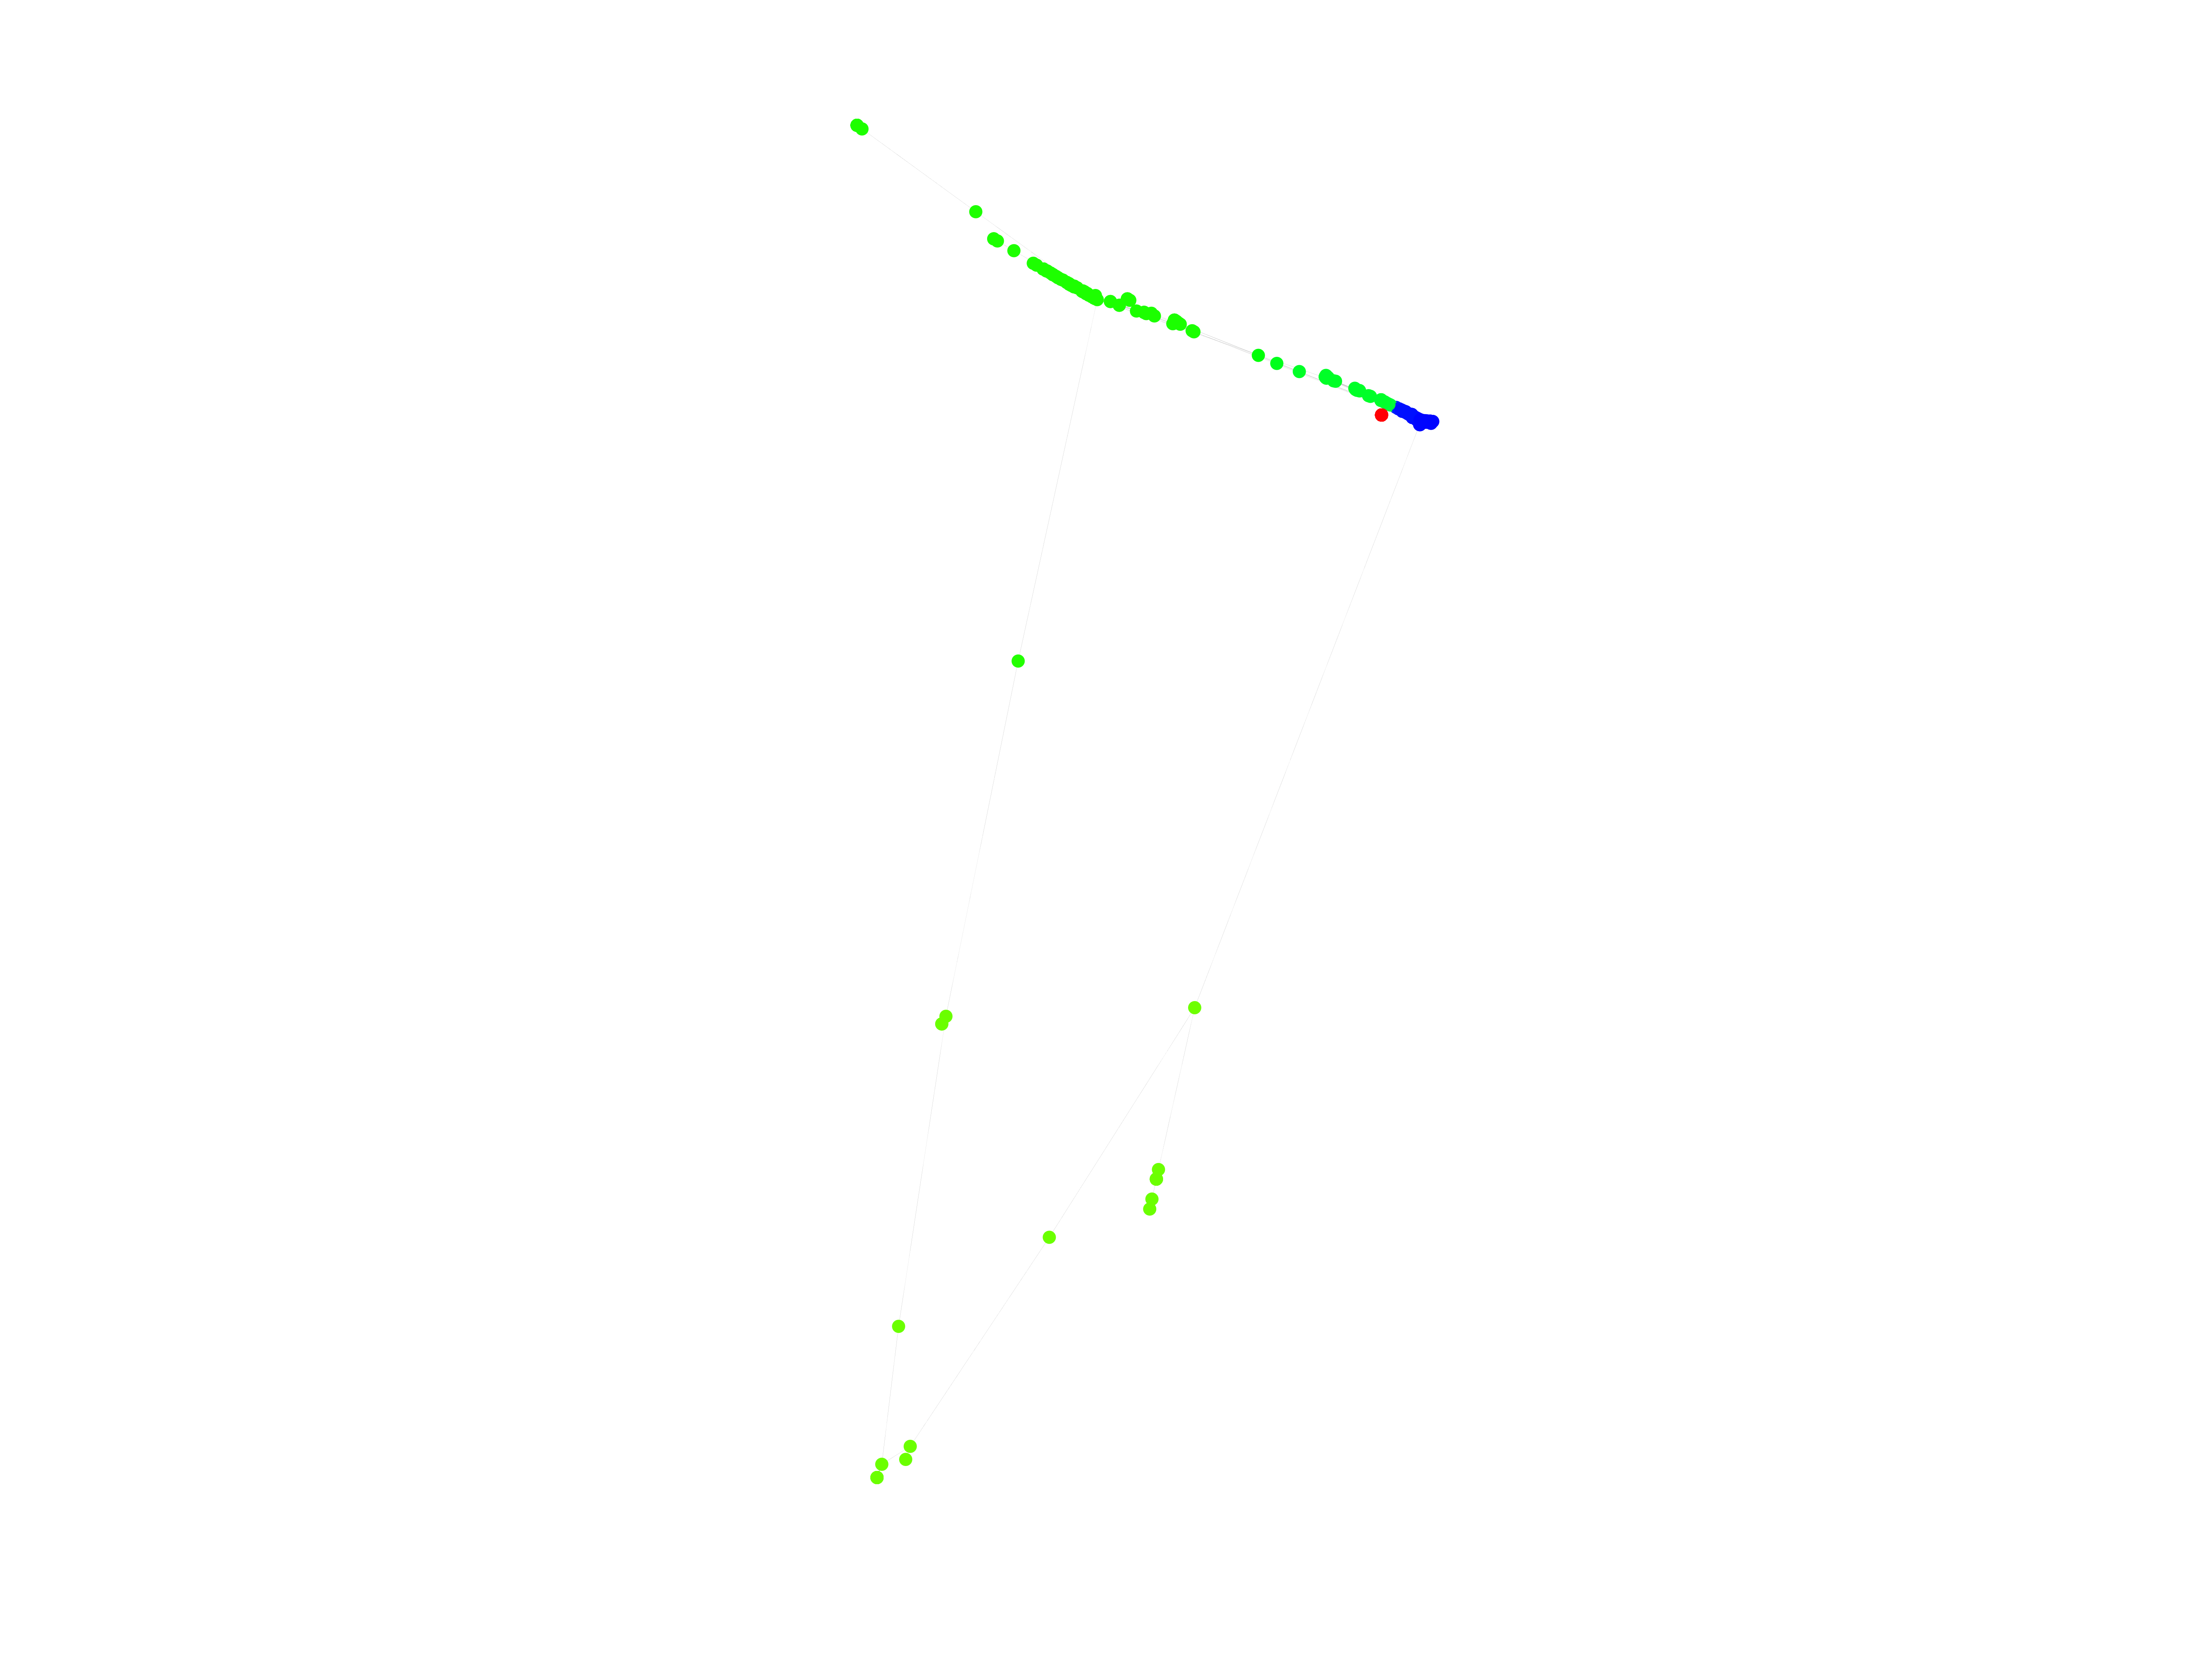
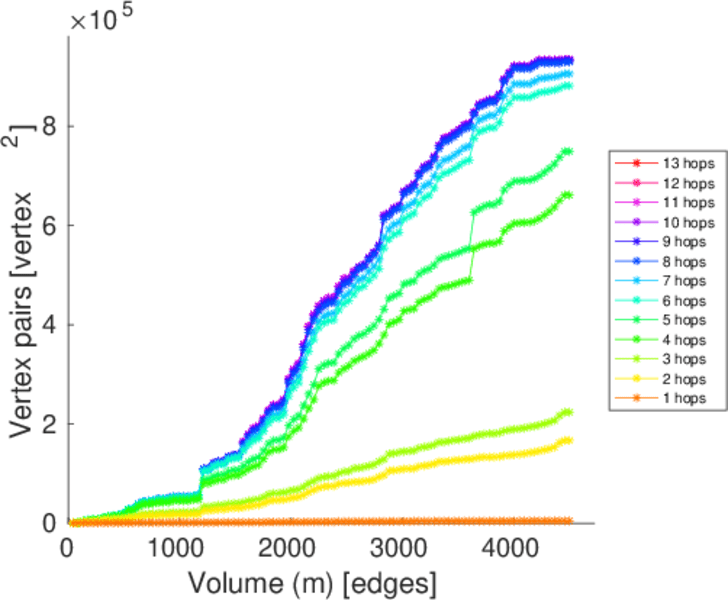
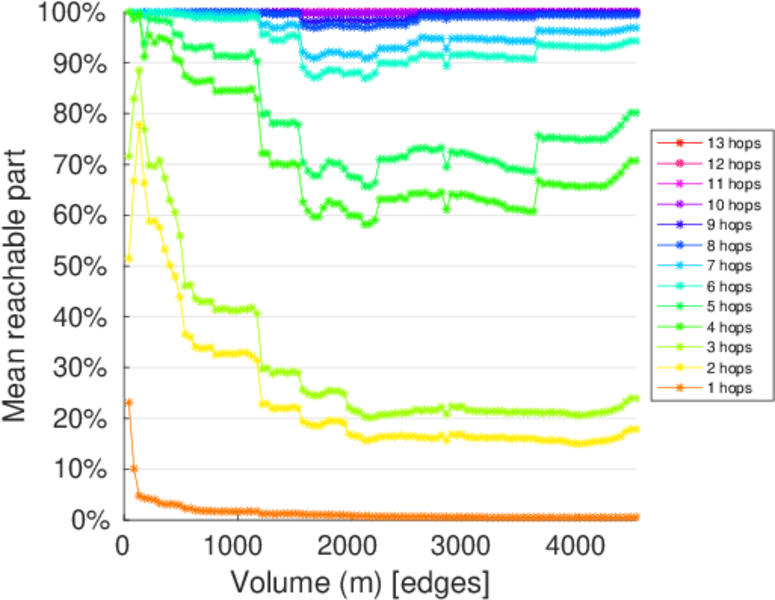
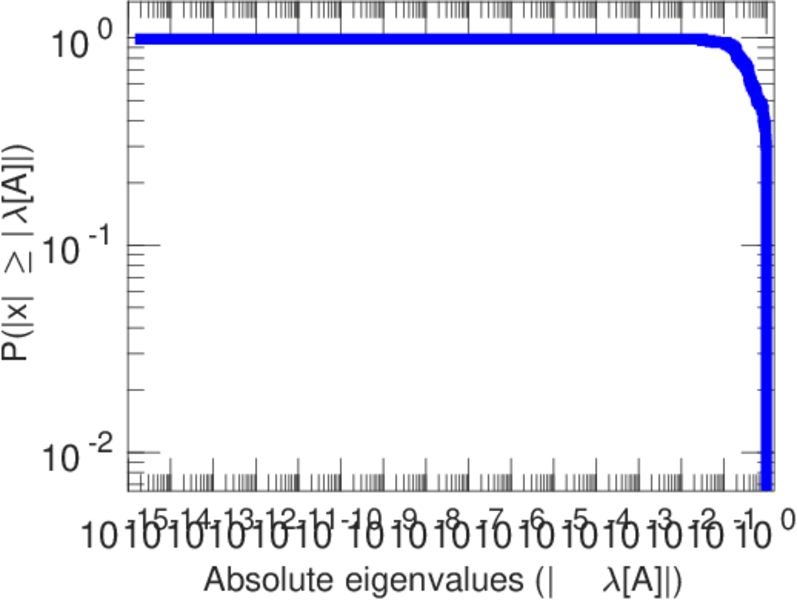
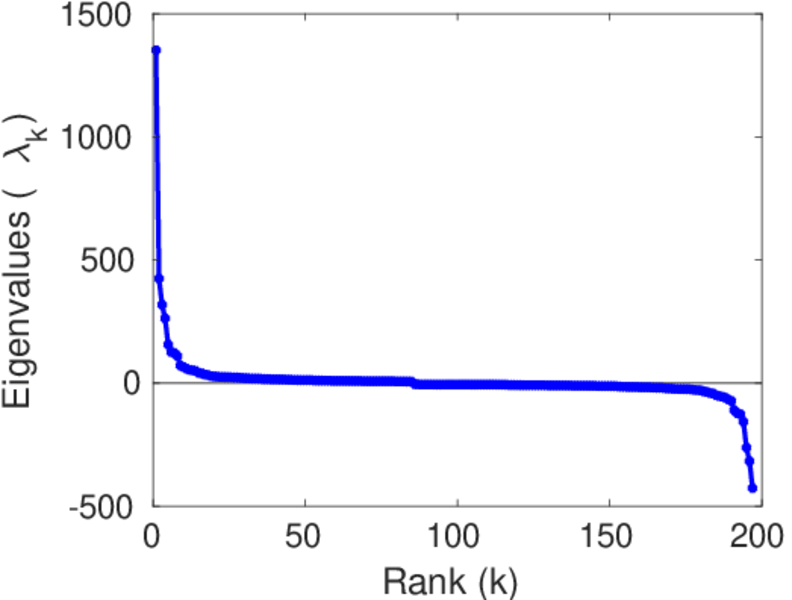
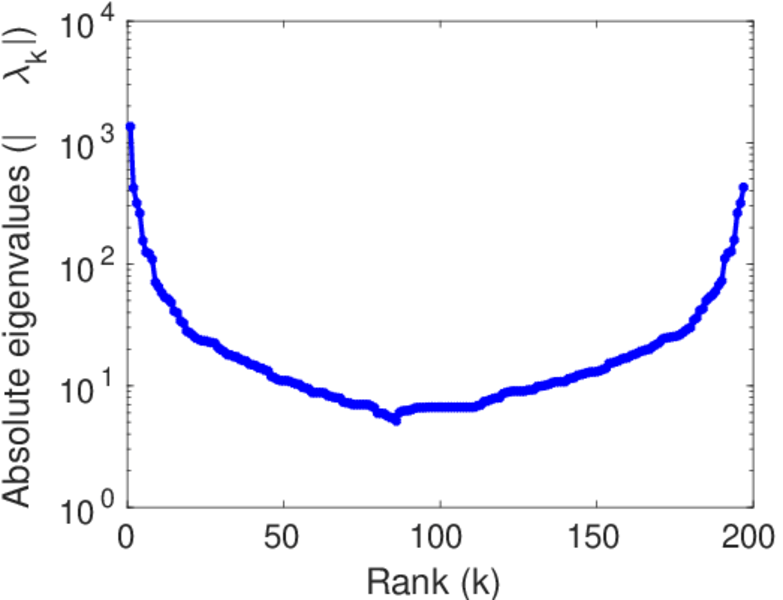
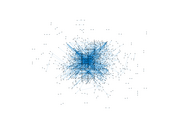
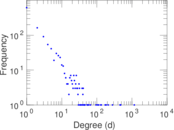
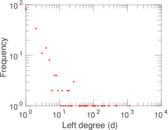
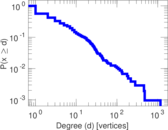
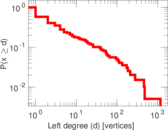
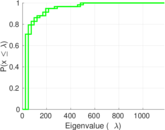
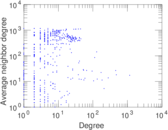
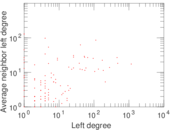
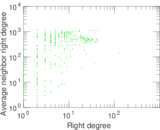
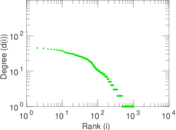
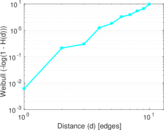
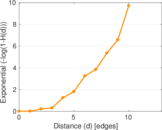
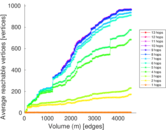
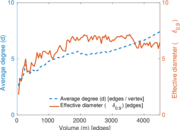
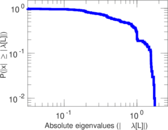
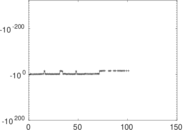
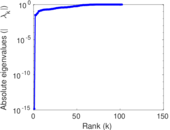
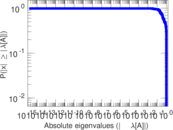
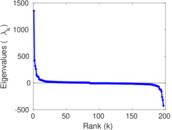
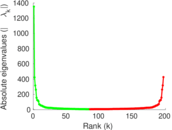
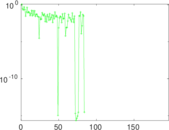
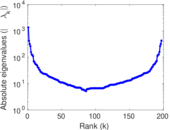
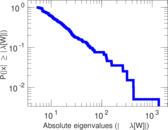
Plots


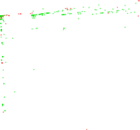
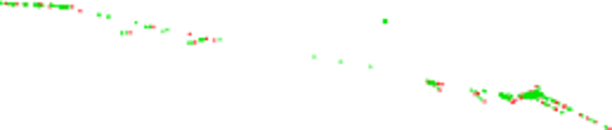
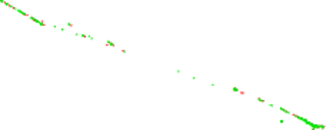


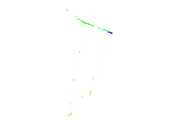

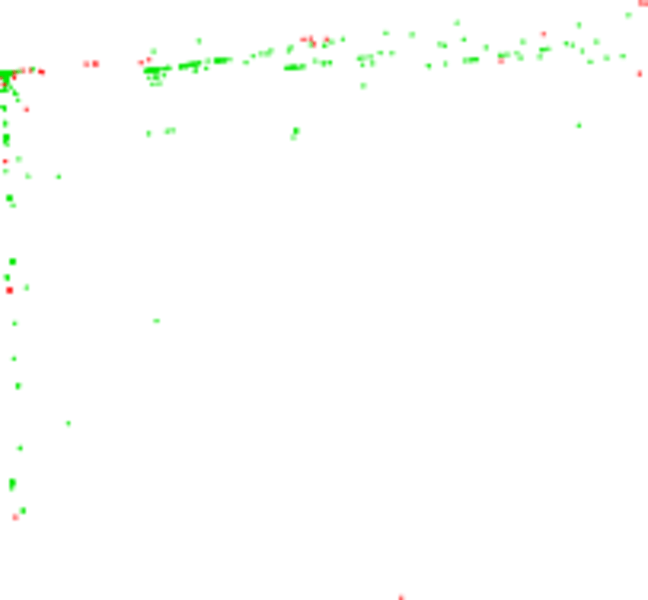
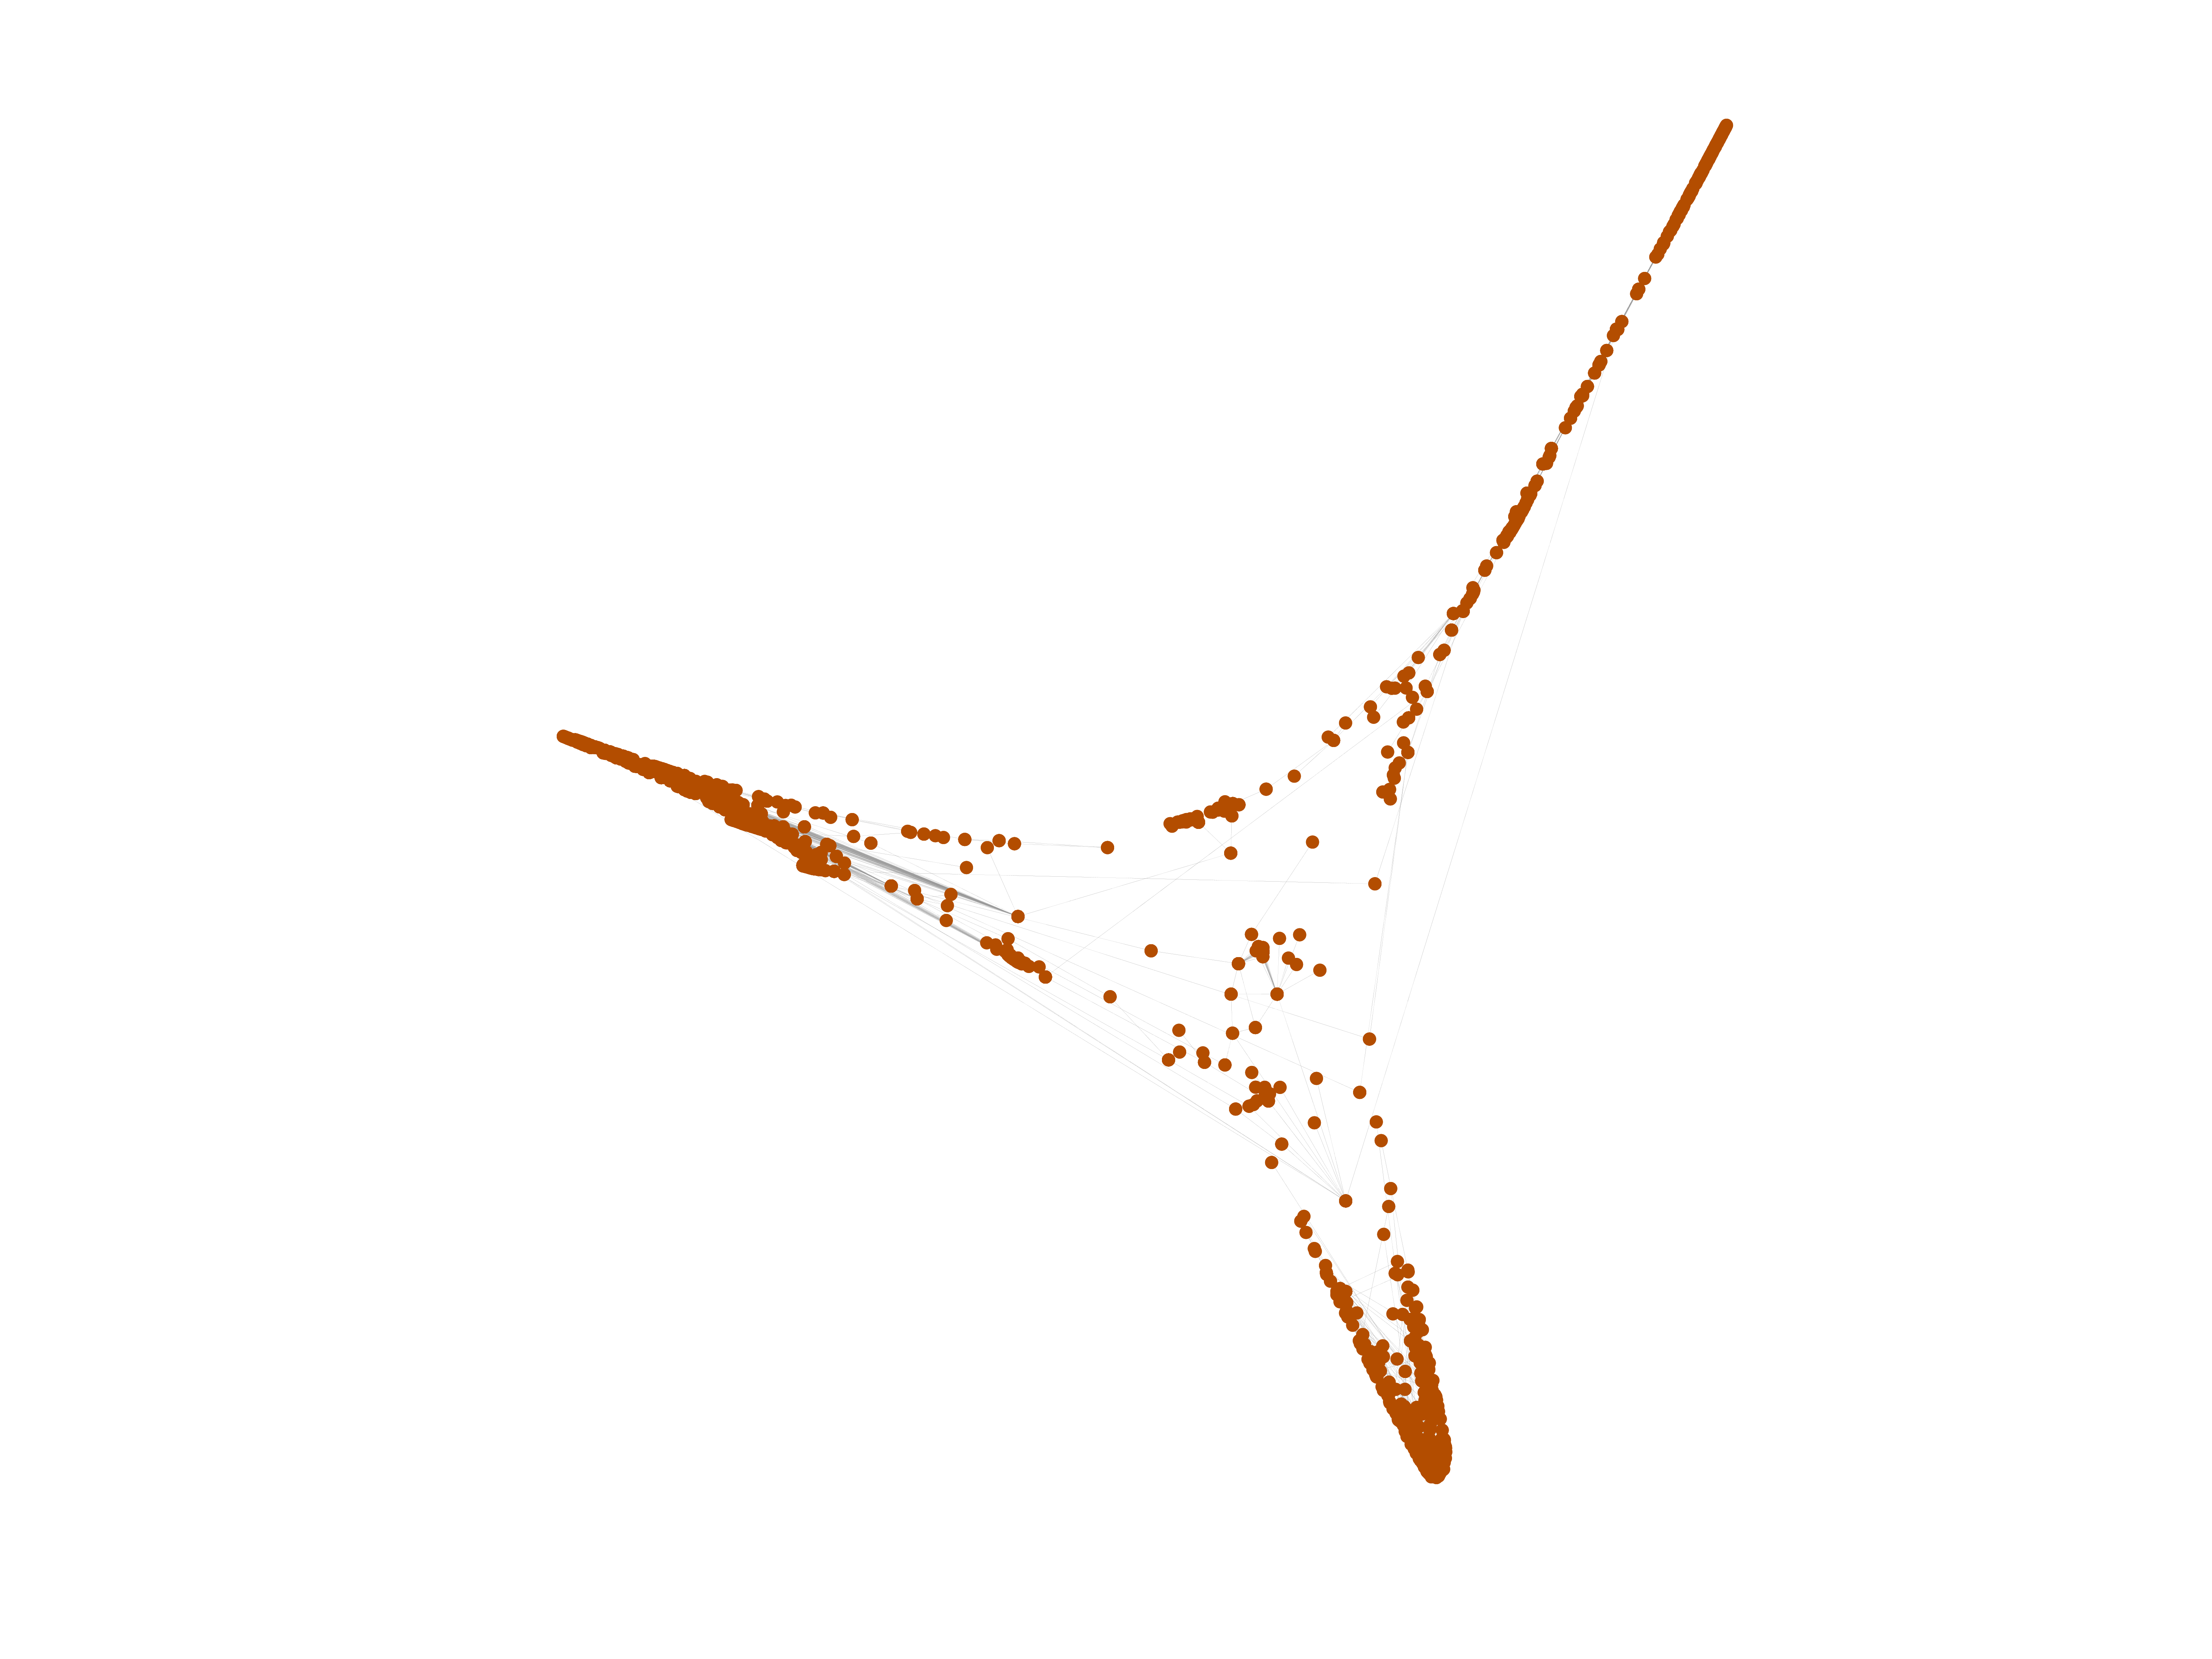
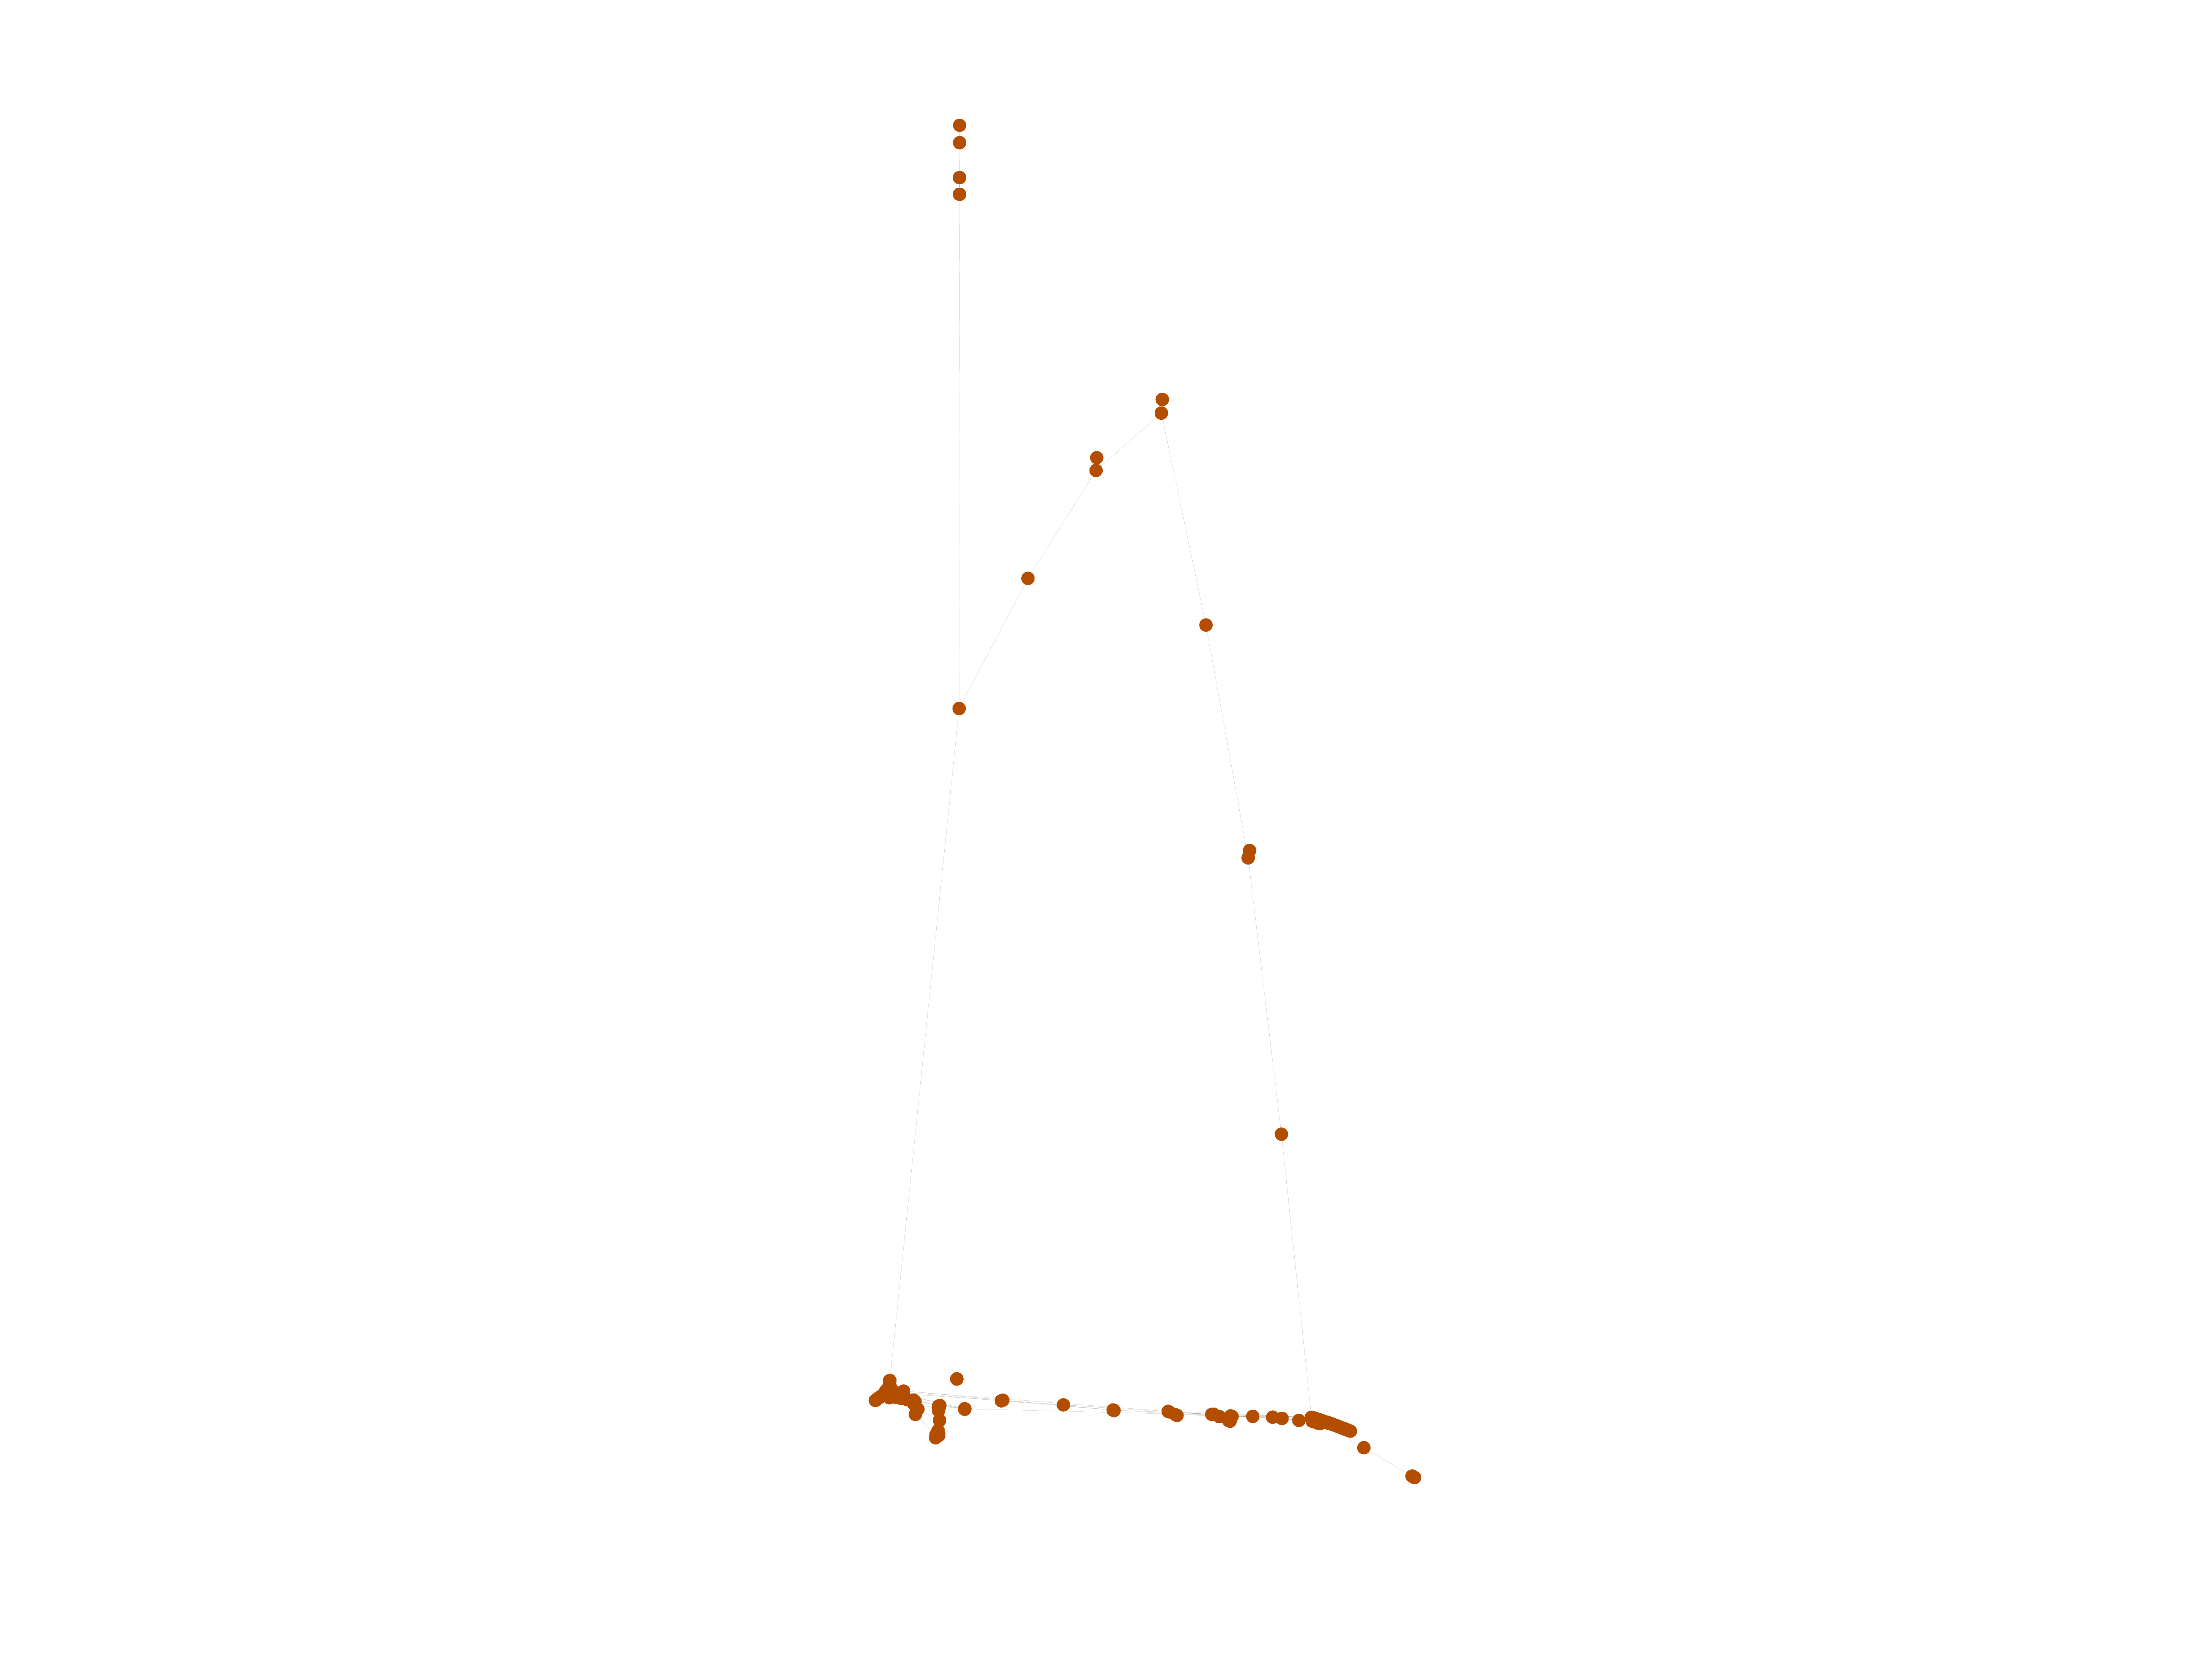
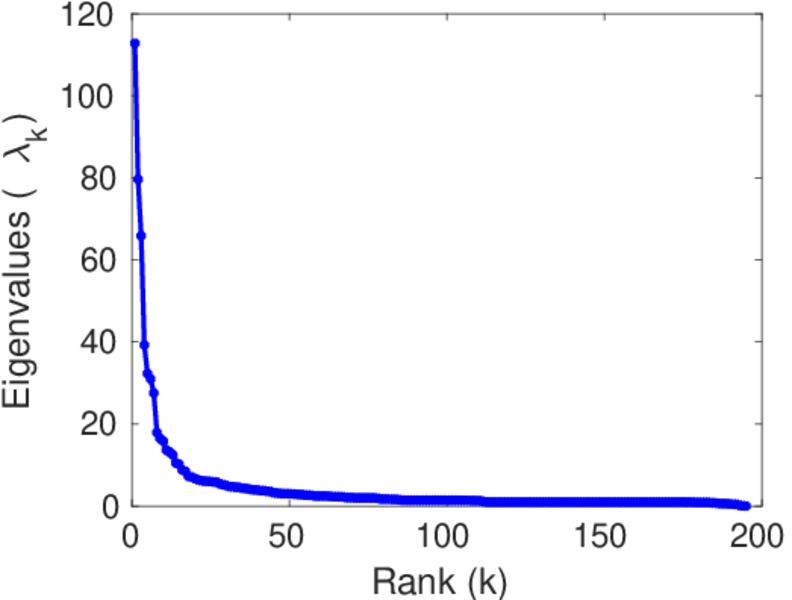
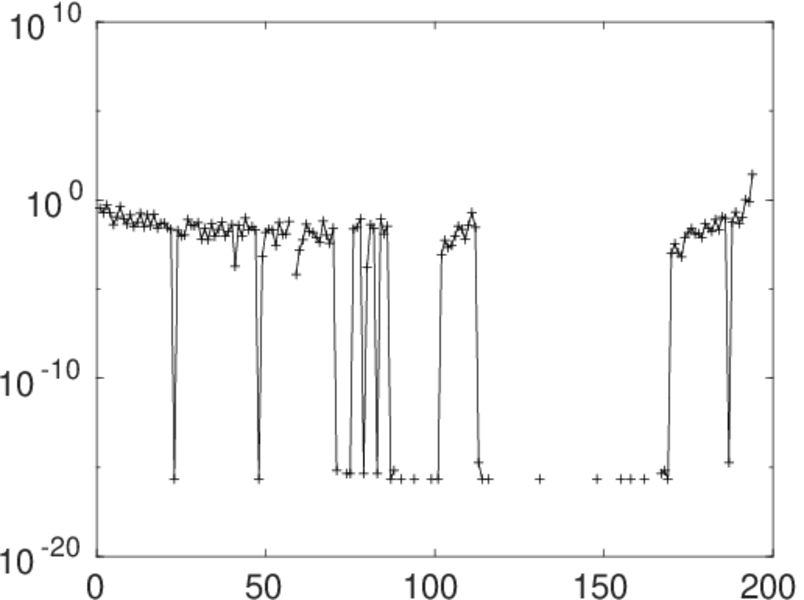
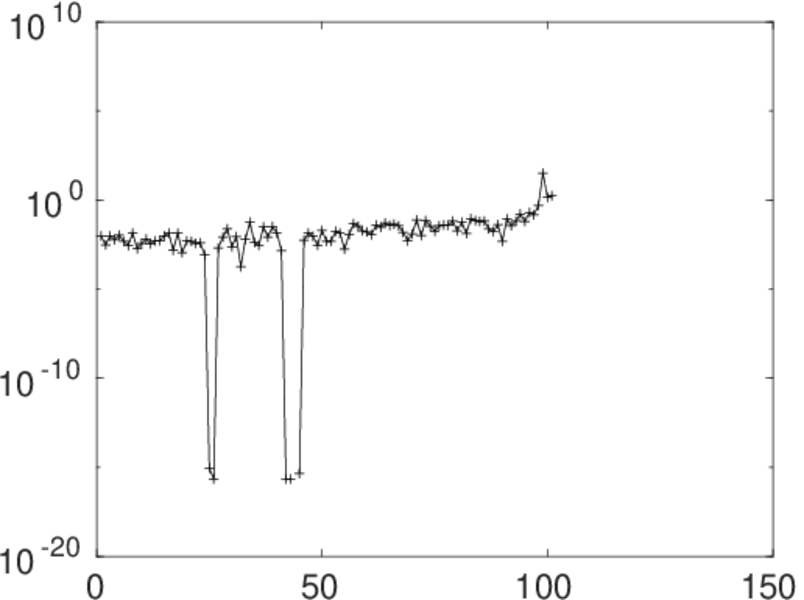
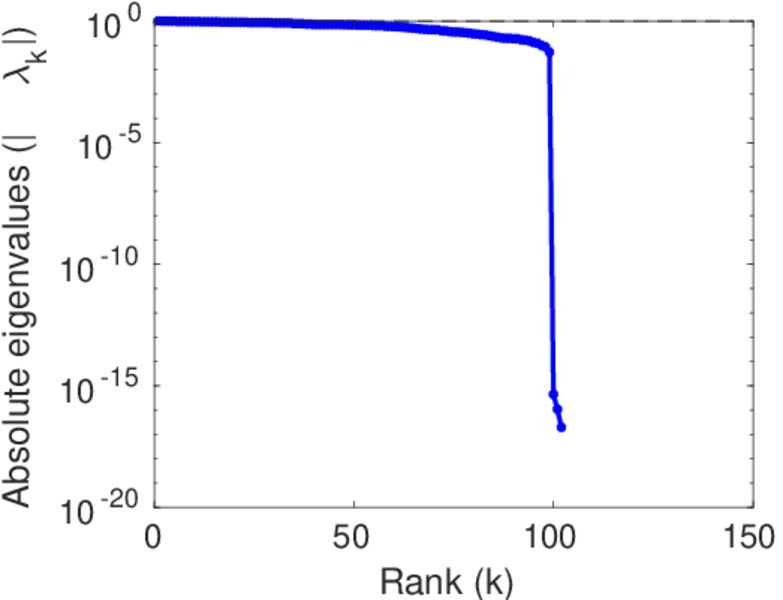
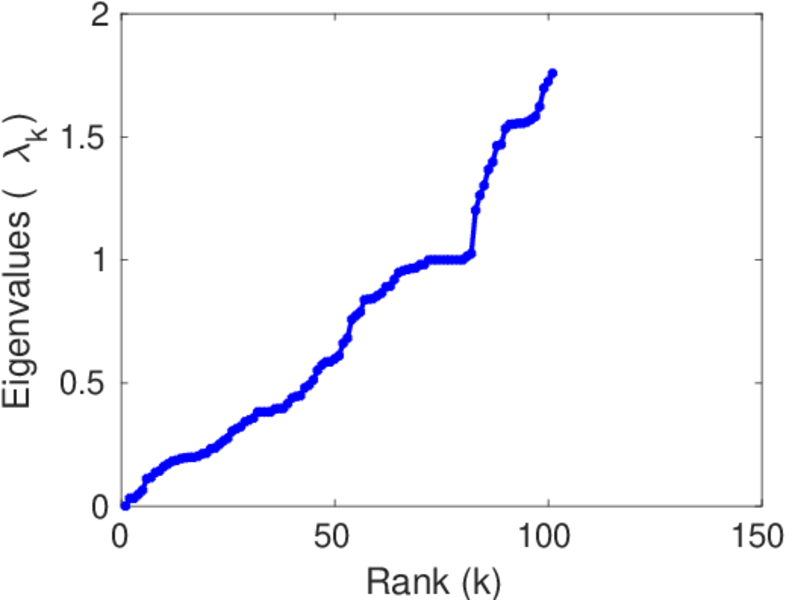
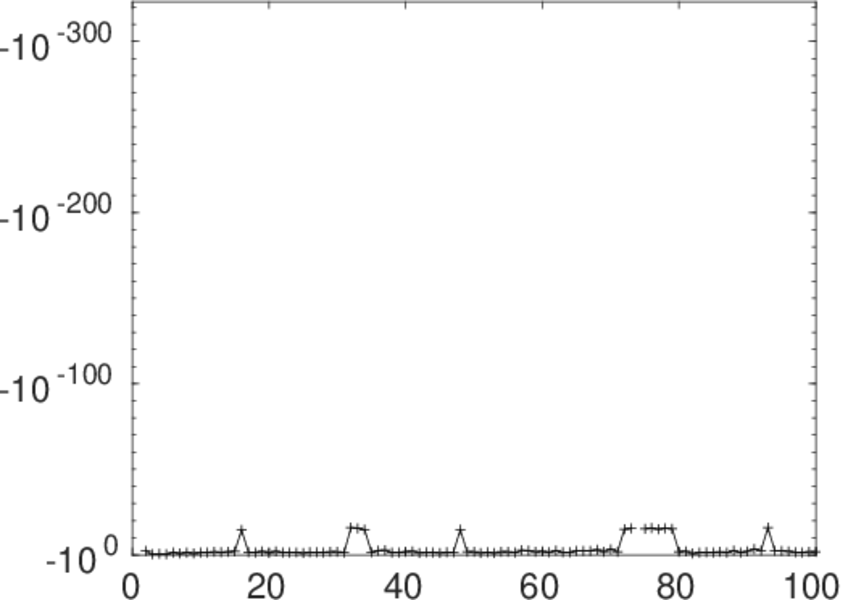
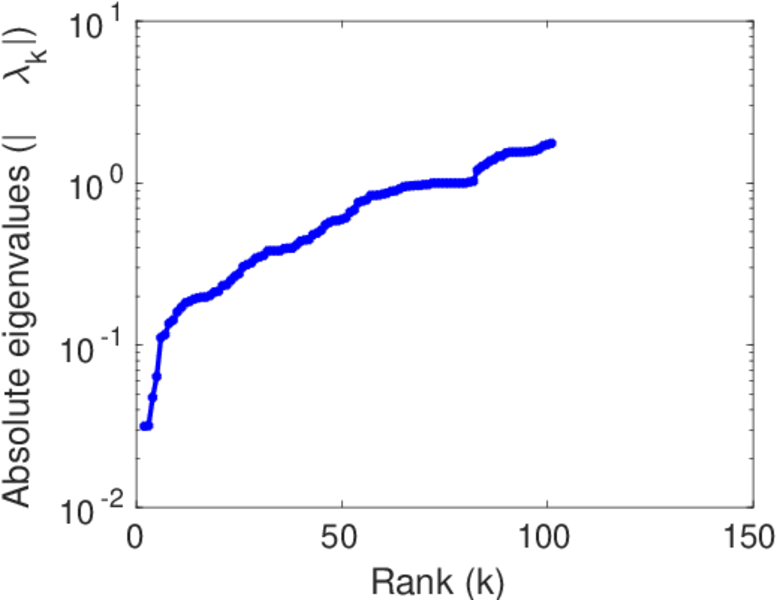
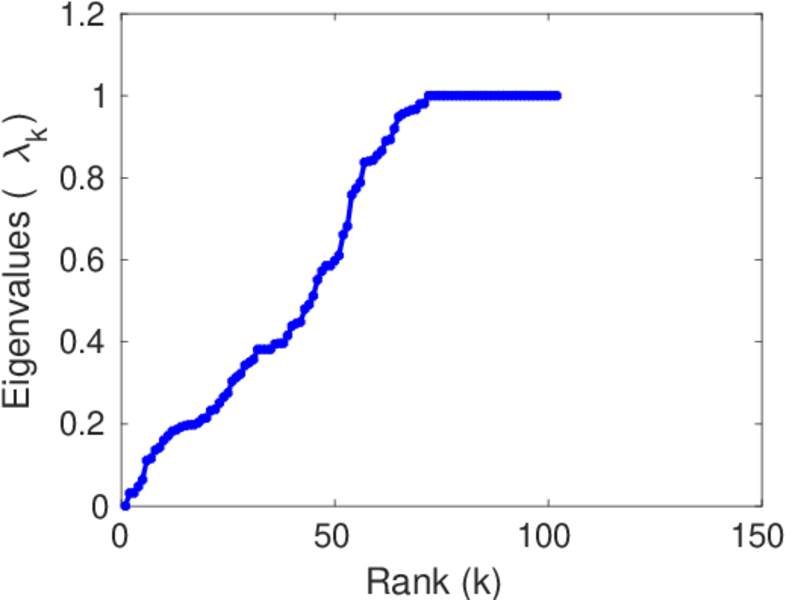
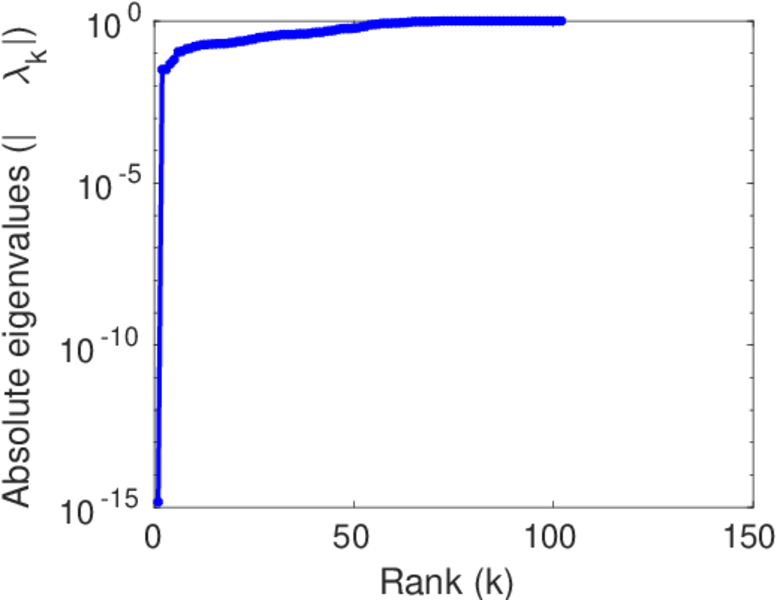
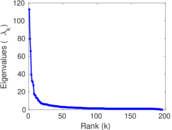
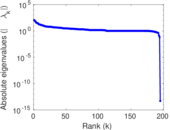
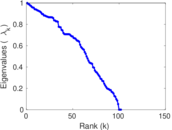
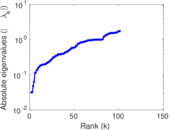
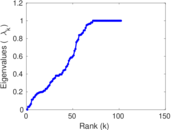
Matrix decompositions plots


Downloads
References
|
[1]
|
Jérôme Kunegis.
KONECT – The Koblenz Network Collection.
In Proc. Int. Conf. on World Wide Web Companion, pages
1343–1350, 2013.
[ http ]
|
|
[2]
|
Wikimedia Foundation.
Wikimedia downloads.
http://dumps.wikimedia.org/, January 2010.
|
 KONECT ‣ Networks ‣
Buy Me a Coffee
KONECT ‣ Networks ‣
Buy Me a Coffee